
CHAPTER 9
Site Statistics
The more traffic you draw to your Joomla site, the more you will want to know about your visitors. Fortunately, a web server can capture a vast array of data that can be examined and analyzed to see who is visiting your site, how long they are staying, the technology they're using to access the Web (browser, OS, etc.), and a tremendous quantity of other information. Perhaps most importantly, through site statistics it is possible to determine the most popular pages, as well as the ones no one ever reads.
There are three primary methods of generating site statistics: a standalone web log analyzer, a Joomla extension, and a web-based statistical package. This chapter will detail the workings of two open source standalone packages (Webalizer and AWStats), a few Joomla extensions, and one web-based package (Google Analytics) that can be used to detect web traffic patterns.
The information needed by a webmaster and the format of the presentation is a personal preference. Package A might supply flashy charts and visualizations that may appeal to some developers, while the column based reporting of Package B may appear superior to others. Therefore, it is important to examine all the available features and determine which appeals most to you.
Note In versions before 1.5, Joomla included a basic site statistics package incorporated into the Administrator interface. The package was removed because the Joomla team decided that there were existing extensions that provided far more functionality. If you see references in articles or online material mentioning Joomla's site statistics, you don't need to waste your time looking for that capability in the current Joomla version—it has been eliminated.
Web Analytics
Studying the pattern of web visitors is known as the field of web analytics. By correlating information such as the page used for entrance into the site (known as a landing page) with user selections, a webmaster can fine-tune a web site to reach targeted site goals (such as traffic levels or online purchase volume). While the primary analysis in analytics is directed at processing web server information, establishing relationships with other information such as e-mail response rates, advertisements, or lead purchases also comes under the umbrella of web analytics.
To obtain the web server information needed to perform analytic examination, there are two main methods of tracking web site traffic: from web server log files and from active collection of visitor information, known as page tagging. Both of these methods have advantages and disadvantages; methods for adopting each for Joomla site analytics are included in this chapter.
Note You can find a number of resources relating to web analytics on the web site of the Web Analytics Association (www.webanalyticsassociation.org). The organization is devoted to measurement and analysis of web data. It even offers distance learning classes for the study of web analytics.
Parsing Web Logs
Web logs are stored as text files on the web server and record information in one of a variety of standardized formats. Almost every web server on the Internet uses one of the two most common formats: Apache Custom Log format and W3C Extended Log File format. A log analysis program can parse the information held in the log and generate a summary report of usage and trends. WebTrends (www.webtrends.com) makes one of the most popular commercial implementations of a log file parser.
Log files hold a great amount of site access data as well as information about the visitor's browser machine, such as browser type, operating system, and browser version. Once the program analyzes the traffic, a log analysis program can generate extensive reports that demonstrate the type of access that has occurred in the past and the trends that will predict traffic in the future.
Web logs also contain information about bots (such as search engine spiders) that access the site. By examining this information, a webmaster can determine how often the page is being spidered and what type of access is being attempted by each bot.
Parsing web logs is very attractive because the web server is already logging web access, so no changes to the web site are required. The system administrator merely needs to mine the current logs to obtain the report information. Further, if the logs exist for previous months (or years), that information can be examined for trending information.
One of the shortcomings of examining log files is the possible under-reporting of page accesses when a remote server caches site pages. Some organizations—particularly those who use proxy servers—implement local caches, so if a page request can be fulfilled from the cache, the page is not drawn from the original web server (which would cause a log entry), but instead read from a cache. To avoid this problem, page tagging was created.
Page Tagging
With page tagging, a small piece of HTML (usually JavaScript) code is added to each web page. When the visitor's browser displays the page, the tagging reference in the page will force the visitor's browser to access a remote server. When this access occurs, the remote server records information about the user. The reference may be an invisible piece of JavaScript code that is executed or an image retrieved for display.
Page tagging is most visibly used when posting content to a third-party site (such as eBay). Many eBay sellers post auction items that include a small bit of code to display a page counter or ticker. Popular free services such as Easy Counter (www.easycounter.com) and Simple Hit Counter (www.simplehitcounter.com) provide counters that can be placed on any web site. When the user's browser displays the page, the image for the ticker is retrieved from the remote server—and at the same time the server hosting the counter retrieves and records information about the requester.
A page tag doesn't necessarily access a remote site. Many of the Joomla extensions that provide site statistics use a small tag in the form of a Joomla module to record user information directly into the MySQL database on the server.
Three of the dominant commercial players in the page tagging analytics area are Google, StatCounter (www.statcounter.com), and Visual Sciences (www.visualsciences.com), formerly known as WebSideStory. While the Google and StatCounter page tagging systems are free, Visual Sciences works with an organization to customize analytics and reporting capabilities based on the needs of the concern.
Page tagging has a number of advantages over log file processing. Since the code executes in the browser window, there are few problems with page caching minimizing the visitor counts. Further, since the JavaScript code executes in the browser window, it can collect additional information (such as screen size) from the user's machine.
Page tagging also has a number of drawbacks when compared with log file analysis. Since bots don't execute code (including JavaScript) when they reference a page, page tagging provides no information about bot access to a web site. Additionally, remote page tagging systems collect their raw data in a proprietary format that is inaccessible to a webmaster (but collected and used by the third party for demographic profiling). If a web site adopts a different tagging provider, the past data cannot be integrated with future information.
Most tagging solutions also require cookies to be activated on the client browser or they cannot effectively track a user session. This is usually not a problem since cookie features are generally enabled on most browsers.
Standalone Log Analysis Packages
Standalone packages can provide one of the most convenient way to perform web log analysis—especially if you have direct file access to the server logs. Most standalone packages allow the user to specify one or more log files to examine and select the statistics to be included in the report output. The output reports are generally stored as a series of HTML files for local or online analysis.
As any experienced webmaster knows, web server log files can become huge and require regular backup and pruning. Standalone analysis packages work very well because they can be used even on archived data stored apart from the web server. By analyzing current as well as archived log files it is possible to see historical usage trends.
In this section, two of the more popular packages (Webalizer and AWStats) will be examined. Both are open source programs and therefore freely available and modifiable. They have also been around for a long time, so they've evolved to include features most needed by webmasters.
Note Web traffic reporting is much more useful if the URLs of your site are formatted in a search engine–friendly (SEF) format. In Chapter 12, there are complete instructions for activating the SEF option on the Joomla system. I would suggest you activate this option as soon as possible to maximize the usefulness of the log information collected by the server.
Webalizer
Created in 1997 by Bradford L. Barrett, Webalizer is one of the oldest and most popular standalone packages. It has international support and is currently available in over two dozen languages. It can process log files no matter their size and the program is available on most platforms (including Windows, Mac OS, and Linux).
Instead of a graphical user interface, it is executed from the command line so that it can be activated with a macro process. The site statistics are output in a series of HTML pages that include tables of information and usage graphs. Webalizer is available for free download at www.mrunix.net/webalizer.
Webalizer can process log files stored in the three most popular formats: CLF (common log format), Apache Custom Log format, and W3C Extended Log File format. By default, Apache uses the Apache Custom Log format and Microsoft IIS uses the W3C Extended Log File format. CLF holds the least amount of traffic information, so a web server should not be configured for this format unless it is needed for a special requirement (e.g., your statistics package only supports this format).
The Webalizer application is run at the command line. The most common method of running an analysis is specifying the log file with a direct path. However, Webalizer can also access a log file via the FTP protocol. That allows the program to process the log files on remote hosts and eliminates the need to transfer the often very large files before analysis can be performed.
On a local drive, Webalizer can be run with an execution statement, like this:
webalizer c:mywebserverlogsaccess.log
This command will generate a master index.html file that gives a general overview of the site usage, as shown in Figure 9-1. The figure shows three graphs that diagram the total usage summary categorized by month and parallel time graphs showing visits and kilobytes transferred. The data tables beneath the graphs show daily average and monthly total usage in terms of file transfers, page accesses, site visits, and kilobytes transferred.
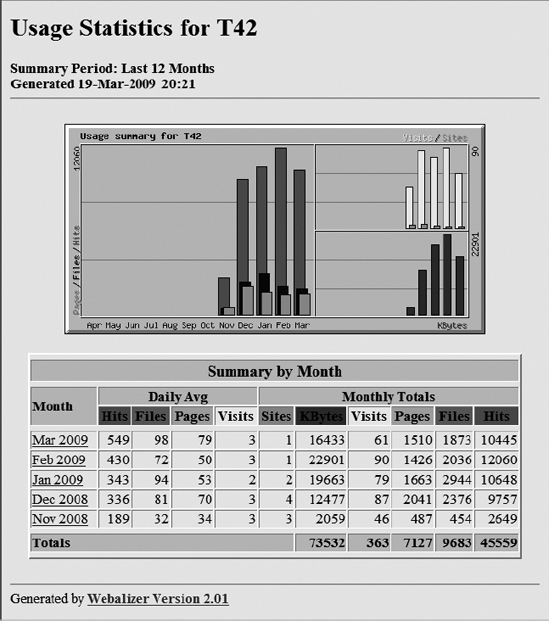
Figure 9-1. The Webalizer central index file displays site overview information.
The Usage Statistics page is only the summary portion of the Webalizer report. With each Webalizer execution, a usage file is constructed for each month found in the log. The usage files contain the following information:
- Monthly statistics: This gives you the total hits, total files, total pages, total visits, total kilobytes, total unique sites, total unique URLs, and so on.
- Hits by response code: These two or three character HTTP codes can indicate important status conditions about the web server execution. For example, a large number of 404 codes (the error code for "file not found") can indicate that the site has one or more broken hyperlinks that are regularly accessed.
- Daily usage graph: This shows the daily site traffic in terms of hits, files, sites, and kilobytes transferred.
- Daily statistics in terms of hits, files, pages, visits, sites, and kilobytes: These are daily statistics broken down by the number of files requested (Hits) from the server, the number of files sent from the server (Files), the number of HTML pages sent from the server (Pages), the number of unique visitors (Visits), the number of unique referring sites (Sites), and the number of kilobytes transferred (KBytes).
- Hourly usage averages graph: This shows the hourly site traffic in terms of hits, files, sites, and kilobytes transferred.
- Hourly statistics: These are broken down by the number of files requested from the server (Hits), the number of files sent from the server (Files), the number of HTML pages sent from the server (Pages), the number of unique visitors (Visits), the number of unique referring sites (Sites), and the number of kilobytes transferred (KBytes).
- Top URLs of total URLs: Perhaps the single most important reported statistic, the top URLs information will help you determine what pages were most requested by visitors.
- Top URLs by kilobytes downloaded: These are the top URLs requested from the site in terms of kilobytes downloaded.
- Top entry and exit pages: These show the most common entry or "landing pages"—where visitors enter the site—and the most common last pages viewed when users leave the site (since there is no formal HTTP session to close).
- Usage graph by country: Shows the countries and kinds of domains (e.g.,
.edu,.gov,.com) that have accessed the site.
These are the only statistics generated when the program is executed without any special options activated. Options are available for a large number of other reports, such as a ranking of all URLs, comparison with a previous month's statistics, and much more. The ReadMe file contains an extensive list of possible settings. You can also get a list by executing the program with the -h argument to show all available command-line options.
Since Webalizer is open source, it has been adapted to a variety of execution forms, so there are several alternatives to the Webalizer executable that use the same core logic. A few of these Webalizer-based programs include the following:
- LogMiner: This is a powerful log analysis package for Apache/IIS (or other web servers using the "combined" or W3C Extended Log File formats). It can extract and present statistics about visits, hits, traffic, navigation paths, browsers, and OSs used by users. Unlike Webalizer, LogMiner generates reporting data into a PostgreSQL database so that many reports can be run quickly from the same data. Unfortunately, PostgreSQL is the only database server supported. LogMiner is available on SourceForge at http://logminer.sourceforge.net.
- Wephpalizer: Known as "The Improved Webalizer," this tool the uses a PHP interface to collate visitor statistics. It has better visualization than Webalizer, has MySQL database support, and can process a log file incrementally. It is available on SourceForge at http://sourceforge.net/projects/wephpalizer.
- AWFFull: This program uses Webalizer as a foundation and adds features such as greater-than-12-month display, implementation of CSS for custom report presentation, resizable graphs, automatic log type detection, and GeoIP support for country detection. It is available free for download from the home page at www.stedee.id.au/awffull.
Note Access logs have different names depending on the platform that is running the web server. On Apache Windows, the log is generally named access.log, while Linux usually has the log files in the /var/log/httpdt directory with the newest log named access_log and older logs named access_log.1, access_log.2, and so on. Also note that secure HTTP access (https://) is recorded in a separate log commonly named ssl_access_log that uses the same log format as the central log.
AWStats
AWStats is a full-featured standalone package written in Perl (Webalizer is written in C++). Since Perl is available on almost every known platform and operating system, AWStats can run almost anywhere. The program can process logs in formats including Apache Custom Log format (NCSA combined/XLF/ELF log format or common/CLF log format), WebStar, W3C Extended Log File format (for Microsoft IIS), and numerous other rarer formats. It can even analyze FTP and mail log files.
The AWStats program has many advanced features, such as recognition of "human" vs. bot visitors; unique visitor statistics; technology usage reports that enumerate visitor access to Flash, QuickTime, RealPlayer, and other site media; and personalized reporting. AWStats is available for free download at http://awstats.sourceforge.net.
As you can see in Figure 9-2, the application has an extensive browser-based interface that uses a statistics frame (the left column) and a display frame (the right column) for the output.
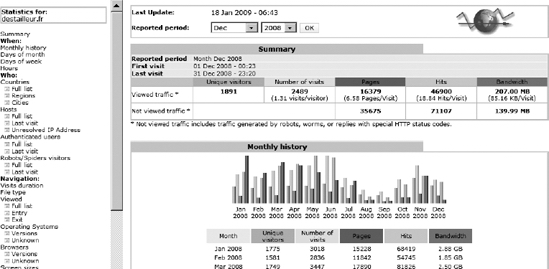
Figure 9-2. AWStats uses a frame-based layout in the browser window for display.
There are a number of plug-ins available for AWStats that provide features such as IPv6 format log processing, GeoIP to determine the geography of the access log entries, and ClusterInfo to process logs on server clusters.
Unlike Webalizer, you will have to download and install Perl onto your destination machine if it isn't already installed on your operating system (Linux often has it preinstalled). This can be an advantage since many remote hosts allow execution of Perl scripts where they do not allow general executables (such as the binary compilation of Webalizer). On the other hand, if your platform doesn't have Perl installed, it is one more development system that you must run.
Tip These packages perform summary analysis on the web log. There are often times when you need to focus on a specific aspect or set of records within a log to track down errors (so you can look at the sequence of requests during a particular user session), monitor actions (if a hacker hits your system, you can see much of what happened), or handle other problems that require examination of a set of log entries. For this reason, I wrote the open source Python application Log Scope (http://code.google.com/p/logscope). With it, you can filter log entries based on IP address, date and time, files requested, text comparison, and more.
Joomla! Extensions
There are a number of extensions that can be installed into Joomla that can provide site statistic analysis. Instead of analyzing the web server log files, these extensions actually execute under the Joomla system and collect statistical information that is particularly relevant to a Joomla administrator. Some of the most popular packages include the following:
- JoomlaStats: This package (see www.joomlastats.org) is the most "user-aware" in that it understands the Joomla user system and allows nearly all statistics to be broken down by user movements. It also records the search keywords that users enter on search engines such as Google to find your site. The package includes a number of modules and an administrative component.
- Entana Statistics: This is a very well-reviewed commercial package (see www.entanacomponents.com) that can track traffic over multiple Joomla sites and coordinate visitor data with the registered Joomla user database.
- JoomlaWatch 1.2.7s: This is an Ajax extension that collects the primary site usage figures (see www.codegravity.com/projects/joomlawatch) and allows the administrator to watch site activity in real time. On the back-end, it provides a broad range of reports, including graphical visitors charted over a time period, unique hits, page loads, and source countries.
The disadvantage of using a package that is installed into Joomla is the performance hit that the system will take gathering the statistics. These packages can put a strain on the web server performance as well as the MySQL database. Most Joomla-centric web providers strongly advise against installing statistic extensions because of these performance drawbacks.
Google Analytics
Google, the web search company, has a fantastic free service for web site tracking. Called Google Analytics, the service provides almost every type of statistical site analysis in a user-friendly graphic display (see Figure 9-3). The reporting page is dynamic, so you can easily change the date range examined or even compare two periods of time for differences or patterns. Since Google Analytics is run on Google's servers, all processing of the logs is handled without any performance loss on your web server. Also, since the reporting environment is web-based, it can be accessed from anywhere.
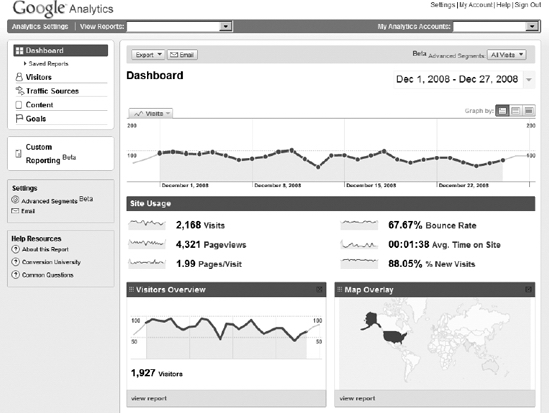
Figure 9-3. Google Analytics displays graphic analysis of site information on the Dashboard display.
The reports include everything from page hits to search engine terms used to find your site. All of this information is generated by including a small script that is under a dozen lines on the bottom of your web page.
Page Tag Code
When you sign up with Google Analytics, you are given a user account from which you can manage as many sites as you like. Each site is provided with specific scripting code that is placed just before the final </body> tag, so even if the Google server is slow to return the JavaScript file, the rest of the page will be rendered for the visitor. The Google code looks something like this:
<script src="http://www.google-analytics.com/urchin.js"
    type="text/javascript">
</script>
<script type="text/javascript">
    uacct = "UA-xxx-xxx";
    urchinTracker();
</script>
This code must appear on every page of the web site. For Joomla users, implementing Google Analytics is extremely easy since all access occurs through the same index.php file of the current template. To add the code to a Joomla template, you can simply open the Template Manager in the Administrator interface, select the desired template, and click the Edit HTML button. The code to the template will be displayed. Scroll down to the closing tag for the document body and paste the custom code that was generated for your web site there. All pages that are rendered using that template will automatically be logged to the Google service.
Note Google Analytics obtains information by executing JavaScript code on the visitor's browser. That means that browsers that don't have JavaScript capabilities (including many cell phone browsers), browsers with JavaScript deactivated, and machines with ad-blocking software (such as Adblock) will be invisible to the Google Analytics engine. It is therefore advisable that you perform a log analysis periodically with one of the standalone tools. Comparing the Google Analytics reports with independent reports will give you a measure of how accurately Google Analytics portrays your site traffic.
Instead of modifying a template, you can download a Joomla module called the Google Analytics Tracking Module. It is available at the Estime (www.estime.fi/en/google-analytics) web site. It will place the Google script code at the proper location without requiring you to modify the site template.
Tip If your Joomla site has a secure portion using SSL, you'll need a special extension, such as the Google Analytics w/ auto SSL module (http://extensions.joomla.org/extensions/2253/details). This can detect whether the URL being accessed by the site visitor is an http or https page and automatically use the appropriate Google Analytics URL.
When the code is placed on your site, you can log back into the service and click the Check Status button. The system will access your site and attempt to confirm that the scripting code is in place. Don't worry if you attempt to check the status and it fails in the first few minutes. There seems to be a caching mechanism so that code placed on the page is not immediately seen by the checking routine. Wait a half hour and try checking again.
Once the Google Analytics service is active on your web site, you need only wait a few days for a baseline of data to be established. The longer you run your web site, the more accurate the reporting will be, and you will be able to look at trends over time and modify the site content to cater to your intended audience.
Google Analytics is especially useful if you have an AdWords marketing campaign. It can help you more precisely target your campaign by analyzing the referring site that brought visitors to the page and the geographic locations of those visitors. For a campaign, you can also set up goals such as sales, lead generation, or page visit targets. Then Google Analytics will track which ads are performing best and help determine the sources of the highest-quality visitors.
Caution Whoever said there is no such thing as a free lunch may have had Google Analytics in mind. While the service comes at no charge to you and is incredibly robust, keep in mind that by using the service, you are providing Google with all of the visitor and usage information for your web site. Most hobbyist web sites will have no problem with giving away this information. However, many e-commerce and virtual community sites would like to keep this important data private. If you are implementing a Joomla site for an organization or another individual, make sure they are aware of these privacy aspects of using the service and get their approval before you include it on their site.
Google Analytics Reports
In the Google Analytics interface, the summary display is know as a dashboard. There are a great number of more specific reports, and they are divided into four broad categories: visitors, traffic sources, content, and goals. Each set of reports provides statistical information in a way that will be most useful for that particular area. The data of the site is formatted so you can look at it from different perspectives.
Each report area presents its own table or graphical display of the statistical data. For example, the Defined Funnel Navigation (see Figure 9-4) shows the entrance points for various pages that are part of a target "goal" set up within the Google Analytics system. This report will help you track the success of the definite site goals.
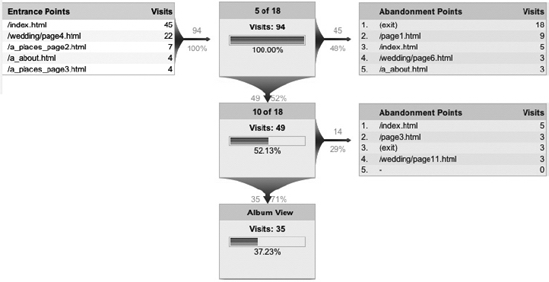
Figure 9-4. The entrance points relate to the site goals that you have defined in Google Analytics.
There are many, many reports available through the Google Analytics service. These reports can be selected from the hierarchical listing panel on the left side of the screen. Under the four primary categories, there are the following reports:
- Visitor Reports: Map Overlay, New vs. Returning, Languages, Visitor Trending, Visits, Absolute Unique Visitors, Pageviews, Average Pageviews, Time On Site, Bounce Rate, Visitor Loyalty, Loyalty, Recency, Length of Visit, Depth of Visit, Browser Capabilities, Browsers, Operating Systems, Browsers and OS, Screen Colors, Screen Resolutions, Flash Versions, Java Support, Network Properties, Network Location, Hostnames, Connection Speeds, and User Defined
- Traffic Sources: Overview, Direct Traffic, Referring Sites, Search Engines, All Traffic Sources, Keywords, AdWords, AdWords Campaigns, Keyword Positions, Campaigns, and Ad Versions
- Content: Overview, Top Content, Content by Title, Content Drilldown, Top Landing Pages, Top Exit Pages, and Site Overlay.
- Goal: Overview, Total Conversions, Conversion Rate, Abandoned Funnels, and Goal Value
All reports and even dashboard information can be downloaded onto a desktop machine in a variety of formats. The four primary formats are tab-separated text file, XML, PDF, and Excel comma-separated values (or CSV). There is also a Print button that reformats the reports for best printing output (it removes the user interface and extraneous information).
Conclusion
A webmaster can't really know who is visiting a web site without hard data. Sites are often created based on interest in a particular topic; therefore most webmasters feel they can predict which content will be popular. Often enough, an unexpected article will catch the public's attention or gain a link reference from a highly ranked web site that will make it the most popular piece on the site. Only by examining the actual traffic of the site can such activity be ascertained.
There are many more web statistics packages than the ones described in this chapter. Hopefully this overview has provided a foundation by which you can examine the numerous available applications. I would suggest that you try more than one, and by comparing them with each other, you will be able to determine the one that best suits your needs.