
7
Automatic Single-Cell Transfer Module
Huseyin Uvet
Yildiz Technical University Istanbul, Turkey
Akiyuki Hasegawa
Tokyo Women's Medical University Tokyo, Japan
Kenichi Ohara, Tomohito Takubo, Yasushi Mae, and Tatsuo Arai
Osaka University Osaka, Japan
CONTENTS
7.2.1 Cell Types and Preparation
7.2.2 Penicillin-Streptomycin and Bottom Surface Treatment
7.2.4 Manufacture of the Microfluidic Chip
7.2.7 Cell Detection/Tracking and Control
Abstract
Conventional hybrid microfluidic systems have many functions such as separation, sorting, and filtering of biological particles. These hybrid systems are required for delivering particles into microfluidic chips and for their dexterous on-chip manipulation Successful realization of these functionalities requires visual sensing of particles However, only a limited number of studies are available on on-chip visual sensing techniques as well as on retrieval of living cells into microfluidic devices and their manipulation thereafter. Automated continuous individual cell transfer is a critical step in single-cell applications using microfluidic devices. Cells must be aspirated gently from a buffer before transferring to an operation zone to avoid artificially perturbing their biostructures. Vision-based manipulation is a key sensing technique that allows nondestructive cell detection In this chapter, we present a design for an automated single-cell transfer module that can be integrated with complex microfluidic applications that examine or process one cell at a time such as the current nuclear transplantation method The aim of the system is to automatically transfer mammalian fibroblasts (~15 urn) or oocytes (~100 urn) one by one from a container to a polydimethylsiloxane (PDMS) microchannel and then transport them to other modules The system consists of two main parts: a single-cell suction module and a disposable PDMS-based microfluidic chip controlled by external pumps. The desired number of vacuumed cells can be directed into the microfluidic chip and stored in a docking area From the batch, they can be moved to the next module by activating pneumatic pressure valves located on two sides of the chip The entire mechanism is combined with monitoring systems that perform the detection/tracking and control program
7.1 Introduction
Microfluidic technology and its applications are extensive and have many significant advantages, bringing the benefits of miniaturization, integration, and automation to biotechnology-related studies over the past several decades (Jager, Inganäs, and Lundström 2000; Vilkner, Janasek, and Manz 2004). Microfluidic-based technology offers a convenient platform for cellular analyses of biological systems, because the small scale of microchannels and devices allows producing scalable system architectures (Unger et al. 2000; Walker, Zeringu, and Beebe 2004). Their inexpensive composition makes them a potential candidate for large-scale production. Microfluidic technology covers not only the material phenomena but also the technology for manipulating and controlling the components as microsize particles in microsize artificial capillaries. Therefore, the integration of these technologies with microrobotic applications could be useful in the automation of cell manipulation for important areas such as single-cell analysis, manipulation, and treatment, including nuclear transplantation (Cui et al 2001; Lee et al 2003; Ramesham and Ghaffarian 2000; Schwarz and Hauser 2001).
Integration of cell treatment steps is crucial to developing microfluidic devices for analysis of cell constituents, cell lysis, and cell culture (Elfwing et al 2004; Schonholzer et al 2002) For example, experimental results show that microfluidic technology provides a significant advantage in the production of mammalian embryos In addition to these vital concepts, cell fusion and nuclear transplantation (Skelley, Kirak, and Suh 2009; Yia et al. 2006) are important topics. Our project "Automated Nuclear Transplantation Using Micro Robotics" is a novel approach to finding a solution to overcome difficulties in the nuclear transplantation process. In this project, several cell manipulation tasks such as positioning, cutting, sorting, filtering, and fusion are performed by different interconnected modules using a so-called desktop bioplant (Arai et al 2007) This desktop bioplant, which includes microchannels and microwells on a chip with appropriate sensors and actuators, is increasingly in demand for nuclear transplantation operations in biotechnology
Microfluidic methodologies, however, have suffered from limited means to manipulate fluids and cells. In conventional methods, the single-cell trans-fer and control from a container to a polydimethylsiloxane (PDMS) micro-fluidic chip is carried out by the aid of a micropipette suction and manual on-chip stream manipulation by a pump Biological cells must be picked up from the container one by one under the view of a microscope and supplied to the microfluidic chip, where single-cell operations are performed. For each single cell, an operator should repeat the same method until the desired number of cells is collected Although this process is relatively easy for large cells (i.e., oocyte ~100 um), it is infeasible for small cells (i.e., fibroblast ~15 um). A skilled operator is required for such time-consuming applications Moreover, if the pump speed does not synchronize with the manual cell supply process, bubble formation can be observed in the flow stream, which is harmful to living cells Once the desired number of cells is delivered into the microchannel, they need to be brought into the operation area one by one In addition, the distance between consecutive cells cannot be maintained in the microchannel by manual methods The principle behind our proposed solution is to accomplish all of these functions (cell suction, transportation, on-chip position control, observation, and cell supply) automatically with one integrated system For example, in the case of the cell fusion step of mammalian cloning, a microfluidic chip requires simultaneous control of the cells involved In this process, two cells (a donor cell and an oocyte) are brought into very close contact and aligned via alternating current (AC), after which a direct current (DC) is applied for a brief period to complete the fusion (MacDonald, Spalding, and Dholakia 2003; Walker, Zeringu, and Beebe 2004) Precise cell supply and transportation are essential when performing such an operation. This has significant advantages for some microfluidic cell applications such as on-chip micro-injection (Andrea and Klavs 2008), on-chip single-cell polymerase chain reaction (PCR; Toriello et al. 2008), and cell encapsulation with microfluidic droplets (He, Edgar, and Jeffries 2005) Moreover, due to the importance of the information gathered by individual cells, several analytical techniques for chemical analysis of single cells have been proposed by different groups These techniques include capillary electrophoresis (Huang et al 2008; Wu, Wheeler, and Zare 2004) and fluorescent microscopy (Cookson et al. 2005), which are other popular microfluidic methods that require manipulation of living cells one at a time. To the best of our knowledge, there exists no successfully implemented nondestructive automated single-cell loading and supply system
Our motivation in this study is to support on-chip cloning technology Gentle cell handling and supply into a microfluidic chip one by one is the first part of a successful application, because any damage to the cells could cause experimental failure The cells must be aspirated precisely from a container, which requires micromanipulation and accurate positioning while approaching the target cell with a glass micropipette (suction tip) attached to a micromanipulator Secondly, the desired number of cells is stored in a dock The snake-shaped PDMS docking zone is designed for this purpose Once cells are sorted, they are transferred to the next module or operation zone To do this, a "Y" character microchannel is combined with the docking side and the pneumatic pressure valves are formed at the intersection of the two When the external pump infuses air into the valves, the membrane between the layers deflects, closing the fluidic flow. Finally, synchronization of the valves and the suction tip are handled via monitoring systems, which provide full automation and system integration Because the intersection of PDMS chip is monitored by a compact vision system, the suction tip is monitored by a microscopic system Instead of using two microscopic units, which requires a long tube connection between the suction tip and the microfluidic chip, we designed the compact vision system as a nondestructive sensing method in order to enable high-throughput single-cell transfer
This chapter is divided into three main sections according to the different parts and functions of the systems: (1) materials and methods, (2) experimental results, and (3) discussion and conclusion. In the first section, the materials used to fabricate the microfluidic chip and methods for preparing cells as well as a new design of a compact vision structure are briefly described. Secondly, an automated cell detection/tracking and controlling algorithm is presented along with its applications in microfluidic chips, micromanipulators, and pumps. In the final section, experimental results indicating the efficiency and usability of the total mechanism are described.
7.2 Materials and Methods
The proposed system is able to singly pick cells from a container and transport them to a microfluidic chip. The structure allows manipulating cells in microfluidic channels and docking them in desired locations in controllable numbers However, due to the complex physical properties of oocyte and donor cells, manipulating cells through a microfluidic chip poses certain challenges.
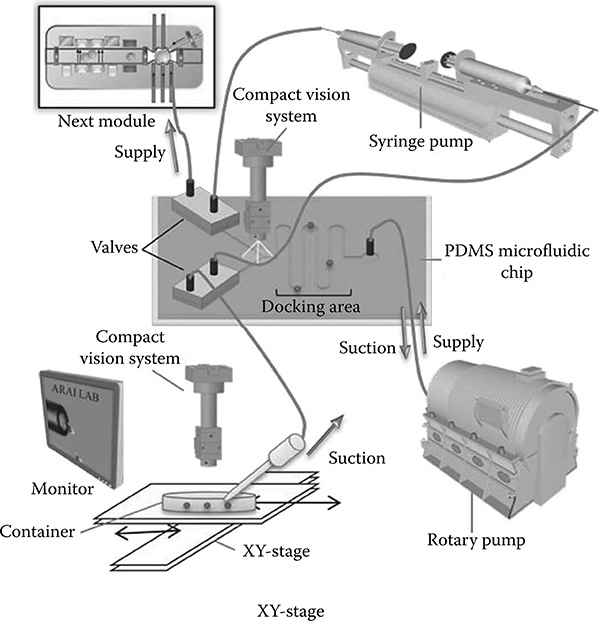
FIGURE 7.1
Schematic view of the automatic single cell transfer module. © 2009 IEEE.
This system is comprised of the parts shown in Figure 7.1. External pumps, micromanipulators, and camera systems are connected to a computer and run automatically based on a cell detection/tracking and control algorithm. All experiments were performed at room temperature and one microfluidic device was used several times, where the device was cleaned with filtered water after every experiment. A syringe filter (hydrophilic, Sartorius-Minisart, Aubagne, France) was attached to the end of a syringe to absorb impurities as the water passed through and to prevent contamination in the microchannels.
7.2.1 Cell Types and Preparation
In this chapter, we primarily focus on somatic cell cloning. Experiments were performed using fibroblasts as donor cells and oocyte cells as recipient cells. Oocytes were isolated from bovine. Ova were cultured approximately 24 hours after harvesting from the ovary. In order to detach cumulus cells from the harvested ova, cells were treated with hyaluronidase (Nacalai Tesque Inc., Kyoto, Japan). The pellucid zone of the ova was removed by pronase treatment and near-circular oocyte cells were isolated The diameter of isolated oocytes was about 100-150 urn (Figure 7.2).
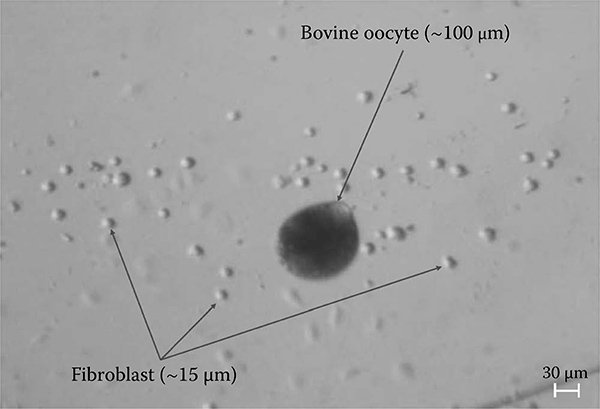
FIGURE 7.2
Bovine oocyte and fibroblasts. The fibroblasts are transparent, whereas the oocytes are easily viewable under the visible light condition.
Fibroblasts 10-30 urn in diameter were isolated from female bovine ears (Figure 7.2). The fibroblasts were cultured in Dulbecco's modified Eagle's medium supplemented with 10% fetal bovine serum (FBS) in 35-mm dishes in a 5% CO2 incubator. When cells became confluent, the culture medium was changed to 0 5% FBS-supplemented media Fibroblasts were harvested from the dishes by treatment with trypsin-ethylenediaminetet-raacetic acid (EDTA).
7.2.2 Penicillin-Streptomycin and Bottom Surface Treatment
Fibroblasts readily adhere to the surface of plastic culture dishes We detached fibroblasts using trypsin-EDTA (Wako Pure Chemical Industry, Osaka, Japan) treatment (Tuan and Lo 2000) and then waited over 30 minutes to attempt to aspirate the fibroblasts. However, over time, detached cells readhere to the culture dish and cannot be aspirated To avoid this problem, we treated the culture dish by painting the dish with a small amount of liquid PDMS (without the use of catalyst) for use in the following experiments. This method is also known as siliconizing (Gunnar and Bähr 2008); that is, coating a surface with silicon The other method was to pour PDMS (using a catalyst) and cover the dish with a thin, solid PDMS layer In the case of nontreated containers, less than half of the fibroblasts could be aspirated. On the other hand, the cells in the PDMS-coated dish were all easily aspirated
7.2.3 Cell Suction System
In the acquisition process of a single cell, first the rotary pump (ISMATech Inc, Wertheim-Mondfeld, Germany) was connected to the dock side of the PDMS chip via a Teflon tube (outer diameter 0.5 mm, inner diameter 0.3 mm) The main route starting from the dock side port (outlet port) to the glass microtube was on the same line. Therefore, flow speed and flow direction in the microchannel, as well as the speed on the tip of the glass microtube, were handled by this pump. During the experiments, we realized that small-diameter tubes decrease the possibility of creating cell stacks on the intersection point of the inlet port and the Teflon tube. Hence, the glass micro-tube and the cell delivery channel were connected using another Teflon tube (outer diameter 0 3 mm, inner diameter 0 2 mm) We used a glass microtube (0 30 mm outer diameter, 0 18 mm inner diameter) as a suction mouth for the oocyte cells A glass microtube can easily vacuum single cells without inflicting any damage. In addition, it has a noncomplex fabrication procedure that makes it easy to apply for common procedures. For the fibroblast, the glass microtube was heated to decrease its diameter (inner diameter ~50 um) The tip of the glass microtube was processed by a microforge (MF-830, Narishige Inc., Tokyo, Japan) and polishing machine (EG-44, Narishige Inc.).
7.2.4 Manufacture of the Microfluidic Chip
The microfluidic chip employed in this research has been designed to perform two main functions: aligning aspirated cells in the docking area and transferring them to the next module We designed two different types of microfluidic chips that have two- and three-layer structures. A two-layer microfluidic chip has two molds, the main mold carrying the fluidic channel and the valves. The molds of the second fluidic chip are the main mold, valves (second mold), and air chamber (third mold), which were patterned on a silicon wafer with different heights using SU8-based photolithography, which has been described elsewhere (Zhang, Tan, and Gong, 2001). In the main mold, channels for delivering cells were 200 um wide and 150 um deep, dimensions sufficient to contain an oocyte. The main mold has a "Y"-shaped character and is completed with a snake-like dock, as shown in Figure 7.3.
After preparation of the mold, the PDMS device and the valves were fabricated using a classic multilayer soft lithography technique Firstly, a thin layer of PDMS (thickness: ~300 um, the first layer) was spin-coated on the main mold and then cured for less than 20 minutes at 100°C in an oven. The same method was repeated for the second layer, which also contained the valve Incorrect placement of the second layer (thickness: ~250 um), containing a thin membrane, may obstruct flow permanently. The first and second layers were carefully aligned together The valve layer was completed by adding a PDMS slab containing an air chamber (depth: 500 um) Then, the combined PDMS layers were treated by air plasma using an expanded plasma cleaner for 1 minute together with a glass slide rinsed in ethanol The glass slide was placed on the prosthesis and pressure was applied until they were firmly bound to each other. Finally, the microfluidic chip was sealed with PDMS and cured a second time.
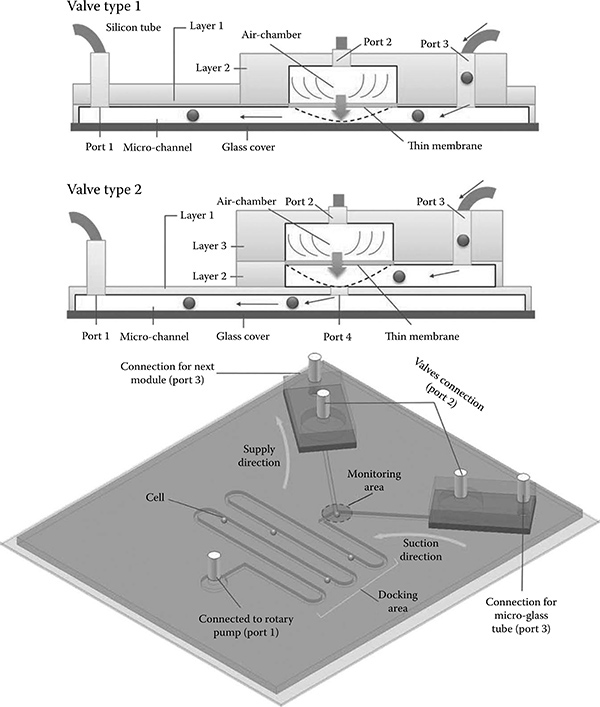
FIGURE 7.3
Port 1 is connected to a rotary pump that controls flow speed and direction in the fluidic channel. A thin PDMS membrane is actuated with Port 2 connected to a syringe pump. When the air chamber is filled with air, it closes the gate (Port 4) for the fluidic channel and stops cell flow from the loading inlet (Port 3). The "Y"-character channel controls supply suction and supply directions by switching valves.
7.2.5 Valve Control Principle
Within the PDMS chip, the valve region is closed by applying air pressure to the air chamber and obstructing the microchannel (Figure 7.4). The air pressure control valves for open and close actions are activated by a syringe pump (KDS270, Kd Scientific, Holliston, MA, USA). The syringe pump links two valves so that one becomes closed if the other becomes open. In addition, the flow behavior of the "Y"-shaped channel can be observed by the use of color pigments when the pump actuates. The control of the current direction in the microchannel is handled by the rotary motion of a high-precision rotary pump (ISMATech). Although the fabrication process of a three-layer microfluidic chip is more difficult than that for a two-layer chip, it has a better performance, in particular for response time. Table 7.1 shows a comparison of both valve designs
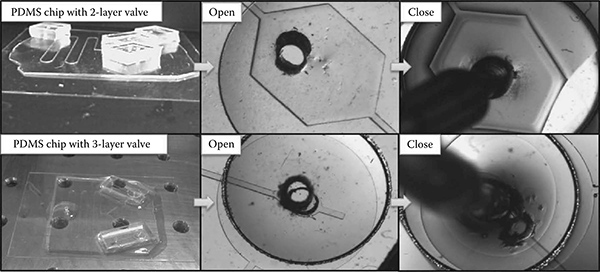
FIGURE 7.4
PDMS microfluidic chips and valve actuation. Figure shows valve deformation by applying air pressure.
7.2.6 Vision Systems
Two camera systems were assigned to monitor two important sections of the entire mechanism. The first camera (compact optical setup with Point grey Dragonfly camera, Point Grey Research, Richmond, BC, Canada) was placed on the cell container in order to detect the position of the oocyte or donor cells in the container. The second camera was boarded on the microfluidic chip with the purpose of actuating valves and changing flow direction.
The compact vision system provides good image quality, allowing data on the oocyte cell and donor cell to be extracted from the acquired images (Uvet et al. 2008). In this second version, we changed the optical setup and designed a task specific system that has a 1. 5-mm monitoring area and light source on the same side as the complementary metal-oxide-semiconductor (CMOS) sensor. The specifications are given in Table 7.2.
The camera can be placed and aligned on a chip with the aid of xyz micro-stages. As shown in Figure 7.5, the new system is small and can be easily combined with the microfluidic chips. This makes it possible to observe the cell container and microfluidic chip simultaneously in a short distance. Otherwise, we would have to use two commercial microscopes, which requires a large workspace and the use of a long Teflon tube to connect the glass microtube to the inlet port of the PDMS chip
TABLE 7.1
Comparison of Two. and Three.Layer Valves
Two-Layer Chip |
Three-Layer Chip |
|
|---|---|---|
Main fluidic channel |
1st Layer |
1st Layer |
Valve position |
1st Layer |
2nd Layer |
Air chamber |
2nd Layer |
3rd Layer |
PDMS membrane |
1st Layer |
2nd Layer |
Vertical movement between layers |
No |
Yes |
Valve closing level |
Low |
High |
Response speed |
Slow |
Fast |
TABLE 7.2
The Compact Vision System Specifications
Design wavelength |
587.6 nm |
Focal length (objective lens) |
7.5 mm |
Effective aperture |
1.85 mm |
f-Number |
4.1 |
NA |
0.123 |
Refractive index (water) |
1.3334 |
Depth of focus |
25.8 um |
Magnification |
4.7 |
Source: © 2009 IEEE.
In this study, the modulation transfer function (MTF) was also used as a measurement parameter of optical quality (Ray 2002; Smith 2000). MTF graphs show modulation of image contrast at different spatial frequencies Diffraction limits the contrast in every optical system Diffraction limited modulation transfer functions are given in MTF graphs with dashed curves for the purpose of comparison with perfect lens case In this MTF analysis, defocusing, which causes blurry image, is set as 0 00 MTF performance was tested under a 587.6 nm wavelength. Four different MTF graphs plot the percentage of transferred contrast according to the distance from the center of the objective plane (center of the image). The MTF results at given radiuses are shown in Figure 7.6. The modulation (also known as contrast) is expressed in terms of a percentage (1.0 = 100%).
7.2.7 Cell Detection/Tracking and Control
The detection/tracking and control algorithm was mainly programmed for single-cell applications. Its execution steps can be described as follows:

FIGURE 7.5
Compact vision system.
• Start the first camera and detect the position of single cells in the cell container
• Align the glass microtube to the cell position and begin suction (ISMATech rotary pump)
• Toggle to the second camera and count the number of cells that pass the cross section in the PDMS chip
• If the desired number of cells passes the cross point, switch valves and let the cells flow to the next module.
• Switch valves and cameras if a second group of cells is required
A background subtraction algorithm was employed throughout the detection phase in order to eliminate redundant artifacts and to surpass optics-based aberrations The background subtraction method was essentially applied to moving regions, and the object positions were automatically found after input images were compared with a background image In this way, it is also possible to detect and track multiple objects After the edge is identified, the algorithm makes a circular approximation to the edge of the object and draws a circle around it, which is taken as the diameter of the object
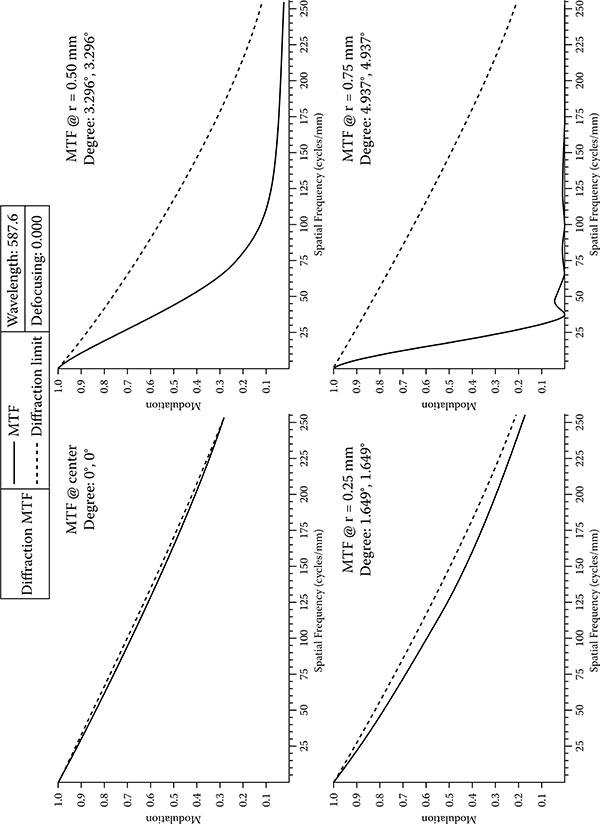
FIGURE 7.6
The graphs show the performance from the center of the image toward the corner (farthest from the center). MTF starts to slope down as moving away from the center, because sharpness is usually best in the center. The dashed curve represents the diffraction-limited results at f 4.1. The solid curves represent MTF. © 2009 IEEE.
It is important to note that the relative size of each pixel in a digital image is very important. To determine accurate diameter, the ratio between a single-cell image reconstructed on an image sensor and corresponding total pixel number must be calculated The pixel ratio for each cell was calibrated by Olympus Ronchi Ruling glass (Olympus, Toyko, Japan) (100 lp/mm). A donor cell of ~15 urn corresponds to about 30 pixels. In addition, we consider the boundary of any moving region as an edge of the object, because cells always come into the observation area one by one Once the background is fixed, any moving object is filtered according to its size and dimensions and labeled as a donor or oocyte Thirty pixels are considered as a minimum detection size and an object below 30 pixels is omitted. We essentially applied the same idea to the two camera systems, but cells are only floating in the container viewed by the microscopic camera. In the case of the compact vision system, however, the program was plagued by some environmental problems such as bubbles and other unwanted objects, which appear similar to the fibroblast or the oocyte.
Becaus the oocytes are approximately ten times larger than the fibroblasts, requiring a deep channel depth (150 um), the fibroblasts can easily go out of focus range and hence the image becomes blurry. Furthermore, the donor cell is very transparent under visible light. Even though its shape is nearly circular, because of the light conditions, in most cases it is complicated to extract its features from the background (Figure 7.7). After entering the microchannel, according to light dispersion over the donor cell, high-density parts become darker, whereas light areas frequently converge to the background color Though the system could often capture the edges of the donor cell through consecutive frames, in some cases the system could not locate the edges of the fibroblast.
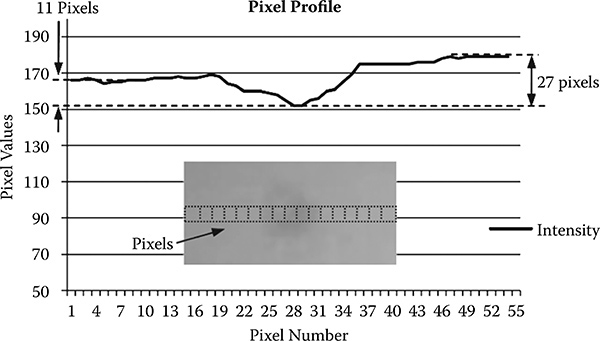
FIGURE 7.7
Pixel intensity changes according to pixel number to extract donor cells from the background. Minimum intensity change is used as default threshold value. © 2009 IEEE.
7.3 Experimental Results
7.3.1 Oocyte and Fibroblast Suction
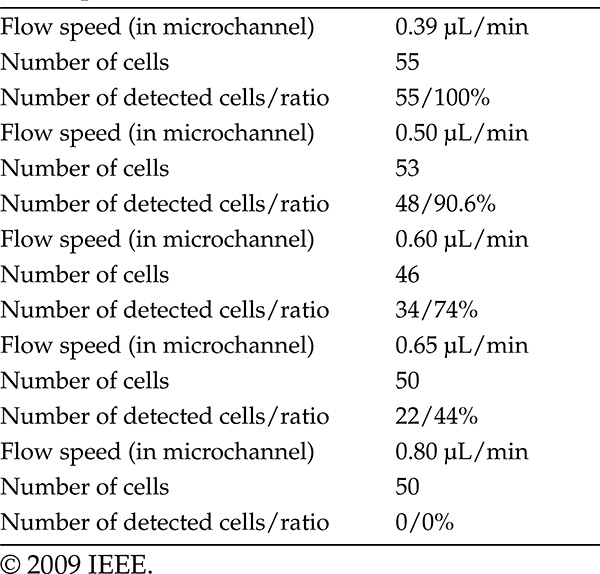
After a number of treatments, explained in the previous section, oocytes and fibroblasts were dispersed in a random manner in different containers (Figure 7.8). Before dispersion, the required flow speed must be defined in order to stabilize cell detection. In the case of fibroblasts, the ideal flow speed is determined by changing the rotary pump speed as in Table 7.3.
After determining the optimum speed, we programmed an initial desired number of cells for suction The program automatically starts searching for cells in the container if there is no cell on the monitoring area (Figure 7.9a). As soon as the program detects a cell or a cell group, it takes the position of the cells, draws circles around each detected cell, and displays their positional information (see Figure 7.8). The suction mouth of the glass microtube aligns with the nearest cell on the bottom surface, which is numbered 0, and then the rotary pump starts to flow. The required absorption time from the tip of the glass microtube to node A on the microchip is shown in Figure 7.10. According to the absorption time, the pump adjusts its speed automatically by decreasing the speed to the optimum detection level (see Table 7.3).
Once the suction of cell 0 is completed, the suction mouth returns to the original starting point, takes off from the surface to a safe height, and carries on suction of the medium without cells. After 6 seconds (an experimentally calculated delay used in order to put a specific distance between each cell) the suction mouth returns to the bottom surface and moves to the next cell, numbered 1
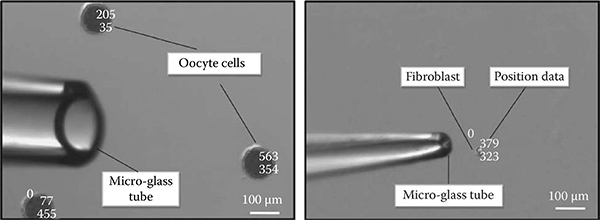
FIGURE 7.8
©2009 IEEE, Fibroblast and oocyte suction from a container. The tip size of the glass tube for the fibroblast is approximately 50 um and for the oocyte it is approximately 180 um. The detection algorithm locates the cells and aligns the glass microtube with them.
TABLE 7.3
Fibroblast Cell Detection Ratios for Different Flow Speeds
This procedure is repeated until the last cell is vacuumed from the screen view If the program reaches the total number of desired cells, it stops searching, moves to a safe height, and continues with the suction, even if there are still some cells on the screen The aspirated cells are batched in the docking area with a specific distance. The time interval between two connected cells is given in Figure 7.9b for suction mode and supply mode. Although the approximate absorption time for one cell to reach node A was found based on the speed of the rotary pump and tube dimensions, the experimental elapsed time values were different (Figure 7.11). The delay occurred due to the drag resistance of cells as they move through the continuous fluid flow in the Teflon tube.
7.3.2 Direction Control
Once aspiration of the desired number of cells is completed, the camera system on the cell container is toggled to the compact vision system placed on the cross section of the "Y"-character microchannels (see Figure 7.11). The task of the compact system is to ensure that the collected cells are gathered at the dock and transported to the next module, by switching the valves When a new cell shows up in the upper right-hand corner, the program detects cells and starts tracking. To avoid environmental failure in the PDMS chip and to maintain efficiency, four control parameters were added to the cell detection/ tracking and control program These parameters are shown on the screen as sequential lines. The first three lines (green) confirm that a detected cell safely passes to the dock side The second line, on the upper left-hand side (blue), counts the number of cells transferred In the beginning, three green and one blue parameter toggle as false As soon as the center of the detected circular area of the cell passes a single line, it toggles to true After it passes three green lines in order, the program counts this as one cell and waits for the second cell. When the desired total number of cells is reached, cells in the dock are transported to the next module Each time a single cell passes the blue line, this is recorded for final confirmation. To start cell transfer to the next module, the system runs as follows:
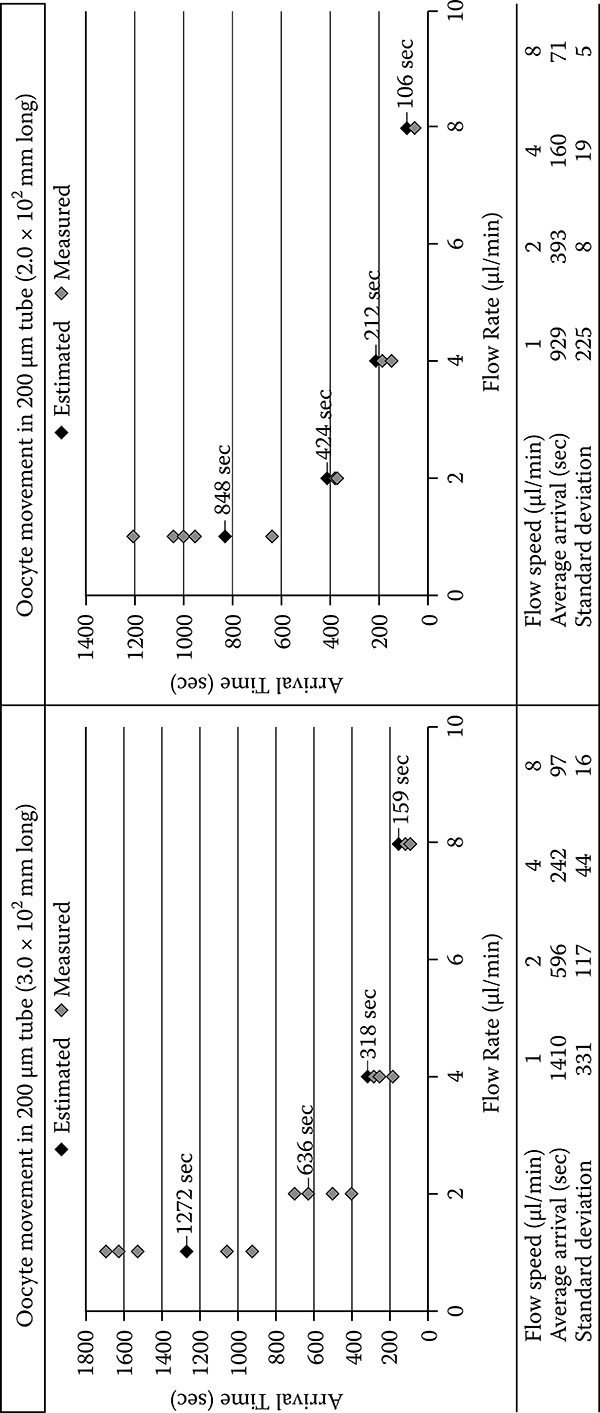
FIGURE 7.9
The cell suction system. (a) The glass microtube bent 45 degrees approaches approximately ~150 ìm from an oocyte and vacuums it. (b) After dispersion, the time lag between two consecutive cells at points A and B. © 2009 IEEE.

FIGURE 7.10
Approximate absorption time for one cell from the cell container to the microchip. (Flow liquid: TMB 199 liquid + 10% FBS; Oocytes: after removal of zona pellucida.)
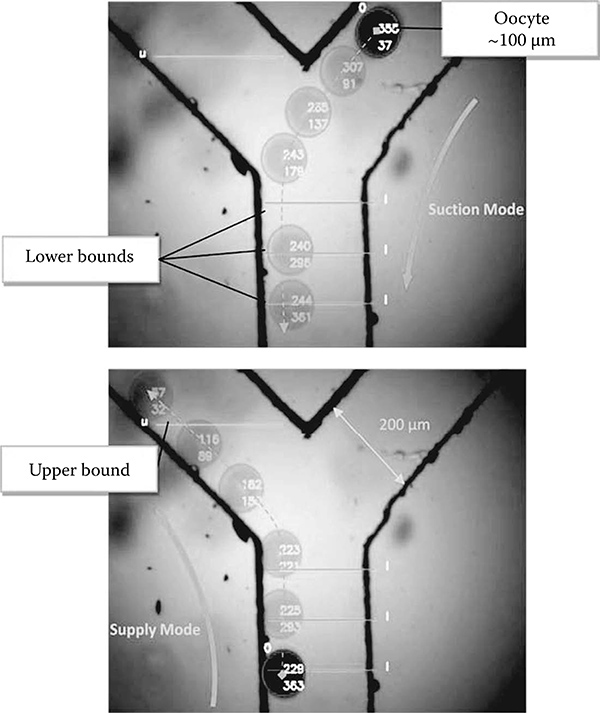
FIGURE 7.11
Experimental result for tracking and controlling an oocyte in the microfluidic chip. The images were taken by the compact vision system. Dashed lines with transparent oocyte figures for both images show trajectories in suction and supply modes. © 2009 IEEE.
• The rotary pump connected to the end of the "Y"-shaped channel stops the flow.
• The syringe pump applies pressure to the right pneumatic valve (infusion) while releasing the left valves (withdraw) In the experiments, the time elapsed during valve switching was measured at approximately 3 seconds
• The main flow direction is reversed.
• The rotary pump starts running again and transfers cells in the batch to the microchannel on the left
7.4 Discussion and Conclusion
The system presented here allows individual cells to be aspirated from a container and transferred to other modules The components, composed of pumps and micromanipulators, were connected to a computer that automatically controlled all functions carried out in the microfluidic device.
The pneumatic pressure valves were successfully applied on the fluidic chip We demonstrated a potential application of this system, the automation of nuclear transplantation We also demonstrated a potential application of this system, the automation of nuclear transplantation by singly transporting fibroblasts and oocytes. Cell coupling for nuclear transplantation can be automated by microfluidic devices. The detection method developed for this study is a simple and robust technique well suited for microfluidic systems Experimental results showed that the synchronized camera modules together with this algorithm were able to handle the pumps and micromanipulators simultaneously Data analyzed from the images were used to control the motion of the particles in the channels The performance of the algorithm was tested with different parameters It is capable of detecting different cell sizes, which also shows that the proposed system can be utilized as a support system with various on-chip single-cell analysis methods
This device is by no means a final system for nuclear transplantation. Its efficiency may be increased by including automated cell fusion functions within networks of microchannels Future research will focus on improving the algorithm and control, with the goal of executing simultaneous donor and oocyte manipulation in different fluidic chips before fusing them in a microfluidic chip.
References
Andrea, A. and Klavs, F. 2008. Microfluidic based single cell microinjection. Lab on a Chip, 8: 1258-1261.
Arai, T., Tanikawa, T., Arai, F., Satoh, O., Asouh, H., and Takahashi, S. 2007. Automated embryonic cell manipulation using micro robotics technology. Paper read at the International Conference on Intelligent Robots and Systems Workshop, October, San Diego, CA, October 29-November 2, 2007.
Cookson, S., Ostroff, N., Pang, W. L., Volfson, D., and Hasty, J. 2005. Monitoring dynamics of single-cell gene expression over multiple cell cycles. Molecular System Biology, 1: 2005-0024.
Cui, Y., Wei, Q., Park, H., and Lieber, C. M. 2001. Nanowire nanosensors for highly sensitive and selective detection of biological and chemical species Science, 293(5533): 1289-1292.
Elfwing, A., LeMarc, Y., Baranyi, J., and Ballagi, A. 2004. Observing growth and division of large numbers of individual bacteria by image analysis. Applied and Environmental Microbiology, 70(2): 675-678.
Gunnar, P.H. D. and Bähr, M. 2008. Synthesis of cell-penetrating peptides and their application in neurobiology Methods in Molecular Biology, 399: 181-186
He, M., Edgar, J S, and Jeffries, G D M 2005 Selective encapsulation of single cells and subcellular organelles into picoliter- and femtoliter-volume droplets Analytical Chemistry, 77(6): 1539-1544
Huang, W. H., Aia, F., Wanga, Z.L., and Cheng, I-K. 2008. Recent advances in single-cell analysis using capillary electrophoresis and microfluidic devices. Journal of Chromatography B, 866(1-2): 104-122.
Jager, E. W.H., Inganäs, O., and Lundström, I. 2000. Microrobots for micrometer-size objects in aqueous media: potential tools for single-cell manipulation. Science, 288(5475): 2335-2338
Lee, Y C, Parviz, B A, Chiou, J A, and Chen, S 2003 Packaging for microelectro-mechanical and nanoelectromechanical systems. IEEE Transactions on Advanced Packaging, 26(3): 217-226.
MacDonald, M. P., Spalding, G.C., and Dholakia, K. 2003. Microfluidic sorting in an optical lattice. Nature, 426: 421-424.
Ramesham, R and Ghaffarian, R 2000 Challenges in interconnection and packaging of microelectromechanical systems (MEMS) Paper read at the 50th Electronic, Components and Technology Conference, Las Vegas, NV, May 21-24, 2000.
Ray, S. F. 2002. Applied Photographic Optics, 3rd ed. Woburn, MA: Focal Press.
Schönholzer, F., Hahn, D., Zarda, B., and Zeyera, J. 2002. Automated image analysis and in situ hybridization as tools to study bacterial populations in food resources, gut and cast of Lubricus terrestris . Journal of Microbiological Methods, 48(1): 53-68
Schwarz, M A and Hauser, P C 2001 Recent developments in detection methods for microfabricated analytical devices Lab on a Chip, 1: 1-6
Skelley, A.M., Kirak, O., and Suh, H. 2009. Microfluidic control of cell pairing and fusion Nature Methods, 6: 147-152
Smith, W.J. 2000. Modern Optical Engineering: the Design of Optical Systems, 3rd ed. New York: McGraw-Hill
Toriello, N M, Douglas, E S, Thaitrong, N., Hsiao, S C, Francis, M B, Bertozzi, C R and_2008. Integrated microfluidic bioprocessor for single-cell gene expression analysis PNAS, 105(51): 20173-20178
Tuan, R.S. and Lo, C.W. 2000. Methods in Molecular Biology. Developmental Biology Protocols, Vol III New York: Humana Press.
Unger, A., Chou, H. P., and Thorsen, T., Scherer, A., and Quake, S. R. 2000. Monolithic microfabricated valves and pumps by multilayer soft lithography Science, 288(5463): 113-116
Uvet, H., Arai, T., Mae, Y., Takubo, T., and Yamada, M. 2008. Miniaturized vision system for microfluidic devices. Advanced Robotics, 22(11): 1207-1223.
Vilkner, T T, Janasek, D., and Manz, A 2004 Micro total analysis systems Recent developments Analytical Chemistry, 76(12): 3373-3386
Walker, G M, Zeringu, H C, and Beebe, D J 2004 Microenvironment design considerations for cellular scale studies Lab on a Chip, 4: 91-97
Wu, H., Wheeler, A., and Zare, R N 2004 Chemical cytometry on a picoliter-scale integrated microfluidic chip. PNAS, 101(35): 12809-12813.
Yia, C., Lia, C. -W., Shenglin, J., and Yang, M. 2006. Microfluidics technology for manipulation and analysis of biological cells Analytica Chimica Acta, 560(1-2): 1-23
Zhang, J., Tan, K L, and Gong, H Q 2001 Characterization of the polymerization of SU-8 photoresist and its applications in micro-electro-mechanical systems 20(6): 693-701