
Chapter 7
Tracer Imaging
7.1 Introduction
The Nobel Prize in Chemistry 1943 was awarded to George de Hevesy for his work on the use of isotopes as tracers in the study of chemical processes. This was just 8 years after the first radioindicator study in life sciences with a manmade radionuclide was reported (Chievitz and Hevesy, 1935). Since then, the use of the tracer principle has provided a wealth of knowledge about the biochemical pathways in living organisms. In particular, combination with imaging, that is, the recording of spatial and temporal distributions of radiolabeled molecules within the body, has made it possible to quantitatively acquire parameters such as blood flow, rates of metabolism, or receptor binding to describe physiological processes.
In the first tracer studies, only crude spatial information about radioactive source distributions was available by positioning a single detector at various locations around the subject. In 1950, Benedict Cassen invented the rectilinear scanner. This device produced planar images by mechanically scanning a detector in a rasterlike pattern over the area of interest. However, because of the sequential nature of the scanning, this technique required very long imaging times.
By 1952, Hal Anger completed the first prototype of a pinhole camera with a photographic plate. In late 1956, he developed the design now seen in current “Anger camera” systems replacing the film and screen with a single sodium iodide (NaI) crystal and a Photomultiplier Tube (PMT) array (Anger, 1958). The first use of the Anger camera to produce tomographic images was reported by Kuhl and Edwards (1964). In conjunction with Allan M. Cormack and Godfrey N. Hounsfield's developments of computer-assisted tomography, for which they were awarded the 1979 Nobel Prize in Physiology or Medicine, the first tomographs were built. By acquiring views of the tracer distribution from a variety of angles, the three-dimensional tracer distribution within the body can be reconstructed. In contrast to conventional Computed Tomography (CT) where X-ray transmissions are used, in Single-Photon Emission Computed Tomography (SPECT) γ-rays and in Positron Emission Tomography (PET) positrons are the sources of image information.
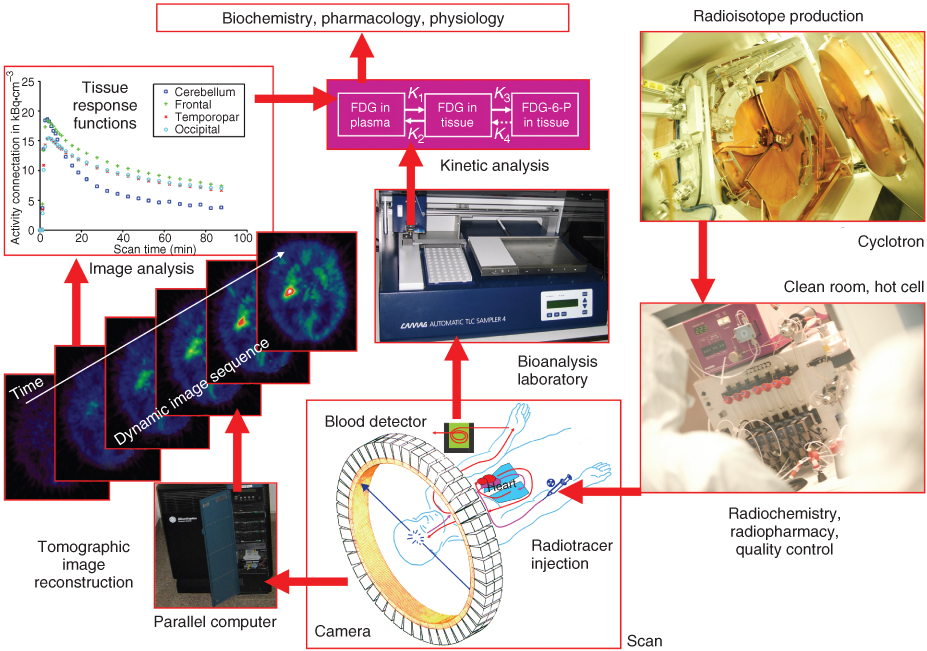
Figure 7.1 demonstrates how, through imaging, molecular pathways and molecular interactions in human tissue are studied (Jones, 1996). It serves as an illustration for the challenge of a highly interdisciplinary field stretching from basic science disciplines such as physics, chemistry, biology, and mathematics through applied sciences such as engineering and computing to matters of quality assurance, compliance, and regulatory affairs.
Figure 7.1 Tracer imaging science. The schematic illustrates the path of molecular imaging from the preparation of the radiotracer through the scanning session to the kinetic analysis of data that provides parameters that are meaningful in the fields of biochemistry, pharmacology, and physiology. With its superior sensitivity and specificity, tracer imaging is the means to bridge human molecular biology and molecular medicine.
The following sections provide a quick overview of SPECT and PET imaging, starting with isotope production and continuing through radiochemistry and radiopharmacy to a description of measurement techniques and applications.
7.2 Instrumentation
To perform tracer imaging studies, a comprehensive instrumentation set is required. In this chapter, a brief overview of the tracer imaging instrumentation is provided in four sections. The first section introduces the production of short-lived isotopes that are commonly used in imaging. The second section summarizes some of the main radiolabeling strategies. The last two sections of this chapter provide an introduction to the devices used for imaging as well as to peripheral detectors and bioanalysis systems required to perform quantitative imaging studies.
For more details on the instrumentation of molecular imaging, the reader is referred to monographs such as Phelps et al., (1986) or Valk et al., (2003).
7.2.1 Radioisotope Production
Radioisotopes for tracer imaging are either γ- or positron emitters. For most practical applications in imaging, they are produced in specially designed generators or with cyclotrons.
The most widely used SPECT isotope 99mTc is a fission product from the fission of uranium or plutonium in nuclear reactors. The vast majority of the 99mTc used in medical work is generated from 99Mo, which is formed by the neutron activation of 98Mo. 99Mo has a half-life of 67 h, so short-lived 99mTc (half-life = 6 h), which results from its decay, is being constantly produced. The imaging unit then chemically extracts the technetium from the solution by using a technetium-99m generator, which is also known as a technetium cow.
Other single-photon emitters such as 201Tl, 123I, and 67 Ga and positron emitters (18F, 15O, 13N, 11C) are produced in cyclotrons using specific gas, solid, or liquid targets. The group of positron-emitting radionuclides can be produced by inducing energies in the order of a few to about 10 MeV in so-called PET cyclotrons that are small in size and self-shielded so that they can be installed directly in the imaging center without the need to build a costly shelter (vault). The most effective reactions are those of the (p, n) type implemented with highly enriched stable nuclides and protons accelerated in these small PET cyclotrons, for example,14N(p, α)11C and 18O(p, n)18F. In such cases, the radionuclides obtained are not contaminated with any stable nuclide of the same element and are referred to as No Carrier Added (NCA) substances.
Liquid target systems have been developed for the production of nucleophilic [18F]fluoride from the 18O(p, n)18F reaction using highly enriched [18O]water targets. The volume of the liquid target is generally kept low in order to minimize the use of enriched isotopes. Target cooling is critical as hundreds of watts are usually imparted into less than 1 ml of liquid. The target pressure in a sealed system increases with the temperature of the liquid as it turns to vapor. This process allows the production of [18F] fluoride with high specific activity within a few hours at quantities of about 100 GBq.
A gas target system is frequently used to produce electrophilic [18F] fluorine gas from the 20Ne(d, α)18F reaction by deuteron bombardment. This method, however, produces relatively low yields of [18F] F2 gas (less than 37 GBq) and a lower specific activity than with the 18O(p, n)18F reaction.
Oxygen-15 is one of the earliest radioisotopes used in PET and continues to be used for studies of blood flow and blood volume, using primarily [15O]water and [15O]CO. It has also been used directly in the form of [15O]O2 for tissue oxygen utilization measurements. The simplest reaction to produce 15O is 14N(d, n)15O, taking advantage of the high yields at low energy and the economical use of the natural isotopic abundance of the target material. Gas targets are used, typically with 99% N2 gas and an admixture of an appropriate gas to form the required chemical product. In the case of [15O]water, hydrogen is used as the mix gas. Similarly, replacing the hydrogen with oxygen produces [15O]O2.
Several routes exist for 11C production, which can be performed with low energy particles and allow the recovery of 11C from the target with automated systems. In contrast to the solid target technology of the 11B(p, n)11C reaction that requires subsequent extraction of 11C from the target, the gas phase production with 14N(p, α)11C has the advantage of greatly simplifying the subsequent chemistry, as the 11C is produced in the form of carbon dioxide CO2 or methane CH4. The basic system is identical to that for 15O production, in that the target gas is primarily natural nitrogen, with a small admixture of an appropriate balance gas to produce the desired product. In the case of [11C]CO2, the mix is <1% oxygen, while for methane, a higher mix of hydrogen is optimal, on the order of 10%.
7.2.2 Radiochemistry and Radiopharmacy
After the production of radioisotopes, a radiochemistry procedure is used to produce the radiolabeled compounds for the imaging study.
18F can react as an electrophile (i.e., an electron-deficient species that seeks electron-rich reactants with high electron densities such as carbon) or as a nucleophile (i.e., an electron-rich species that seeks electron-deficient reactants).
The nucleophilic routes use high specific activity [18F]fluoride and are substitution reactions of different types. The electrophilic reaction routes use [18F]fluorine with lower specific activity and are direct fluorination of aromatic rings or regioselective demetallations.
For the production of 11C-labeled compounds, methyl iodide [11C]CH3I is widely used as an alkylating agent for nucleophiles. It is produced either by conversion of carbon dioxide [11C]CO2 to [11C]methoxide followed by reaction with hydroiodic acid or by a gas phase reaction of methane [11C]CH4 with iodine. Another widely used labeling agent for the production of amines, amides, and carboxylic acids is [11C]cyanide, which can be obtained from carbon dioxide [11C]CO2 or from methane [11C]CH4.
The manufacturing of radiopharmaceutical products for administration to human subjects requires the manufacturer to hold a licence from the regulatory body. The licensing agency, for example, in the United Kingdom, the Medicines and Healthcare Products Regulatory Agency (MHRA), expects a quality assurance system in place to ensure that the procedures used are in accordance with the principles of Good Manufacturing Practice (GMP). This quality assurance system covers all activities from design, development, production, and installation to servicing and documentation (Långström and Hartvig, 2008).
In GMP, an important part is the documentation of every aspect of the process, activities, and operations involved in the manufacture of pharmaceuticals. This documentation must show how the product was made and tested. GMP requires that all manufacturing and testing equipment has been qualified as suitable for use, and that all operational methodologies and procedures such as manufacturing, cleaning, and analytical testing utilized in the pharmaceutical manufacturing process have been validated according to predetermined specifications, to demonstrate that they can perform their purported functions.
Quality Control (QC) is concerned with checking and testing the radiopharmaceuticals for release (Frier, 2000). QC is performed independently of the radiopharmaceutical production. Because the physical half-life of the radionuclides is short in relation to the time required for some of the QC tests, for instance, for sterility and for apyrogenicity, these tests are performed retrospectively. Most of the tests, however, are performed before the release of the radiopharmaceutical for administration. These are measurements of radionuclide purity, radiochemical purity, the specific activity and the amount of stable impurities, for instance, the precursor. For a 11C-labeled product, these QC tests should not require more than 20 min (one isotope half-life) to release the product for injection.
For 99mTc technetium kits, the most likely radiochemical impurities are pertechnetates. Chromatographic methods that separate the components of a mixture by exploiting differences in the relative affinities for an adsorbent (stationary phase) and a developing solvent (mobile phase) are used to check the continued stability of the kit.
7.2.3 Imaging Devices
The basis of tracer imaging is the detection by external devices of the radiation emitted from the radiolabel attached to the tracer injected into humans or animals. In most cases, nuclear disintegration of the radiolabel is detected via registering photons, which are either uncorrelated (hence single-photon imaging) or which are paired as the result of positron annihilation. This imaging technique is then known as coincidence imaging or positron imaging. Other imaging modalities such as fluorescence imaging are not covered here; see Chapter 8 in this book.
The imaging devices described here are subdivided into cameras for planar imaging and tomographs. They can also be classified in terms of the way they are operated; they acquire either static images, which are snapshots of the tracer distribution not taking note of the changes over time, or dynamic sequences of images, which are series of consecutively acquired images reflecting not only the spatial but also the temporal distribution of the imaging probe.
In a simple planar imaging setup, for instance, for bone scans, the detector array is in a fixed position over the patient and all data are acquired from a single angle. The acquired image then closely resembles that of a radiological X-ray image.
If multiple planar images, each of which is the result of summing data over a short time interval, are acquired over time, then the kinetics of the tracer distribution in the organ is also captured. For example, kidney function is assessed by renal dynamic imaging with the agent 99mTc-diethylene triamine pentaacetic acid (99mTc-DTPA).
In contrast to planar imaging, multiple views of the tracer distribution are acquired from a variety of angles in tomographic imaging. This is achieved by rotating either one or multiple camera heads around the patient, a system design that is commonly found in SPECT. The other option that is usually employed in PET is to build a ring of detectors, thus acquiring entire sets of projections in planes perpendicular to the axis of the tomograph. Explanations on how the original activity distribution can be restored from the measurements of the projections follow later in the section on image reconstruction.
As in planar imaging, tomographic images can be acquired in the static mode or as a dynamic sequence of consecutive images. A special acquisition protocol is that of whole-body imaging, which is used in [18F]Fluorodeoxyglucose ([18F]FDG) PET to scan the entire body for metastatic disease. Here, the patient couch is moved through the scanner step by step, acquiring one image per bed position such that at the end of the acquisition a whole-body image can be assembled from this series of images.
After this general overview of the different acquisition modes in tracer imaging, a more detailed description of the physical processes underlying PET imaging are provided as an example highlighting various aspects specific to tracer imaging technology.
The positron emission occurs in proton-rich nuclei, the positron emitter, whereby in the nuclear field a proton p is converted into a neutron n emitting a positron e+ and an electron neutrino νe. For example, the nuclear disintegration of 11C via positron emission follows the reaction
![]()
Both the positron and the neutrino leave the nucleus. As the neutrino is without electric charge and has only a minuscule mass, it passes through matter almost undisturbed. The positron, however, interacts with the surrounding matter until it finally undergoes positron–electron annihilation. In the annihilation, the positron and electron are converted into two or three photons, with the cross section for the conversion into two photons being 372 times higher than the cross section for the conversion into three photons.
![]()
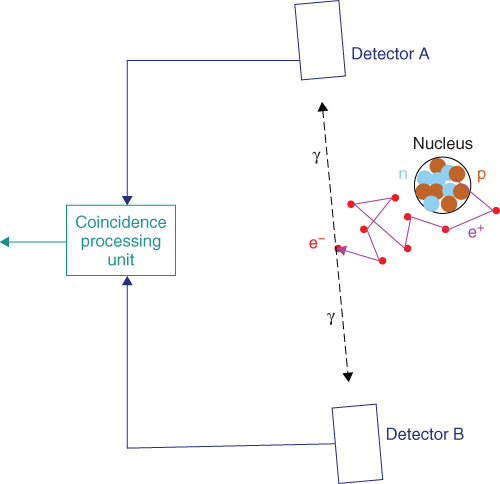
These two photons each have an energy of 511 keV and travel on an almost collinear path in opposing directions. The detection of these two photons in coincidence by two detectors constitutes the principle of positron imaging and is illustrated in Figure 7.2.
Figure 7.2 Principle of the positron detection. A pair of detectors A and B registers in coincidence the photon pair that has been produced by the annihilation of the positron e+ with the electron e−.
The connection of the two points where the photons are detected is known as the Line of Response (LOR), illustrated in Figure 7.3a. As the photons interact with matter on their paths, they may be absorbed or scattered. As shown in Figure 7.3b where the photon γ2 is deflected as the result of scatter, LORs are then incorrectly assigned. Two main strategies are used to compensate the errors arising from photon scattering. First, because the photon loses energy when it undergoes Compton scattering, the detectors register only the photons that fall in a preset energy window, for example, between 400 keV and 600 keV. This means that all photons with energy below the lower level of the energy window will not be passed on to form coincidence events. Second, the tomographic image reconstruction procedure contains special mathematical components to perform a scatter correction. With the help of a scatter model, the contribution of scattered photons within the energy window to the acquired projections is estimated from the distribution of the attenuation coefficients in the object and from an assumed positron emitter distribution. These estimated scattered events can then be subtracted from the measured coincidences, thus removing the impact of the scattered events from the data.
Figure 7.3 Coincidence types in PET. The PET scanner shown in the diagram consists of eight planar detector heads, a design that has been adopted for the High Resolution Research Tomograph (HRRT). (a) A true coincidence occurs when both detected photons γ1 and γ2 originate from the same positron annihilation. If at least one of the two photons is deflected as a result of being scattered in tissue, then a scattered coincidence (b) is recorded. If the two detected photons γ1 and γ2 are produced by two separate positron annihilations, then a random or accidental coincidence is recorded (c).
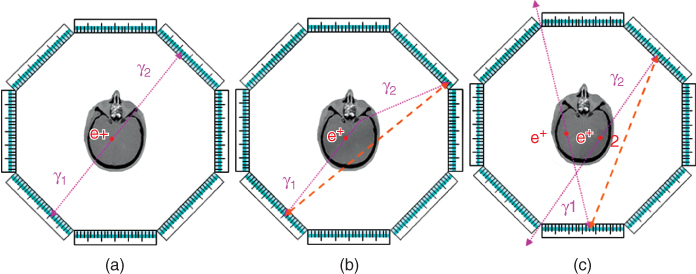
The coincidence processing unit pairs two single events into one coincidence if these two events fall within the coincidence time window, which is, depending on the timing resolution of the detectors, typically a few nanoseconds long. Photons originating from two different positron annihilations may accidentally be detected as a coincidence event (Fig. 7.3c). However, because these two sources are not correlated, an estimate of random coincidences can be obtained from acquiring delayed coincidences, that is, the combination of two single events that occur in a delayed time window.
As the processing of an event in the radiation detector and the subsequent electronic circuitry requires a small, but finite, amount of time, two events following each other very shortly cannot always be identified as two separate events. This effect of the system being temporarily “blind” to events is characterized by a “dead time,” which is the minimum time the system needs to again be able to process another event following an initial event. The fraction of events lost because of dead time increases with the activity of the radiation source, therefore making it important to apply a correction to SPECT and PET data. On the basis of the characterization of the count rate performance of a particular scanner, mathematical methods of dead time correction are implemented in the tomographic image reconstruction.
At present, all commercially produced PET systems use inorganic scintillator crystals, for instance, thallium-activated sodium iodide NaI(Tl), bismuth germanate BGO, lutetium oxyorthosilicate LSO, or gadolinium oxyorthosilicate GSO, for the detection of photons. These scintillators emit visible light that can be measured with a position-sensitive photo detector, such as PMTs or an array of avalanche photodiodes, from the interaction with the incident photons. The preference for these scintillators results from their good stopping power for 511 keV photons because of their high effective atomic number and density and their good energy resolution due to their light output. For small animal imaging, however, High Density Avalanche Chamber Positron Cameras (HIDACs) are also used because of their excellent spatial resolution. These devices are based on the principle of position-sensitive multiwire proportional chambers, although they have a poor detection efficiency for 511 keV photons and a very limited energy resolution.
Most commercially available PET systems record coincidence events only by the LOR where the photon pair was registered. However, some systems have, because of shorter coincidence time windows of less than 1 ns, the ability to measure in addition to the LOR the Time of Flight (TOF) of the photons. The tomographic image reconstruction process can then take not only the detected LOR into account but also a probability distribution for where along the LOR the annihilation occurred.
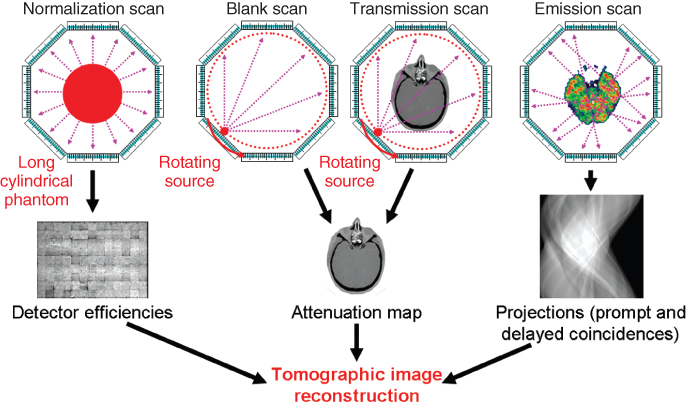
In order to be able to correct the emission images for the effects of photon attenuation and scatter in the object, the knowledge of the distribution of the attenuation coefficients in the object is required. For relatively simple objects such as the head, sometimes a calculated attenuation map is used, which is derived from a crude estimate of the contour of the skull from the acquired emission data. In most cases, an attenuation map of the object is generated from a CT scan in combined SPECT/CT or PET/CT systems, or from a transmission scan performed with rotating external rod or point sources. Figure 7.4 provides an overview of the scans that comprise the PET data acquisition. In contrast to the transmission scan that is required every time the object in the scanner is changed, the blank scan is acquired once per day or so, often in combination with the daily system stability tests. For the characterization of the detector efficiencies, an acquisition with good statistical quality, that is, a large enough number of counts per detector element, is required. This is the reason why these normalization scans, which can take up to 1 week on some scanners such as the High Resolution Research Tomograph (HHRT), are usually performed only after maintenance cycles or in case of replacement of scanner components.
Figure 7.4 PET data acquisition. The diagram shows the set of scans that is required to quantitatively reconstruct the images of the emission scan. On combined PET/CT systems, a CT scan is performed to obtain the attenuation map, thus replacing both the blank scan and the transmission scan.
Dual modality SPECT/CT and PET/CT systems have been hugely successful over the last decade as they provide anatomical data from the CT colocalized with functional data from the SPECT or PET investigation. This is a particular advantage outside the head where the simple rigid body coregistration of images normally is not satisfactory. Furthermore, it also reduces the time required for the transmission scan (typically between 5 and 15 min per bed position) to just a few seconds for a CT scan, thus substantially increasing the throughput in whole-body imaging studies with multiple bed positions.
First prototypes of combined PET and Magnetic Resonance Imaging (MRI) systems suitable for human imaging are being evaluated at the moment. Owing to the strong electromagnetic fields in and around an MR scanner, it is a bigger challenge to design the PET components for a PET/MR system than it is for the combined PET/CT systems, which were—and still are—basically a CT scanner and a PET scanner set up next to each other such that the patient bed can be used by both scanners.
All PET scanners available today operate in a three-dimensional (3D) mode. This means that there are no septa in the scanner to collimate the radiation, and that, in principle, LORs exist between any combination of two detector elements in the tomograph. Some scanners are still equipped with retractable septa that can be moved into the scanner for 2D acquisitions or to perform transmission scans with external sources using positron emitters such as 68Ge. The scanner's sensitivity is significantly lower in the 2D mode than it is in the 3D mode, although the fraction of scattered events is also smaller because of the smaller solid angle in axial direction.
SPECT entirely relies on the use of collimators to generate images from single-photon emitters without the “electronic collimation” via the detection of coincidences between pairs of photons. Different designs of collimators are used to project the images onto the detector heads. Dependent on the imaging needs, pinhole, parallel-hole, converging-hole, or diverging-hole collimators are used. The trade-off in the choice of the best collimator is between efficiency and resolution. A collimator with longer septa and smaller holes provides a higher resolution as it defines better the direction of the photons but it lets fewer photons through to the detector. On the other hand, collimators with larger holes and shorter septa have a higher efficiency but provide a lower image resolution. For isotopes with higher photon energies (Table 7.1), collimators with thicker septa are needed to reduce the penetration of the septa by the γ-rays.
Table 7.1 Physical properties of radioisotopes most commonly used in SPECT and PET listed by half-life

Many of the techniques described above for providing quantitative PET data are also used on SPECT and combined SPECT/CT systems. Nonetheless, the accuracy of the quantification in SPECT does not reach that of PET.
7.2.4 Peripheral Detectors and Bioanalysis
In addition to the imaging devices already described, an instrumentarium of peripheral devices is required to perform quantitative tracer imaging. The procedures for the production of radioactivity, radiosynthesis, and QC all require specialized equipment for measuring masses, activities, and other parameters.
Before human administration, the activity dispensed is usually measured in a dose calibrator, which is a shielded ion chamber specially designed to provide immediate readings of the activity in a vial or syringe. This measurement of the injected activity enables the calculation of a semiquantitative parameter of tracer uptake in tissue, the Standardized Uptake Value (SUV).
![]()
The SUV is a unitless entity, and normally the tissue density is assumed to be equal to that of water, and a value of 1 g cm−3 is used. Oncology applications often use the SUV as a measure to characterize the malignancy of lesions in [18F]FDG PET studies, although the SUV has been described as being subject to many sources of variability not least due to the inhomogeneities in body composition. For example, a positive correlation with body weight is the consequence of a lower uptake of [18F]FDG in adipose tissue in comparison with other types of tissue.
The absolute quantification of the radiotracer kinetics in the tomographic images normally requires an input function. This is the time course of the radiotracer in the supply stream that drives the tissue response, which is the time course of the concentration of the radiolabeled compound in arterial plasma. In contrast to the acquisition of the images that is performed by a single instrument, the SPECT or PET camera, the measurement of the plasma input function requires the combination of several laboratory devices.
Online blood detector devices are used to provide whole blood activity measurements of continuously withdrawn blood. These online blood counters provide data with excellent temporal resolution (typically about one activity reading per second), but because of the small counting volume, their sensitivity is inferior to counting discrete blood samples of a larger volume, that is, of a few milliliters. Because the tubing has to be directly connected to the subject, they have to be operated directly at the bedside, which exposes them to the radiation background originating from the injected activity in the patient and require bigger efforts for shielding.
A series of discrete blood samples is collected during the scan in syringes that are heparinized to prevent coagulation, that is, to stop the blood from clotting. By centrifuging the blood samples, blood plasma is separated from the erythrocytes and other blood cells, that is, thrombocytes (platelets) and leukocytes. The activities of whole blood and of plasma are measured in well counter devices. For PET, well counters are often custom made of big crystals in order to provide sufficient stopping power and counting efficiency for the 511-keV photons. For the commonly used SPECT isotopes, automated γ-counters are commercially distributed devices, in which racks with samples are automatically handled by a robotic system, placing one or multiple samples at the same time into a single well or a multiwell counter. Such systems achieve a high sample throughput; however, measurements often need to be corrected for cross talk between the wells.
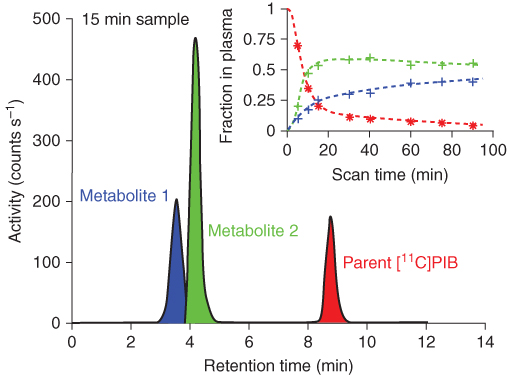
For radiotracers that undergo metabolism in the body, quantitative assays of the plasma samples to determine the fraction of radioactivity that is due to unmetabolized parent compound may also be required to obtain the input function. The laboratory setup required for these investigations often involves Solid Phase Extraction (SPE) followed by High Performance Liquid Chromatography (HPLC) or Thin Layer Chromatography (TLC). Figure 7.5 shows an example chromatogram obtained from an HPLC analysis run.
Figure 7.5 Analysis of radiolabeled metabolites in a plasma sample. The data are from the 15-min sample of a human subject injected with 370 MBq of Pittsburgh Compound-B or [11C]PIB, a marker of amyloid deposition in brain. The large plot shows the HPLC trace with three identifiable peaks. The peak of the unmetabolized parent compound with about 9 min retention time follows two more hydrophylic metabolites that partly overlap. The figure inset shows the measurements of the fractions of radioactivity in plasma belonging to metabolite 1, metabolite 2, and [11C]PIB. Eight plasma samples were analyzed for this 90-min PET scan. The plot illustrates that the parent [11C]PIB (red line) is rapidly metabolized in humans.
Other ancillary measurement systems are used in conjunction with tracer imaging studies to improve the quality of the imaging data. For example, in cardiac studies, the signal from an electrocardiograph, which records the electrical activity of the heart over time, is used to gate the imaging data. By reconstructing images according to the phases of the cardiac cycle, the blurring of the heart in the images due to cardiac motion can be greatly reduced.
In brain imaging studies, infrared motion tracking systems are used to track involuntary movements of the head during the image acquisition. As head motion can been seen as rigid body motion, a resorting of the lines of response from the PET emission scan can be performed with the motion tracking information.
7.3 Measurement Techniques
This portion of the chapter on tracer imaging measurement techniques is subdivided into two sections. The first section provides a short introduction into tomographic image reconstruction, that is, the restoration of activity distribution in the object imaged. The second section on quantification method then takes us forward to the field of kinetic modeling, that is, the extraction of physiologically interpretable parameters from the imaging data.
7.3.1 Tomographic Image Reconstruction
In tomographic tracer imaging, sets of projections through the object of interest are acquired. The role of image reconstruction is to accurately restore the original distribution of the activity concentration in three-dimensional space. Using mathematical language, the imaging process can be described in terms of integral theory, and then methods of solving inverse problems can be applied to the measured data (Natterer and Wübbeling, 2001).
Two main strategies are used to reconstruct tomographic images, Filtered Back Projection (FBP) and iterative image reconstruction. FBP is an analytical reconstruction method and is widely used to reconstruct images from scanners with ring geometry and in modalities with a high signal to noise ratio, such as X-ray CT and MRI. FBP is computationally fast and has linear properties, which means the precision of the reconstructed images is independent of the location within the image and the intensity of the object. Data from 3D acquisitions normally need to be preprocessed in a Fourier rebinning step to estimate equivalent parallel projections before they can be reconstructed with FBP.
Iterative image reconstruction starts from an initial estimate of the source distribution, usually a constant activity value; predicts the response of the imaging system to this source distribution (this step is also called forward projection); and then derives from the comparison of the measured projections with the calculated projections a set of corrections to apply to each element of the image volume. This process of repeated updates of the image continues until the predicted projections have converged sufficiently close to the measured projections.
The Maximum Likelihood Expectation Maximization (ML-EM, Shepp and Vardi, 1982) algorithm forms the basis of the majority of the iterative image reconstruction techniques used in tracer imaging today. It is, however, very slow to converge. By grouping projection data into an ordered sequence of subsets and processing the data in these subsets within each iteration, an acceleration of the convergence by a factor proportional to the number of subsets can be achieved (Hudson and Larkin, 1994).
As iterative image reconstruction is a nonlinear process, the precision of the reconstructed voxel counts is dependent on the original intensity and also on the distribution of the activity across the reconstructed object. For example, the convergence of the iteratively reconstructed images is slower in areas of low activity (often referred to as cold spots, which could, for instance, be areas of an infarct in myocardial images) than in the surrounding areas of the image with higher activity. Voxels close to high intensity objects (this could be, e.g., the bladder for tracers with high renal excretion) are not as precisely reconstructed as in other parts of the image. These nonlinear properties make it particularly challenging to obtain quantitative images with iterative image reconstruction.
On the other hand, iterative image reconstruction provides the possibility to more accurately model the entire imaging process than FBP. For example, resolution effects can be included into the system matrix such that the EM algorithm gradually recovers the modeled resolution with each update (Reader et al., 2003). For data from tomographs with nonring geometry, which do not provide complete sets of projections and with spatially varying point spread functions, FBP cannot be used. High resolution tomographs inherently deal with a small number of counts per voxel such that the approximation of the Poisson distribution for the description of the probability of the nuclear disintegration by the Gaussian distribution is no longer accurate. Again, iterative image reconstruction offers the advantage over FBP that accurate models for the underlying statistical processes can be incorporated.
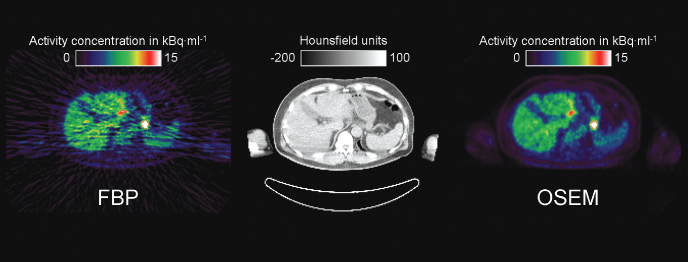
To visually appreciate the difference in image quality provided by FBP and Ordered Subset Expectation Maximization (OSEM), Figure 7.6 shows an example from a PET scan in the abdomen.
Figure 7.6 Tomographic image reconstruction. Displayed is a transaxial slice from a scan of the abdomen performed on a combined PET/CT system following the intravenous injection of an [18F]FDG bolus. On the left hand side, the result from the reconstruction with filtered back projection (FBP) is shown. It has streak artefacts characteristic of FBP across the entire image, including the parts outside the body. On the right hand side is the result from iterative image reconstruction using the Ordered Subset Expectation Maximization (OSEM) method after 4 iterations with 16 subsets. It visually appears much smoother and has no image artefacts. The image reconstructed from the spiral CT scan is shown for comparison in the center. Because the trans axial field of measurement of the CT scanner is with 500 mm smaller than that of the PET scanner, the outer parts of the arms are cut. For patient comfort during the PET scan, the subject was positioned with the arms next to the body. In between the two arms, some artefacts due to beam hardening can be seen in the CT image.
7.3.2 Quantification Methods
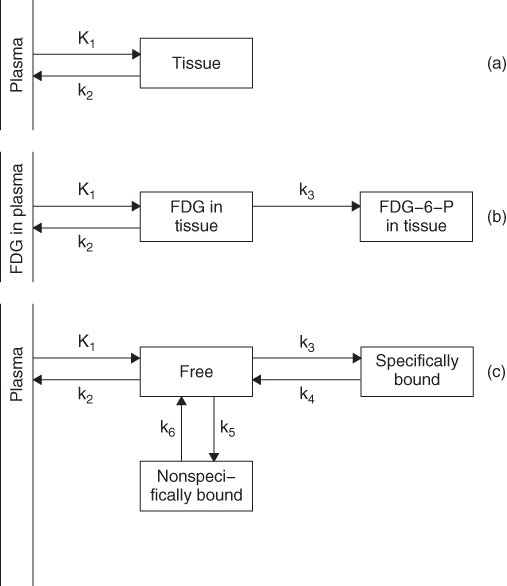
The genuine strength of imaging with radiolabeled tracers in comparison with many other imaging modalities is that estimates of parameters of biological function can be obtained. Quantification in the first instance applies to the physics of the imaging process, that is, the accurate restoration of the activity concentrations in the blood and the tissue. This quantitative tracer concentration signal acquired in a dynamic sequence then paves the way to quantifying the underlying physiological processes, for instance, blood flow, metabolic rates, or ligand binding to receptors. This link is established via a tracer kinetic model whose model parameters describe the exchange of the tracer between compartments. As examples, Figure 7.7 shows the configuration of three widely used compartmental models.
Figure 7.7 Examples of compartmental models. (a) the flow model (Kety and Schmidt, 1948), (b) the deoxyglucose model (Sokoloff et al., 1977), and (c) the neuroreceptor binding model (Mintun et al., 1984).
7.3.2.1 The Flow Model
The blood flow model in Figure 7.7a has been introduced by Kety and Schmidt (1948). It was originally developed for quantitative Cerebral Blood Flow (CBF) studies with nitrous oxide N2O but is now widely used with all freely diffusable tracers, for example, [15O]water. In this one-tissue compartment model, the rate constant K1 describes the transfer of the tracer from arterial blood plasma into the tissue and is—- under the assumption that the properties of this transfer, that is, the tracer extraction, are constant over the measurement duration—proportional to tissue perfusion. The ratio of K1/k2 is known as the partition coefficient and is equal to the distribution volume of the tracer in tissue.
7.3.2.2 The Irreversible Model for Deoxyglucose
The two-tissue compartment model shown in Figure 7.7b was developed by Sokoloff and coworkers for [14C]deoxyglucose (Sokoloff et al., 1977) and was soon applied to human [18F]fluorodeoxyglucose ([18F]FDG) studies (Reivich et al., 1979). It is the basis for the measurement of the regional cerebral metabolic rate of glucose rCMRglu with [18F]FDG in brain PET studies. The two rate constants, K1 and k2, in the model reflect the transport of FDG across the Blood–Brain Barrier (BBB). The rate constant k3 represents the phosphorylation of FDG by hexokinase into FDG-6-phosphate, which—in contrast to glucose—does not undergo further glycolysis. With estimates of these three rate constants, the combined forward rate constant KI can be calculated, from which rCMRglu is obtained
![]()
The steady-state concentration of glucose Cglu in plasma has to be measured in conjunction with the PET scan. The so-called lumped constant Λ is required to convert the metabolic rate of FDG into the metabolic rate of glucose and accounts for differences in enzyme affinities and in the transport across the BBB between glucose and FDG.
Estimates of the model microparameters can be obtained by fitting the tissue time-activity curve using the measured input function, that is, the time course of radioactivity in plasma, and the equations describing the compartmental model. Bias-free parameter estimates are generally provided by weighted nonlinear least squares methods. However, these methods are time consuming, require initial parameter estimates as starting values for the optimization algorithm and may not converge to a unique solution. Therefore, linearized versions of the model equations are often used in order to obtain parameter estimates with linear least squares methods (Blomqvist, 1984). These rapid methods enabled the generation of parametric maps, that is, images representing the estimated values of parameters such as CBF or rCMRglu. Figure 7.10 shows examples of parametric images generated with spectral analysis (Cunningham and Jones, 1993), which is based on the general properties of linear systems rather than assuming a specific compartmental model configuration.
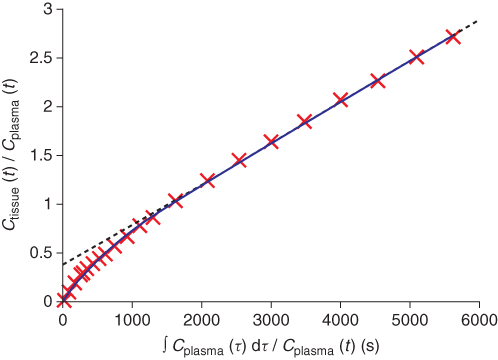
An alternative method to obtain estimates of the combined forward rate constant KI from graphical analysis has been published by Gjedde (1981) and Patlak et al. (1983). The idea of this graphical analysis of irreversible binding is to replace the measurement time t on the abscissa with a “virtual” or “stretched” time obtained by dividing the plasma integral with the plasma concentration. Furthermore, if the concentration in tissue on the ordinate is replaced by the ratio of the tissue concentration over the plasma concentration, then for any irreversible system, the obtained plot asymptotically approaches a straight line, whose slope is equal to KI (Patlak and Blasberg, 1985). The result of the data transform of the Gjedde-Patlak plot is how the tissue time-activity curve would have looked if the input function had been a unit step function or, in terms of tracer imaging, if the concentration of radiotracer in plasma had been kept constant over time by continuous tracer infusion. In Figure 7.8, an example plot from a dynamic PET study with [18F]FDG is shown.
Figure 7.8 Example of graphical analysis of irreversible binding (Gjedde-Patlak plot). The 28 data points (red crosses) were acquired over 60 min in a dynamic [18F]FDG PET study with simultaneous measurement of the plasma input function. The blue solid line depicts the fit obtained from a single exponential approaching a straight line. The dashed gray line is the estimated asymptote whose slope equals to the combined forward rate constant KI.
7.3.2.3 The Neuroreceptor Binding Model
The standard model for the quantification of neuroreceptor binding in dynamic PET studies is shown in Figure 7.7c (Mintun et al., 1984). It has subsequently been adopted for dynamic SPECT neuroreceptor studies (Laruelle et al., 1994).
The most widely used outcome parameter of neuroreceptor imaging studies, the binding potential BP, was defined based on this model as
![]()
The binding potential links the two rate constants k3 and k4 of the in vivo imaging model with the two parameters Bmax, denoting the maximum concentration of receptors that are available for binding, and KD, the radioligand equilibrium dissociation constant. This model, therefore, translates concepts established in traditional in vitro neuroreceptor binding assays to in vivo molecular imaging.
The model contains three separate tissue compartments for free radioligand in brain tissue, for nonspecifically bound radioligand, and for radioligand specifically bound to the binding sites of interest (Cunningham and Lammertsma, 1995). Specific binding refers to binding that is displaceable by the unlabeled ligand or other compounds that compete for the same binding site with the radioligand. On the other hand, the concept of nonspecific binding accounts for all binding that is not displaceable by an excess of unlabeled ligand and that usually occurs to lipids, proteins, cell membranes, and so on. It is assumed that the binding follows the classic kinetics of bimolecular association and unipolar dissociation. If the rate constants for these two reactions are kON and kOFF, respectively, then the dissociation constant KD equals to kOFF/kON.
Radioligands may bind specifically to several targets, for instance, N-[11C-Methyl]spiperone (NMSP) binds to dopamine D2 receptors and serotonin 5-HT2 receptors. This property is referred to as nonselective binding and needs particular consideration in the design and analysis of the imaging study. In the striatum, where the concentration of D2 receptors is much higher than the concentration of 5-HT2 receptors, NMSP was used to study binding to D2 receptors (Wagner et al., 1983).
Changes of the binding potential BP determined in in vivo imaging studies cannot distinguish between changes in the concentration of the binding sites, changes in the apparent affinity, and changes due to the concentration of competitors to the same binding sites, for example, endogenous neurotransmitters. In order to examine these contributions to the binding potential, scanning protocols with multiple tracer injections with varying amounts of co-injected stable ligand have been developed (Delforge et al., 1990).
In most receptor imaging studies, the tracer is administered as a bolus that is the closest approximation of an impulse input function that is achievable. As it is usually assumed that the rate constants of the underlying model are constant over the period of the scan, from a bolus injection scan the estimates of the model microparameters can be obtained. Other studies aim at identifying changes of binding during the scan, for instance, due to a pharmacological challenge. Here, the radiotracer is administered as a bolus followed by a constant infusion to maximize the ability to detect changes of the specific binding of the radiotracer (Carson et al., 1997).
As with the Gjedde-Patlak plot for irreversibly binding tracers, graphical methods have been developed to estimate the total volume of distribution of a tracer with reversible binding. This Logan plot (Logan et al., 1990) allows the quantification of radioligand binding without the knowledge of a specific compartmental configuration. It does, however, suffer from a noise-induced bias (underestimation of the total volume of distribution) due to the transformation of the time-activity data into the new co-ordinates of the Logan plot.
7.4 Applications
From the very beginning, PET applications were focused on the brain and the heart as the principle organs of interest (Phelps et al., 1986). This has dramatically changed over time, and today the vast majority of PET scans in the clinical field is performed with [18F]FDG in oncological applications, and molecular imaging has become a major tool for research in oncology (Kim and Yang, 2000). In this chapter, short introductory summaries of the role of molecular imaging in neuroscience, cardiology, and oncology are given. Two brief sections on the use of tracer imaging for drug development and on small animal imaging conclude this chapter.
7.4.1 Neuroscience
In brain research, SPECT and PET are primarily used as tools for measuring cerebral physiologic function, such as blood flow and glucose metabolism, and neurochemical systems, for example, the synthesis, storage, release, receptor binding, and reuptake of neurotransmitters. In terms of disease areas, molecular imaging is used to study epilepsy, cerebrovascular disease, movement disorders, dementia, and a range of psychiatric disorders, for example, schizophrenia, depression, and substance abuse (Duncan, 1997; Herholz et al., 2004).
7.4.1.1 Cerebral Blood Flow
The most widely used techniques for the measurement of Regional Cerebral Blood Flow (rCBF) are [99mTc]HMPAO/SPECT and [15O]water/PET. The use of these two tracers is based on different principles. [99mTc]HMPAO acts as a “chemical microsphere,” that is, it is intravenously administered and completely extracted and retained in proportion to local flow. Radiolabeled water, on the other hand, is seen as an example of a freely diffusible tracer to which the reversible one-tissue compartment model (Fig. 7.7a) applies. Under the assumption of a complete extraction, the rate constant K1 of the model represents tissue blood flow. However, the diffusion of water into tissue is limited, which results in an incomplete extraction of water. As a consequence of less tracer entering the tissue, the flow is underestimated by the flow model, an effect with increasing severity as the flow increases.
Another widespread application of rCBF measurements using [15O]water PET but without full quantification is in functional brain mapping. The acquired PET images are interpreted in an autoradiographic way, that is, it is assumed that the acquired voxel counts are proportional to rCBF, thus avoiding the need for measuring the arterial input function. In a repeated scan design, automated [15O]water generator systems produce a series of activity boli, which are highly reproducible in terms of the administration length and profile in comparison with manual injection of the activity from a syringe.
During a typical scanning session in an activation study, the subject repeats certain neurobehavioral tasks, normally one of which is used to characterize the “resting state” or “baseline” condition, while the others are motor or cognitive tasks. Active nerve cells consume oxygen carried by hemoglobin from the capillaries. The local response to oxygen utilization is an increase in rCBF to the areas of increased neural activity, occurring after a delay of a few seconds. This hemodynamic response is captured in the repeated measurements of rCBF with [15O]water PET. Special statistical analysis software known as Statistical Parametric Mapping (SPM) has been developed to identify clusters of task-associated differences in rCBF (Frackowiak et al., 2004). This methodology of functional brain mapping has been very successfully adopted by Functional Magnetic Resonance Imaging (fMRI); however, [15O]water PET is still the modality of choice for studies of subjects with implanted stimulators or other materials that are incompatible with strong magnetic fields. As an example, Figure 7.9 shows a typical output from an SPM analysis, highlighting the areas of the brain that were shown to be functionally involved in the task performance.
Figure 7.9 Example output from a statistical parametric mapping (SPM) analysis. Regions of the brain in which there was a statistically significant correlation between reduced [11C]raclopride binding potential and task performance. The task in this study was playing a video game, which led to an increased release and binding of dopamine to its receptors. Top row, the transverse and coronal glass brain views show those voxels with a significant inverse correlation of [11C]raclopride binding potential with the highest performance level reached. Bottom row, three-dimensional SPM projections superimposed on representative transaxial and coronal magnetic resonance image brain slices. Source: Figure adapted by permission from Macmillan Publishers Ltd: Koepp et al., 1998. This study published for the first time behavioral conditions under which dopamine is released in humans, illustrating the ability of PET to detect neurotransmitter fluxes in vivo during manipulations of behavior.
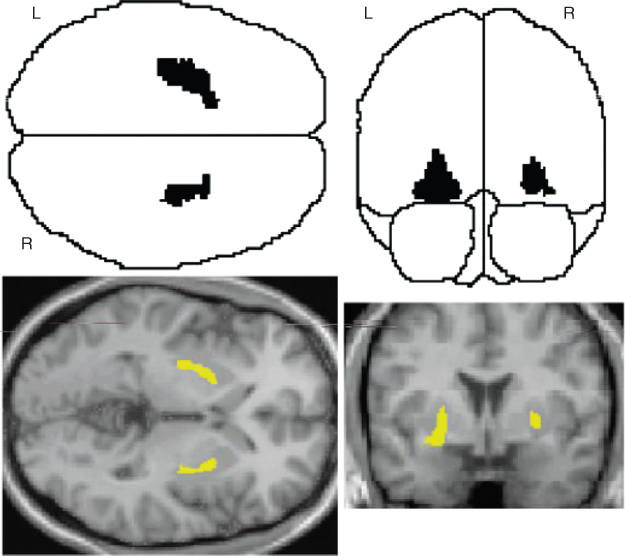
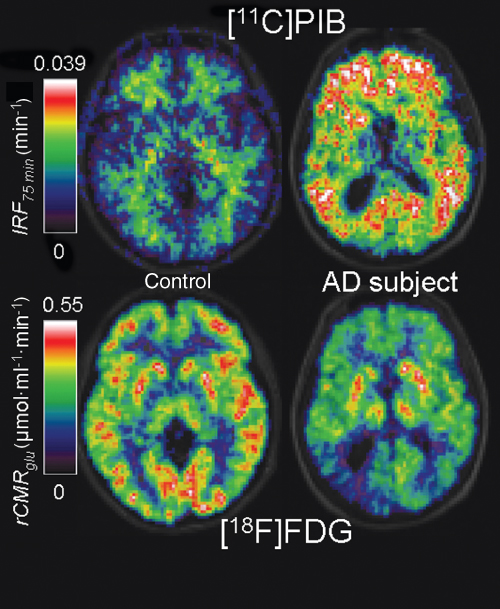
Figure 7.10 Dementia imaging with PET. Depicted are transaxial slices from an elderly healthy control subject (on the left) and a patient with Alzheimer's disease (AD) (on the right) superimposed onto a structural MR image in grayscale. The scans were performed with the Pittsburgh Compound-B or [11C]PIB, a marker of the brain amyloid load, and with fluorodeoxyglucose or [18F]FDG to measure rCMRglu. The parametric images were generated with spectral analysis, a technique that calculates the values of the unit Impulse Response Function (IRF) voxel by voxel (Cunningham and Jones, 1993). The IRF at 75 min is a measure of [11C]PIB retention in tissue, providing maximal discrimination between controls, with only some signal in white matter, and AD subjects, with high intensity signal throghout the cortical white matter (top row). A typical pattern of [18F]FDG hypometabolism, in particular, in the temporoparietal cortex, distinguishes the AD subject from the control (bottom row).
7.4.1.2 Neurotransmitter Systems
Owing to its superior sensitivity, molecular imaging is the principal tool for performing studies of the neurotransmitter systems in the living human brain. A wide spectrum of imaging probes has been developed for both the excitatory and the inhibitory systems (Table 7.2). γ-Aminobutyric Acid (GABA) is the main inhibitory neurotransmitter that hyperpolarizes the postsynaptic membranes at the inhibitory synapses. On the other hand, excitatory neurotransmitters, for example, dopamine, depolarize the postsynaptic membrane at the excitatory synapses.
Table 7.2 Brain neurotransmitter systems with example imaging markers
| Neurotransmitter System with Target | Tracer |
| Dopaminergic System | |
| Dopamine synthesis | [18F]6-Fluoro-l-DOPA [18F]6-Fluoro-l-m-tyrosine |
| Dopamine transporter | [11C]PE2I [99mTc]TRODAT-1 [123I]FP-CIT [123I]PE2I |
| Striatal dopamine D2/D3 receptors | [11C]Raclopride [123I]IBZM |
| Extrastriatal dopamine D2/D3 receptors | [11C]FLB457 [123I]Epidepride |
| Striatal and extrastriatal dopamine D2/D3 receptors | [11C]Fallypride |
| D1 receptors | [11C]SCH23390 [11C]NNC 112 |
| Serotonergic System | |
| Serotonin transporter | [123I]β-CIT [11C]( + )McN-5652 [11C]DASB |
| Serotonin 5-HT1A receptors | [11C]WAY-100635 [18F]MPPF |
| Serotonin 5-HT2A receptors | [18F]Setoperone [18F]Altanserin [11C]MDL 100,907 [123I]5-I-R91150 |
| Other Systems | |
| Opiod receptors (several subtypes) | [11C]Carfentanil [11C]Diprenorphine [18F]Cyclofoxy |
| γ-Aminobutyric acid GABAA receptors | [11C]Flumazenil [123I]Iomazenil |
| Peripheral benzodiazepine binding site | [11C]PK11195 [11C]DPA-713 |
| Neurokinin NK1 receptors | [11C]GR205171 [18F]SPA-RQ |
| Histamine H1 receptors | [11C]Doxepine |
| Adenosine A1 receptors | [18F]CPFPX |
| Adenosine A2A receptors | [11C]SCH442416 [11C]TMSX |
| Norepinephrine NET transporter | [11C]MeNER |
| Muscarinic cholinergic receptors, M2 subtype | [18F]FP-TZTP |
| Nicotinic acetylcholine receptors (nAChR0), α4β2 subunit | [11C]Nicotine 2-[18F]F-A-85380 [123I]5-IA-85380 |
| Acetylcholinesterase activity | [11C]PMP [11C]MP4A |
| Monoamine oxidase type A (MAO-A) | [11C]Clorgyline [11C]-Deuterium-clorgyline |
| Monoamine oxidase type B (MAO-B) | [11C]l-Deprenyl [11C]l-Deuterium-deprenyl |
| Vesicular monoamine transporter 2 (VMAT2) | [11C]DTBZ |
| N-methyl-d-aspartate (NMDA) receptor | [123I]CNS-1261 |
aThis list comprises mostly tracers that have been used in human clinical research
For many steps of the neurochemistry chain of neurotransmitter systems, for example, neurotransmitter synthesis from precursor, neurotransmitter storage and release, the interaction of neurotransmitter with the receptors, and the reuptake of the neurotransmitter into the presynaptic terminal or the metabolic breakdown of the neurotransmitter, imaging biomarkers have been used. A field that has been particularly intensely studied with PET and SPECT is neuroreceptor imaging. One of the typically asked questions is whether there is a group difference in neuroreceptor binding, for example, between gender- and age-matched healthy control subjects and a cohort of patients.
Another application of tracer imaging is the in vivo measurement of brain receptor occupancy by drugs. For example, the central occupancy by antipsychotic and antidepressant drugs has been studied in relationship to the administered dose, plasma concentration, and clinical response.
PET investigations demonstrated that the occupancy of dopamine D2/D3 receptors correlates better with the plasma concentration than with the doses of the antipsychotics. From analysis of the clinical effects, it was established that 60–70% dopamine receptor occupancy is required to effectively treat the positive symptoms of schizophrenia (Farde et al., 1988). Furthermore, extrapyramidal side effects were associated with higher occupancies of 80% or more. These findings subsequently led to an improvement of the treatment
of patients with antipsychotics such as clozapine, haloperidol, risperidone, perphenazine, and olanzapine.
7.4.1.3 Metabolic and Other Processes
As the main energy substrate for the brain is glucose, a lot of effort has been spent on imaging studies of glucose metabolism, predominantly using [18F]FDG. Virtually in all brain disorders, rCMRglu measurements have been performed over the last 30 years; a comprehensive review can be found in Herholz et al. (2004). As an example, the lower part of Figure 7.10 illustrates the characteristic pattern of glucose hypometabolism in the temporal and parietal cortex obtained in subjects with Alzheimer's Disease (AD) dementia.
Another enzymatic system that has been the subject of a number of quantitative tracer imaging studies not only in brain but also in peripheral organs such as the lungs is that of Monamine Oxidase MAO (Fowler et al., 1996). The enzyme MAO plays a major role in controlling the levels of neurotransmitters, amines, and drugs. There are two MAO subtypes, MAO-A and MAO-B, with different specificities for the endogenous amines, for which irreversible inhibitors have been radiolabeled with 11C as imaging markers (Table 7.2). By substituting the hydrogen with deuterium in the carbon–hydrogen bond of [11C]clorgyline and [11C]l-deprenyl, the isotope effect was exploited to improve the properties of the radiotracer.
Two of the hallmark pathological features of AD are amyloid plaques and neurofibrillary tangles in the brain. Neuropathological dyes such as Congo red have been used for a long time for postmortem staining of human brain tissue samples. Attempts to develop radiolabeled in vivo imaging markers have been hampered by the poor brain penetration of most of these compounds. Just recently, a 11C-labeled thioflavin T derivate called [11C]6-OH-BTA-1, or more commonly [11C]PIB for “Pittsburgh Compound-B,” and a hydrophobic radiofluorinated derivative of 2-{1-[6-(dimethylamino)-2-naphthyl]ethylidene} malononitrile, named [18F]FDDNP, brought the breakthrough to human imaging studies involving large subject cohorts and longitudinal follow-up of patients (Nordberg, 2004). The example data from [11C]PIB scans of an elderly control subject and an AD patient, shown in the upper part of Figure 7.10, illustrate the huge qualitative difference, making the imaging agent a quasi binary marker of amyloid deposition with an “OFF” (low cortical gray matter signal) and an “ON” (high cortical gray matter signal) state. Ongoing studies investigate the usefulness of PET imaging for the early and potentially specific diagnosis of AD and the effects of treatment with antiamyloid agents (de Leon et al., 2007).
Imaging studies have been performed to study the function of efflux pump systems. Active efflux is a mechanism responsible for extrusion of toxic substances and antibiotics outside the cell. The transporter hypothesis states that the efflux pump systems contribute to the phenomenon of multidrug resistance, that is, the lack of effectiveness of drug treatment in diseases such as epilepsy and cancer in certain patients, which can be attributed to an overexpression of efflux transport systems in those individuals.
P-glycoprotein (Pgp) is an efflux pump with broad substrate specificity that is extensively distributed and expressed in normal cells such as those lining the intestine, liver cells, and capillary endothelial cells comprising the BBB. Verapamil, a substatrate for Pgp, has been radiolabeled with 11C and is used as an imaging agent for Pgp function.
7.4.2 Cardiology
The applications of molecular imaging in cardiology range over a wide spectrum from atherosclerosis over myocardial ischemia, myocardial viability, heart failure, and gene therapy, to stem cell transplantation (Wu et al., 2007). Here, only a few examples can be highlighted.
Measurements of Myocardial Blood Flow (MBF) are performed with [15O]H2O, [13N]NH3 or 82Rb in PET or with [99mTc]sestamibi in SPECT. From the MBF measurements under two conditions, at rest and under stress, the coronary flow reserve is calculated.
The heart utilizes various sources for energy production, such as glucose, free fatty acids, lactate, and ketones. Under aerobic and fasting conditions, the heart primarily uses free fatty acids because their degradation yields an abundance of energy-rich phosphates. Ischemia causes a shift of myocardial metabolism from fatty acids to glucose. [18F]FDG is widely used for imaging cardiac glucose metobolism. Several fatty acids have been labeled with the single-photon emitter 123I, for example, β-methyl-p-[123I]iodophenyl-pentadecanoic acid. But only straight-chain fatty acids that are labeled in the C-1 position accurately reflect physiologic oxidation, because all other carbons in the chain can undergo other metabolic fates. For quantitative measurements of metabolism with PET, fatty acids such as acetate and palmitate have been labeled with 11C in this position.
One of the key applications of tracer imaging in cardiology are studies to distinguish viable from nonviable tissue in patients with ischemic cardiomyopathy. By measuring MBF and glucose metabolism in dysfunctional myocardium with PET, Tillisch et al., (1986) demonstrated that recovery of myocardial function after surgical revascularization coincided with either preserved perfusion/metabolism or reduced perfusion and preserved metabolism, as from the underlying pathophysiology these combinations reflect stunned and hibernating myocardium. On the other hand, the concordant reduction of perfusion and metabolism is indicative of scar tissue.
As in neuroscience, tracer imaging studies are also performed for evaluation of receptors in heart and lung tissue. In Table 7.3 a short list of tracers is given. As an example, Figure 7.11 shows images from a self-inhibition study with [11C]GB67, a ligand for cardiac α1-adrenoceptors.
Figure 7.11 Cardiac receptor study. In an anesthetized pig, scans with [11C]GB67, a ligand for cardiac α1-adrenoceptors, were performed after measuring the blood volume with [15O]CO, which is shown in grayscale. The baseline scan was acquired with the tracer alone, the blocked scan started 20 min after the administration of 0.12 μmol·kg−1 body weight of unlabeled GB67. This dose led to a significant reduction of [11C]GB67 binding in the myocardial wall (on the image visible around the left ventricle). The mostly nonspecific binding of [11C]GB67 in the lungs remained largely unaffected by predosing with the cold compound.
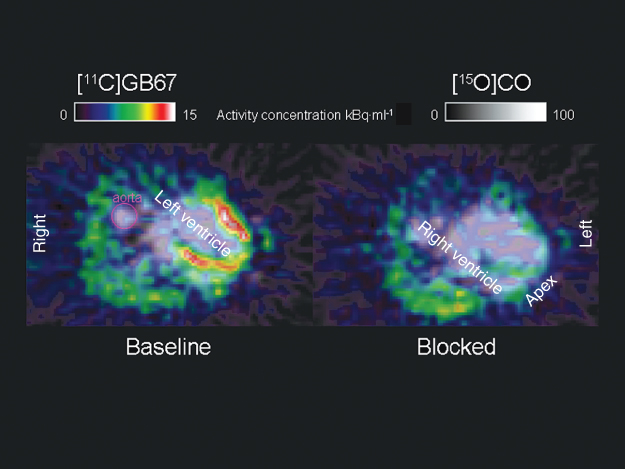
Table 7.3 Imaging examples for the nervous system in the heart and the lung
| Neurotransmitter System with Target | Tracer |
| Nonselective β-adrenoceptor | [11C]CGP-12177, [11C]CGP-12388, [18F]CGP-12388, [18F]fluorocarazolol |
| Cardiac α1-adrenoceptor | [11C]GB67 |
| Peripheral muscarinic receptors | [11C]MQNB, [11C]-VC002 |
| Tracers for mapping cardiac sympathetic neurons | [123I]MIBG, [11C]HED |
7.4.3 Oncology
Today, oncology is one of the major drivers behind the developments in molecular imaging. The complex molecular biology, biochemistry, immunology, pathology, and physiology of cancer demand a wide spectrum of imaging biomarkers that can only be briefly mentioned here. The following subsections go through the key processes targeted by molecular imaging probes.
7.4.3.1 Angiogenesis
The formation of new blood vessels via the proliferation of endothelial and muscle cells is known as angiogenesis and is an essential component of the metastatic pathway. Antiangiogenic drugs, for example, Vascular Endothelial Growth Factor (VEGF) inhibitors, are investigated for their therapeutic potential. Tracer imaging is used to provide quantitative measurements of tumor perfusion and vascular volume. Clinical feasibility of these techniques has been demonstrated in several studies with antiangiogenic and vascular disruptive agents (Laking et al., 2006).
7.4.3.2 Proliferation
The increase in cell number by division is also referred to as cell proliferation. By synthesizing DNA during the S phase of the cell cycle, proliferating cells differ from cells at resting state. Therefore, measuring cell proliferation is widely seen as a target for differentiating between benign tissue and malignant tissue, for measuring the aggressiveness of a tumor, and for trying to evaluate the early response in therapy.
To provide a method for measuring human tumor proliferation in vivo, a number of radiotracers have been developed, for example, 2-[11C]thymidine, and compared with well-established immunohistochemical measures of tumor proliferation, such as the Ki-67 index. Among those candidates, [18F]-fluoro-3′-deoxy-3′-l-fluorothymidine or [18F]FLT appears the currently most widely used tracer to image cell proliferation (Been et al., 2004). However, care is required when interpreting [18F]FLT data, as they do not always reflect the cell proliferation rate because [18F]FLT is a substrate of Thymidine Kinase 1 (TK1), and TK1 activity and the S phase fraction of cells are not always correlated, in particular, after treatment with certain chemotherapeutic agents.
7.4.3.3 Hypoxia
Sensitivity of cells to conventional radiation is higher in the presence of oxygen, and even a small proportion of hypoxic cells within a tumor reduces the response to radiation therapy. Measurements of hypoxia are performed with oxygen electrodes, however, their invasiveness could be overcome with suitable imaging biomarkers (Padhani et al., 2007).
The hypoxic cell sensitizer misonidazole (MISO) has been radiolabeled with 18F, 123I, and 99mTc for the evaluation of tumor hypoxia. This compound is reduced enzymatically and trapped within hypoxic cells, but the uptake of FMISO in hypoxic tissues remains relatively low. Alternatively, [60Cu] ATSM is assessed as a putative marker for delineating the extent of hypoxia within tumors with PET.
7.4.3.4 Apoptosis
Programmed cell death or apoptosis occurs during the treatment of tumors with radiation or anticancer drugs. Assessment of apoptosis is a useful tool for the evaluation of disease progression or regression during anticancer therapy. However, these assessments are currently done by immunohistochemical or flow cytometric analysis of tissue samples. For imaging apoptosis in vivo, annexin V, which binds to phosphatidylserine on the surface of apoptotic cells, has been labeled with 99mTc for SPECT and 124I for PET and used in animal models (Keen et al., 2005).
7.4.3.5 Receptor Imaging
Many malignancies are characterized by an overexpression of receptors. It is hoped that receptor imaging in oncology provides more tumor-specific information than the measurement of the rates of glucose metabolism or protein synthesis. For example, most endocrinal tumors overexpress somatostatin-subtype receptors such that [68Ga]DOTATOC and [111In]DTPAOC have been used for imaging these tumors with PET and SPECT. Imaging of estrogen receptors with [18F]fluoroestradiol has been performed in primary and metastatic breast cancer (Mintun et al., 1988). The overexpression of folate receptors on many cancer tissues can be exploited for PET imaging with folic acid derivative labeled with 18F.
7.4.3.6 Imaging Gene Therapy
Different approaches for treating cancer by introducing genes into tumor cells are under investigation. For imaging therapeutic gene expression, “direct” and “indirect” imaging strategies are pursued. If the therapeutic protein substrate can be radiolabeled, then the specific expression of that protein can be directly imaged. In the indirect imaging approach, the therapeutic gene is coupled to a reporter gene, which is then tracked by SPECT or PET.
As an example, the herpes simplex virus type-1 thymidine kinase (HSV-1-tk) gene has been used as a reporter gene for which radiolabeled substrates exist. In PET, 124I-labeled FIAU is such a specific substrate for HSV-1-tk, which has been used to noninvasively monitor patients with glioblastoma who underwent HSV-1-tk suicide gene therapy (Jacobs et al., 2001). It is expected that reporter gene imaging will contribute to the optimization of the various gene therapy approaches in humans.
7.4.4 Molecular Imaging for Research in Drug Development
Molecular imaging is increasingly used to advance drug development because of its ability to study molecular pathways and physiological function. Major pharmaceutical companies have launched imaging programmes and already either set up their own facilities to perform tracer imaging studies in animals and humans or established partnerships and collaborations with academic imaging research centers.
Three main application areas are most commonly named for accelerating drug discovery with molecular imaging:
As the first two uses of molecular imaging have already been discussed in this chapter, only a few words on the third point are added. Tracer imaging is well suited to adopt the microdosing concept, which is the study of the behavior of investigational compounds in vivo at concentrations so low that they do not produce a pharmacological effect. Generic labeling techniques used in PET allow the radiolabeling of a whole range of organic compounds with positron emitters. In combination with the superior sensitivity of PET, drug distributions can be studied in humans without the need to perform a full toxicological assessment, which would otherwise be required to study the pharmacokinetics of a new compound in humans (Bergström et al., 2003).
For example, the injection of 480 MBq of a 11C-labeled compound corresponds to 1.4 pmol or 0.5 ng, assuming a relative molecular mass of 350 g mol−1. With only a very moderate specific activity of 40 GBq μmol−1, the injected amount of stable compound would still be only 4.2 μg, hence a true microdose.
7.4.5 Small Animal Imaging
Over the past years, there has been a rapid growth in the field of in vivo tracer imaging in small laboratory animals such as mice and rats (Myers and Hume, 2002). Small animal scanners are now commercially available and are often multimodality devices, such as combined SPECT/CT, PET/CT, PET/SPECT/CT, or PET/MRI systems. As before, in human whole-body applications, this allows reliable colocalization between functional and anatomical images.
Animal models, in particular genetically modified mice, are often expensive; therefore, it is beneficial to avoid traditional autoradiographic techniques and use in vivo imaging approaches. Furthermore, it reduces variability because multiple time points are obtained from the same individual instead of from a set of animals. Frequently, animals are scanned several times (e.g., prior and after intervention) and with multiple modalities. A particular challenge for the quantitative analysis of small animal imaging data is to accurately obtain the input function from very small blood samples, which are often just of a volume of a few microliters.
7.5 Acknowledgements
The author gratefully acknowledges Dr Marie-Claude Asselin's help in the preparation of the Cardiology and Oncology sections. The author thanks all the volunteers who participated in the PET studies from which data presented in this chapter originate and all former colleagues at Hammersmith, without whose invaluable help it would have been impossible to prepare this chapter.
Anger HO. Scintillation camera. Rev Sci Instrum 1958;29:27.
Been LB, Suurmeijer AJ, Cobben DC, Jager PL, Hoekstra HJ, Elsinga PH. [18F]FLT-PET in oncology: current status and opportunities. Eur J Nucl Med Mol Imaging 2004;31:1659–1672.
Bergström M, Grahnén A, Långström B. Positron emission tomography microdosing: a new concept with application in tracer and early clinical drug development. Eur J Clin Pharmacol 2003;59:357–366.
Blomqvist G. On the construction of functional maps in positron emission tomography. J Cereb Blood Flow Metab 1984;4:629–632.
Carson RE, Breier A, Bartolomeis Ade, Saunders RC, Su TP, Schmall B, Der MG, Pickar D, Eckelman WC. Quantification of amphetamine-induced changes in [11C]raclopride binding with continuous infusion. J Cereb Blood Flow Metab 1997;17:437–447.
Chievitz O, Hevesy G. Radioactive indicators in the study of phosphorus metabolism in rats. Nature 1935;136:754–755.
Cunningham VJ, Jones T. Spectral analysis of dynamic PET studies. J Cereb Blood Flow Metab 1993;13:15–23.
Cunningham VJ, Lammertsma AA. Radioligand studies in brain; kinetic analysis of PET data. Med Chem Res 1995;5:79–96.
Delforge J, Syrota A, Mazoyer BM. Identifiability analysis and parameter identification of an in vivo ligand-receptor model from PET data. IEEE Trans Biomed Eng 1990;37:653–661.
Duncan R, editor. SPECT Imaging of the Brain. Dordrecht: Kluwer Academic Publishers; 1997.
Farde L, Wiesel FA, Halldin C, Sedvall G. Central D2-dopamine receptor occupancy in schizophrenic patients treated with antipsychotic drugs. Arch Gen Psychiatry 1988;45:71–76.
Fowler JS, Volkow ND, Wang GJ, Pappas N, Logan J, MacGregor R, Alexoff D, Shea C, Schlyer D, Wolf AP, Warner D, Zezulkova I, Cilento R. Inhibition of monoamine oxidase B in the brains of smokers. Nature 1996;379:733–736.
Frackowiak RSJ, Friston KJ, Frith CD, Dolan RJ, Price CJ, Zeki S, Ashburner JT, Penny WD, editors. Human Brain Function. 2nd ed. San Diego (CA): Academic Press; 2004.
Frier M. Quality testing of radiopharmaceuticals. Hosp Pharm 2000;7:89–93.
Gjedde A. High- and low-affinity transport of D-glucose from blood to brain. J Neurochem 1981;36:1463–1471.
Herholz K, Heiss WD, Herscovitch P. NeuroPET: PET in Neuroscience and Clinical Neurology. Berlin, Heidelberg: Springer-Verlag; 2004.
Hudson HM, Larkin RS. Accelerated image reconstruction using ordered subsets of projection data. IEEE Trans Med Imaging 1994;13:601–609.
Jacobs A, Voges J, Reszka R, Lercher M, Gossmann A, Kracht L, Kaestle C, Wagner R, Wienhard K, Heiss WD. Positron-emission tomography of vector-mediated gene expression in gene therapy for gliomas. Lancet 2001;358:727–729.
Jones T. The imaging science of positron emission tomography. Eur J Nucl Med 1996;23:807–813.
Keen HG, Dekker BA, Disley L, Hastings D, Lyons S, Reader AJ, Ottewell P, Watson A, Zweit J. Imaging apoptosis in vivo using 124I-annexin V and PET. Nucl Med Biol 2005;32:395–402.
Kety SS, Schmidt CF. The nitrous oxide method for the quantitative determination of cerebral blood flow in man: theory, procedure and normal values. J Clin Invest 1948;27:476–483.
Kim EE, Yang DJ, editors. Targeted Molecular Imaging in Oncology. New York: Springer-Verlag New York, Inc; 2000.
Koepp MJ, Gunn RN, Lawrence AD, Cunningham VJ, Dagher A, Jones T, Brooks DJ, Bench CJ, Grasby PM. Evidence for striatal dopamine release during a video game. Nature 1998;393:266–268.
Kuhl DE, Edwards RQ. Cylindrical and section radioisotope scanning of the liver and the brain. Radiology 1964;83:926–938.
Laking GR, West C, Buckley DL, Matthews J, Price PM. Imaging vascular physiology to monitor cancer treatment. Crit Rev Oncol Hematol 2006;58:95–113.
Långström B, Hartvig P. GMP-three letters with many interpretations: protection of patients or killing the clinical and research applications of PET? Eur J Nucl Med Mol Imaging 2008;35:693–694.
Laruelle M, van Dyck C, Abi-Dargham A, Zea-Ponce Y, Zoghbi SS, Charney DS, Baldwin RM, Hoffer PB, Kung HF, Innis RB. Compartmental modeling of iodine-123-iodobenzofuran binding to dopamine D2 receptors in healthy subjects. J Nucl Med 1994;35:743–754.
de Leon MJ, Mosconi L, Logan J. Seeing what Alzheimer saw. Nat Med 2007; 13:129–131.
Logan J, Fowler JS, Volkow ND, Wolf AP, Dewey SL, Schlyer DJ, MacGregor RR, Hitzemann R, Bendriem B, Gatley SJ, Christman DR. Graphical analysis of reversible radioligand binding from time-activity measurements applied to [N-11C-methyl]-(-)-cocaine PET studies in human subjects. J Cereb Blood Flow Metab 1990;10:740–747.
Mintun MA, Raichle ME, Kilbourn MR, Wooten GF, Welch MJ. A quantitative model for the in vivo assessment of drug binding sites with positron emission tomography. Ann Neurol 1984;15:217–227.
Mintun MA, Welch MJ, Siegel BA, Mathias CJ, Brodack JW, McGuire AH, Katzenellenbogen JA. Breast cancer: PET imaging of estrogen receptors. Radiology 1988;169:45–48.
Myers R, Hume S. Small animal PET. Eur Neuropsychopharmacol 2002;12:545–555.
Natterer F, Wübbeling F. Mathematical Methods in Image Reconstruction, Series: Monographs on Mathematical Modeling and Computation No. 5. Philadelphia: Society for Industrial and Applied Mathematics (SIAM); 2001.
Nordberg A. PET imaging of amyloid in Alzheimer's disease. Lancet Neurol 2004;3:519–527.
Padhani AR, Krohn KA, Lewis JS, Alber M. Imaging oxygenation of human tumours. Eur Radiol 2007;17:861–872.
Patlak CS, Blasberg RG. Graphical evaluation of blood-to-brain transfer constants from multiple-time uptake data. Generalizations. J Cereb Blood Flow Metab 1985;5:584–590.
Patlak CS, Blasberg RG, Fenstermacher JD. Graphical evaluation of blood-to-brain transfer constants from multiple-time uptake data. J Cereb Blood Flow Metab 1983;3:1–7.
Phelps ME, Mazziotta J, Schelbert HR, editors. Positron Emission Tomography and Autoradiography: Principles and Applications for the Brain and Heart. New York: Raven Press; 1986.
Reader AJ, Julyan PJ, Williams H, Hastings DL, Zweit J. EM algorithm resolution modeling by image-space convolution for PET reconstruction. IEEE Trans Nucl Sci 2003;50:1392–1397.
Reivich M, Kuhl D, Wolf A, Greenberg J, Phelps M, Ido T, Casella V, Fowler J, Hoffman E, Alavi A, Som P, Sokoloff L. The [18F]fluorodeoxyglucose method for the measurement of local cerebral glucose utilization in man. Circ Res 1979;44:127–137.
Shepp LA, Vardi Y. Maximum likelihood reconstruction for emission tomography. IEEE Trans Med Imaging 1982;1:113–121.
Sokoloff L, Reivich M, Kennedy C, Des Rosiers MH, Patlak CS, Pettigrew KD, Sakurada O, Shinohara M. The [14C]deoxyglucose method for the measurement of local cerebral glucose utilization: theory, procedure, and normal values in the conscious and anesthetized albino rat. J Neurochem 1977;28:897–916.
Tillisch J, Brunken R, Marshall R, Schwaiger M, Mandelkern M, Phelps M, Schelbert H. Reversibility of cardiac wall-motion abnormalities predicted by positron tomography. N Engl J Med 1986;314:884–888.
Valk PE, Bailey DL, Townsend DW, Maisey MN, editors. Positron Emission Tomography: Basic Science and Clinical Practice. London: Springer-Verlag; 2003.
Wagner HN Jr, Burns HD, Dannals RF, Wong DF, Långström B, Duelfer T, Frost JJ, Ravert HT, Links JM, Rosenbloom SB, Lukas SE, Kramer AV, Kuhar MJ. Imaging dopamine receptors in the human brain by positron tomography. Science 1983;221(4617):1264–1266.
Wu JC, Bengel FM, Gambhir SS. Cardiovascular molecular imaging. Radiology 2007;244:337–355.