
Chapter 4
Computed Tomography
4.1 Basics
4.1.1 History
The first commercial medical X-ray Computed Tomography (CT) scanner was built in 1972 by the English engineer G.N. Hounsfield for the company EMI Ltd. as a pure head scanner with a conventional X-ray tube and a dual-row detector system moving incrementally around the patient.
It was able to acquire 12 slices, each 13 mm thick, and reconstruct the images with a matrix of 80 × 80 pixels in approximately 35 min. Figure 4.1 shows the image of the head on one of these early scanners and how it compares to the image quality of a state-of-the-art CT scanner today. Today, the whole brain can be visualized with high quality from a 10-s scan.
Figure 4.1 Development of computed tomography over time. (a) Cross-sectional image of a brain in the year 1971 and (b) the whole brain with sagital, coronal, and cross-sectional slices in the year 2007. Courtesy of Mayo Clinic, Rochester.

Until 1989 there were no principally new developments in conventional CT, although of course the performance of the CT scanners increased dramatically with the engineering progress. By then, the acquisition time for one image decreased from 300 s in 1972 to 1–2 s, slices as thin as 1 mm became possible, and the in-plane resolution increased from 3 line pairs per centimeter (lp/cm) to 10–15 lp/cm with typically 512 × 512.
As it was foreseen in the late seventies that acquisition times of mechanical CT scanners would be far too long for high quality cardiac imaging for the next years or even decades to come, a completely new technical concept for a CT scanner without moving parts for extremely fast data acquisition of 50 ms was suggested and promoted as Cardiovascular Computed Tomographic (CVCT) scanner. Later, these scanners were also called ultrafast CT scanners or, giving a hint about the scanning principle, “Electron Beam Computed Tomographic” (EBT or EBCTs) scanners. After the company “Imatron,” which originally developed and produced these systems, was acquired by one of the major CT manufacturers several years ago, the development and production of these systems was stopped. High cost and limited image quality combined with low volume coverage prevented the wide propagation of the modality.
With the introduction of slip ring technology to get power to and data off the rotating gantry, continuous rotation of the X-ray tube and the detector became possible. The possibility of continuous rotation led to the development of spiral CT scanners in the early nineties (Crawford and King, 1990; Kalender et al., 1990), a method already theoretically proposed several years before (Mori, 1986; Nishimura and Miyazaki, 1988). Thus, volume data could be acquired without the danger of mis- or double-registration of anatomical details. Images could be reconstructed at any position along the patient axis (longitudinal axis, z-axis), and overlapping image reconstruction could be used to improve longitudinal resolution. Volume data became the very basis for applications such as CT angiography (Rubin et al., 1995), which has revolutionized noninvasive assessment of vascular disease. The ability to acquire volume data was the prerequisite for the development of three-dimensional image processing techniques such as Multiplanar Reformations (MPRs), Maximum Intensity Projections (MIPs), Surface Shaded Displays (SSDs), or Volume Rendering Techniques (VRTs), which have become a vital component of medical imaging today.
Main drawbacks of single-slice spiral CT are insufficient volume coverage within one breathhold time of the patient and missing spatial resolution in z-axis due to wide collimation. With single-slice spiral CT, the ideal of isotropic resolution, that is, of equal resolution in all three spatial axes, can be achieved only for very limited scan ranges (Kalender, 1995).
Larger volume coverage in shorter scan times and improved longitudinal resolution became feasible after the broad introduction of four-slice CT systems by all major CT manufacturers in 1998 (Klingenbeck-Regn et al., 1999; McCollough and Zink, 1999; Hu et al., 2000). The increased performance allowed for the optimization of a variety of clinical protocols. Examination times for standard protocols could be significantly reduced; alternatively, scan ranges could be significantly extended. Furthermore, a given anatomic volume could be scanned within a given scan time with substantially reduced slice width. This way, for many clinical applications the goal of isotropic resolution was within reach with four-slice CT systems. Multidetector Row Computed Tomography (MDCT) also dramatically expanded into areas previously considered beyond the scope of third-generation CT scanners based on the mechanical rotation of the X-ray tube and detector, such as cardiac imaging with the addition of Electrocardiographic (ECG) gating capability enabled by gantry rotation times as low as 0.5 s (Kachelriess et al., 2000; Ohnesorge et al., 2000). Despite all these promising advances, clinical challenges and limitations remained for four-slice CT systems. True isotropic resolution for routine applications had not yet been achieved for many applications requiring extended scan ranges, since wider collimated slices (4 × 2.5 mm or 4 × 3.75 mm) had to be chosen to complete the scan within a reasonable timeframe. For ECG-gated coronary Computed Tomographic Angiographies (CTAs), stents or severely calcified arteries constituted a diagnostic dilemma, mainly because of partial volume artifacts as a consequence of insufficient longitudinal resolution (Nieman et al., 2001), and reliable imaging of patients with higher heart rates was not possible because of limited temporal resolution.
As a next step, the introduction of an eight-slice CT system in 2000 enabled shorter scan times, but did not yet provide improved longitudinal resolution (thinnest collimation 8 × 1.25 mm). The latter was achieved with the introduction of 16-slice CT (Flohr et al., 2002a; Flohr et al., 2002b), which made it possible to routinely acquire large anatomic volumes with isotropic submillimeter spatial resolution. ECG-gated cardiac scanning was enhanced by both, temporal resolution was improved by gantry rotation times as low as 0.375 s, and spatial resolution was improved (Nieman et al., 2002; Ropers et al., 2003).
The generation of 64-slice CT-systems introduced in 2004 has become the established standard in the high end segment of the market. Two different scanner concepts were introduced by different vendors: the “volume concept” pursued by GE, Philips, and Toshiba aims at a further increase in volume coverage speed by using 64 detector rows instead of 16 without changing the physical parameters of the scanner compared to the respective 16-slice version. The “resolution concept” pursued by Siemens uses 32 physical detector rows in combination with double z-sampling, a refined z-sampling technique enabled by a periodic motion of the focal spot in the z-direction, to simultaneously acquire 64 overlapping slices with the goal of pitch-independent increase of longitudinal resolution and reduction of spiral artifacts. (Flohr et al., 2004; Flohr et al., 2005a). With this scanner generation, CT angiographic examinations with submillimeter resolution in the pure arterial phase become feasible even for extended anatomical ranges. The improved temporal resolution due to gantry rotation times as low as 0.33 s has the potential to increase clinical robustness of ECG-gated scanning at higher heart rates, thereby significantly reducing the number of patients requiring heart rate control and facilitating the successful integration of CT coronary angiography into routine clinical algorithms (Leschka et al., 2005; Raff et al., 2005). Today high end single source scanners offer rotation times of as low as 0.30 s and can acquire up to 128 slices with an isotropic resolution of down to 0.3 mm (Siemens SOMATOM Definion AS + , SOMATOM Definition Edge).
In 2005, the first Dual Source Computed Tomographic (DSCT) system, that is, a CT system with two X-ray tubes and two corresponding detectors offset by 90° was introduced by Siemens (Flohr et al., 2006). The key benefit of DSCT for cardiac scanning is improved temporal resolution. A scanner of this type provides temporal resolution of a quarter of the gantry rotation time, independent of the patient's heart rate and without the need for multisegment reconstruction techniques. DSCT scanners also show promising properties for general radiology applications. First, both X-ray tubes can be operated simultaneously in a standard spiral or sequential acquisition mode, providing high power reserves when necessary. In addition, both X-ray tubes can be operated at different kilovolt settings and/or different prefiltrations, allowing dual energy acquisitions. Applications of dual energy CT include tissue characterization, calcium quantification, and quantification of the local blood volume in contrast-enhanced scans. A second generation of dual source CT scanners (SOMATOM Definition Flash) enabled further improvements in Cardiac CT and Dual Energy CT through wider detectors with 128 slices and further increased rotation speed.
4.1.2 Basic Physics and Image Reconstruction
As described in Chapter 3, the photon intensity I behind an object depends on the primary photon intensity I0, the distance d it traveled through the object, and a constant that depends on the material and the energy of the photons, the linear attenuation coefficient μ. For a homogeneous object and monoenergetic photons the physical law is a simple exponential relationship:
The fact that μ depends on the attenuating material makes it possible to distinguish materials with different attenuation coefficients. Measuring the two-dimensional distribution of the attenuation coefficients μ(x, y) or μ(r, φ) in polar coordinates is the actual goal of CT. Each projection—in CT the measurement of intensities from one direction is called projection—is a superposition of the attenuation coefficients of all materials along one ray. From Eq. (4.1) we get for a single ray, that is, a fixed angle Θ and distance ξ from the center of rotation.
or
To obtain a two-dimensional distribution of attenuation coefficients with n2 values or an image with n2 pixels we need at least n2 independently measured intensities I in equation (4.3). I0 is usually known from a calibration measurement using rays outside the actual field of measurement. For a 5122 image matrix, a minimum of 5122 = 262, 144 independent projection values are needed. If one tries to solve this problem iteratively as it was done in the early days of CT, this would result in a linear equation system of 5122 equations with 5122 unknown parameters.
For all practical purposes, this is even today not possible and therefore a numerical approach called filtered backprojection (Chapter 2) is used in all scanners to solve the problem. The applied filter or convolution kernel can be used to influence the image characteristics. For example, “sharp” kernels increase resolution and noise, whereas “soft” kernels decrease them.
The determined attenuation coefficient μ itself is an inconvenient measure, as it is not very descriptive and depends on the X-ray spectrum used. Therefore, the so-called CT value or CT number (CT#) given in Hounsfield units (HU; Chapter 2) was introduced. It is defined as
4.4 ![]()
where μwater is the attenuation coefficient of water for the respective tube voltage. It is determined by calibration measurements for each spectrum used. According to this definition, the CT value of water is zero and that of air is − 1000 HU.
Unfortunately, the attenuation coefficient does not only depend on the material but also on the energy of the photons that interact with the material. Therefore, the spectrum changes on the X-ray's path through the material. For X-ray systems, this introduces a further integration over all photon energies E in Eq. (4.2):
4.5 
This dependency is usually ignored in initial image reconstruction for all materials except water. This may result in so-called beam hardening artifacts, which can be corrected for in iterative processes. A more detailed overview of MDCT systems and image reconstruction techniques may be found in (Flohr et al., 2005b).
4.2 Instrumentation
The overall performance of an MDCT system depends on several key components. These components include the gantry, X-ray source, a high powered generator, detector and detector electronics, data transmission systems (slip rings), and the computer system for image reconstruction and manipulation.
4.2.1 Gantry
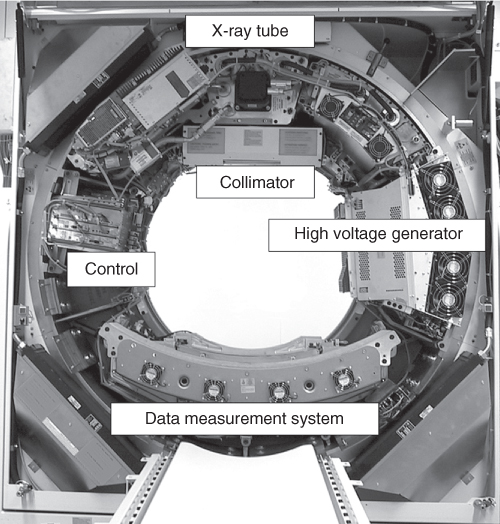
Third-generation CT scanners employ the so-called “rotate/rotate” geometry, in which both the X-ray tube and the detector are mounted onto a rotating gantry and rotated around the patient (Fig. 4.2). In an MDCT system, the detector comprises several rows of 700 and more detector elements, which cover a Scan Field of View (SFOV) of usually 50 cm. The X-ray attenuation of the object is measured by the individual detector elements. All measurement values acquired at the same angular position of the measurement system form a “projection” or “view”. Typically, 1000 projections are measured during each 360° rotation. The key requirement for the mechanical design of the gantry is the stability of both focal spot and detector position during rotation, in particular with regard to the rapidly increasing rotational speeds of modern CT systems (from 0.75 s in 1994 to 0.33 s in 2003). Hence, the mechanical support for the X-ray tube, tube collimator, and Data Measurement System (DMS) has to be designed such as to withstand the high gravitational forces associated with fast gantry rotation ( ∼ 17G for 0.42 s rotation time, ∼ 28G for 0.33 s rotation time). Rotation times of less than 0.25 s (mechanical forces >45G) appear to be beyond today's mechanical limits.
Figure 4.2 Basic system components of a modern “third-generation” CT system. First-generation systems used a collimated pencil beam and therefore required a translation of the pencil beam and the single detector element before each rotational step to scan the whole object. Second-generation scanners used a small fan beam but still required translational and rotational patterns of the X-ray source and the small detector array, whereas the fan beam of third-generation scanners covered the whole object the first time and allowed for a pure rotational motion of the tube and the detector around the patient.
4.2.2 X-ray Tube and Generator
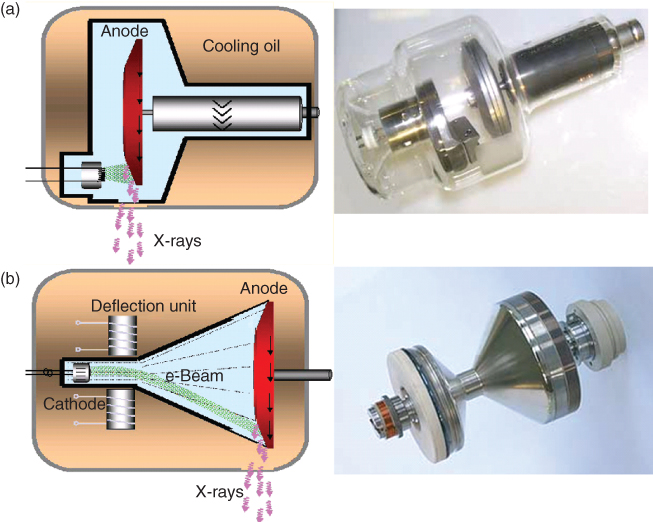
State-of-the-art X-ray tube/generator combinations provide a peak power of 55–100 kW, usually at various, user-selectable tube voltages, for example, 80, 100, 120, and 140 kV. Different clinical applications require different X-ray spectra and hence different kilovolt settings for optimal image quality and/or best possible signal to noise ratio at the lowest dose. Furthermore, the tube current (mA) can be freely selected to adjust the dose to the patient. Lower tube voltages require over-proportionately higher tube currents to achieve the same dose to the scanned object. In a conventional tube design, an anode plate of typically 160–220 mm diameter rotates in a vacuum housing (Fig. 4.3). The heat storage capacity of the anode plate and tube housing—measured in Mega Heat Units (MHU)—determines the performance level: the bigger the anode plate the larger the heat storage capacity and the more scan seconds can be delivered until the anode plate reaches its temperature limit. A state-of-the-art X-ray tube has a heat storage capacity of typically 5–9 MHU, realized by thick graphite layers attached to the backside of the anode plate. An alternative design is the rotating envelope tube (STRATON, Siemens, Forchheim, Germany, (Schardt et al., 2004)). The anode plate constitutes an outer wall of the rotating tube housing; it is therefore in direct contact with the cooling oil and can be efficiently cooled via thermal conduction (Fig. 4.3). This way, a very high heat dissipation rate of 5 MHU/min is achieved, eliminating the need for heat storage in the anode, which consequently has a heat storage capacity close to zero. Thanks to fast anode cooling, rotating envelope tubes can perform high power scans in rapid succession. Owing to the central rotating cathode, permanent electromagnetic deflection of the electron beam is needed to position and shape the focal spot on the anode. The electromagnetic deflection is also used for the double z-sampling technology of a 64-slice CT system (Flohr et al., 2004; Flohr et al., 2005a).
Figure 4.3 Schematic drawings and pictures of a conventional X-ray tube (a) and a rotating envelope tube (b). The electrons emitted by the cathode are represented by green lines; the X-rays generated in the anode are depicted as purple arrows. In a conventional X-ray tube, the anode plate rotates in a vacuum housing. Heat is mainly dissipated via thermal radiation. In a rotating envelope tube, the anode plate constitutes an outer wall of the tube housing and is in direct contact with the cooling oil. Heat is more efficiently dissipated via thermal conduction, and the cooling rate is significantly increased. Rotating envelope tubes have no moving parts and no bearings in the vacuum. (Images are not drawn to scale).
4.2.3 MDCT Detector Design and Slice Collimation
Modern CT systems use solid-state detectors in general. Each detector element consists of a radiation-sensitive solid state material (such as cadmium tungstate, gadolinium oxide, or gadolinium oxisulfide with suitable dopings), which converts the absorbed X-rays into visible light. The light is then detected by a Si photodiode. The resulting electrical current is amplified and converted into a digital signal. Key requirements for a suitable detector material are good detection efficiency, that is, high atomic number, and very short afterglow time to enable the fast gantry rotation speeds that are essential for ECG-gated cardiac imaging.
A CT detector must provide different slice widths to adjust the optimal scan speed, longitudinal resolution, and image noise for each application. With a single-slice CT detector, different collimated slice widths are obtained by prepatient collimation of the X-ray beam. For a very elementary model of a two-slice CT detector consisting of M = 2 detector rows, different slice widths can be obtained by prepatient collimation if the detector is separated midway along the z-extent of the X-ray beam.
For M > 2 this simple design principle must be replaced by more flexible concepts requiring more than M detector rows to simultaneously acquire M slices. Different manufacturers of MDCT scanners have introduced different detector designs. In order to be able to select different slice widths, all scanners combine several detector rows electronically to a smaller number of slices according to the selected beam collimation and the desired slice width.
For the four-slice CT systems introduced in 1998, two detector types have been commonly used. The fixed array detector consists of detector elements with equal sizes in the longitudinal direction. A representative example for this scanner type, the GE Lightspeed scanner, has 16 detector rows, each of them defining a 1.25-mm collimated slice width in the center of rotation (Hu et al., 2000; McCollough and Zink, 1999). The total coverage in the longitudinal direction is 20 mm at the isocenter; owing to geometrical magnification the actual detector is about twice as wide. In order to select different slice widths, several detector rows can be electronically combined to a smaller number of slices. The following slice widths (measured at the isocenter) are realized: 4 × 1.25 mm, 4 × 2.5 mm, 4 × 3.75 mm, 4 × 5 mm (Fig. 4.4a). The same detector design is used for the eight-slice version of this system, providing 8 × 1.25 mm and 8 × 2.5 mm collimated slice width.
Figure 4.4 Examples of fixed array detectors and adaptive array detectors used in commercially available MDCT systems.
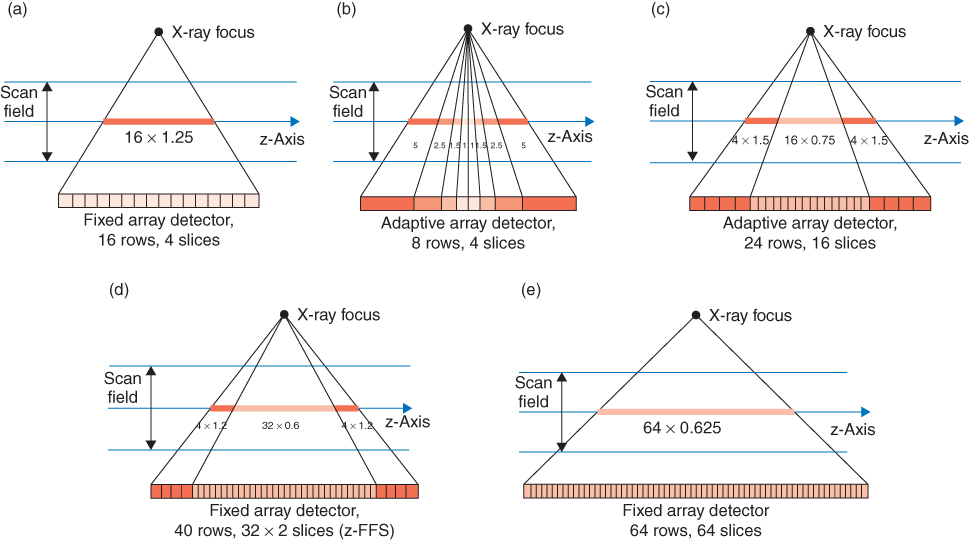
A different approach uses an adaptive array detector design, which comprises detector rows with different sizes in the longitudinal direction. Scanners of this type, the Philips MX8000 four-slice scanner and the Siemens SOMATOM Sensation 4 scanner, have eight detector rows (Klingenbeck-Regn et al., 1999). Their widths in the longitudinal direction range from 1 to 5 mm (at the isocenter) and allow for the following collimated slice widths: 2 × 0.5 mm, 4 × 1 mm, 4 × 2.5 mm, 4 × 5 mm, 2 × 8 mm, and 2 × 10 mm (Fig. 4.4b).
Sixteen-slice CT systems have adaptive array detectors in general. A representative example of this scanner type, the Siemens SOMATOM Sensation 16 scanner, uses 24 detector rows (Flohr et al., 2002a) (Fig. 4.4c). By appropriate combination of the signals of the individual detector rows, either 16 slices with 0.75 mm or 1.5 mm collimated slice width can be acquired simultaneously. The GE Lightspeed 16 scanner uses a similar design, which provides 16 slices with either 0.625 or 1.25 mm collimated slice width. Yet another design, which is implemented in the Toshiba Aquilion scanner, allows the use of 16 slices with 0.5, 1, or 2 mm collimated slice width, with a total coverage of 32 mm at the isocenter.
The Siemens SOMATOM Sensation 64 scanner has an adaptive array detector with 40 detector rows (Flohr et al., 2004). The 32 central rows define a 0.6-mm collimated slice width at the isocenter; the four outer rows on both sides define a 1.2-mm collimated slice width (Fig. 4.4d). The total coverage in the longitudinal direction is 28.8 mm. Using a periodic motion of the focal spot in the z-direction (z-flying focal spot), 64 overlapping 0.6-mm slices per rotation are acquired. Alternatively, 24 slices with 1.2 mm slice width can be obtained. Toshiba, Philips, and GE use fixed array detectors for their 64-slice systems. The Toshiba Aquilion scanner has 64 detector rows with a collimated slice width of 0.5 mm. The total z-coverage at the isocenter is 32 mm. Both the GE VCT scanner and the Philips Brilliance 64 have 64 detector rows with a collimated slice width of 0.625 mm, enabling the simultaneous readout of 64 slices with a total coverage of 40 mm in the longitudinal direction (Fig. 4.4e).
4.2.4 Data Rates and Data Transmission
With increasing number of detector rows and decreasing gantry rotation times, the data transmission systems of MDCT scanners must be capable of handling significant data rates: a four-slice CT system with 0.5 s rotation time roughly generates 1000 (projections) × 700 (detector channels) × 4 (detector rows) × 2 bytes (per detector) = 5.6 MB of data per rotation, corresponding to 11.2 MB/s; a 16-slice CT scanner with the same rotation time generates 45 MB/s; and a 64-slice CT system can produce up to 180–200 MB/s. This stream of data is a challenge for data transmission off the gantry and for real-time data processing in the subsequent image reconstruction systems. In modern CT systems, contactless transmission technology is generally used for data transfer, either laser transmission or electromagnetic transmission with a coupling between a rotating transmission ring antenna and a stationary receiving antenna. In image reconstruction, computer images are reconstructed at a rate of up to 40 images per second for a 512 × 512 matrix using special array processors.
4.2.5 Dual Source CT
A recently introduced DSCT system is equipped with two X-ray tubes and two corresponding detectors (Flohr et al., 2006). The two acquisition systems are mounted onto the rotating gantry with an angular offset of 90°. Figure 4.5 illustrates the principle. Using the z-flying focal spot technique (Flohr et al., 2004; Flohr et al., 2005a), each detector acquires 64 overlapping 0.6-mm slices per rotation. The shortest gantry rotation time is 0.33 s. The key benefit of DSCT for cardiac scanning is improved temporal resolution. In a DSCT scanner, the halfscan sinogram in parallel geometry needed for ECG-controlled image reconstruction can be split up into two quarter scan sinograms, which are simultaneously acquired by the two acquisition systems in the same relative phase of the patient's cardiac cycle and at the same anatomical level because of the 90° angle between both detectors. Details of cardiac reconstruction techniques can be found in Section 3.3.
Figure 4.5 Schematic illustration of a dual source CT (DSCT) system using two tubes and two corresponding detectors offset by 90°. A scanner of this type provides temporal resolution equivalent to a quarter of the gantry rotation time, independent of the patient's heart rate. In a technical realization, one detector (A) covers the entire scan field of view with a diameter of 50 cm, while the other detector (B) is restricted to a smaller, central field of view.
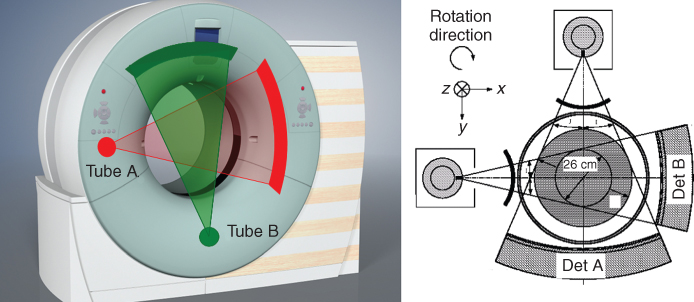
With this approach, constant temporal resolution equivalent to a quarter of the gantry rotation time, Trot/4, is achieved in a centered region of the scan field of view. For Trot = 0.33 s, the temporal resolution is Trot/4 = 83 ms, independent of the patient's heart rate.
DSCT systems show interesting properties for general radiology applications, too. If both acquisition systems are simultaneously used in a standard spiral or sequential acquisition mode, up to 160 kW X-ray peak power is available. These power reserves are beneficial not only to examine morbidly obese patients, whose number is dramatically growing in Western societies, but also to maintain adequate X-ray photon flux for standard protocols when high volume coverage speed is necessary. In addition, both X-ray tubes can be operated at different kilovolt and milliampere settings, allowing the acquisition of dual energy data. While dual energy CT was already evaluated 20 years ago (Kalender et al., 1986; Vetter et al., 1986), technical limitations of the CT scanners at those times prevented the development of routine clinical applications. On the DSCT system, dual energy data can be acquired nearly simultaneously, with subsecond scan times. The ability to overcome data registration problems should provide clinically relevant benefits. The use of dual energy CT data can in principle add functional information to the morphological information based on X-ray attenuation coefficients that is usually obtained in a CT examination.
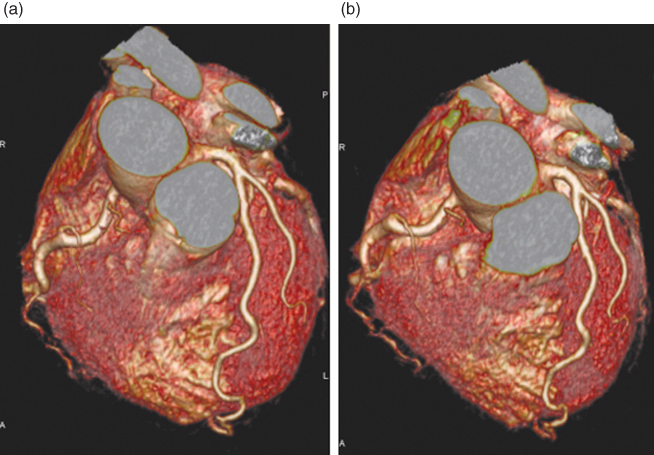
With the DSCT system, the depiction of the moving coronary artery phantom is nearly free of artifacts, thereby allowing for a reliable evaluation of the in-stent lumen. Figure 4.6 shows a clinical example to illustrate the clinical performance of DSCT for ECG-gated cardiac scanning.
Figure 4.6 Case study illustrating the clinical performance of dual source CT (DSCT) for ECG-gated cardiac imaging. VRT renderings of a 59-year-old male patient with suspicion of Right Coronary Artery (RCA) stenosis. The mean heart rate of the patient during the scan was 85 bpm. (a) Diastolic reconstruction at 65% of the cardiac cycle. (b) End systolic reconstruction at 28% of the cardiac cycle. In both cases the coronary arteries are clearly depicted with little or no motion artifacts.
4.3 Measurement Techniques
The two basic modes of MDCT data acquisition are axial and spiral (helical) scanning.
4.3.1 MDCT Sequential (Axial) Scanning
Using sequential (axial) scanning, the scan volume is covered by subsequent axial scans in a “step-and-shoot” technique. Between the individual axial scans, the table is moved to the next z-position. The number of images acquired during an axial scan corresponds to the number of active detector slices. By adding the detector signals of the active slices during image reconstruction, the number of images per scan can be further reduced and the image slice width can be increased. A scan with 4 × 1 mm collimation as an example provides either four images with 1 mm section width, two images with 2 mm section width, or one image with 4 mm section width. The option to realize a wider section by summation of several thin sections is beneficial for examinations that require narrow collimation to avoid partial volume artifacts and low image noise to detect low contrast details, such as examinations of the posterior fossa of the skull or the cervical spine.
With the advent of MDCT, axial “step-and-shoot” scanning has remained in use for only few clinical applications, such as head scanning, high resolution lung scanning, perfusion CT, and interventional applications. A detailed theoretical description to predict the performance of MDCT in the step-and-shoot mode has been given in (Hsieh, 2001).
4.3.2 MDCT Spiral (Helical) Scanning
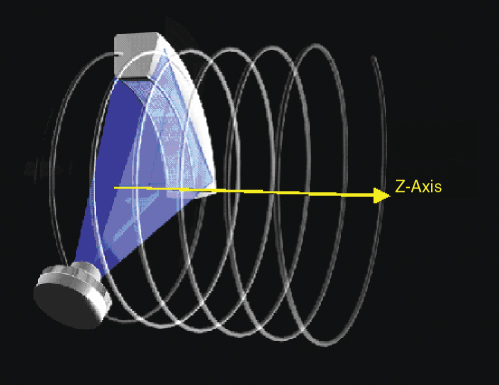
Spiral/helical scanning is characterized by continuous gantry rotation and continuous data acquisition while the patient table moves at a constant speed (Fig. 4.7).
Figure 4.7 Principle of spiral/helical CT scanning: the patient table is continuously translated while multiple rotations of scan data are acquired. The path of the X-ray tube and detector relative to the patient is a helix. An interpolation of the acquired measurement data has to be performed in the z-direction to estimate a complete CT data set at the desired image position.
4.3.2.1 Pitch
An important parameter to characterize a spiral/helical scan is the pitch p. According to IEC (International Electrotechnical Comission) specifications p is given by
![]()
This definition holds for single-slice CT as well as for MDCT. It shows whether data acquisition occurs with gaps (p > 1) or with overlap (p < 1) in the longitudinal direction. With 4 × 1 mm collimation and a tablefeed of 6 mm per rotation, the pitch is p = 6/(4 × 1) = 6/4 = 1.5. With 16 × 0.75 mm collimation and a tablefeed of 18 mm per rotation, the pitch is p = 18/(16 × 0.75) = 18/12 = 1.5, too. For general radiology applications, clinically useful pitch values range from 0.5 to 2. For the special case of ECG-gated cardiac scanning, very low pitch values of 0.2–0.4 are applied to ensure gapless volume coverage of the heart during each phase of the cardiac cycle.
4.3.2.2 Collimated and Effective Slice Width
Both single-slice and multislice spiral CT require an interpolation of the acquired measurement data in the longitudinal direction to estimate a complete CT data set at the desired plane of reconstruction. As a consequence of this interpolation, the slice profile changes from the trapezoidal, in some cases almost rectangular, shape known from axial scanning to a more bell-shaped curve (Fig. 4.8). Z-axis resolution is no longer determined by the collimated beam width scoll alone (as in axial scanning), but by the effective slice width s, which is established in the spiral interpolation process. Usually, s is defined as the Full Width at Half Maximum (FWHM) of the Slice Sensitivity Profile (SSP). The wider s gets for a given collimated beam width scoll, the more the longitudinal resolution degrades. In single-slice CT, s increases with increasing pitch (Fig. 4.9). This is a consequence of the increasing longitudinal distance of the projections used for spiral interpolation. The SSP is not only characterized by its FWHM, but by its entire shape: an SSP that has far-reaching tails degrades longitudinal resolution more than a well-defined, close to rectangular SSP, even if both have the same FWHM and hence the same effective slice width s. For a further characterization of spiral SSPs, the Full Width at Tenth Area (FWTA) is often considered in addition.
Figure 4.8 Effective slice width in spiral/helical CT: the collimated slice profile, which is a trapezoid in general, is indicated in red. The SSPs after spiral/helical interpolation are bell shaped; see the blue curves for the most commonly used single-slice approach (180-LI) at different pitch values. This approach (180-LI) relies on a projection-wise linear interpolation of direct and complementary data. In spiral/helical CT, z-axis resolution is no longer determined by the collimated slice width alone, but by the effective slice width, which is defined as the full width at half maximum (FWHM) of the SSP.
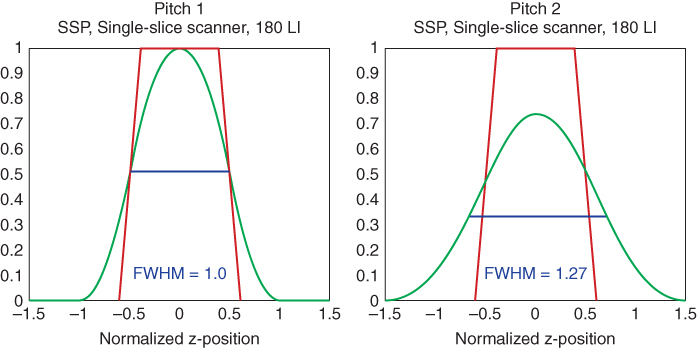
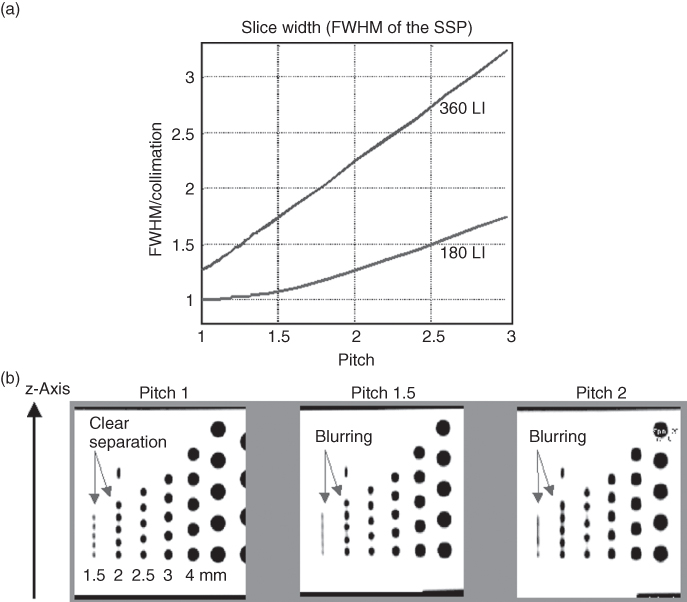
Figure 4.9 (a) FWHM of the SSP as a function of the pitch for the two most commonly used single-slice spiral interpolation approaches, 180° linear interpolation (180-LI) and 360° linear interpolation (360-LI). For both, the slice significantly widens with increasing pitch as a result of the increasing distance of the interpolation partners. (b) MPRs of a spiral z-resolution phantom scanned with 2 mm collimation (180-LI) show increased blurring of the 1.5-mm and 2-mm cylinders with increasing pitch as a consequence of the increasing effective slice width.
4.3.2.3 Multislice Linear Interpolation and z-Filtering
Multislice linear interpolation is characterized by a projection-wise linear interpolation between two rays on either side of the image plane to establish a CT data set at the desired image z-position. The interpolation can be performed between the same detector slice at different projection angles (in different rotations) or different detector slices at the same projection angle. In general, scanners relying on this technique provide selected discrete pitch values to the user, such as 0.75 and 1.5 for 4-slice scanning (Hu, 1999) or 0.5625, 0.9375, 1.375 and 1.75 for 16-slice scanning (Hsieh, 2003). The user has to be aware of pitch-dependent effective slice widths s. For low pitch scanning (at p = 0.75 using 4 slices and at p = 0.5625 or 0.9375 using 16 slices), s ∼ scoll and for a collimated 1.25-mm slice the resulting effective slice width stays at 1.25 mm. The narrow SSP, however, is achieved by conjugate interpolation at the price of increased image noise (Hu, 1999; Hsieh, 2003). For high pitch scanning (at p = 1.5 using 4 slices and at p = 1.375 or 1.75 using 16 slices), s ∼ 1.27scoll and a collimated 1.25-mm slice results in an effective 1.5- to 1.6-mm slice. To obtain the same image noise as in an axial scan with the same collimated slice width, 0.73–1.68 times the dose depending on the spiral pitch is required, with the lowest dose at the highest pitch (Hsieh, 2003). Thus, as a “take home point,” when selecting the scan protocol for a particular application, scanning at low pitch optimizes image quality and longitudinal resolution at a given collimation, yet at the expense of increased patient dose. To reduce patient dose, either milliampere settings should be reduced at low pitch or high pitch values should be chosen.
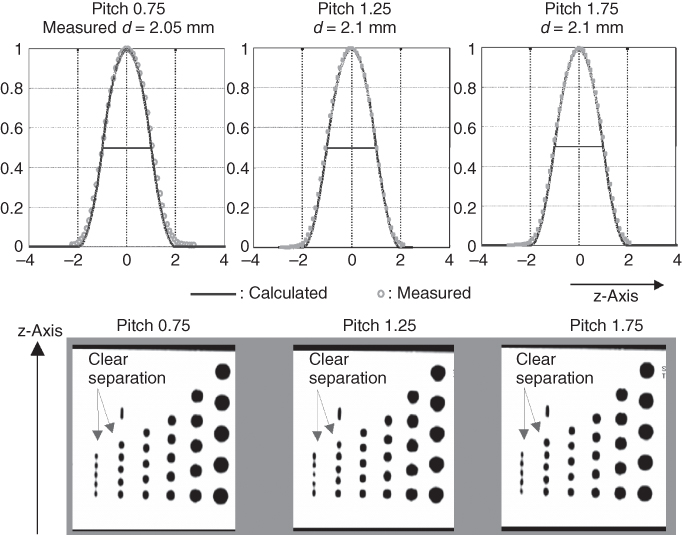
In a more advanced z-filter multislice spiral reconstruction (Taguchi and Aradate, 1998; Schaller et al., 2000), the spiral interpolation for each projection angle is no longer restricted to the two rays in closest proximity to the image plane. Instead, all direct and complementary rays within a selectable distance from the image plane contribute to the image. A representative example for a z-filter approach is the adaptive axial interpolation (Schaller et al., 2000) implemented in Siemens CT-scanners. Another example is the MUSCOT algorithm (Taguchi and Aradate, 1998) used by Toshiba. Z-filtering allows the system to trade-off z-axis resolution with image noise (which directly correlates with required dose). From the same CT, raw data images with different slice widths can be retrospectively reconstructed. Only slice widths equal to or larger than the sub-beam collimation can be obtained. With adaptive axial interpolation, the effective slice width is kept constant for all pitch values between 0.5 and 1.5 (Klingenbeck-Regn et al., 1999; Schaller et al., 2000; Fuchs et al., 2000). Therefore, longitudinal resolution is independent of the pitch (Fig. 4.10). As a consequence of the pitch-independent spiral slice width, the image noise for fixed “effective” milliampere-second (mAs) (that is mAs divided by the pitch p) is nearly independent of the pitch. For 1.25-mm effective slice width reconstructed from 4 × 1 mm collimation, 0.61–0.69 times the dose is required to maintain the image noise of an axial scan at the same collimation (Fuchs et al., 2000). Radiation dose for fixed effective mAs is independent of the pitch and equals the dose of an axial scan at the same mAs. Thus, as a “take-home point,” using higher pitch does not result in dose saving at a fixed effective mAs, which is an important practical consideration with CT systems relying on adaptive axial interpolation and the “effective” mAs concept.
Figure 4.10 Adaptive axial interpolation for a four-slice CT system: SSP of the 2-mm slice (for 4 × 1 mm collimation) at selected pitch values. The functional form of the SSP, and hence the effective slice width, are independent of the pitch. Consequently, MPRs of a spiral z-resolution phantom scanned with 2-mm slice width show clear separation of the 1.5- and 2-mm cylinders for all pitch values.
With regard to image quality, narrow collimation is preferable to wide collimation, because of better suppression of partial volume artifacts and a more rectangular SSP, even if the pitch has to be increased for equivalent volume coverage. Similar to single-slice spiral CT, narrow collimation scanning is the key to reduce artifacts and improve image quality. Best suppression of spiral artifacts is achieved by using both narrow collimation relative to the desired slice width and reducing the spiral pitch.
4.3.2.4 Three-Dimensional Backprojection and Adaptive Multiple Plane Reconstruction (AMPR)
For CT scanners with 16 or more slices, modified reconstruction approaches accounting for the cone-beam geometry of the measurement rays have to be considered: the measurement rays in MDCT are tilted by the so-called cone angle with respect to a plane perpendicular to the z-axis. The cone angle is largest for the slices at the outer edges of the detector, and it increases with increasing number of detector rows if their width is kept constant. Some manufacturers (Toshiba, Philips) use a 3D filtered backprojection reconstruction (Feldkamp et al., 1984; Grass et al., 2000; Hein et al., 2003; Wang et al., 1993). With this approach, the measurement rays are backprojected into a 3D volume along the lines of measurement, this way accounting for their cone-beam geometry. Other manufacturers use algorithms that split the 3D reconstruction task into a series of conventional 2D reconstructions on tilted intermediate image planes. A representative example is the Adaptive Multiple Plane Reconstruction (AMPR) used by Siemens (Flohr et al., 2003a; Schaller et al., 2001b). Multislice spiral scanning using AMPR in combination with the “effective” mAs concept is characterized by the same key properties as adaptive axial isnterpolation. Thus, all recommendations regarding selection of collimation and pitch that have been discussed there also apply to AMPR.
4.3.2.5 Double z-Sampling
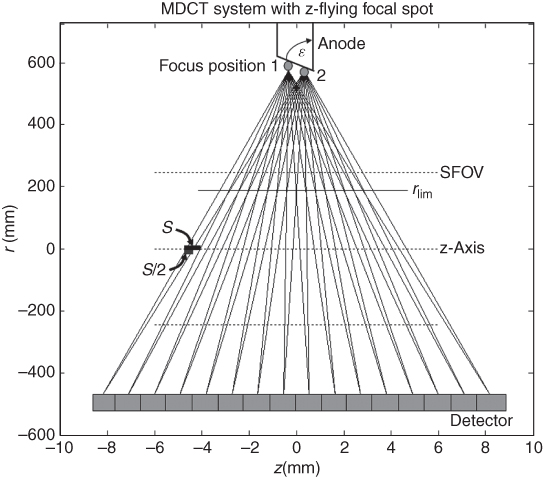
The double z-sampling concept for multislice spiral scanning makes use of a periodic motion of the focal spot in the longitudinal direction to improve data sampling along the z-axis (Flohr et al., 2004; Flohr et al., 2005a). By continuous electromagnetic deflection of the electron beam in a rotating envelope X-ray tube, the focal spot is wobbled between two different positions on the anode plate. The amplitude of the periodic z-motion is adjusted in a way that two subsequent readings are shifted by half a collimated slice width in the patient's longitudinal direction (Fig. 4.11). Therefore, the measurement rays of two subsequent readings with collimated slice width scoll interleave in the z-direction and every two M-slice readings are combined to one 2M-slice projection with a sampling distance of scoll/2.
Figure 4.11 Principle of improved z-sampling with the z-flying focal spot technique. Owing to a periodic motion of the focal spot in the z-direction two subsequent M-slice readings are shifted by half a collimated slice width scoll/2 at the isocenter and can be interleaved to one 2M-slice projection.
In the SOMATOM Sensation 64 (Siemens, Forchheim, Germany) as an example of an MDCT system relying on double z-sampling, two subsequent 32-slice readings are combined to one 64-slice projection with a sampling distance of 0.3 mm at the isocenter. As a consequence, spatial resolution in the logitudinal direction is increased, and objects <0.4 mm in diameter can be routinely resolved at any pitch (Fig. 4.12). Another benefit of double z-sampling is the suppression of spiral “windmill” artifacts at any pitch (Fig. 4.13).
Figure 4.12 Demonstration of z-axis resolution for a MDCT system using the z-flying focal spot technique. MPRs of a z-resolution phantom (high resolution insert of the CATPHAN, the Phantom Laboratories, Salem, NY, turned by 90°) in the isocenter of the scanner as a function of the pitch. Scan data has been acquired with 32 × 0.6 mm collimation in a 64-slice acquisition mode using the z-flying focal spot and reconstructed with the narrowest slice width (nominal 0.6 mm) and a sharp body kernel. Independent of the pitch, all bar patterns up to 16 lp/cm can be visualized. The bar patterns with 15 lp/cm are exactly perpendicular to the z-axis, corresponding to 0.33 mm longitudinal resolution.
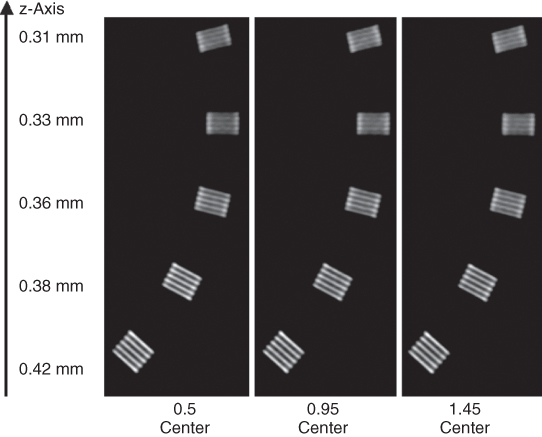
Figure 4.13 Reduction of spiral artifacts with the z-flying focal spot technique. Left: Thorax scan with 32 × 0.6 mm collimation in a 64-slice acquisition mode with z-flying focal spot at pitch 1.5. Right: Same scan, using only one focus position of the z-flying focal spot for image reconstruction. This corresponds reasonably well to evaluating 32-slice spiral data acquired without z-flying focal spot. Owing to the improved longitudinal sampling with z-flying focal spot (left) spiral interpolation artifacts (windmill structures at high contrast objects) are suppressed without degradation of z-axis resolution.
4.3.3 ECG-Triggered and ECG-Gated Cardiovascular CT
4.3.3.1 Principles of ECG-Triggering and ECG-Gating
For ECG-synchronized examinations of the cardiothoracic anatomy, either ECG-triggered axial scanning or ECG-gated spiral scanning can be used. A technical overview on ECG-controlled CT scanning may be found in (Flohr et al., 2003b).
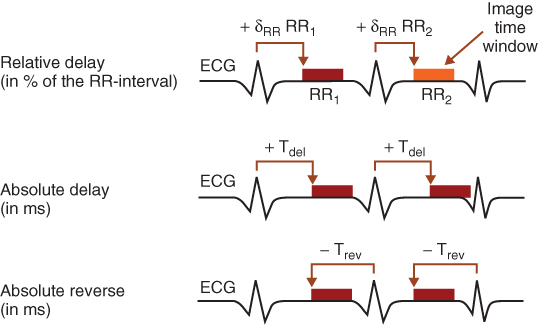
In ECG-triggered axial scanning, the heart volume is covered by subsequent axial scans in a “step-and-shoot” technique. The number of images per scan corresponds to the number of active detector slices. In between the individual axial scans the table moves to the next z-position. Owing to the time necessary for table motion, only every second heart beat can be used for data acquisition, which limits the minimum slice width to 2.5 mm with four-slice or to 1.25 mm with eight-slice CT systems if the whole heart volume has to be covered within one breath-hold period. Scan data are acquired with a predefined temporal offset relative to the R-waves of the patient's ECG-signal, which can be either relative (given as a certain percentage of the RR-interval time) or absolute (given in milliseconds) and either forward or reverse (Flohr and Ohnesorge, 2001; Ohnesorge et al., 2000) (Fig. 4.14).
Figure 4.14 Schematic illustration of absolute and relative phase setting for ECG-controlled CT examinations of the cardiothoracic anatomy.
To improve temporal resolution, modified reconstruction approaches for partial scan data have been proposed (Flohr and Ohnesorge, 2001; Ohnesorge et al., 2000), which provide a temporal resolution up to half the gantry rotation time per image in a sufficiently centered region of interest. Gantry rotation times as short as 0.4 s, 0.37 s, or even 0.33 s are offered by 16-slice and 64-slice CT systems. In this case, temporal resolution can be as good as 200 ms, 185 ms, or 165 ms.
With retrospective ECG gating, the heart volume is covered continuously by a spiral scan. The patient's ECG signal is recorded simultaneously to data acquisition to allow for a retrospective selection of the data segments used for image reconstruction. Only scan data acquired in a predefined cardiac phase, usually the diastolic phase, is used for image reconstruction (Flohr and Ohnesorge, 2001; Kachelriess et al., 2000; Ohnesorge et al., 2000; Taguchi and Anno, 2000). The data segments contributing to an image start with a user-defined offset relative to the onset of the R-waves, similar to ECG-triggered axial scanning (Fig. 4.15).
Figure 4.15 Principle of retrospectively ECG-gated spiral scanning with single-segment reconstruction. The patient's ECG signal is indicated as a function of time on the horizontal axis, and the position of the detector slices relative to the patient is shown on the vertical axis (in this example for a four-slice CT system). The table moves continuously, and continuous spiral scan data of the heart volume are acquired. Only scan data acquired in a predefined cardiac phase, usually the diastolic phase, are used for image reconstruction (indicated as red boxes). The spiral interpolation is illustrated for some representative projection angles.
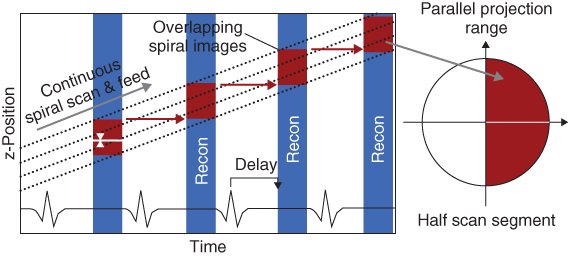
Image reconstruction generally consists of two parts: multidetector row spiral interpolation to compensate for the continuous table movement and to obtain scan data at the desired image z-position, followed by a partial scan reconstruction of the axial data segments (Fig. 4.15).
4.3.3.2 ECG-Gated Single-Segment and Multisegment Reconstruction
In a single-segment reconstruction, consecutive multislice spiral data from the same heart period are used to generate the single-slice partial scan data segment for an image (Fig. 4.15). At low heart rates, a single-segment reconstruction yields the best compromise between sufficient temporal resolution on one hand and adequate volume coverage with thin slices on the other.
The temporal resolution of an image can be improved up to Trot/(2N) by using scan data of N subsequent heart cycles for image formation in a so-called multisegment reconstruction (Cesmeli et al., 2001; Flohr and Ohnesorge, 2001; Kachelriess et al., 2000; Taguchi and Anno, 2000); Trot is the gantry rotation time of the CT scanner. With increased N, better temporal resolution is achieved but at the expense of slower volume coverage: every z-position of the heart has to be seen by a detector slice at every time during the N heart cycles. As a consequence, the larger the N and the lower the patient's heart rate, the more the spiral pitch has to be reduced. With this technique, the patient's heart rate and the gantry rotation time of the scanner have to be properly desynchronized to allow for improved temporal resolution. Depending on the relationship between the rotation time and the patient heart rate, the temporal resolution is generally not constant, but varies between one half and 1/(2N) times the gantry rotation time in an N-segment reconstruction. There are “sweet spots,” heart rates with optimal temporal resolution, and heart rates where temporal resolution cannot be improved beyond half the gantry rotation time. Multisegment approaches rely on complete periodicity of heart motion, and they encounter their limitations in patients with arrhythmia or patients with changing heart rates during examination. They may improve image quality in selected cases, but the reliability of obtaining good-quality images with N-segment reconstruction goes down with increasing N. In general, clinical practice suggests the use of one segment at lower heart rates and N ≥ 2 segments at higher heart rates (Flohr and Ohnesorge, 2001; Flohr et al., 2003b). Image reconstruction during different heart phases is feasible by shifting the start points of the data segments used for image reconstruction relative to the R-waves. For a given start position, a stack of images at different z-positions covering a small subvolume of the heart can be reconstructed because of multislice data acquisition (Flohr and Ohnesorge, 2001; Ohnesorge et al., 2000).
Prospective ECG triggering combined with “step-and-shoot” acquisition of axial slices has the benefit of smaller patient dose than ECG-gated spiral scanning, since scan data is acquired in the previously selected heart phases only. However, it does not provide continuous volume coverage with overlapping slices, and misregistration of anatomical details cannot be avoided. Furthermore, reconstruction of images in different phases of the cardiac cycle for functional evaluation is not possible. Since ECG-triggered axial scanning depends on a reliable prediction of the patient's next RR-interval by using the mean of the preceding RR-intervals, the method encounters its limitations for patients with severe arrhythmia. To maintain the benefits of ECG-gated spiral CT but reduce patient dose, ECG-controlled dose modulation has been developed (Jakobs et al., 2002). During the spiral scan, the output of the X-ray tube is modulated according to the patient's ECG. It is kept at its nominal value during a user-defined phase of the cardiac cycle, in general the mid to end -diastolic phase. During the rest of the cardiac cycle, the tube output is typically reduced to 20% of its nominal values although not switched off entirely to allow for image reconstruction throughout the entire cardiac cycle. Depending on the heart rate, dose reduction of 30–50% has been demonstrated in clinical studies (Jakobs et al., 2002).
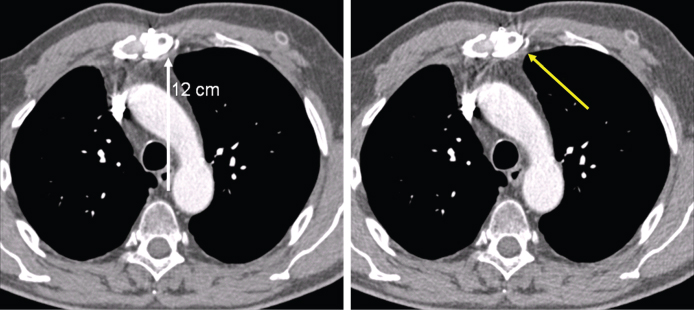
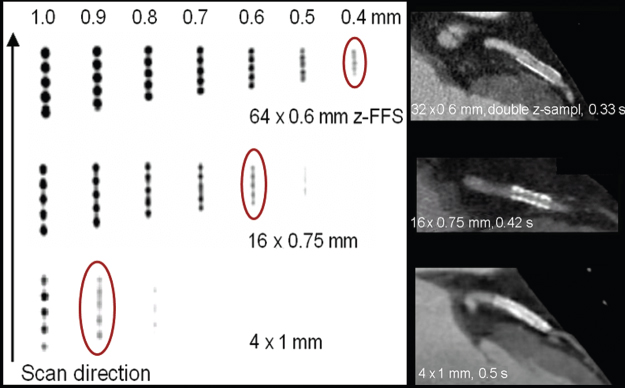
The major improvements from 4-slice to 64-slice scanners include improved temporal resolution due to shorter gantry rotation times, better spatial resolution owing to submillimeter collimation and considerably reduced examination times (Flohr and Ohnesorge, 2001; Flohr et al., 2003b) (Fig. 4.16).
Figure 4.16 Progress in longitudinal resolution for ECG-gated cardiac scanning from 4-slice CT to 64-slice CT. The four-slice CT scanner with 4 × 1 mm collimation (bottom) can resolve 0.9- to 1.0-mm objects. With 16 × 0.75 mm collimation, 0.6-mm objects can be delineated (center). The 64-slice CT scanner with 64 × 0.6 mm collimation and double z-sampling can routinely resolve 0.4-mm objects (top). The corresponding patient examples depict similar clinical situations (a stent in the proximal Left Anterior Descending Artery (LAD)). With the 64-slice system, an in-stent re-stenosis (arrow) can be evaluated. Four-slice case courtesy of Hopital de Coracao, Sao Paulo, Brasil; 16-slice case courtesy of Dr A. Küttner, Tübingen University, Germany; and 64-slice case courtesy of Dr C. M. Wong, Hong Kong, China.
4.4 Applications
4.4.1 Clinical Applications of Computed Tomography
Even though the driving force for the development of CT in the past years was cardiac CT with a strong focus on reducing temporal resolution and effective scan times, cardiac CT examinations still only account for a very small amount of all CT examinations. Figure 4.16 shows an impressive example of small and fast moving coronary arteries with a diameter of 5 mm in proximal segments down to 2 mm in distal segments depicted within state-of-the-art systems.
Of course, all traditional applications benefited from the tremendous improvements of scanner and data postprocessing technology in the past years.
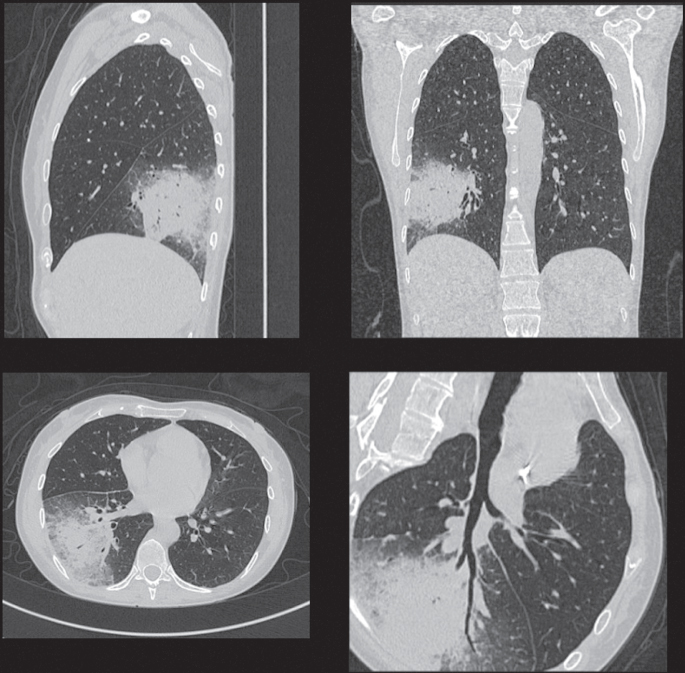
Today, CT is the technique of choice for evaluating head injury; assessing spinal, pelvic, or abdominal trauma; characterizing parenchymal lung diseases; in combination with other techniques staging of almost all solid tumors, including lymphoma; and treatment planning for most solid tumors. Figure 4.17 shows an example where CT is used for tumor staging, in this case a lymphoma.
Figure 4.17 Example of a lung scan used for tumor staging.
During the past years, CT angiography became increasingly important to depict the inner opening of blood filled structures, especially arteries. As blood itself is not clearly visible in CT images, because of its low contrast with respect to other soft tissue structures in the body, iodinated contrast material is injected intravenously for CTA examinations.
CTA is used to examine blood vessels in key areas of the body, including the abdominal aorta and arteries to the kidneys and intestines, the brain, kidneys, pelvis, legs, lungs, heart and neck. Figure 4.18 shows an example of a CTA of the abdominal aorta and the peripheral vessels displayed in VRT and an MIP.
Figure 4.18 Example of CTA of the abdominal aorta and peripheral arteries in the legs that shows strong calcifications in the MIP representation (right) and occlusions of both the femoral arteries and the thick collateral vessels that were formed to bypass that occlusion.
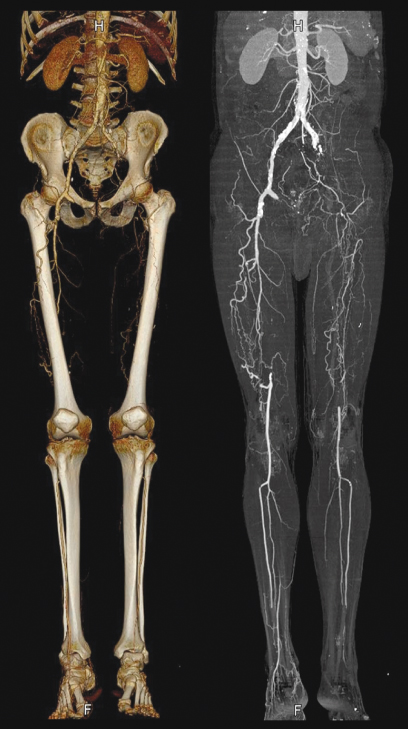
The procedure is used to identify disease and aneurysms in the aorta or in other major blood vessels; detect atherosclerosis disease in the carotid artery of the neck, which may limit blood flow to the brain and cause a stroke; identify aneurysms or arteriovenous malformation inside the brain; or detect atherosclerotic disease that has narrowed the arteries to the legs.
It can be used to diagnose disease in the renal artery or visualize blood flow to help prepare for a kidney transplant, guide surgeons making repairs to diseased blood vessels, such as implanting or evaluating a stent, detect injury to one or more arteries in trauma patients, or evaluate the details of arteries feeding a tumor before surgery.
CTA can identify dissection in the aorta or its major branches; show the extent and severity of atherosclerosis in the coronary arteries; help plan for a surgical operation, such as coronary bypass; screen individuals for arterial disease, especially patients with a family history of arterial disease or disorders; and evaluate prospective kidney donors.
In the past years, CTA became the primary choice to examine pulmonary arteries in the lungs to rule out Pulmonary Embolism (PE). This short selection of areas where CTA is used shows the wide applicability of the examination.
4.4.2 Radiation Dose in Typical Clinical Applications and Methods for Dose Reduction
Exposure of the patient to radiation during CT and the resulting potential radiation hazard has recently gained considerable attention both in the public and scientific literature (Brenner et al., 2001; Nickoloff and Alderson, 2001). Typical values for the effective patient dose of selected CT protocols are 1–2 mSv (millisievert) for a head examination, 5–7 mSv for a chest CT, and 8–11 mSv for CT of the abdomen and pelvis (McCollough, 2003; Morin et al., 2003). This radiation exposure must be appreciated in the context of the average annual background radiation, which is 2–5 mSv (3.6 mSv in the United States).
CT is considered to be a “high dose” examination because compared to a typical chest X-ray with an effective dose of approximately 0.1 mSv it exposes the patient to 20–100 times of the radiation. Moreover, because of its undoubted diagnostic benefits the percentage of CT examinations compared to other diagnostic examinations is continuously rising. In 1989, the National Radiological Protection Board in the United Kingdom showed that despite comprising only 2% of all examinations, CT contributed around 20% of the collective dose to the UK population from diagnostic X-ray imaging (Shrimpton et al., 1991). The use of CT has been steadily increasing, and more recent data indicate that CT now accounts for 40% of the collective dose to the US population from medical X-rays (Mettler et al., 2000). This is a global trend, especially pronounced in the United States where CT became the almost universal initial diagnostic tool. It must be emphasized that the dose of single CT examinations is still low compared to radiation dose ranges with proven health hazards. There is no study that can associate CT with additional cancer incidence in the examined patients. Nevertheless, even though the risk is small but not exactly known, the ALARA principle (As Low As Reasonably Achievable) must be applied in all examinations involving the exposure of patients to X-rays and there must be a clear clinical indication for the examination.
In CT, the average dose in the scan plane is best described by the weighted computerized tomographic dose index CTDIw (McCollough, 2003; Morin et al., 2003), which is determined from CTDI100 measurements both in the center and at the periphery of a 16-cm lucite phantom for head and a 32-cm lucite phantom for body. For the CTDI100 measurements, a 100-mm-long ionization chamber is used. CTDIw is a good estimate for the average patient dose as long as the patient size is similar to the size of the respective phantoms. CTDIw is defined according to the following equation (Morin et al., 2003)
![]()
CTDIw, given in milligray (mGy), is always measured in an axial scan mode. It depends on scanner geometry, slice collimation and beam prefiltration as well as on X-ray tube voltage, tube current mA, and gantry rotation time Trot.
The product of tube current in mA and Trot is the mAs value of the scan. To obtain a parameter characteristic for the scanner used, it is helpful to eliminate the mAs dependence and to introduce a normalized (CTDIw)n given in mGy per mAs:
![]()
(CTDIw)n still depends on X-ray tube voltage and on slice collimation. Both parameters are needed to specify (CTDIw)n. Scan protocols for different CT scanners should always be compared on the basis of CTDIw and never on the basis of mAs, since different system geometries can result in significant differences of the radiation dose applied at identical mAs.
To represent the dose in a spiral scan, it is essential to account for gaps or overlaps between the radiation dose profiles from consecutive rotations of the X-ray source (Morin et al., 2003). For this purpose, CTDIvol, volume CTDIw, has been introduced
![]()
where p is the spiral pitch. The factor 1/p accounts for the increasing dose accumulation with decreasing spiral pitch due to the increasing spiral overlap. In principle, this equation holds for single-slice CT as well as for MDCT. Some manufacturers such as Siemens and Philips have introduced an “effective” mAs concept for spiral/helical scanning, which includes the factor 1/p into the mAs definition:
![]()
For spiral/helical scans, (mAs)eff is indicated on the user interface. The dose of a multidetector row spiral/helical scan is simply given by
![]()
Some other manufacturers, such as Toshiba and GE, have not introduced the effective mAs concept and decided to keep the original the conventional mAs definition. When comparing the scan parameters for CT systems of different manufacturers, the underlying mAs definition has to be taken into account and the correction for pitch has to applied manually when this is not done automatically through effective mAs. This is of particular importance for scan protocols relying on very low pitch settings such as in ECG-gated cardiac CT.
CTDIw is a physical dose measure and therefore does not provide full information on the radiation risk associated with a CT examination. For this purpose, the concept of “effective dose” has been introduced by ICRP (International Commission on Radiation Protection). The effective dose is given in millisievert. It is a weighted sum of the dose applied to selective radiation-sensitive organs in a CT examination and includes both direct and scattered radiation. The weighting factors depend on the biological radiation sensitivities of the respective organs. The effective patient dose depends on the scanned range and scanned body region. For a comparison of effective dose values for different protocols or different scanner types, scan ranges should be similar.
The most important factor for reducing radiation exposure is an adaptation of the dose to patient size and weight (Donelly et al., 2001; Frush et al., 2002; Wildberger et al., 2001). This is of particular importance in pediatric imaging. Dose reduction can also be achieved by mAs reduction and lower kV settings.
Another means to reduce radiation dose is to adapt the X-ray tube voltage to the intended application. In contrast-enhanced studies, such as in CTA, the contrast to noise ratio for fixed patient dose increases with decreasing X-ray tube voltage. As a consequence, to obtain the desired contrast to noise ratio, patient dose can be reduced by choosing lower kV settings. Ideally, 80 kV should be used for CTA in order to reduce patient dose. Clinical studies (Schaller et al., 2001a) have demonstrated a potential for dose reduction of about 50% when using 80 kV instead of 120 kV for performing CTA. In reality, however, the maximum X-ray tube current available at 80 kV is generally not sufficient to scan bigger patients, which limits the routine application of this approach. Use of 100 kV appears as a suitable compromise and the method of choice for performing CTA. A recent study recommends 100 kV as the standard mode for aortoiliac CTA and reports a dose saving of 30% without loss of diagnostic information (Wintersperger et al., 2005).
An approach that finds increased implementation in clinical practice is anatomical tube current modulation. In this technique, the tube output is adapted to the patient geometry during each rotation of the scanner to compensate for strongly varying X-ray attenuations in asymmetrical body regions such as the shoulders and pelvis. The variation of the tube output is either predefined by an analysis of the localizer scan (topogram, scout view) or determined online by evaluating the signal of a detector row. With the use of this technique, dose can be reduced by 15–35% without degrading image quality, depending on the body region (Greess et al., 2000). In more sophisticated approaches, the tube output is modified according to the patient geometry not only during each rotation but also in the longitudinal direction to maintain adequate dose when moving to different body regions, for instance, from thorax to abdomen (automatic exposure control). Automatic adaptation of the tube current to patient size prevents both over- and underirradiation, considerably simplifies the clinical workflow for the technician, and eliminates the need for lookup tables of patient weight and size for adjusting the mAs settings.
4.5 Outlook
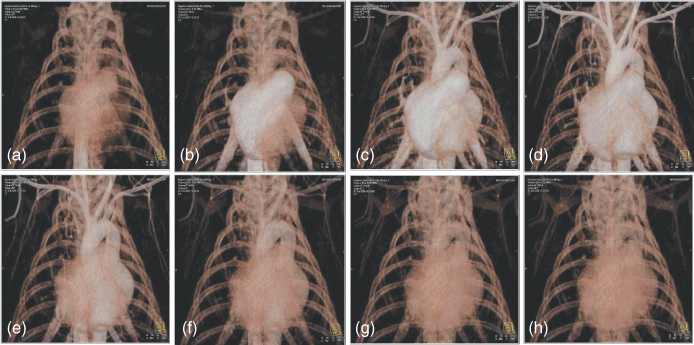
In future, the trend toward a larger number of slices will not be driven by the need to increase scan speed in spiral acquisition modes, but rather by the desire to increase volume coverage in nonspiral dynamic acquisitions, for example, by the introduction of area detectors large enough to cover entire organs, such as the heart, the kidneys or the brain, in one axial scan ( ∼ 120 mm scan range). With these systems, dynamic volume scanning will become feasible, opening up a whole spectrum of new applications, such as functional or volume perfusion studies. Area detector technology is currently under development, but no commercially available system so far fulfills the requirements of medical CT with regard to contrast resolution and fast data read-out. A scanner with 256 × 0.5 mm detector elements has been proposed by one manufacturer and appears conceptually promising, but has not left the prototype stage so far (Mori et al., 2004; Mori et al., 2006). Prototype systems by other vendors use CsI-aSi flat panel detector technology, originally used for conventional catheter angiography, which is limited in low contrast resolution and scan speed. Short gantry rotation times <0.5 s, which are a prerequisite for successful examination of moving organs such as the heart, are beyond the scope of such systems. Spatial resolution is excellent, however, because of the small detector pixel size (Gupta et al., 2006). In preclinical installations, potential clinical applications of flat-panel volume CT systems are currently being evaluated (Knollmann and Pfoh, 2003; Gupta et al., 2003). The application spectrum ranges from ultrahigh resolution bone imaging to dynamic CT angiographic studies and functional examinations. Figure 4.19 shows an example of a dynamic CTA of a living rabbit.
Figure 4.19 Study illustrating the performance of a prototype CT system with CsI-aSi flat-panel detector. Perfusion of the heart and the thoracic vasculature in a rabbit is shown; notice the evolution of first-pass contrast transit from the Inferior Vena Cava (IVC) (a) to the right side of the heart (b), to the left side (c–f), and then finally to the venous system (g, h); frame rate, 30 frames per second; tube voltage 100 kV; tube current 30 mA; time shift between subsequent images 2.5 s; rotation time 5 s. Courtesy of Dr Rajiv Gupta, MGH, Boston, USA.
The combination of area detectors that provide sufficient image quality with fast gantry rotation speeds will be a promising technical concept for medical CT systems. Yet, a potential increase in spatial resolution to the level of flat-panel CT will be associated with increased dose demands, and the clinical benefit has to be carefully considered in the light of the applied patient dose. Reduction of patient dose, in general, will remain a big topic in CT. Especially iterative reconstruction (IR) techniques will become more important in the future. IR uses iterative loops to improve image quality and lower image noise and can potentially help to reduce dose in CT and remove remaining artifacts. A detailed description of IR is beyond the scope of this book chapter.
For further reading, very useful up-to-date information regarding CT is readily available on the Internet, for example at the UK MDA CT website www.medical-devices.gov.uk or at www.ctisus.org.
Brenner D, Elliston C, Hall E, Berdon W. Estimated risks of radiation-induced fatal cancer from pediatric CT. Am J Roentgenol 2001;176:289–296.
Cesmeli E, Edic M, Iatrou M, Pfoh A. A novel reconstruction algorithm for multiphasic cardiac imaging using multislice CT. Proc SPIE Int Symp Med Imaging 2001;4320:645–654.
Crawford CR, King KF. Computed tomography scanning with simultaneous patient translation. Med Phys 1990;17:967–982.
Donelly LF, Emery KH, Brody AS. Minimizing radiation dose for pediatric body applications of single-detector helical CT: strategies at a large children's hospital. Am J Roentgenol 2001;176:303–306.
Feldkamp LA, Davis LC, Kress JW. Practical cone-beam algorithm. J Opt Soc Am A 1984;A1:612–619.
Flohr T, Ohnesorge B. Heart rate adaptive optimization of spatial and temporal resolution for ECG-gated multi-slice spiral CT of the heart. J Comput Assist Tomogr 2001;25(6):907–923.
Flohr T, Stierstorfer K, Bruder H, Simon J, Schaller S. New technical developments in multislice CT, part 1: approaching isotropic resolution with sub-mm 16-slice scanning. Röfo Fortschr Geb Rontgenstr Neuen Bildgeb Verfahr 2002a;174:839–845.
Flohr T, Bruder H, Stierstorfer K, Simon J, Schaller S, Ohnesorge B. New technical developments in multislice CT, part 2: sub-millimeter 16-slice scanning and increased gantry rotation speed for cardiac imaging. Röfo Fortschr Geb Rontgenstr Neuen Bildgeb Verfahr 2002b;174:1022–1027.
Flohr T, Stierstorfer K, Bruder H, Simon J, Polacin A, Schaller S. Image reconstruction and image quality evaluation for a 16-slice CT scanner. Med Phys 2003a;30(5):832–845.
Flohr T, Schoepf UJ, Kuettner A, Halliburton S, Bruder H, Suess C, Schmidt B, Hofmann L, Yucel EK, Schaller S, Ohnesorge B. Advances in cardiac imaging with 16-section CT-systems. Acad Radiol 2003b;10:386–401.
Flohr T, Stierstorfer K, Raupach R, Ulzheimer S, Bruder H. Performance evaluation of a 64-slice CT-system with z-flying focal spot, Röfo Fortschr Geb Rontgenstr Neuen Bildgeb Verfahr 2004;176:1803–1810.
Flohr TG, Stierstorfer K, Ulzheimer S, Bruder H, Primak AN, McCollough CH. Image reconstruction and image quality evaluation for a 64-slice CT scanner with z-flying focal spot. Med Phys 2005a;32(8):2536–2547.
Flohr TG, Schaller S, Stierstorfer K, Bruder H, Ohnesorge B M, Schoepf UJ. Multi-detector row CT systems and image-reconstruction techniques. Radiology 2005b;235:756–773.
Flohr T, McCollough C, Bruder H, Petersilka M, Gruber K, Süß C, et al. First performance evaluation of a dual-source CT (DSCT) system. Eur Radiol 2006;16:256–268.
Frush DP, Soden B, Frush KS, Lowry C. Improved pediatric multidetector body CT using a size-based color-coded format. Am J Roentgenol 2002;178:721–726.
Fuchs T, Krause J, Schaller S, Flohr T, Kalender WA. Spiral interpolation algorithms for multislice spiral CT–part 2: measurement and evaluation of slice sensitivity profiles and noise at a clinical multislice system, IEEE Trans Med Imaging 2000;19(9):835–847.
Grass M, Köhler T, Proksa R. 3D cone-beam CT reconstruction for circular trajectories. Phys Med Biol 2000;45(2):329–347.
Greess H, Wolf H, Baum U, et al. Dose reduction in computed tomography by attenuation-based on-line modulation of the tube current: evaluation of six anatomical regions. Eur Radiol 2000;10:391–394.
Gupta R, Grasruck M, Süß C, Bartling SH, Schmidt B, Stierstorfer K, Popescu S, Brady T, Flohr T. Ultra-high resolution flat-panel volume CT: fundamental (2006) principles, design architecture, and system characterization. Eur Radiol 2006;16(6):1191–205.
Gupta R, Stierstorfer K, Popescu S, Flohr T, Schaller S, Curtin HD. Temporal bone imaging using a large field-of-view rotating flat-panel CT scanner. Abstract Book of the 89th Scientific Assembly and Annual Meeting of the RSNA, Chicago 2003. p. 375.
Hein I, Taguchi K, Silver M D, Kazarna M, Mori I. Feldkamp-based cone-beam reconstruction for gantry-tilted helical multislice CT. Med Phys 2003;30(12):3233–3242.
Hsieh J. Investigation of the slice sensitivity profile for step-and-shoot mode multi-slice computed tomography. Med Phys 2001;28:491–500.
Hsieh J. Analytical models for multi-slice helical CT performance parameters. Med Phys 2003;30(2):169–178.
Hu H. Multi-slice helical CT: scan and reconstruction. Med Phys 1999;26(1):5–18.
Hu H, He HD, Foley WD, Fox SH. Four multidetector-row helical CT: image quality and volume coverage speed. Radiology 2000;215:55–62.
Jakobs TF, Becker CR, Ohnesorge B, Flohr T, Suess C, Schoepf UJ, Reiser MF. Multislice helical CT of the heart with retrospective ECG gating: reduction of radiation exposure by ECG-controlled tube current modulation. Eur Radiol 2002;12:1081–1086.
Kachelriess M, Ulzheimer S, Kalender W. ECG-correlated image reconstruction from subsecond multi-slice spiral CT scans of the heart. Med Phys 2000;27:1881–1902.
Kalender W. Thin-section three-dimensional spiral CT: is isotropic imaging possible? Radiology 1995;197:578–580.
Kalender WA, Perman WH, Vetter JR, Klotz E. Evaluation of a prototype dual-energy computed tomographic apparatus. I. Phantom studies. Med Phys 1986;13(3):334–339.
Kalender W, Seissler W, Klotz E, Vock P. Spiral volumetric CT with single-breath-hold technique, continuous transport and continuous scanner rotation. Radiology 1990;176:181–183.
Klingenbeck-Regn K, Schaller S, Flohr T, Ohnesorge B, Kopp AF, Baum U. Subsecond multi-slice computed tomography: basics and applications. Eur J Radiol 1999;31:110–124.
Knollmann F, Pfoh A. Image in cardiovascular medicine. Coronary artery imaging with flat-panel computed tomography. Circulation. 2003;107(8):1209.
Leschka S, Alkadhi H, Plass A, Desbiolles L, Grunenfelder J, Marincek B, Wildermuth S. Accuracy of MSCT coronary angiography with 64-slice technology: first experience. Eur Heart J 2005;26(15):1482–1487.
McCollough C. Patient dose in cardiac computed tomography. Herz 2003;28:1–6.
McCollough CH, Zink FE. Performance evaluation of a multi-slice CT system. Med Phys 1999;26:2223–2230.
Mettler FA Jr, Wiest PW, Locken JA, Kelsey CA. CT scanning: patterns of use and dose. J Radiol Prot 2000;20:353–359.
Mori I. Computerized tomographic apparatus utilizing a radiation source. US patent 4,630,202. 1986.
Mori S, Endo M, Obata T, Tsunoo T, Susumu K, Tanada S. Properties of the prototype 256-row (cone beam) CT scanner. Eur Radiol 2006;16(9):2100–2108.
Mori S, Endo M, Tsunoo T, Kandatsu S, Tanada S, Aradate H, et al. Physical performance evaluation of a 256-slice CT-scanner for dour-dimensional imaging. Med Phys 2004;31(6):1348–1356.
Morin R, Gerber T, McCollough C. Radiation dose in computed tomography of the heart. Circulation 2003;107:917–922.
Nickoloff E, Alderson P. Radiation exposure to patients from CT: reality, public perception, and policy. Am J Roentgenol 2001;177:285–287.
Nieman K, Cademartiri F, Lemos PA, Raaijmakers R, Pattynama PMT, de Feyter PJ. Reliable noninvasive coronary angiography with fast submillimeter multislice spiral computed tomography. Circulation 2002: 106; 2051–2054.
Nieman K, Oudkerk M, Rensing B, van Oijen P, Munne A, van Geuns R, de Feyter P. Coronary angiography with multi-slice computed tomography. The Lancet 2001;357:599–603.
Nishimura H, Miyazaki O. Temporal bone imaging using a large field-of-view rotating flat-panel CT scanner. Abstract Book of the 89th Scientific Assembly and Annual Meeting of the RSNA, Chicago 2003. p. 375.
Ohnesorge B, Flohr T, Becker C, Kopp A, Schoepf U, Baum U, Knez A, Klingenbeck Regn K, Reiser M. Cardiac imaging by means of electrocardiographically gated multisection spiral CT–initial experience. Radiology 2000;217:564–571.
Raff GL, Gallagher MJ, O'Neill WW, Goldstein JA. Diagnostic accuracy of non-invasive coronary angiography using 64-slice spiral computed tomography. J Am Coll Cardiol 2005;46(3):552–557.
Ropers D, Baum U, Pohle K, et al. Detection of coronary artery stenoses with thin-slice multi-detector row spiral computed tomography and multiplanar reconstruction. Circulation 2003;107:664–666.
Rubin GD, Dake MD, Semba CP. Current status of three-dimensional spiral CT scanning for imaging the vasculature. Radiol Clin N Am 1995;33(1):51–70 (Review).
Schaller S, Flohr T, Klingenbeck K, Krause J, Fuchs T, Kalender WA. Spiral interpolation algorithm for multi-slice spiral CT—part I: theory. IEEE Trans Med Imaging 2000;19(9):822–834.
Schaller S, Niethammer MU, Chen X, Klotz E, Wildberger JE, Flohr T. Comparison of signal-to-noise and dose values at different tube voltages for protocol optimization in pediatric CT. Abstract Book of the 87th Scientific Assembly and Annual Meeting of the RSNA, 2001a. p. 366.
Schaller S, Stierstorfer K, Bruder H, Kachelrieß M, Flohr T. Novel approximate approach for high-quality image reconstruction in helical cone beam CT at arbitrary pitch. Proc SPIE Int Symp Med Imaging 2001b;4322:113–127.
Schardt P, Deuringer J, Freudenberger J, Hell E, Knuepfer W, Mattern D, Schild M. New X-ray tube performance in computed tomography by introducing the rotating envelope tube technology. Med Phys 2004;31(9):2699–2706.
Shrimpton PC, Jones DG, Hillier MC, Wall BF, Le Heron JC, Faulkner K. Survey of CT practice in the UK. Part 2: dosimetric aspects. Report nr NRPB R249. Chilton: NRPB; 1991.
Taguchi T, Aradate H. Algorithm for image reconstruction in multi-slice helical CT, Med Phys 1998;25(4):550–561.
Taguchi K, Anno H. High temporal resolution for multi-slice helical computed tomography. Med Phys 2000;27(5):861–872.
Vetter JR, Perman WH, Kalender WA, Mazess RB, Holden JE. Evaluation of a prototype dual-energy computed tomographic apparatus. II. Determination of vertebral bone mineral content. Med Phys 1986;13(3):340–343.
Wang G, Lin T, Cheng P. A general cone-beam reconstruction algorithm, IEEE Trans Med Imaging 1993;12:486–496.
Wildberger JE, Mahnken AH, Schmitz-Rode T, Flohr T, Stargardt A, Haage P, Schaller S, Guenther RW. Individually adapted examination protocols for reduction of radiation exposure in chest CT. Invest Radiol 2001;36(10):604–611.
Wintersperger B, Jakobs T, Herzog P, Schaller S, Nikolaou K, Suess C, Weber C, Reiser M, Becker C. Aorto-iliac multidetector-row CT angiography with low kV settings: improved vessel enhancement and simultaneous reduction of radiation dose. Eur Radiol 2005;15:334–341.