
Chapter 3
X-Ray Imaging
3.1 Basics
3.1.1 History
Wilhelm Conrad Röntgen was born in Lennep (nowadays a part of Remscheid/Germany) in 1845 and grew up in Apeldoorn (Holland). From 1865 to 1868 he studied mechanical engineering in Zürich, and in 1870 moved to Würzburg. After employment in Straßburg, Hohenheim, and Gießen, he was offered a professorship in Würzburg in 1888, and in 1893 he was elected as the rector of the University of Würzburg. His primary experiments were with cathode rays, which he had studied since 1894. On November 8, 1895, late in the evening, he happened to notice that a barium-platine-cyanuere coated screen fluoresced each time he switched on the cathode ray tube (a Hittorf-Crooke tube). This fortunate observation allowed him to reach the conclusion that the radiation responsible for the fluorescence must be able to penetrate opaque materials. About six weeks later, on December 22, he took the famous X-ray of his wife Bertha's hand (Leicht, 1994; Schedel, 1995). Röntgen termed this “unknown radiation” he had discovered “X-Strahlen” (X-rays). Although this terminology was kept unchanged by the English-speaking world, the radiation is called ![]() in German and
in German and ![]() (rentgenovskoe izluenie) in Russian, to honor its discoverer.
(rentgenovskoe izluenie) in Russian, to honor its discoverer.
3.1.2 Basic Physics
X-rays are part of the electromagnetic spectrum. By definition, X-rays are photon radiation generated either by the rapid acceleration (or deceleration) of charged particles (“Bremsstrahlung,” from the German bremsen = to brake and Strahlung = radiation) or as a result of high energy transitions between the electron shells of atoms or molecules.
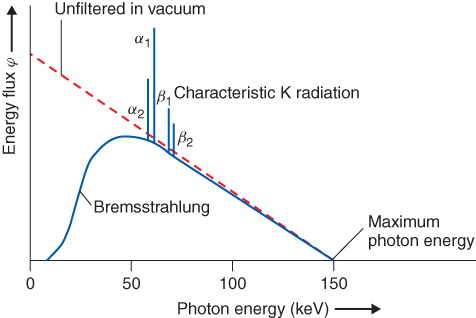
For diagnostic applications, X-rays usually are produced in X-ray tubes, in which electrons, accelerated to a certain kinetic energy using a high voltage, are shot onto a metallic target. They are decelerated mainly by the Coulomb interaction with the electron shell of the target material, and the difference in kinetic energy is emitted as electromagnetic radiation (bremsstrahlung). The intensity of bremsstrahlung is continuously distributed with a linear decrease down to the initial kinetic energy of the electrons. If the kinetic energy is sufficient to strip an electron from the inner shell of the target, an electron from the target's outer energy level may transition to this unoccupied energy level. The energy difference between the initial and final energy levels of the transitioning electron is emitted from the target's electron shell in the form of a photon. This emitted photon will have an energy characteristic of the electron shell of the target material. The contribution of this process to the energy distribution obtained from an X-ray tube (Fig. 3.1) is called the “characteristic spectrum.”
Figure 3.1 Schematic representation of a spectrum of an X-ray tube with tungsten anode operated at a high voltage of 150 kV (according to Morneburg, 1995).
When X-rays interact with matter, one part of the rays will simply penetrate it (transmission); another part will be deflected from their original direction, which can be accompanied by a change in their energy (scattering); and a third portion will be blocked by the matter and “become stuck” (absorption). In the range of photon energies that is relevant for imaging applications, the underlying processes are photoelectric effect, coherent (Rayleigh) scattering, and incoherent (Compton) scattering. All three processes contribute to the attenuation within an X-ray penetrating material. Their probabilities (which can be described with the cross sections σPE, σcoherent, and σCompton, respectively) increase with the atomic number and decrease with the photon energy, as shown in Eq. (3.1)–(3.3).
In the photoelectric effect, the energy of one X-ray photon is completely transferred to an electron within the shell of an atom in the absorbing material. If the energy of the X-ray photon exceeds the binding energy of the electron in the absorbing material, the latter leaves the atom with a kinetic energy equal to the difference between the energy of the photon and the electron's binding energy. The dependence between the cross section (which expresses the likelihood of interaction between the photon and the electron sheath), the material (represented by its density ρ and its mean atomic number Z), and the photon energy Eγ can be approximately described by Eq. (3.1)–(3.3):
The photoelectric effect, as well as Rayleigh and Compton scattering, contribute to the attenuation of X-rays. This attenuation can be described as a reduction of the intensity in the original direction of the beam by a certain percentage per amount of material through which it passes. In the simplest case, this amount of material can be described as the length or thickness d, but descriptions containing the density, the density per area, and so on, are used as well (for instance, in osteodensitometry). This attenuation law that relates the current intensity to the length (or thickness) of a zone of material and the initial intensity can be written as follows:
3.4 ![]()
where I0 is the initial intensity and I is the intensity after passing a zone of material with an attenuation coefficient μ and thickness d. Similar to the cross sections σ (Eqs (3.1)–(3.3)), μ decreases with the photon energy E and increases with the mean atomic number Z (and in our notation, with the density ρ).
The high energy part of the spectrum emitted by the tube (the “harder radiation”) will be less attenuated compared to its low energy part (“the softer radiation”), thus the term “the spectrum will be hardened”. In other words, the low energy part (the soft radiation) will contribute to the X-ray image to a lesser degree compared to the high energy part. But the softer part of the spectrum will strongly contribute to the radiation exposure of the patient, since a higher percentage of its energy will be deposited in the patient compared to harder X radiation.
3.2 Instrumentation
X-ray imaging systems consist of the following components:
- high voltage generator
- X-ray tube
- beam filter for manipulation of the X-ray spectrum
- apertures for defining of the geometrical shape of the X-ray beam
- (often) a collimation unit for preventing scattered radiation from reaching the image detector
- image detector
Depending on the field of application, these components can form devices ranging from transportable units for static or dynamic imaging, including Bucky and fluoroscopic devices, to computed tomographs (which are dealt with in Chapter 4).
3.2.1 Components
3.2.1.1 Beam Generation
As mentioned earlier, for diagnostic applications X-rays are generated by an X-ray tube, in which the electrons are accelerated in an electric field of several tens up to about 150 kV. This high voltage is provided by the high voltage generator. High frequency (up to 20 kHz) converter generators allow for high power with comparatively small transformer size and negligible ripple, an advantage with respect to minimizing the radiation exposure of patients.
The basic structure of a conventional tube can be described briefly as follows: a vacuum tube contains a filament that is heated in order to thermally emit electrons. The heating current regulates the number of released electrons, which will be proportional to the X-ray dose. Electrons travel between the cathode and the anode via the applied high voltage electric field, which ranges in energy from several tens up to about 150 kV. In this electric field, electrons are accelerated and give rise to the bremsstrahlung and the characteristic spectrum formed during their interaction with the anode material.
One important parameter that determines maximum output power, as well as spatial resolution, is the focus size on the anode. The focus size describes the area of the anode on which the X-rays are generated. Since only about 1% of the electrical power is converted to X-rays, heating of the anode is a problem that limits the amount of irradiation achievable per focus area. In medical diagnostics, most of the heat is distributed over a larger amount of anode material by the application of rotating anodes. However, in the case of exposure to a series of images (or with fluoroscopy), the important parameters are the heat capacity of the anode and the tube assembly, as well as anode cooling. They are described in heat units (HU) (Eq. 3.5)
where the voltage U is given in kilovolt peak (kVp), the mean tube current in milliamperes, and the exposure time in seconds. 1 HU is equivalent to 1 J. Equation (3.5) is valid for two-pulse generators, where the peak current is about 1.4 times the mean current. For lower ripple (three-pulse generators and better), where the peak current is nearly equal to the mean current, Eq. (3.5) has to be multiplied by a factor of 1.35.
X-rays generated at a certain depth in the anode leave its surface at different angles, and have to cover different distances within the anode material. This results in different attenuations, as well as hardening, of the beam. The resulting inhomogeneity in the intensity and mean energy is described as Heel effect.
As described earlier, photons from the low energy side of the spectrum contribute less effectively to the X-ray image than those from the high energy side. In terms of the radiation exposure of the patient, this means that low energy photons give less signal per unit of incident X-ray dose. An optimal relationship between contrast and patient dose could be achieved with monoenergetic radiation. However, the spectrum of the beam reaching the patient can be improved to a certain degree by application of appropriate beam filtering between the anode and the patient with aluminum, copper, or, in the case of mammography, even molybdenum or rhodium.
The radiation exposure the patient experiences must be limited to the region of clinical interest. For collimating the primary beam, opaque and semiopaque apertures can be positioned within the tube housing. Finally, the X-ray tube with the anode drive, part of the cooling system (often oil based), collimator, and light collimating system are enclosed in a tube shield or housing that prevents much of the radiation leakage.
3.2.1.2 Reduction of Scattered Radiation
The dominating mechanisms of interaction between diagnostic X-rays and matter are absorption via the photoelectric effect and Compton scattering. Scattering in the body of the patient results in rays that do not propagate in a direction originating at the tube focus, thus leading to blurred images. In imaging methods based on monochromatic radiation, Compton scattered photons can be recognized by their reduced energy compared to the unscattered photons. However, since the X-ray tube emits a spectral distribution, this criterion is not useful in radiological diagnostics. Here, three different approaches—all based on the different origins of scattered photons compared to the unscattered ones—can be applied (Fig. 3.2).
Figure 3.2 Reduction of scattered radiation in the image. (a) Radiation scattered in the object reaches the image detector. (b) An antiscatter grid eliminates most of the deflected photons, and part of the primary radiation, thus making it necessary to increase the patient dose. (c) Slit-scan technique. Most of the scattered radiation does not hit the detector row. (d) Increased distance between the object and the image detector leads to magnified images with a reduced portion of scattered radiation in the image and decreased geometrical sharpness.
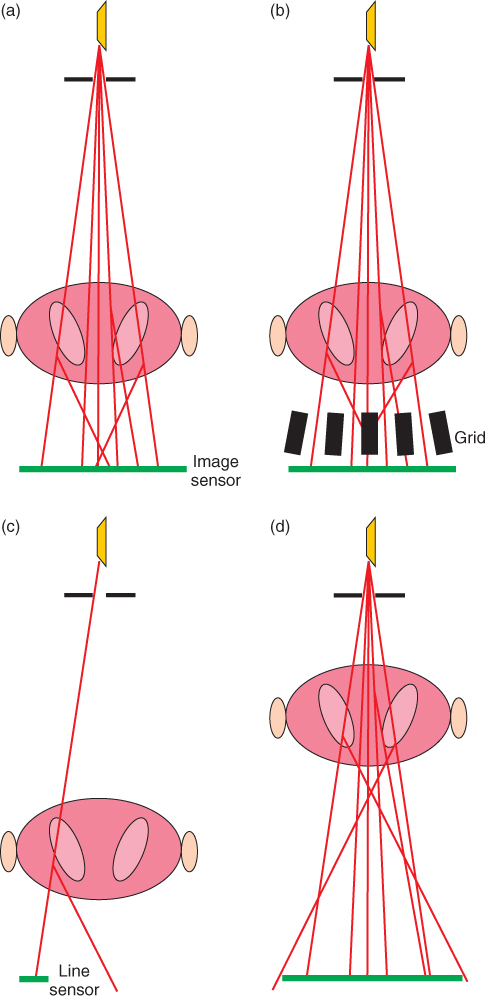
The most commonly applied method is the insertion of an antiscatter grid, which consists of absorbing lamellas, mostly arranged in parallel (occasionally also in two-dimensional orders) (Fig. 3.2b). Owing to the non-negligible cross section of these lamellas, not only unwanted scattered but also unscattered radiation will be absorbed, resulting in the need to increase the dose entering the patient in order to maintain the required detector dose. This dose increase can be on an order of magnitude from 3 to 8.
If the X-ray beam is narrowly collimated to a fan beam, and only one or a few lines of the image are registered simultaneously using a line shaped sensor (Fig. 3.2c), most of the scattered radiation passes by the sensor without the need to increase the entrance dose. The disadvantage of this method is a drastic increase in exposure time.
Increasing the distance between the object to be imaged and the image detector not only leads to magnified images but also—depending on the focus size—reduces sharpness. Magnifying the image in this manner does, however, have the inherent advantage of cutting out a significant amount of the scattered radiation, as this undesired radiation travels at an angle and will miss the image sensor (Fig. 3.2d).
Finally, since the amount of scattered radiation depends on the path length of the X-rays through the object, reducing the object thickness in several anatomic regions such as the abdomen or mammae is a way to reduce scatter, as well as entrance dose and overlay of anatomic structures.
3.2.1.3 Image Detection
The classic means of detection of X-ray images is the use of silver-bromide-based film. Owing to the low effectiveness of this medium, usually (except for the case of dental imaging) fluorescent screens are added. However, even if automated, the developing, fixation, and drying processes are quite laborious. Although in principle copies could be made, one film usually is available at exactly one place, which occasionally leads to logistic problems. This aspect, as well as technical issues, nowadays has allowed digital methods for the most part to replace the classical film-screen techniques.
Description of Image Quality
The quality of images—not only digital ones—can be described in a quantitative manner with just a few parameters and does not require too much familiarity with system theory.
The perceptibility of a structure in the image in front of a background is determined by the parameters image noise, contrast, and sharpness. Of great importance for the quality assessment of radiologic images is their Signal to Noise Ratio, SNR.
The noise is determined by the Poisson distribution of a number of independent events (e.g., the X-ray quanta registered by the image detector). For this reason, the standard deviation σ of the expected number of observed events (equal to the parameter λ of the Poisson distribution) equals the square root of the actuarial expectation, ![]() . This leads to the following equation for the SNR (Eq. 3.6)
. This leads to the following equation for the SNR (Eq. 3.6)
Of equal importance for the perception of structures in the image is the magnitude of the signal difference between the structure and the background compared to the image noise. This parameter is described by the Contrast to Noise Ratio, CNR. Here the contrast itself is used as a measure for the signal difference—a reasonable definition, as the noise contributions to SA and SB superimpose in an additive manner (Eq. 3.7):
The impact of the sharpness on the perceptibility of structures, and in particular small structures, and hence on the quality of an image B, is usually described as convolution of an object function O (in the context of this chapter a nondistorted image) with a point spread function, P, which describes the imaging properties of the device (Eq. 3.8):
In the case of an ideal distortion-free imaging system the point spread function is a δ function.
In the case of imaging systems with finite resolution, smaller structures shall always be pictured at inferior contrast. The dependence of the contrast on the size of the structures (more exactly on the spatial frequencies νx, νy along the coordinates x, y) is termed the Modulation Transfer Function (MTF). The MTF can be calculated from the point spread function as the absolute value of the corresponding Fourier transform F.
The critical frequency νmax is a measure for the minimal size of recognizable structures, and is determined by a minimum threshold value for the contrast, usually MTF(νmax) = 5%.
The perceptibility of details is determined by the spatial resolution (given by MTF) and by the image noise. In X-ray diagnostics, the latter is controlled by the dose and how effectively the dose is utilized by the imaging system. While the dose applied to the patient is controlled by the user (and minimized with regard to the actual diagnostic question), the utilization of the dose is an attribute of the system. This attribute in general also depends on the size of the structure (described by the direction-dependent spatial frequencies νx, νy). In the case of smaller structures, blurring will lead to a cross-talking event (at the entry side X-ray quanta; at the outlet impulses e.g.) to neighboring pixels on the detector. Utilization of the dose can be defined as the percentage of X-ray quanta reaching the image detector that contributes to the SNR of the image. The utilization can be described by the parameters SNRin and SNRout, because of the relationship between the number of quanta and their random variation as given by the Poisson distribution (Eq. 3.6). Considering an incremental gain G for the description of nonlinear characteristics (i.e., dose-dependent sensitivities), the Detective Quantum Efficiency, DQE, can be described by the MTF, and the noise power spectra from the incoming beam, Sf, in, and the outgoing signal, Sf, out, at the input and output sides, respectively:
3.9 ![]()
DQE is compromised by resolution power (MTF) and the utilization of the X-ray radiation ![]() , two crucial parameters of any imaging system.
, two crucial parameters of any imaging system.
In the case of analog imaging systems, for example, film-screen systems, MTF approaches zero at high spatial frequencies. Digital systems, for example, computed radiographic systems or flat panel detectors, sample the object O at a spatial frequency determined by its design. According to the sampling theorem by Nyquist and Shannon, the sampling frequency has to be at least twice the spatial frequency of the smallest structure to be imaged. Violation of the sampling theorem causes artifacts by aliasing, that is, the fundamental frequency cannot be distinguished from its harmonics. In the case of a linear grating, aliasing causes brightness variations that show up as a beat in the signal and is related to the spatial frequencies of the grating and the pixel raster.
Film and Fluorescent Screen
The classical process of detection of X-rays is the formation of metallic silver grains of about 1 μm (compared to 0.02–0.7 μm for photographic films) in silver bromide crystals embedded in gelatin layers. Since the sensitivity (the so-called speed) increases with the areal density of AgBr, the thickness of these layers is about 0.03–0.04 mm, resulting in a silver content of about 5 g m−2. The AgBr emulsion is mounted on a base that usually consists of polyester. The sensitivity of such films is quite limited, that is, rather high doses are required in order to reach a reasonable optical density. Therefore, fluorescent screens are mounted in film cassettes. Incident X-rays cause the emission of visible light, which causes additional blackening of the film. In practice, about 95% of the blackening is caused by fluorescent light and only 5% directly by the X-rays. To further improve the sensitivity of such film-screen systems, films with AgBr emulsions on both surfaces are used, as well as screens on both sides of the film.
The optical density D of an X-ray film is defined as the logarithmic ratio of incident light I0 and transmitted light I (Eq. 3.10).
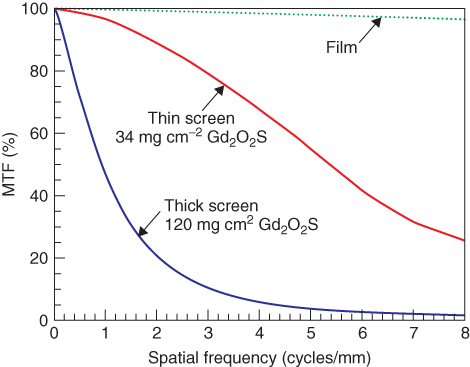
The optical density of a film depends on the energy of the incident photons and other effects, for example, the Schwarzschild effect. This holds true both with and without the application of intensifying screens. The characteristic of a film, that is, the relationship between dose and optical density, is described by an S-shaped curve. Only beyond a minimum dose is the density due to exposition able to be discriminated from the background (base and fog). On increasing the dose, the optical density depends almost linearly on the logarithm of the dose, until a saturation region (shoulder) is approached. In order to achieve an optimal exposure, the X-ray radiation dose together with the light emitted by the fluorescent foils have to be adjusted such that the object-related variability of the incident dose will be located on the linear part of the curve and hence best be transformed into a variability of the optical density. Film-screen systems of different sensitivities are available, depending on the thicknesses of both the emulsions of the film and the fluorescent screens. Owing to the varying sizes of the AgBr and phosphor crystals, as well as to different emulsion thicknesses, film-screen systems of higher sensitivity are less spatially resolving; for example, thicker layers ease the spreading of scattered light within the fluorescent screen (Fig. 3.3).
Figure 3.3 Modulation transfer function for film only as well as for films with fluorescent screen having two different thicknesses. Source: From Bushberg et al., 2002.
The sensitivity of film-screen systems (and the image detector dose used in the case of digital systems) is described by the speed, which in the case of X-ray films is defined as (Eq. 3.11)
For an estimate it can be assumed that a film-screen system of twice the speed requires only half the radiation dose for the same optical density (usually at the expense of reduced lateral resolution).
Image Intensifier
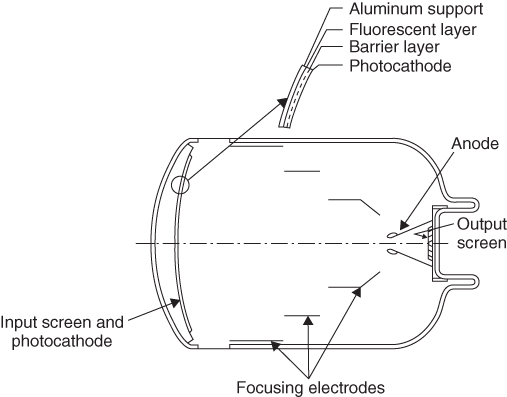
The image intensifier is the traditional receiver used to depict time-dependent processes in the human body (Fig. 3.4). It consists of a vacuum vessel. A fluorescent layer at the entry side converts X-rays into visible light. The visible light subsequently hits a photocathode, which in turn generates an amount of electrons proportional to the incident X-ray dose. The electrons are accelerated by a high voltage ranging from 25 to 35 kV and are usually focused by three focusing electrodes. The electrons gain energy in the high voltage field and generate an electron-optical copy of the initial image on the output screen, which converts it to visible light again. This visible image may now be transformed (historically by a TV camera, nowadays mainly by Charge-Coupled Device (CCD) chips) into an electronic signal. The input screen has to be bent in order to ensure a uniform voltage field gradient. However, the bent shape always causes pillow-shaped image distortions. The gain factor of an image intensifier, calculated as a ratio of the visible images on the input and output screens, is approximately 130. If the different sizes of the input and output screens are taken into consideration, the brightness gain ranges between 2500 and 7000.
Figure 3.4 Structure of an image intensifier. Source: From Hendee and Ritenour, 2002.
An important characteristic quantity of an image intensifier is the conversion factor, defined as the ratio of luminance and dose rate (Eq. 3.12).
Dose rates of new image intensifiers are between 100 and 200 Cd s mR−1 m−2. They fall continuously during the lifetime of the image intensifier. Another important characteristic quantity is the contrast ratio, which describes the ratio of the output signals when the center of the input screen is covered by a lead mask and when the input is unblocked, respectively. The contrast ratio should be in a range of 15–30. The main reason for the occurrence of a signal in the center of the input screen in spite of the lead cover is the propagation of scattered light within the output screen. Different zoom factors may be selected by simple electrostatic means, that is, by mapping a section of the input screen onto the output screen. The quantum efficiency of image intensifiers is usually inferior to flat screen detectors (see below). This inferiority is mainly caused by the aluminum cover on the input screen, which is needed for mechanical reasons.
Temporal Resolution and Signal to Noise Ratio
The SNR of an image is determined by both the number of image-forming X-ray quanta per pixel and the DQE of the imaging system. This results in a tight relationship between SNR and temporal resolution, if time-dependent phenomena are to be depicted. During fluoroscopic examinations using image intensifiers, the output image is usually calculated as a weighted average of the image intensifier signals at the current and previous times. More recent frames will be given higher weighting factors than previous ones. This procedure causes a certain lag in mobile structures in the image. An alternative approach can be chosen for pulsed irradiation (see below). Here the time resolution can be controlled by the pulse frequency and the sampling rate, which suppresses the image lag or replaces it by a controlled motion blur in the single images and/or by discontinuous movement displays.
Computed Radiography
Digital luminescence radiography, or Computed Radiography (CR), permits the registration of digital images on conventional X-ray instruments. The setup consists of a cassette-based work procedure similar to that of film-screen systems. The cassette contains a foil covered by a semiconductor material, for example, 85% BaFBr + 15% BaFI, doped with Eu. Interaction between the X-ray radiation and the semiconductor causes luminescence (luminescence releases visible light only after stimulation, in contrast to fluorescence). The X-ray quantum excites electrons from the valence band via the conducting band to trapping centers (doping-generated localized energy levels between the valence and conducting bands). Stimulation is achieved by sampling the storage foil using red laser light. These photons lift the electrons from the trapping centers into the conducting band. From there, the electrons relax via intermediate levels into the valence band. The excess energy is emitted as green light. The amount of emitted luminescence light is almost proportional to the amount of incident X-ray radiation. After reading, the storage foil is illuminated intensively again in order to transfer all possible remaining electrons from the trapping centers back into the conducting band, thus erasing all remaining image information. Afterward, the foil is ready for further X-ray recordings.
According to foil design, there are powder Imaging Plates (IPs) and needle IPs. Powder IPs are made of 3- to 10-μm phosphor grains embedded in binder. In needle IPs, the phosphor consists of needle-shaped crystals similar to those on the input screens of image intensifiers. They permit improved lateral resolution, that is, a higher cut-off frequency in the spatial domain (cf. MTF), and a superior digital quantum efficiency. In the conventional design, IPs are read sequentially pixel after pixel. The plate is moved row by row over a reading line, which in turn is scanned by laser light directed by a movable mirror. Quicker reading is achieved by reading whole rows at once. Readers of this type can be located next to the X-ray instrument, and the IP may already be read during the time it takes for the patient to be repositioned between two exposures.
Flat Panel Detectors
From the viewpoint of workflow, a more straightforward digital procedure can be achieved by application of flat panel detectors, that is, direct radiography. Three basically different designs are available for flat panel detectors, based on the direct or indirect conversion of X-rays into electrical signals. The latter is achieved by converting the X-rays into visible light by means of a scintillation layer with either a matrix of photodiodes located directly below or by light sensors coupled to the scintillator via fiber optics.
The most common implementation of flat panels employs an indirect method of detection based on a matrix of photodiodes or phototransistors on an amorphous silicon wafer, which in turn is covered by a scintillation layer (usually made of cesium iodide). Flat panel detectors of this type have wide applications in radiography devices and, for the past several years, in fluoroscopic and angiographic systems as well.
In another approach, the light emitted by the scintillator is forwarded via light-guiding fibers to CCD chips. The advantage of this design is its good value for money. The specifications concerning the DQE of such systems compared to the previously mentioned designs are nonuniform.
It should also be mentioned that pn-CCD sensors can be used without scintillators as well. With regard to the comparably low absorption of X-rays in silicon, systems of this kind can be used only at low X-ray energies (e.g., in stereotactic devices for breast diagnostics).
Typical implementations of direct conversion are selenium detectors. Initially a surface charge is deposited on the selenium layer. The charge is sustained because of the high electrical resistance of selenium. When the X-rays interact with this layer, electron–hole pairs emerge because of the inner photoelectrical effect. The electron–hole pairs moving in the applied electric field reduce the surface charge. After exposure to radiation, either the remaining surface charge is sampled or the resulting charge transfers are read off from the backside by suitable microelectronic units. Owing to the dependence of the cross section of the photoelectric effect on the forth power of the atomic number (Eq. 3.1), distinctly more X-ray radiation is absorbed in CsI than in selenium (50% absorption of 50-keV X-ray quanta requires a selenium layer of 270 μm thickness). The charge carriers generated by the radiation move parallel to the lines of electric flux. For the same lateral resolution, distinctly thicker layers can be used with selenium than with CsI powder. For this reason, selenium detectors exhibit a high DQE, but this disadvantage can be compensated for by using CsI needle crystals.
Finally, an inexpensive direct radiographic alternative for flat panel detectors is the connection of a scintillator layer (expediently also made of needle crystals) via a lens system to a CCD chip. This design provides reasonable lateral resolution but only a relatively low DQE.
Hybrid Systems
There are also systems on the market with an IP in a closed mechanical surrounding. The IP is read immediately after X-ray exposure. With these devices, a workflow similar to that with flat panel devices can be achieved, at equal image quality and only slightly higher dose requirements. Large and hence expensive silicon wafers are not needed, but moving mechanical parts have to be employed. The previous distinction between storage foil and flat panel devices became fuzzy after the appearance of the hybrid systems (Seibert, 2007).
Slit-Scan Technique
For a few application areas, the slit-scan technique is a direct radiographic alternative for flat panel detectors. Row-by-row scanning of the patient by a fan-shaped X-ray beam may be performed with parallel shifts of the X-ray tube, and a detector row during radiation exposition (cf. the registration of survey views for the interactive planning of Computed Tomographic (CT) cross sections) provides images of low geometric distortion of the whole skeleton, for example, for orthopedic purposes. If the required row sensor is made of ionization chambers, the recording of the whole skeleton requires 1–2 minutes scan time at a very low effective dose, on the order of 0.03 mSv. Another application of the slit-scan technique is found in mammography. In addition to the low distortion, this imaging technique has another advantage in that no antiscatter grid is required (Fig. 3.2). On the other hand, the relatively extended exposure time is a disadvantage, because it results in a much higher load on the X-ray tube than in the case of a cone beam exposition. For this reason, X-ray tubes used in slit-scan devices for mammography employ the thermally more stable tungsten anodes, instead of molybdenum or rhodium anodes, which emit a superior spectral composition of radiation.
3.3 Clinical Applications
3.3.1 Diagnostic Devices
3.3.1.1 Projection Radiography
The basic layout of a workplace for X-ray imaging of a lying, standing, or sitting patient is shown in Figure 3.5. The machines have an automatic exposure system and allow a more or less free selection of generator parameters (one-parameter technology: preselection of only high voltage, definition of the integral of tube current over exposure time (the so-called mAs-product) by the automatic exposure system; two-parameter technology: preselection of high voltage and tube current, this mode is of interest as it allows for a certain amount of desired blurring in the image due to motion of body parts (e.g., blurring of the moving lower jaw in the case of cervical spine images) when extended exposure times are required; three-parameter technology: the automatic exposure system is fully abandoned). In the case of immobile X-ray workplaces, the distance between the detector and focus can be adjusted beyond a minimum of 1 m. When working with cassettes, the format of the cassette must be detected automatically in order to prevent regions of the patient outside the image area from being exposed to direct irradiation. Smaller cut-outs using a light aperture are of course possible. Antiscatter grids of various designs (see Section 2.1.2) must be removable in order to permit the registration of thin regions or the recording on infants with minimal radiation exposure and simultaneous sufficient image quality. Image detectors can be (i) cassettes, which contain either a film-screen system or a CR IP, or (ii) fully assembled detectors (flat panel detectors, CCD-based detectors, slit-scan units, drum detectors, CR automats).
Figure 3.5 Layout of an X-ray workstation.

The Automatic Exposure Control (AEC) system will shut off the beam generation after the optimal detector dose is reached. For this, sensors that monitor a measure that is correlated to the detector dose are needed. Two approaches are available. In the first, the measuring chambers are located directly in front of the image detector. The advantage of this approach is a radiation measurement independent of the design of the cassettes used; the disadvantage is a slight radiation loss due to absorption within the sensor. This approach requires an appropriate (although very small) enhancement of the patient dose. There might also be the risk of reproduction of the sensor in the image. Measurements behind the cassette provide the potential advantage of using the complete dose for image generation. Only radiation transmitted through the image detector will reach the exposure meter. This approach is preferentially used for mammography. As the sensitivities of both the image detector (i.e., the film-screen system, the CR IP or the flat panel detector) and the sensor of the automatic exposure system are dependent on the X-ray spectrum (that is, on high voltage, filtering, and beam hardening within the patient (specified, e.g., by the thickness of the patient, compression in mammography)), the corresponding detector dose measurements have to be interpreted with respect to these parameters. Alternatively, the beam quality can be recorded semiquantitatively using a tandem measuring chamber and utilized for the correction of the dosimeter data. In the case of flat panel detectors, an additional concept for data collection needs to be mentioned: a subset of all pixels of the detector is either left out from recording the image or their charge is initially only read via capacitive coupling for exposure control.
The two basic construction types are the Bucky table and the thorax wall stand, but an X-ray tube mounted to a floor stand or a ceiling stand may well supply both a Bucky table and a wall stand. The Bucky table is named after Gustav Peter Bucky (* 3. September 1880 in Leipzig; † 19. February 1963 in New York). The unit has a horizontally freely movable tabletop and ensures a distance between the image detector and sensor-facing side of the patient of maximum 7 cm. The Bucky cabinet (containing the antiscatter grid) can be relocated over a wide range.
In the case of a thorax wall stand, the recording unit may be relocated to very low levels and moreover be tiltable over a wide range of angles, which facilitates recordings in a sitting posture, examination of patients located on a transparent bed, imaging of feet, and so on.
The layout of X-ray machines with flat panel detectors is basically the same as that of cassette-based devices.
In dentistry and orthodontistry, more dedicated devices are used: dental radiographic or teleradiographic devices and orthopantomographs, which may even allow for the generation of CT-like images. Dental X-ray is the only medical application of analog imaging using films without fluorescent screens because of the limited space available. This approach is justified since the area of the patient that is irradiated is usually small. In the case of digital dental X-rays the detectors are usually CCD sensors or complementary metal-oxide semiconductor (CMOS) transistors. The dose savings compared to tooth film without screen amounts to between 10% and 90%.
The main applications of teleradiography are orthodontal and oral-surgical therapies, when crucial sizes and angles have to be obtained from the recordings. The required images of low distortion may be obtained employing distances of preferably more than 1.5 m between the detector and focus. Teleradiographic devices usually use film-screen systems or have CCD sensors installed and may combine orthopantomographs with tomographic features (conventional tomography, see below). In the case of Orthopantomography (OPG), the full dental region of the upper and lower jaws is imaged by stacking quasi-line registrations, which have been obtained using varying beam directions. This is achieved by moving the X-ray tube and the detector around the patient and registering, as in the case of slit-scan technique (Fig. 3.6), and results in images as seen in Figure 3.7. Some machines also permit the registration of conventional tomograms perpendicular to the orientation of the jaw (Fig. 3.8, see Section 3.3.3).
Figure 3.6 Principle of orthopantomography.
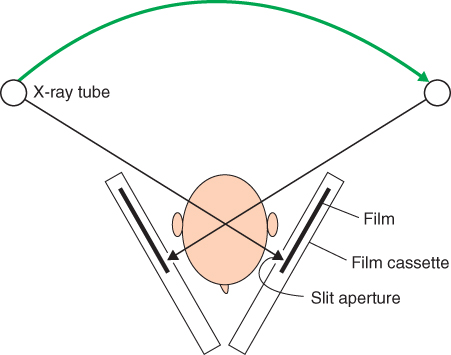
Figure 3.7 Orthopantomogram.
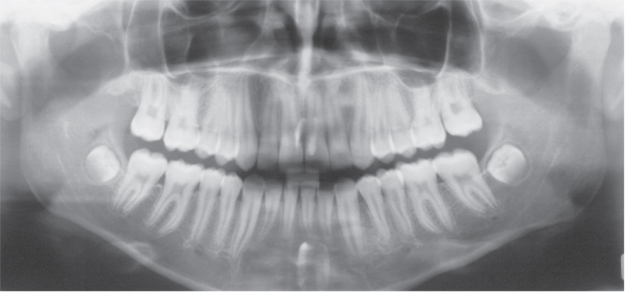
Figure 3.8 (a) Planning of the positions for classical tomographic images on a gypsum phantom. (b) Classical tomograms along and perpendicular to the row of teeth (Panorexplus, 2006).
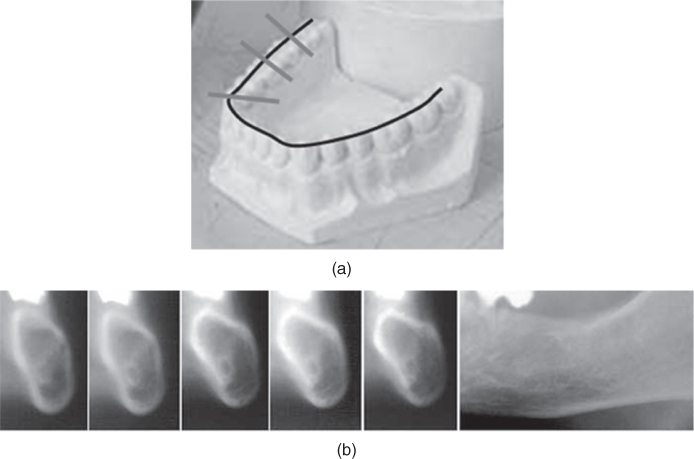
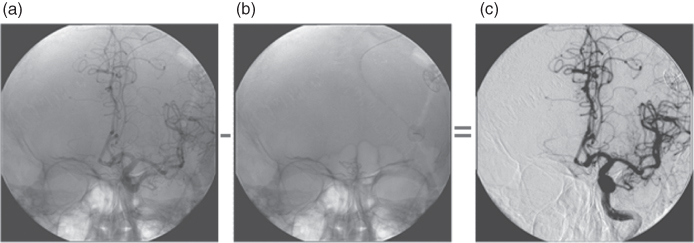
Figure 3.9 Digital subtraction angiography: the image series starts before injection of the contrast agent, and an image used as mask is obtained (b), which will be subtracted in real time from the images obtained during the injection of the contrast agent (a). The result is displayed in (c).
3.3.1.2 Mammography
Mammography instruments have to fulfill particular demands because of the required high contrast for soft tissue, which can be achieved with relatively low photon energy. For this reason, the working range for high voltage is between 28 and 40 kV. In this range, the anode material tungsten is inferior to molybdenum and rhodium because of radiation hygiene considerations. Mammography instruments employ tungsten anodes mainly when using the slit-scan technique (see Section “Slit-Scan Technique”) in order to allow for the long exposure times and the resulting thermal tube load, which are necessary with this technique. The usual focal spot size is in the order of magnitude of 0.1–0.3 (which is a dimension-free nominal quantity describing the dimensions in millimeters under certain conditions). The benefits of compression also include the reduction of movement blur and superposition, as well as of scattered radiation due to the reduced path of the radiation through the tissue.
Another peculiarity of mammography instruments is the feature that allows recording of magnified images. In general, the distance between the object to be displayed and the image detector is minimized in order to reduce the geometrical blur. The extreme high contrast between soft parts and microcalcifications (in particular due to the low energy of the photons) induce an improved perception of the calcifications after magnification, as the blur due to magnification does not overly diminish the contrast between calcifications and their surroundings. Magnified images may be made using a small focus of 0.1 in order to limit the geometrical blur. This implies an upper limit of the tube current in the range of 25–30 mA, which results in exposure times of several seconds for optimally exposed images and the corresponding risk of motion blur. A geometrical blur due to magnification is of relevance only after the lateral resolution power of the subsequent detector is exceeded.
In the case of mamma diagnostic, imaging may be supplemented by selective biopsy or presurgical positioning of labels. Stereotactic punctures or labeling take advantage of the 3D information, which is always present in complementary images from different directions. If the structure to be labeled or punctured is located on two complementary images, the position of the instrument to be introduced on a flat or bent surface outside the mamma as well as the maximum penetration depth can be calculated and controlled by the computer. In addition to accessories that may be installed on instruments for mamma diagnosis, there are special instruments available to treat a lying patient. In this case, the image detectors, apart from flat panel detectors, are predominantly CCD detectors, since, in contrast to imaging diagnosis, the whole mammae do not need to be imaged.
3.3.1.3 Fluoroscopy
Instruments for fluoroscopic examinations are used to monitor time-dependent events, for example, the passage of contrast agents or functional imaging of moving joints. Common features and dissimilarities between imaging and fluoroscopic instruments are summarized in Table 3.1. Obviously, flat panel detectors or an assembly of image intensifiers and Bucky cabinet can be used for combined imaging and fluoroscopic instruments. In these cases, the scatter grid is a stationary grid. Fluoroscopic instruments allow the patient to adopt an inclined position if necessary for the required distribution of contrast agents in the body. Some of these instruments can be (partly) controlled from the patient's bed, which in turn requires suitable radiation protection for the employees. So far, image intensifiers are for the most part used as the image sensor, but they are increasingly being replaced by flat panel detectors.
Table 3.1 Detectors in Imaging and in Fluoroscopic Instruments
| Detectors | Imaging | Fluoroscopy |
| Cassettes (film-screen systems, computed radiography) | x | |
| Flat panel detectors | x | x |
| CCD detectors | x | (x) |
| Image intensifiers | x |
The mechanical layout of the instruments can allow X-ray tubes above or below the table. There are also particularly flexible instruments, the so-called C-arm instruments, such as those used for angiography (see Section 3.3.1.4). The arrangement of the X-ray tube above the bed permits a relatively long distance between the focus and the detector and thus combines a relatively small geometrical distortion with good access to the patient. The arrangement of the X-ray tube below the bed can provide easier radiation protection. From a radiation-hygienic point of view, the below-bed arrangement offers safer manipulations of or at the patient within the ray path, as the hand of the examiner is not hit by the intense primary radiation but only by the distinctly less intense part of the radiation transmitted by the patient. For radiation-hygienic reasons, it is also required to leave the last image of a radioscopic sequence on the monitor after turning off the radiation. This allows a radiation-free thorough investigation of this image as well as readjustment of the opaque and/or semiopaque shutters without additional exposition.
Owing to occasional extended examination times, a radioscopic investigation may lead to relatively high radiation doses for the patient. To reduce this dose, keeping a small average tube current is recommended. This can be achieved by two approaches: reducing the continuous tube current and therefore smoothing the measured data over time (to preserve a certain SNR) or applying pulsed irradiation. Depending on the diagnostic question and the chosen compromise between patient dose and SNR, a certain loss of information on the time scale has to be accepted (see Section “Temporal Resolution and Signal to Noise Ratio”). If the same dose, the same time resolution, and the same SNR are compared, pulsed irradiation provides depiction with less blur at the expense of a continuous display of movement.
In fluoroscopic investigations, the AEC regulates parameters that directly influence the mean tube current (affecting either the tube current or the pulse width, in case of pulsed irradiation) and—in contrast to the exposure meters of cameras—the high voltage and therefore the image contrast. Devices based on image intensifiers are controlled by deflecting a part of the light emerging from the output screen. Flat panel detectors may permit signal collection by reading particular pixels, as discussed earlier, or are equipped with ionization chambers. The characteristic curves of AEC are optimized for different criteria: A control optimized for minimal radiation exposure shows a fast transition to high values of high voltage, and hence it provides a comparably low contrast image. In contrast, a characteristic curve optimized for high image contrast shows an extended region at lower values of high voltage but achieves high values of high voltage only in the region of maximum power deliverable by the generator. In the case of some fluoroscopic instruments, the information acquired by the exposure control during the last fluoro sequence can be used to calculate the default setting for a subsequent static imaging. It applies in particular for the specification of the high voltage according to a transfer characteristic, which may be specific for different organs. The tube current again is shot off after a particular detector dose is reached. This type of exposure control does not require any user intervention; hence, it is termed zero-parameter technology in analogy to the three-, two- and one-parameter technologies discussed earlier for static X-ray workplaces.
3.3.1.4 Angiography
The attenuation of X-ray radiation by blood or blood vessels is not very different from the attenuation by the surrounding tissue. For this reason, blood vessels are almost invisible in projection radiographic images. They can be distinguished after injecting a contrast agent, which basically raises the mean atomic number, for example, because of its content of iodine. Equations (3.1, 3.2, 3.3) indicate how the attenuation (composed of absorption and scattering) is enhanced. A concentration of the contrast agent that is sufficiently high for good contrast in the image of the vessels, but below toxic limits, is achieved by introducing a catheter in the vicinity of the vessels under investigation to administer the contrast agent during the recording using a motorized injector. The vessels containing the contrast agent together with other strongly attenuating structures are overlaid in the image. For investigations of some regions of the body, such as the skull, it might be desirable to avoid this kind of overlay. This can be achieved by collecting one or several native images (depending on the SNR) before administration of the contrast agent. The native image will be subtracted in real time from the series of images with the contrast agent. The result is basically an image representing only the contrast agent containing vessels. This procedure is termed Digital Subtraction Angiography (DSA). By selection of appropriate weighting factors it is possible that anatomical landmarks may remain more or less visible in the image (Fig. 3.20). Moreover, 3D information may be obtained by varying the beam direction during a sufficiently prolonged administration of the contrast agent, for example, continuously by approximately 180°, thus providing a 3D display of the complete tree of the vessel. This procedure is termed rotational angiography. In structures of high contrast, this method may produce CT-like displays (see Section 3.3.1.5). Either image intensifiers or flat panel detectors can serve as image detectors in DSA, as was the case with the fluoroscopic instruments. The typical size of these image detectors is approximately 23 cm diameter for cardiologic applications (left heart catheterization), approximately 33 cm for neuroradiologic applications, and up to 40 cm for angiography in other regions of the body. Instruments with sufficiently large image detectors may be laid out as multifunctional instruments and used for radiographic investigations as well.
Pictures of blood vessels cannot always be unambiguously assessed. A contrast agent containing a structure beyond the lumen of the vessel may indicate an aneurysm, that is, expansion of the vessel wall that may potentially burst. A very similar picture may be obtained if a totally harmless loop of a vessel is imaged from an unfavourable direction. For this reason, angiography requires a very flexible beam geometry, which may be achieved by mounting the X-ray tube and the image receptor to a common C-arm. The rotational angiography mentioned earlier can also be easily accomplished by the C-arm geometry.
During the navigation of the catheter to the destination, the required dose of the contrast agent can be minimized by a procedure called road mapping. Small amounts of the contrast agent are released when the catheter rests at particular positions. An image is recorded at this position, which is then inverted and superimposed on subsequent radioscopic images. No further doses of the contrast agent are required in order to look up the position of the catheter within the vessel. As pulsations of the vessel or movements of the patient may hamper the correlation between the road map and the current radiographic image, the procedure may need to be repeated after some time.
Vessels may also be diagnosed using CT and Magnetic Resonance Imaging (MRI) (Chapters 4 and 5). These tomographic technologies provide slightly less information but employ much milder conditions for the patient. DSA is therefore of continuously decreasing importance as a diagnostic tool. At the same time, it gains interest as a therapeutic tool for vessel intervention, as it permits, for example, dilatation, thrombus removal, or stent placement through dedicated catheters.
3.3.1.5 Portable Devices
Portable X-ray devices are equipped with low output generators (20–35 kW) in order to limit the weight of the device and to ensure convenient power supply (AC mains power). Such devices can even be battery operated, and some of them can also be conveyed from place to place with motor drives. Some of these instruments are basically radiation generators consisting of a generator, an X-ray tube, and the necessary mechanics; others are complete digital portable devices with a flat panel detector as well as an image processing and display unit.
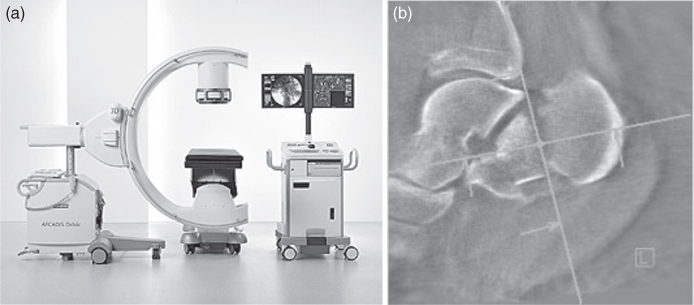
Portable radiographic devices usually have image intensifiers ranging from 14 to 24 cm in diameter. Similar devices using flat panel detectors are feasible as well. The layout of portable devices is based on the C-arm concept (see Section 3.3.1.4, Fig. 3.10). For mechanical reasons, computing equipment is often located on a separate trolley. Frequently used image processing tools are Multiplanar Reconstruction (MPR) and Maximum Intensity Projection (MIP). Depending on the configuration, these devices may be suitable for DSA, that is, they provide subtracted images in real time. High end devices even permit the rotation of the C-arm by at least 180° during irradiation and the calculation of CT-like images, which display structures of higher contrast (usually bones) in a quality acceptable for intraoperative application of these devices.
Figure 3.10 Portable fluoroscope (Siemens) for the operating room (a) permitting CT-like 3D image reconstructions (b).
3.3.2 High Voltage and Image Quality
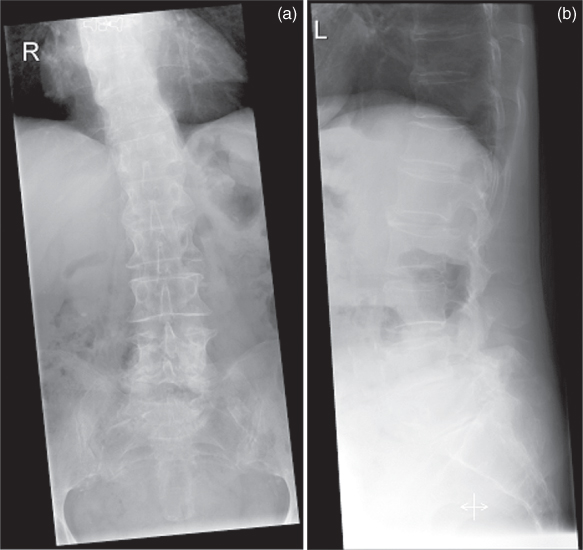
X-rays may be used to image practically all regions of the body. Depending on the requested or required contrast and thickness of the body parts to be investigated, a suitable X-ray spectrum has to be chosen for the available diagnostic devices. This can be done by selecting high voltage, choosing radiation filters where appropriate, and/or by selecting the optimal anode material. As the attenuation coefficient μ decreases on increasing photon energy (Eqs. (3.1)–(3.3)), higher energy radiation may be required for thicker body regions (increased high voltage) in order to ensure the required detector dose at sufficiently low irradiation dose for the patient (according to the current German guidelines, 75–85 kV for examinations of the lumbar spine in anteroposterior arrangement and 85–95 kV in lateral arrangement (BAeK, 2007; Fig. 3.11)). An immediate consequence of the reduced attenuation is images of lower contrast for structures either of varying area density or of varying mean atomic number. The high contrast for soft tissue necessary in case of mamma diagnostics requires a reduced high voltage. Appropriate diagnostic strategies (compression of the mamma) ensure a short path through the tissue and consequently sufficiently low irradiation.
Figure 3.11 Images of the lumbar spine (a) in the anteroposterior projection at 81 kV and (b) in lateral projection at 90 kV.
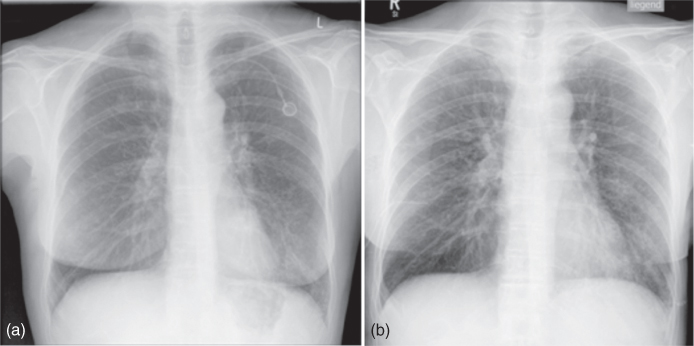
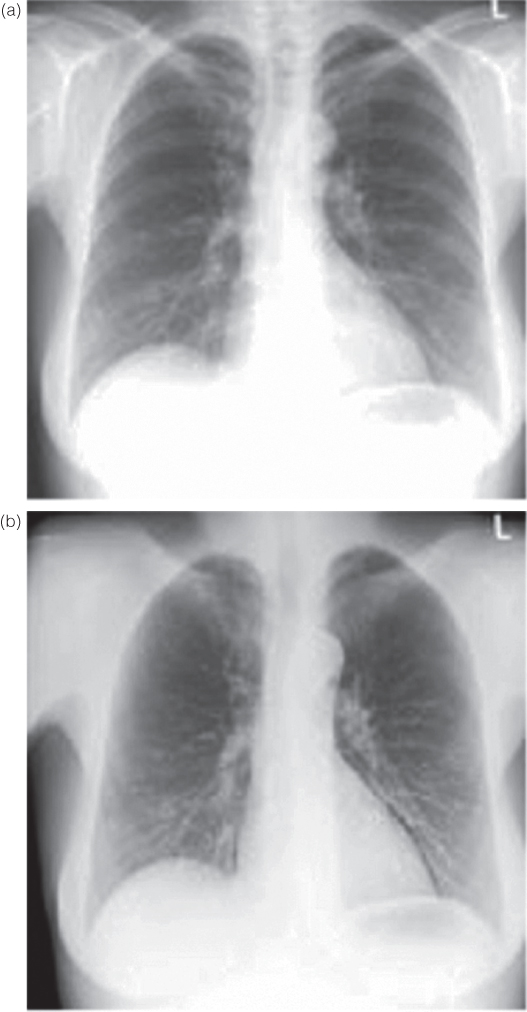
Investigations of the chest may require images showing bony structures (ribs, spine) as well as soft tissue (e.g., lung parenchyma, mediastinal organs). Contrast between bones and soft tissue is determined by the photo effect; Eq. 3.1 indicates the forth power dependence of the photo effect on atomic number. But, the influence of the photo effect decreases faster than that of Compton scattering when photon energy is increased. This permits registration of images of both bones and soft tissue structures if hard radiation (high voltage above 100 kV) is used. On the other hand, application of high voltage below 100 kV, for example, typical for portable devices, permits superior diagnosis of the cortical and trabecular bones of the ribs (Fig. 3.12).
Figure 3.12 Thorax image (a) at 117 kV (hard X-ray technique) and (b) at 77 kV (soft X-ray technique). Higher contrasts at lower high voltage are observed among soft tissue parts, among bone tissue parts, as well as between soft and bone tissue parts.
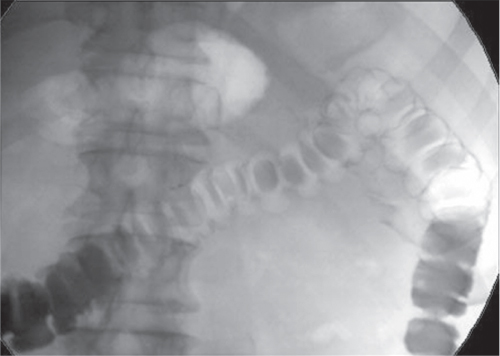
High contrast images of iodine-based contrast agents are obtained using high voltages at around 80 kV, which positions the focus of the intensity distribution of the spectrum close to the K-absorption edge of iodine (33 keV) depending on beam filtering. In the case of fluoroscopic devices (Fig. 3.13), these criteria may not be fulfilled because of the characteristic curve of the exposure control in the particular device (see Section 3.3.1.3).
Figure 3.13 Fluoroscopic colon investigation at 96 kV after rectal administration of an iodine-containing contrast agent and subsequent administration of air (“double contrast”).
3.3.3 Tomography/Tomosynthesis
The production of sharp images usually requires that, during exposure, the relative movement between the object and the optical system is smaller than the resolution of the imaging system. In classic tomography and its digital equivalent, termed as shift-and-add tomosynthesis, this condition is violated in a well defined way: radiation source and image detector move on (at least theoretically) parallel planes, while the center line between them always passes through a stationary point. This results in sharp and accentuated object structures in the plane of this point, while all other structures passed by the beam before and afterwards are blurred. In the case of digital imaging devices, the position of the intersection point, hence the location of the sharply displayed plane, can be shifted by appropriate displacement of the corresponding images (Figs. 3.14 and 3.15). In some devices, the radiation source and possibly the image detector move in a circular path. Procedures for tomographic reconstruction may be applied for processing larger quantities of measured angular positions and a wider range of covered angular segment (e.g., algebraic procedures, see Section 3.3.1.5).
Figure 3.14 Shift-and-add tomosynthesis: depending on the shift of the individual images before overlay, either plane A or plane B is depicted sharply. Source: From (Dobbins and Godfrey, 2003).
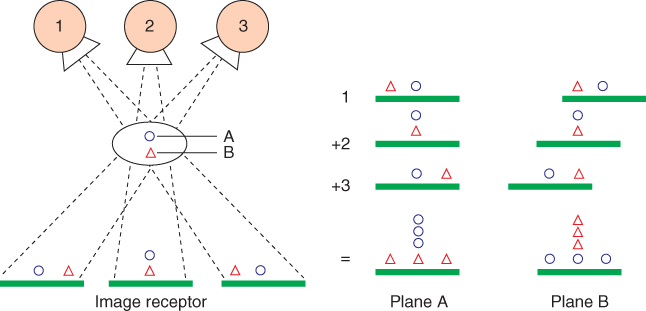
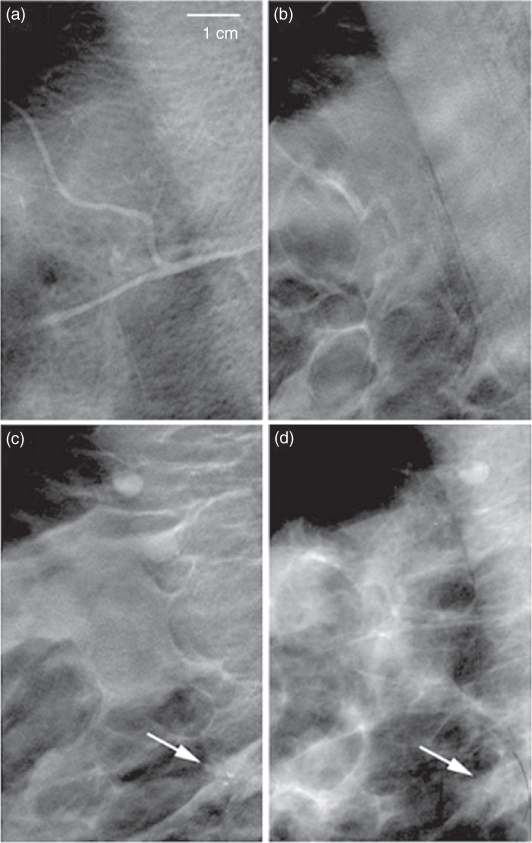
Figure 3.15 Mammographic tomosynthesis images of three different planes (a–c) and a conventional mammogram of the same region. The calcification of an invasive ductal carcinoma is detected more easily from the tomosynthesis (c) than from the projectional radiogram (d). Source: From (Dobbins and Godfrey, 2003).
3.3.4 Dual Energy Imaging
The dependence of the attenuation coefficient μ on both photon energy and material properties (density, mean atomic number) permits distinction between different materials. The classic dual energy absorptiometry used in Nuclear Medicine is based on two images acquired with monochromatic radiation of different energies, and the (surface) densities of both (supposed) components are calculated using a linear system of equations. The images discussed here may be taken by polychromatic radiation as well, but this requires approximations and calibrations. (Fig. 3.16). The two measurements may be performed using the same X-ray tube, but with different high voltages or using various radiation filtration at the detector side during one exposure.
Figure 3.16 Dual energy images of the thorax: (a) classical image, (b) soft tissue image, (c) bone image. Source: From (GE, 2009).
The prevailing application of this approach in projectional radiography is osteodensitometry, where the mineral content of the bones is determined as area density. The same set of images can be used to estimate the ratio between muscle and fat tissue in the body, particularly, when (by slit-scan measurement, see Section “Slit-Scan” Technique) a whole-body scan is carried out.
Dual energy imaging is gaining increasing importance in CT as well (see Chapter 4).
3.3.5 Computer Applications
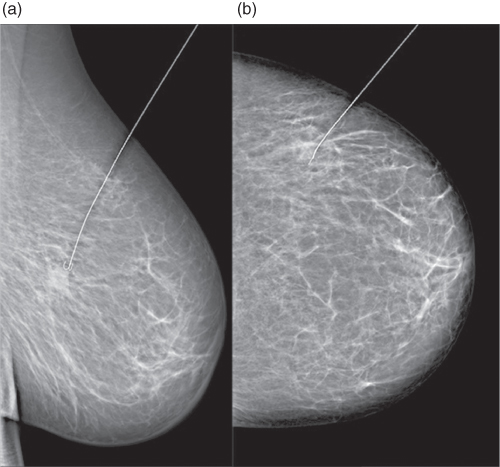
Technically more simple, but of high relevance clinically, is the utilization of the three-dimensional information in the case of stereotactic punctures and lesion marking in female breasts (see Section 3.3.1.2). The target region is marked in two subsequent images, which are obtained at different angles, and then the region's 3D position may be calculated. The guiding tool of the marking or puncture device is positioned above the calculated location of the lesion. In the case of movable lesions, the positioning of the guiding tool can be checked by additional images (Fig. 3.17).
Figure 3.17 Stereotactic wire marking of ductal carcinoma in situ with hematoma after core needle biopsy. Imaging with 28 kV in mediolateral (a) and craniocaudal (b) projections.
Physicians can be assisted during diagnosis by digital image processing, for example, by emphasizing suspect structures or areas in mammograms, by using a multiscale local contrast measure defined in the wavelet domain, or even with knowledge-based classifiers. These procedures are not restricted to mammography.
3.3.6 Interventional Radiology
DSA may be used to display blood vessels for diagnostic purposes, but sectional views (see Section 3.3.1.4 and Chapters 4 and 5) are much gentler as compared to the former. For therapeutic purposes, however, the access to vessel lesions by X-ray-guided positioning of catheters is of considerable importance.
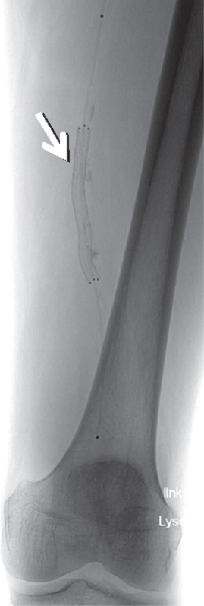
When indicated, thrombosed vessels may be recanalized by lysing drugs. In contrast to intravenous treatment, a high concentration of the drug may be achieved by local fibrinolysis via catheter, keeping side effects minimal. Stenosed or occluded regions may be dilated mechanically by a balloon catheter (Fig. 3.18) or be stabilized by insertion of a stent (Fig. 3.19).
Figure 3.18 Stenosis of the anterior tibial artery (arrow). (a) Stenosed vessel (subtraction image), (b) balloon catheter positioned (unsubtracted), (c) status post balloon catheter dilatation.

Figure 3.19 Stent in the arteria femoralis sinistra.
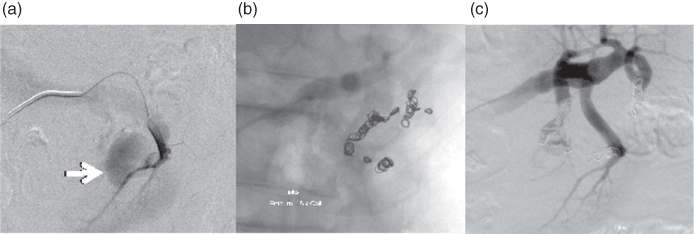
Styptic materials such as tissue glue, metal coils, or particles sized between 50 and 1000 μm can be introduced by catheters into the vessels that feed the bleeding (Fig. 3.20).
Figure 3.20 Embolization of bleeding in the renal pelvis-calyx system. (a) Extravasation of contrast indicates bleeding, (b) imaging of 18 coils placed, (c) bleeding supplying vessels are closed.
Portal hypertension due to liver cirrhosis can be treated by creating an artificial connection between the hepatic portal vein and a liver vein and stabilizing it by a stent (Transjugular Intrahepatic Portosystemic Shunt—TIPS).
Interventional radiology based on projectional radiography is also successfully applied for taking biopsies of tissue or for preoperative marking of lesions (see Section 3.3.5).
3.4 Radiation Exposure to Patients and Employees
A variety of methods for medical imaging based on X-rays is available. A similar wide range of radiation doses to patients corresponds to the different imaging methods. The required effective dose ranges from 0.01 mSv for extremity images to approximately 1 mSv for images of the spine and to several millisieverts for fluoroscopic examinations (and CT). The above-mentioned dose values correspond to 1.5 days to several years of mean natural radiation exposure in Germany (SSK, 2006). The patient dose required for a particular diagnostic procedure is primarily determined by the image detector. Actual values of DQE are above 50% for modern fluoroscopic devices; hence, a dose reduction to less than 50% is anticipated for the future. The radiation exposure documentation required by the German X-ray control law (Röntgenverordnung) usually refers to the dose–area product for several reasons: on one hand the product of the dose and irradiated area makes sense biologically, as the risk for damages caused by irradiation is approximately proportional both to the dose and to the number of involved cells. The latter corresponds roughly to the exposed area of the patient. On the other hand, the dose–area product can easily be measured. As the irradiated area increases with the squared distance to the radiation source and the dose decreases at the same rate, the product of area and dose remains independent of the distance. Thus a reliable value for the patient can easily be measured by a detector mounted on the protective case of the tube. The conversion of the dose–area products into effective doses requires additional information because of the varying radiation sensitivity between different tissue types.
The maximum allowed exposition per year in Germany for professionals in medicine is 20 mSv (effective dose with consideration of additional organ-specific limitations) (RöV, 2002). During 2005, this value was exceeded by 6 of the 239,178 monitored professionals in medicine. In the case of 99.99% of these professionals, the measured annual dose was ≤ 10 mSv (BfS, 2005). Such low exposure data can be achieved only by strict use of radiation protection gear and adherence to safety guidelines. According to (Naidu et al. 2005), abandonment of thyroid gland protection may lead to doses of 10 mSv or more in that organ for the endoscopist.
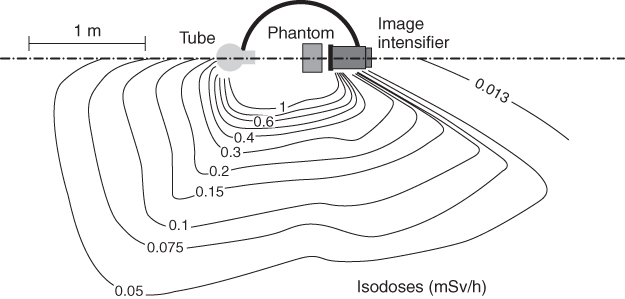
Attention must be paid during operations in the vicinity of the patient to whether body parts of the investigator are exposed to primary radiation, such as in applications of the over-table X-ray system (see Section 3.3.1.3). The spatial distribution of scattered radiation has to be taken into account, both for application of radiation protection gear and for positioning of the staff, for example, in the vicinity of an image intensifier in the operating room. Above a certain thickness of the radiation scattering body—as in case of an abdomen investigation—the expected exposure is higher on the side of the X-ray tube than on the side of the image detector (Fig. 3.21).
Figure 3.21 Dose distribution around surgical C-arm X-ray system in horizontal beam geometry. Source: Modified from Schulz, 2005.
BAeK. Leitlinie der Bundesärztekammer zur Qualitätssicherung in der Röntgendiagnostik. 2007. Available at http://www.drg.de/docs/anweisungen/leitlinie_baek_roev-2007.pdf.
BfS. Bundesamt für Strahlenschutz Jahresbericht 2005 Teil III: Berufliche Strahlenexposition; 2005.
Bushberg JT, Seibert JA, Leidholdt EM Jr, Boone JM. The Essential Physics of Medical Imaging. 2nd ed. Lippincott Philadelphia; 2002. ISBN 0-683-30118-7.
Dobbins JT, Godfrey DJ. Digital x-ray tomosynthesis: current state of the art and clinical potential. Phys Med Biol 2003;48: R65–R106.
GE. 2009. Available at http://www.gehealthcare.com/eude/radiography/products/applications/dual-energy-substraction.html.
Hendee WR, Ritenour ER. Medical Imaging Physics. Wiley-Liss New York; 2002. ISBN 0-471-38226-4.
Leicht H. Wilhelm Conrad Röntgen. Biographie. Ehrenwirth. München; 1994. ISBN 3-431-03354-7.
Morneburg H, editor. Bildgebende Systeme für die medizinische Diagnostik. Publicis MCD Verlag Erlangen; 1995. ISBN 89578-002-2.
Naidu LS, Singhal S, Preece DE, Vohrah A, Loft DE. Radiation exposure to personnel performing endoscopic retrograde cholangiopancreatography. Postgrad Med J 2005;81:660–662.
Panorexplus. 2006. Available at http://www.imagingsciences.com/html/products/panor explus/panplusF.htm.
RöV. Verordnung über den Schutz vor Schäden durch Röntgenstrahlen. BGBII 1987, 114, zuletzt geändert; 2002.
Schedel A. Der Blick in den Menschen. Wilhelm Conrad Röntgen und seine Zeit. Urban & Schwarzenberg. München, Wien, Baltimore; 1995. ISBN 3-541-19501-0.
Schulz E. Arten und Wirkung von Strahlenschutzzubehör. Universität Lübeck, Institut für Radiologie; Lübeck:: 2005. Available at http://ikrweb.unimuenster.de/aptdir/veranstaltungen/vortraege/Goettingen/Schulz-Arten_Wirkung_Strahlenschutzzubehoer.pdf.
Seibert JA. Digital radiography: CR versus DR? Time to reconsider the options, the definitions, and current capabilities. Appl Radiol Suppl 2007;36:4–7.
Siemens ARCADIS Orbic 3D. Available at http://www.medical.siemens.com/webapp/wcs/ stores/servlet/ProductDisplay∼q_catalogId∼e_-3∼a_catTree∼e_100010,1007660,127 60,14264∼a_langId∼e_-3∼a_productId∼e_143790∼a_storeId∼e_10001.htm.
Sirona. 2008. Available at http://www.sirona.de/ecomaXL/index.php?site$=$SIRONA_ro entgen_intraoral_sensoren.
SSK. Orientierungshilfe für radiologische und nuklearmedizinische Untersuchungen. Berichte der Strahlenschutzkommission (SSK) des Bundesministeriums für Umwelt, Naturschutz und Reaktorsicherheit. Heft 51. Berlin: H. HOFFMANN Fachverlag; 2006.