
Chapter 10
Coherent Anti-Stokes Raman Scattering Microscopy
10.1 Basics
10.1.1 Introduction
Generations of bioscientists have obtained microscopic images based on the light absorption, scattering, polarization, and fluorescence properties of their samples, providing information on different aspects of the fascinating world of the cell. In our quest to understand normal as well as disease conditions for the benefit of human health, the requirements of resolution and contrast have changed radically during the last decade. We want more than the morphological information typically provided; we now wish to follow changes in structural and physiological molecular properties as well as dynamic biochemical processes at the molecular level in living cells and in real time. This stimulates the development of a series of sophisticated microscopic methods based on multiphoton (nonlinear) interaction processes. Here, conventional light sources are replaced by short-pulsed laser systems generating the high peak intensities required. In the interaction process with the sample, the generated light signal is frequency shifted relative to the excitation light and can selectively be detected by means of filters or dispersive elements in front of a sensitive detector.
- are Raman active if the polarizability varies with the vibration
- are usually given in the unit of wavenumbers (cm−1), a reciprocal wavelength defined as 10,000/
 )
) - of low weight atoms occur at higher frequencies: for example, carbon– hydrogen bonds (C–H) vibrate in the frequency range 2845–2950 cm−1, while their corresponding deuterated forms (C–D bonds) vibrate at a lower frequency ∼ 2100 cm−1
- of stronger bonds occur at higher frequencies: for example the double bond C—C has a resonance at ∼ 1650 cm−1 while that of the single bond C–C can be found at 1000–1100 cm−1
One of these novel microscopic techniques is Coherent Anti-Stokes Raman Scattering (CARS) microscopy. Here, image contrast is given by the vibrational properties of molecules, highly dependent on the participating atoms, the character of the bond, the physical state of the molecule, and its environment. (see Factbox and Chapter 9). This allows for true chemical imaging. Although the first published experiments involving this particular third-order nonlinear effect were carried out at a company selling cars, the Ford Motor Company (Maker and Terhune, 1965), then studying imaging on a macroscopic scale in benzene derivatives, the acronym CARS was not coined only 9 years later (Begley et al., 1974). In the past 40 years, it has found numerous applications for qualitative and quantitative analysis of gas-phase and plasma systems, particularly within combustion diagnostics (for reviews see Druet and Taran, 1981; Zheltikov, 2000).
The exploration of the CARS process for microscopic imaging was, however, fairly recently initiated. In 1982, CARS was for the first time introduced in a microscope and employed for the visualization of deuterated water in onion skin cells, although with an image quality severely limited by available technology and strong background generation (Duncan et al., 1982). It required almost two decades of further laser system development, until CARS microscopy was taken up again for three-dimensional visualization of biological molecules in living cells (Zumbusch et al., 1999). Today, it is on the verge of becoming a widespread and easy-to-use tool complementing other microscopic methods.
10.2 Theory
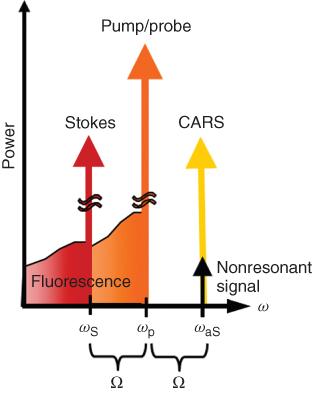
In CARS microscopy, the characteristic vibrational properties of molecules in the sample are mapped to an image. This is achieved by tuning the frequency difference of two excitation laser beams, the pump (frequency ωp) and Stokes (frequency ωS) beams, to form a beating field with a frequency that matches the resonance frequency Ω of the target molecule, as illustrated in Figure 10.1. Ensembles of molecules in the high intensity region of the focal volume are set into a coherent vibration by the beating excitation field (Fig. 10.1a). They are then probed by another beam, a so-called probe beam (Fig. 10.1b), which is inelastically scattered with a positive frequency shift (anti-Stokes) corresponding to the molecular vibration (Fig. 10.1c). These coherently anti-Stokes Raman scattered (CARS) photons oscillate in phase and are all emitted in a specific direction set by the wave-matching (or phase-matching) condition, as explained below. The resulting CARS signal, ICARS, is emitted as a laserlike beam at a wavelength (higher frequency ωaS) shorter than the excitation beams IP (used as both pump and probe beam) and IS (Stokes beam), and can be clearly separated from the redshifted fluorescence background of the sample (Fig. 10.2).
Figure 10.1 The classic picture of the CARS process: The pump and the Stokes beams form a beating field (a), which sets the target molecular groups in vibration when the beat frequency matches the resonance frequency Ω. The probe beam is inelastically scattered by the coherently vibrating cluster of molecules (b), resulting in a positive frequency shift. This coherent anti-Stokes Raman scattered light can then be separated from the excitation light by efficient optical filters before detection (c).
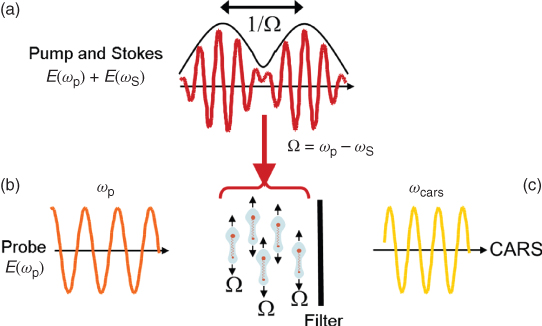
Figure 10.2 A schematic diagram illustrating the spectral separation of the CARS signal from the excitation beams and the resulting intrinsic fluorescence background.
This phenomenon is theoretically described in the literature of nonlinear optics and spectroscopy (Eesley, 1981; Shen, 1984). An analytical expression for the emitted intensity at the resonance frequency ωaS can be formulated for a nonabsorbing medium under the assumption of interaction between plane electromagnetic waves:
where Nm is the number of molecules of type m in the probe volume and![]() is the corresponding third-order susceptibility.
is the corresponding third-order susceptibility.![]() is the wave-vector mismatch between the interacting electromagnetic fields, and L denotes the interaction length. The fundamental properties of the CARS process can be seen in Eq. (10.1), for example, the emitted intensity increases quadratically with the intensity Ip of the degenerate pump/probe beam and linearly with the intensity IS of the Stokes beam. For quantitative microscopy, it is important to note the quadratic relationship between the output intensity and the number of molecules probed. Finally, the last factor, the sinc function, indicates the importance of the phase-matching condition
is the wave-vector mismatch between the interacting electromagnetic fields, and L denotes the interaction length. The fundamental properties of the CARS process can be seen in Eq. (10.1), for example, the emitted intensity increases quadratically with the intensity Ip of the degenerate pump/probe beam and linearly with the intensity IS of the Stokes beam. For quantitative microscopy, it is important to note the quadratic relationship between the output intensity and the number of molecules probed. Finally, the last factor, the sinc function, indicates the importance of the phase-matching condition![]() of the interacting fields.
of the interacting fields.
However, in the tight focus formed by an objective used for scanning CARS microscopy, a large spread in momentum is achieved, offering many possibilities for the photons to satisfy the wave-matching condition,![]() . In addition, phase matching becomes less critical within a small interaction length such as the size of the focal volume, which is on the order of the excitation wavelengths. For a more profound characterization of the CARS signal in CARS microscopy, the special case of tightly focused excitation fields is of particular importance (Cheng et al., 2002a; Potma et al., 2000).
. In addition, phase matching becomes less critical within a small interaction length such as the size of the focal volume, which is on the order of the excitation wavelengths. For a more profound characterization of the CARS signal in CARS microscopy, the special case of tightly focused excitation fields is of particular importance (Cheng et al., 2002a; Potma et al., 2000).
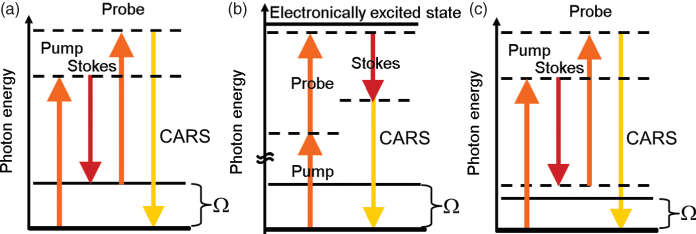
The susceptibility![]() quantifies the efficiency of the nonlinear four-wave mixing processes. It includes the efficiencies of all possible third-order resonant processes, vibrational and electronic, as illustrated by the energy level diagrams in Figure 10.3a and b. In addition, there is a contribution from nonresonant interaction processes,
quantifies the efficiency of the nonlinear four-wave mixing processes. It includes the efficiencies of all possible third-order resonant processes, vibrational and electronic, as illustrated by the energy level diagrams in Figure 10.3a and b. In addition, there is a contribution from nonresonant interaction processes, ![]() , not involving any real electronic or vibrational levels apart from the ground state, as exemplified in Figure 10.3c. This results in the following expression for the third-order susceptibility when probing a single vibration (Lotem et al., 1976):
, not involving any real electronic or vibrational levels apart from the ground state, as exemplified in Figure 10.3c. This results in the following expression for the third-order susceptibility when probing a single vibration (Lotem et al., 1976):
10.2 ![]()
Figure 10.3 Energy level diagrams of all resonant third-order processes that are possible: (a) CARS process involving a vibrational energy level and (b) resonant electronic process involving an excited electronic state. (c) In condensed matter, such as biological samples, the nonresonant process is of particular importance.
This expression contains contributions from resonant vibrational and electronic excitations (first two terms), as well as a nonresonant background (last term). Ω and ωe are the resonant vibrational and electronic frequencies, respectively. ΓR and Γe are the corresponding half width at half maximum linewidths. The constants AR and Ae are related to the cross sections for Raman scattering and two-photon excitation, respectively. For biological molecules and Infrared (IR) excitation, the second term involving two-photon excitation to an electronic level can typically be neglected, because this level is too far detuned for the low energy Near-Infrared (NIR) or IR photons. The expression for the susceptibility then reduces to
The first term of Eq. (10.3) is responsible for the desired chemically selective image contrast in CARS microscopy, whereas the last term is essentially a real, frequency-independent constant, not carrying any information on the molecular composition of the sample. Considering the wealth of different molecular species in the probe volume generating only nonresonant background, this part may contribute significantly to the CARS signal. Thus, experimental strategies are being developed in order to reduce and even remove the nonresonant background, resulting in improved sensitivity (Burkacky et al., 2006; Cheng et al., 2001a; Ganikhanov et al., 2006a; Potma et al., 2006; Volkmer et al., 2002; von Vacano et al., 2006). This is further elucidated in the Section “Measurement Techniques.”
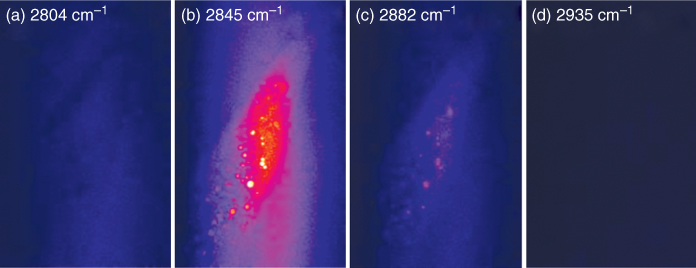
The primary feature of CARS microscopy is the ability to image with chemical specificity by tuning the frequency difference of the excitation fields to match the resonant vibration of the target molecule. This is illustrated by the series of CARS microscopic images shown in Figure 10.4, obtained by probing different frequencies in the range of the resonance of the C–H bond 2830–2930 cm−1. The CARS images are collected (30 s integration time, 14 + 24 mW excitation power, 52.8 × 82.1 μm2) on the posterior end (tail) of a living nematode C. elegans. Four representative images are shown: (a) the nonresonant signal at 2804 cm−1, (b) the symmetric CH2-stretch vibration at 2845 cm−1, (c) the antisymmetric CH2 vibration at 2882 cm−1, and (d) the symmetric CH3 vibration at 2935 cm−1. No lipid stores can be observed in the nonresonant images, whereas they can clearly be distinguished as bright spots in the C–H resonant images (b) and (c).
Figure 10.4 A series of CARS microscopic images of the lipid stores in a living Caenorhabditis elegans nematode collected at different vibrations in the region of C–H resonance, illustrating the chemical selectivity of CARS microscopy.
10.3 CARS Microscopy in Practice
With present technology, CARS microscopic images are typically collected at average excitation powers in the order of 10 mW during tens of seconds up to 1 min. For NIR excitation light this is far from energy doses causing photodamage in biological materials (Chapter 9), and it is quite tolerable for living cells (Rajadhyaksha et al., 1999).
The sensitivity limit of conventional CARS microscopy is presently in the order of 106 vibrating modes per focal volume (Potma et al., 2006), which allows the imaging of single lipid bilayers and single cellular membranes by probing the symmetric CH2 stretching mode (Potma and Xie, 2003). Bilayers separated by a distance smaller than the diffraction limit can clearly be distinguished, which indicates that ultrahigh resolution is possible in CARS microscopy. Polystyrene beads with a diameter of 0.2 μm have been visualized with a lateral resolution of 0.28 μm (Full Width at Half Maximum (FWHM)) and an axial resolution of 0.78 μm (Cheng and Xie, 2004). Images can be recorded at depths of 100 μm in living tissue, exemplified by the visualization of adipocytes in the subcutaneous layer of a mouse ear (Evans et al., 2005).
These data demonstrate that CARS microscopy has several unique and important virtues as follows:
Thus, CARS microscopy takes molecular imaging beyond the limitations associated with fluorescence (perturbations to the function of the target molecule induced by labeling; Chapter 8), Raman scattering (long integration times and an overwhelming fluorescence background; Chapter 9), and FTIR (limited spatial resolution and absorption of the IR probe light by water; Chapter 9) microscopy. It allows functional imaging of micrometer-sized structures containing only picograms of the targeted substance at high three-dimensional resolution without labeling, which gives CARS microscopy a strong potential to become an important tool within the biosciences.
10.4 Instrumentation
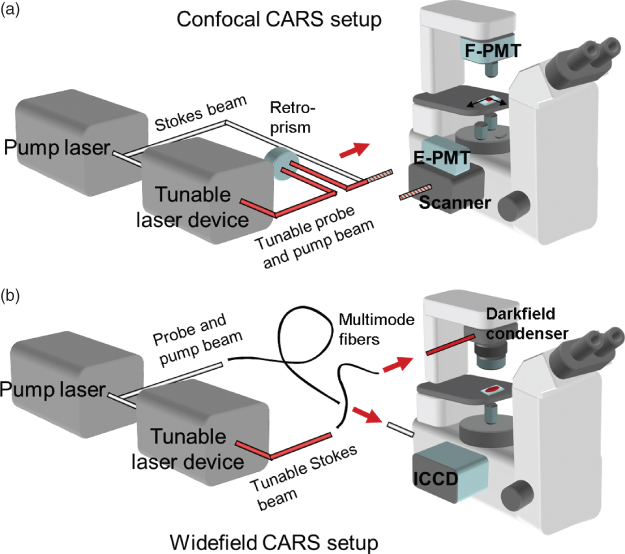
To date, nearly all CARS microscopy setups utilize the frequency-degenerate excitation scheme, where two of the three incident photons originate from the same laser source, which makes the experimental setup less complicated. Figure 10.5 gives a schematic outline of the essential components of a CARS microscope: the laser system, the detection arrangement, and the actual microscope. The latter can fairly easily be adapted to CARS microscopy by the use of high Numerical Aperture (NA), large back aperture objectives, and NIR- transmitting optics in general. In addition, the optical paths must be optimized for efficient in-coupling of excitation light and detection. The microscope has a history of several hundred years of development to become such a flexible and almost perfect optical instrument enabling CARS microscopy, whereas the development of the laser (Maiman, 1960) and highly sensitive detectors is far more recent and, consequently, in a more expansive phase.
Figure 10.5 Schematic outline of the two principal categories of experimental setups for CARS microscopy: (a) scanning CARS microscope with forward and epidetection and (b) nonscanning wide-field CARS microscope.
Thus, the advancement of CARS microscopy is highly dependent on the continuing progress of laser and detector technology. An illustrative example of this is the revival of CARS microscopy in 1999 (Zumbusch et al., 1999), made possible by the development in high power short-pulsed lasers during the 1990s. The central role of laser and detector systems for CARS microscopy has been further exemplified.
10.5 Laser Sources
Three of the most central characteristics of the laser source for CARS microscopy are its spectral and temporal properties, as well as the peak power generated. The importance of the output power for the generation of the CARS process can be understood from Eq. 10.1, which indicates that the nonlinear response of the medium to the excitation beams is quantified by the third-order susceptibility tensor (![]() ). Owing to weak susceptibilities one can only induce a sufficiently strong signal by maximizing the input intensities Ip and IS, however, without causing photodamage to the sample. On the other hand, the nonlinear impact of the input intensities on the output (Eq. 10.1) signifies that at high enough intensities only a minor increase is needed to significantly “boost” the CARS signal. This intensity regime is successfully attained by short-pulsed excitation beams. Depending on the approach, nanosecond (ns), picosecond (ps), and femtosecond (fs) laser sources are being employed. After the first attempt at CARS microscopy with picosecond pulses (Duncan et al., 1982), there was hope that excitation by two transform-limited femtosecond pulse trains, allowing highest possible peak powers, would improve the signal generation and thereby enhance the image quality (Zumbusch et al., 1999). However, by taking the accompanying generation of nonresonant background also into account, it was soon realized that the best signal to background ratio is achieved for picosecond rather than femtosecond pulses despite the higher peak powers of the latter (Cheng et al., 2001b). The underlying explanation is that the spectral width of picosecond pulses better matches that of the vibrational resonances in biological matter (10–30 cm−1). Thus the excitation power of picosecond pulses is efficiently used to induce the resonance, whereas the power of the spectrally broader femtosecond pulses is to a large extent wasted on nonresonant background generation. With a peak power of ∼ 3750 W incident on the sample, the nonresonant contribution is in the order of 5% of the resonant signal in the C–H stretch vibrational region for femtosecond pulses (Zumbusch et al., 1999). For picosecond pulses a similar signal to background ratio is obtained, only requiring a peak power of 75 W (Enejder et al., unpublished data). To date, picosecond-pulsed laser sources are therefore primarily utilized for CARS microscopy. The exception is wide-field CARS microscopy, requiring larger energy densities to be distributed over the entire sample area, as offered by nanosecond lasers (Heinrich et al., 2004, 2006).
). Owing to weak susceptibilities one can only induce a sufficiently strong signal by maximizing the input intensities Ip and IS, however, without causing photodamage to the sample. On the other hand, the nonlinear impact of the input intensities on the output (Eq. 10.1) signifies that at high enough intensities only a minor increase is needed to significantly “boost” the CARS signal. This intensity regime is successfully attained by short-pulsed excitation beams. Depending on the approach, nanosecond (ns), picosecond (ps), and femtosecond (fs) laser sources are being employed. After the first attempt at CARS microscopy with picosecond pulses (Duncan et al., 1982), there was hope that excitation by two transform-limited femtosecond pulse trains, allowing highest possible peak powers, would improve the signal generation and thereby enhance the image quality (Zumbusch et al., 1999). However, by taking the accompanying generation of nonresonant background also into account, it was soon realized that the best signal to background ratio is achieved for picosecond rather than femtosecond pulses despite the higher peak powers of the latter (Cheng et al., 2001b). The underlying explanation is that the spectral width of picosecond pulses better matches that of the vibrational resonances in biological matter (10–30 cm−1). Thus the excitation power of picosecond pulses is efficiently used to induce the resonance, whereas the power of the spectrally broader femtosecond pulses is to a large extent wasted on nonresonant background generation. With a peak power of ∼ 3750 W incident on the sample, the nonresonant contribution is in the order of 5% of the resonant signal in the C–H stretch vibrational region for femtosecond pulses (Zumbusch et al., 1999). For picosecond pulses a similar signal to background ratio is obtained, only requiring a peak power of 75 W (Enejder et al., unpublished data). To date, picosecond-pulsed laser sources are therefore primarily utilized for CARS microscopy. The exception is wide-field CARS microscopy, requiring larger energy densities to be distributed over the entire sample area, as offered by nanosecond lasers (Heinrich et al., 2004, 2006).
With the use of short-pulsed laser sources, it is crucial that the intensities of the pump/probe and Stokes beams are delivered simultaneously for efficient CARS generation. Thus the pulses must overlap not only in space in the probe volume but also in time. Time jittering between pulses causes variations in the CARS signal, deteriorating the true image contrast given by the spatial variations in vibrational properties. In the pioneering work of Duncan et al. (1982), two dye lasers were pumped by a single mode-locked argon ion laser in order to synchronize the picosecond excitation pulses. Xie and coworkers (Zumbusch et al., 1999) employed an Optical Parametric Amplifier (OPA) system, pumped by a femtosecond Ti:sapphire regenerative amplifier, also offering inherent pulse synchronization. Various synchronization schemes have been implemented for the use of two different picosecond Ti:sapphire lasers as pump/probe and Stokes sources (Cheng et al., 2001b; Jones et al., 2002; Potma et al., 2002). More recently, a passively mode-locked picosecond Nd:YVO4 laser has been used with great success to pump one (Evans et al., 2005) and even two intracavity-doubled Optical Parametric Oscillators (OPOs) (Burkacky et al., 2006). A portion of the output from the pump laser serves as the Stokes beam, while the OPO output is used as the pump/probe beam. A new version of the OPO, pumped by a frequency-doubled Nd:YVO4 laser, has been developed, where the signal and idler are used as pump/probe and Stokes beams (Ganikhanov et al., 2006b).
The evolution of laser systems for CARS microscopy has to a large extent also been driven by the desire for highly tunable laser sources, in order to probe molecular vibrations at free choice or at least over a wide frequency range. In addition, the operation in the NIR range has been shown to be advantageous as it reduces one- and two-photon electronic interactions, resulting in a lower nonresonant contribution, minimal risk of photodamage, and an improved probe depth for tissue imaging. The restricted tuneability of the dye lasers used in first attempts (Duncan et al., 1982) merely allowed imaging in a limited frequency range, not including any vibrations of natural biological molecules. In addition, excitation in the visible wavelength region resulted in a significant nonresonant background. The availability of femtosecond Ti:sapphire lasers (center wavelength at 855 nm) in the 1990s in combination with a widely tunable OPA (1.1–1.2 μm) resulted in improved image quality due to reduced generation of background originating from electronic transitions.
In addition, it gave access to molecular vibrations, for organic molecules, in the interesting region 2600–3300 cm−1 (Zumbusch et al., 1999). However, excitation in the wavelength region of 1.1–1.2 μm was found to be less suitable for CARS microscopy of biological cells, as the light absorption of water starts to become significant at approximately 1.15 μm. In addition, the broad spectral bandwidth of the transform-limited femtosecond laser pulses limited the spectral selectivity of the CARS signal. Numerous efforts have been made to overcome this problem by coherent control techniques (Oron et al., 2002, 2003) and spectral focusing (Hellerer et al., 2004), and today, a spectral resolution on the order of ∼ 5 cm−1 can be achieved with femtosecond laser systems.
The development of a picosecond dual-Ti:sapphire laser system with the aforementioned synchronization unit has also positively contributed to the spectral resolution of CARS microscopy (Cheng et al., 2001b; Jones et al., 2002; Potma et al., 2002). The lasers deliver pulses with a typical duration of 5 ps, corresponding to a spectral width of 3.6 cm−1. Furthermore, they can be individually tuned in the optical window of biological matter, 700–1000 nm, giving access to most molecular vibrations of interest (100–3400 cm−1) at favorable signal to background ratio levels due to the picosecond pulses. Unfortunately, the time jittering between the pulses was found to degrade the image quality significantly, despite the synchronization systems. The wish for a widely tunable picosecond laser system in the NIR range with inherent pulse synchronization prompted the development of the Nd:YVO4 laser/OPO system (HighQ Laser Production GmbH 6830 Rankweil, Austria) emitting a highly stable 7-ps pulse train (spectral width: 3.5 cm−1) through mode-locking using a semiconductor saturable absorber mirror in the pump laser. The combination of a Stokes beam fixed at 1064 nm and a tunable pump/probe beam in the range 780–930 nm gives access to a wide range of molecular vibrations (1350–3400 cm−1) (Evans et al., 2005). With the use of two OPOs simultaneously pumped by a single Nd:YVO4 laser, an even broader range of vibrations (0–3400 cm−1) can be targeted (Burkacky et al., 2006). A broad range (100–3700 cm−1) is also accessible by the use of both signal and idler of a single OPO (Ganikhanov et al., 2006b).
Excellent spectral resolution of the CARS signal can be achieved in nonscanning CARS microscopy (Heinrich et al., 2004, 2006), further explained in “Measurement Techniques,” which uses a nanosecond laser system. A Nd:YAG laser simultaneously emits three different beams at 1064 nm, 532 nm, and 355 nm, with a pulse duration of 3 ns. The 355-nm beam pumps an OPO, the output of which is continuously tunable between 410 and 2600 nm and serves as the Stokes beam in the CARS process. The second harmonic of the pump laser is used as the pump/probe beam. In contrast to other CARS microscope setups, the range of molecular vibrations accessible is not limited by the tuning range of the OPO but by the fulfillment of the wave-matching condition. This is a result of the excitation geometry employed (see later). The nanosecond-pulsed CARS microscopic system offers the widest spectral range to be probed (0–8000 cm−1), with the disadvantage of a relatively low repetition rate (10 Hz) with the present laser system.
More laser lines are necessary if one wishes to probe not only one molecular vibration but two vibrations simultaneously, as, for instance, in dual-CARS microscopy (Burkacky et al., 2006). With broadband laser sources, even multiplex CARS microscopy (Cheng et al., 2002c; Müller et al., 2002) is possible within a limited vibrational region. This is done by synchronizing two tunable mode-locked Ti:Sapphire lasers: one narrow bandwidth laser (10 ps, bandwidth ∼ 1.5 cm−1) acting as a pump/probe beam at a fixed wavelength and one broad bandwidth laser (80 fs, bandwidth ∼ 184 cm−1), the Stokes beam, tunable from 700 to 1000 nm. This tunability allows access to a vibrational frequency range of 0–4000 cm−1. The narrow-band laser sets the spectral resolution, while the broadband laser determines the spectral width of the generated CARS spectrum. Multiplex CARS microscopy is also possible by the use of a nonlinear fiber instead of a broadband laser system. Cicerone and coworkers (Kee and Cicerone, 2004) have realized a cost-efficient laser source on the basis of a single mode-locked femtosecond Ti:sapphire laser system combined with a nonlinear fiber. In short, a femtosecond pulse train is spectrally dispersed and split into two beams, one narrow bandwidth pulse train ( ∼ 13 cm−1) acting as the pump beam and one generating a broadband continuum inside a tapered nonlinear fiber. The long-wavelength part of the continuum forms the Stokes beam. With this approach, broadband multiplex CARS microscopy is possible over a vibrational range covering 2500 cm−1, with a spectral resolution of 13 cm−1.
10.6 Data Acquisition
The generated CARS signal is typically detected by means of a Photomultiplier Tube (PMT) (Cheng et al., 2002b) or an avalanche photodiode (Duncan et al., 1982), depending on whether speed or sensitivity is an issue. Spectral measurements, as in multiplex CARS microscopy, require a Charge-Coupled Device (CCD) camera attached to a spectrometer (Cheng et al., 2002c; Müller et al., 2002). The detector is mounted on the microscope such that either the transmitted (forward detection) or the back-scattered CARS light (epidetection) is collected, as outlined in Figure 10.5a. In order to prevent the excitation light, background light, and possible sum and mixing terms from being recorded, several optical filters are placed in front of the detector. For the generation of two-dimensional images, the sample is usually scanned by the excitation beams, which can be done in two ways; either the sample is physically translated with a piezo-driven stage (Duncan et al., 1982) or the position of the laser beam is scanned over the sample fixed on the microscope table with a pair of galvanometric mirrors (Cheng et al., 2002b). Mirror scanning in combination with a PMT detection system represents the fastest possibility for obtaining a CARS image with a confocal setup, enabling video-rate CARS microscopy with an acquisition of 20 frames per second (0.16 μs per pixel) (Evans et al., 2005). In addition, by either moving the sample or the microscope objective in the axial direction (z-direction), a series of two-dimensional CARS images can be collected, forming a three-dimensional image of the object.
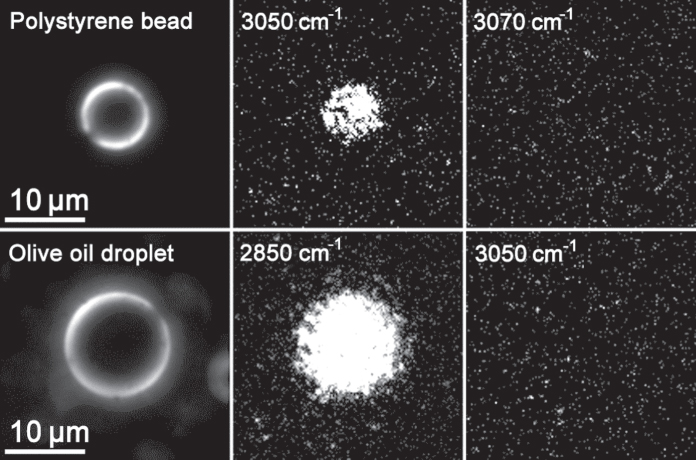
Scanning can, however, be avoided by means of wide-field CARS microscopy (Heinrich et al., 2004, 2006) This nonscanning technique allows excellent time resolution, down to nanoseconds. Full-frame images can be collected instantaneously by means of an intensified, gated CCD imaging system mounted on one of the detection ports of the microscope, as illustrated in Figure 10.5b. Such wide-field, “snap-shot” CARS microscopic images, obtained by a single set of excitation pulses (pump/probe + Stokes), are shown in Figure 10.6. The upper row presents images of a test sample consisting of a 7-μm polystyrene bead at resonance (middle) and off-resonance (right). Detuning the pump frequency by 20 cm−1 results in a complete loss of the CARS signal, an indication of high spectral resolution and weak background signal from water. The left image shows the sample imaged with dark-field illumination. In the lower row of Figure 10.6, corresponding single-pulse pictures are shown for a biological sample, a water– olive oil emulsion. A strong resonant CARS signal is visible when tuning to the symmetric C–H2 stretching vibration at 2850 cm−1 (middle). By detuning to 3100 cm−1, the CARS signal again vanishes completely.
Figure 10.6 Snap-shot images of a polystyrene bead and an oil droplet recorded with single nanosecond pulses in nonscanning CARS microscopy. Left, dark-field images; middle, resonant CARS images by exciting the antisymmetric C–H stretching vibration at 3050 cm−1 or symmetric C–H2 stretching vibration at 2850 cm−1; right, nonresonant background by detuning the Stokes beam by 20 cm−1 or 200 cm−1 from the CARS resonance.
The CARS signal can also be collected by scanning an optical fiber probe (Schaller et al., 2002) or a silver coated silicon cantilever tip (Ichimura et al., 2004) over the sample. This near-field scanning approach allows spatial resolution far beyond the diffraction limit of light. For the subwavelength (50 nm) aperture fiber probe, only the locally emitted CARS photons have a chance to transmit into and tunnel through the fiber. This results in a spatial resolution of ∼ 128 nm at the cost of the optical signal. For the metallic probe, an enhancement of the CARS polarization is achieved at the proximity of the tip and the signal is collected in the epi-mode by a high NA objective. The resolution is estimated to a few tens of nanometers.
10.7 Measurement Techniques
Despite the short history of CARS microscopy, several different experimental protocols have been investigated in order to improve the resolution and sensitivity, many of which are inspired by macroscopic CARS spectroscopy (Eesley, 1981). There are numerous experimental parameters to vary, the most common of which are covered here: the excitation geometry, detection geometry, time-resolved detection, phase-sensitive detection, and amplitude-modulated detection.
10.7.1 Excitation Geometry
The formation of a beating excitation field in the probe volume at the vibrational resonance requires not only that the frequency is matched (ωaS = 2ωp-ωS) but also that the excitation beam geometry is such that their wavevectors fulfill the phase-matching condition (![]() . The importance of this can be noted in Eq. 10.1, which tells us that the argument of the sinc function,
. The importance of this can be noted in Eq. 10.1, which tells us that the argument of the sinc function,![]() , must be minimized in order to boost the CARS signal. The most straightforward excitation geometry that satisfies the wave-matching condition for a nondispersive sample is the collinear beam geometry. Thus, it is not so surprising that this was the excitation geometry used in the very first CARS microscope (Duncan et al., 1982). A strong CARS signal was obtained; however, the long interaction length in the axial direction led to poor axial resolution and an overwhelming nonresonant background. In 1999, Zumbusch et al. circumvented this problem by means of a confocal CARS setup, similar to that shown in Figure 10.5a, employing tightly focussed beams of NIR laser pulses and oil-immersion objectives of high NA (NA = 1.4) (Zumbusch et al., 1999). Tight focusing in space leads to a narrow interaction length L and consequently “relaxes” the phase-matching condition, as it ascertains that the argument of the sinc function is small. Furthermore, the tight focussing assures a distribution of wavevectors, resulting in many combinations that fulfill the wave-matching condition. The confocal setup additionally enhances the axial resolution. In addition, as the generation of the CARS signal is limited to the high intensity, central part of the focal volume because of the nonlinear dependence on the excitation intensities, it offers three-dimensional sectioning. Owing to the many advantages, this confocal excitation geometry is most frequently used, although the so-called folded BOXCARS geometry has also been explored (Müller et al., 2000).
, must be minimized in order to boost the CARS signal. The most straightforward excitation geometry that satisfies the wave-matching condition for a nondispersive sample is the collinear beam geometry. Thus, it is not so surprising that this was the excitation geometry used in the very first CARS microscope (Duncan et al., 1982). A strong CARS signal was obtained; however, the long interaction length in the axial direction led to poor axial resolution and an overwhelming nonresonant background. In 1999, Zumbusch et al. circumvented this problem by means of a confocal CARS setup, similar to that shown in Figure 10.5a, employing tightly focussed beams of NIR laser pulses and oil-immersion objectives of high NA (NA = 1.4) (Zumbusch et al., 1999). Tight focusing in space leads to a narrow interaction length L and consequently “relaxes” the phase-matching condition, as it ascertains that the argument of the sinc function is small. Furthermore, the tight focussing assures a distribution of wavevectors, resulting in many combinations that fulfill the wave-matching condition. The confocal setup additionally enhances the axial resolution. In addition, as the generation of the CARS signal is limited to the high intensity, central part of the focal volume because of the nonlinear dependence on the excitation intensities, it offers three-dimensional sectioning. Owing to the many advantages, this confocal excitation geometry is most frequently used, although the so-called folded BOXCARS geometry has also been explored (Müller et al., 2000).
Wide-field CARS microscopy, a nonscanning variant of CARS microscopy as illustrated in Figure 10.5b, requires the use of a noncollinear beam geometry (Heinrich et al., 2004, 2006). The intensities of nanosecond excitation beams are distributed homogeneously over the whole sample region of interest. A complete CARS image from the entire region of interest can thus be obtained using a set of single laser pulses. Special noncollinear beam geometry (extremely folded BOXCARS) is implemented, which utilizes an ultradark-field condenser to deliver a cone of light at the frequency ωp from earlier, while the Stokes beam is coupled through the objective of the inverted microscope from below. This gives rise to an anti-Stokes beam that counterpropagates relative to the Stokes beam and can conveniently be collected by the microscope objective. This kind of beam arrangement gives rise to a narrow interaction zone where all beams overlap, thus improving the axial resolution compared to collinear beam geometry. Extremely folded BOXCARS excitation also allows for optical sectioning, as demonstrated in Figure 10.7. The sample depicted contains 2-and 5-μm polystyrene beads. They were imaged by means of a Stokes beam at 1064 nm and pump/probe beam at 803.2 nm, exciting the vibrational resonance at 3052 cm−1 corresponding to the antisymmetric C–H stretching vibration. The axial resolution can be estimated from the fact that the two smaller beads in the center of the image can be axially resolved and illuminated separately by displacing the objective lens by 2 μm. Note that the axial resolution also strongly depends on the position of the dark-field condenser (NA = 1.3), which confines the generation of the CARS signal in the axial direction to a region only a few micrometers wide. The lateral resolution is determined to correspond to the diffraction limit, as in a conventional light microscope.
Figure 10.7 Experimental demonstration of optical sectioning in wide-field CARS microscopy for 2- and 5-μm polystyrene beads.

10.7.2 Detection Geometry
The major difficulty in CARS microscopy of condensed samples is that the resonant signal is accompanied by a significant inherent, nonresonant background, which negatively influences the signal to noise ratio and consequently the sensitivity. Thus, it is crucial to optimize the detection geometry of the CARS microscope such that the contribution from the nonresonant background is suppressed. This can be accomplished by detecting the CARS signal in the backward direction relative to the excitation beams, so-called epidetection. It delivers high contrast, particularly for scatterers smaller than the excitation wavelengths (Cheng et al., 2001b; Volkmer et al., 2001). For a monolayer of dipoles in a plane orthogonal to the propagation of the excitation fields, the emitted radiation shows a symmetrical pattern in the axial direction. Coherent addition of the radiation fields from a multilayer of dipoles lined up in axial direction, however, results in the generation of a large signal in the forward direction and a weak signal in the backward direction because of constructive and destructive interference. Thus, small objects emit as much CARS signal (both resonant and nonresonant) in the backward as in the forward direction, whereas the signal from larger objects is primarily forward directed. Using detection in the backward direction, the signal from small objects can be detected selectively without the impact of the large, forward-going nonresonant signal from the surrounding medium. The epidetection geometry has been shown to significantly improve the sensitivity of CARS microscopy for objects smaller than or in the order of the wavelength (Cheng et al., 2001b; Volkmer et al., 2001).
10.7.3 Time-Resolved Detection
Volkmer et al. have investigated the possibility of suppressing the nonresonant background in the time domain by means of pulsed-sequenced excitation (Volkmer et al., 2002). In this approach, three incident femtosecond pulse trains are required, of which one (the probe beam) interacts with the sample at a certain time delay τ relative to the other two, the pump and Stokes, beams. By varying the time delay, the time-dependence of the molecular vibration can be recorded, termed the Raman Free Induction Decay (RFID). As the nonresonant contribution is instantaneous, it can be separated from the resonant CARS signal by detection at a time delay of a few hundreds of femtosecond after excitation. Unfortunately, the improved signal to background ratio is accompanied by a significant reduction of the resonant CARS signal.
10.7.4 Phase-Sensitive Detection
Another possibility of improving the sensitivity of CARS microscopy is to utilize the fact that resonant objects induce a phase shift in the emitted CARS signal, whereas the nonresonant part is not associated with any shifts in phase. This results in a polarization difference between the resonant and nonresonant CARS fields (Cheng et al., 2001a). It is quantified by the depolarization ratio of the resonant object relative to the nonresonant solvent, which typically is 1/3. By excitation with linearly polarized pump/probe and Stokes fields having a relative difference in polarization direction of Φ = 71.6°, optimal separation of the nonresonant component from the resonant signal is achieved (Cheng et al., 2001a) by rotating an analyser positioned in front of the detector orthogonally with respect to the direction of the nonresonant polarization. Unfortunately, the resonant CARS signal is also reduced, which prevents the detection of weak Raman resonances using this approach.
The difficulty in imaging weak resonant signals overwhelmed by a strong nonresonant part can be circumvented by the interference with an intense nonresonant field that acts as a local oscillator: heterodyne CARS microscopy (Potma et al., 2006). In short, the pump and Stokes beams are collinearly combined and sent into a Mach-Zehnder-type interferometer. In one arm a strong nonresonant signal at the anti-Stokes frequency is generated in a reference sample. Alternatively, it can be generated in a photonic crystal fiber (Andresen et al., 2006). A phase modulation is applied at 10 MHz to this local oscillator beam, which is then recombined with the pump and Stokes beams by means of a dichroic mirror and collinearly sent into the microscope. The CARS signal, consisting of both nonresonant and resonant parts, generated in the sample is mixed with the co-propagating local oscillator field and finally detected by means of lock-in detection in order to isolate the heterodyne signal. This interferometric detection scheme allows the recovery of both the real and the imaginary parts of the third-order nonlinear susceptibility, resulting in imaging free of nonresonant background and a signal that is linearly dependent on the concentration of vibrational modes (Evans et al., 2004; Potma et al., 2006).
10.7.5 Amplitude-Modulated Detection
The separation of the nonresonant background from the CARS signal can also be accomplished by fast switching (>500 kHz) between resonant and pure nonresonant excitation. This results in an amplitude-modulated CARS signal. In practice, it can be achieved by alternately coupling two pump beams with two different wavelengths together with a common Stokes beam into the CARS microscope (Ganikhanov et al., 2006a). One pair excites the target molecules resonantly, while the second pair, slightly detuned, generates a pure nonresonant CARS signal. The constant nonresonant and the tuning-dependent resonant parts can then be separated with lock-in detection, improving the CARS signal detection sensitivity. This can also be achieved by means of dual- CARS microscopy, where the two pump/probe beams are jointly coupled into the microscope together with the Stokes beam. A resonant vibration and the nonresonant background can then be probed simultaneously using a dual-channel detector system (Burkacky et al., 2006).
10.8 Applications
CARS microscopy has the ability to selectively visualize chemical species based on differences in their characteristic vibrational properties, allowing qualitative and quantitative mapping without the need to introduce artificial labels. Thus, this novel microscopic technique enables chemical imaging of living matter under close to natural conditions and is therefore considered to have a strong potential within the field of biological imaging. Time-resolved imaging of normal and malign biochemical processes, of dynamic changes in intra- and intercellular distributions of a target molecule, and of changes in molecular structure is foreseen. With improved sensitivity this should be possible for a broad range of molecular species. Thus, CARS microscopy is anticipated to take a complementary and just as important a role as that fluorescence microscopy presently plays within the biosciences. This expectation is supported by the growing number of applied studies emerging in well-recognized scientific journals, providing unique insights into a wide range of relevant biological and medical topics: composition and function of biological membranes, functional nutrients, cellular lipid dynamics and metabolism, cell hydrodynamics, growth of tumor cells, and tissue imaging of axonal myelin and skin.
10.8.1 Imaging of Biological Membranes
Despite its simple basic structure, namely, a phospholipid bilayer, the biological membrane is a complex organelle with multiple important tasks. It does not merely act as a passive barrier between cells or cellular subcompartments but regulates inter- and intracellular signal transduction and molecule transport in a subtle manner by local variations in the lipid composition (Simons et al., 2000). In order to study membrane microheterogeneity in detail and to elucidate possible molecular mechanisms behind membrane function, atomic force microscopy, single-particle tracking, and various high sensitivity fluorescence microscopic techniques are employed, all restricted to either in vitro studies or labeled molecules. As the intrinsic properties of lipids, such as their mobility and thermodynamic state, are altered in vitro and are severely influenced by labeling molecules, there is a profound need for new methods to study the function of lipid domains in biological membranes. CARS microscopy may serve as an important alternative, particularly multiplex CARS microscopy, as shown by several recent studies. It provides detailed spectral information over a vibrational region of ∼ 400 cm−1. By comparing trans- and gauche characteristic C–C skeletal stretching modes of the lipid acyl chains in the range 1000–1200 cm−1, the thermodynamic state of the lipids (gel or liquid crystalline phase) in membranes can be characterized and visualized (Müller et al., 2002). This is also possible by relating the CH2 and CH3 stretching modes in the spectral range of 2800–3000 cm−1 (Cheng et al., 2002c; Rinia et al., 2007; Wurpel et al., 2004). The lipid density can be quantified, and even the orientation of the CH bonds in the lipid chains can be visualized by polarization sensitive imaging of the CH2 stretch vibration (Potma and Xie, 2003; Wurpel et al., 2005).
10.8.2 Studies of Functional Nutrients
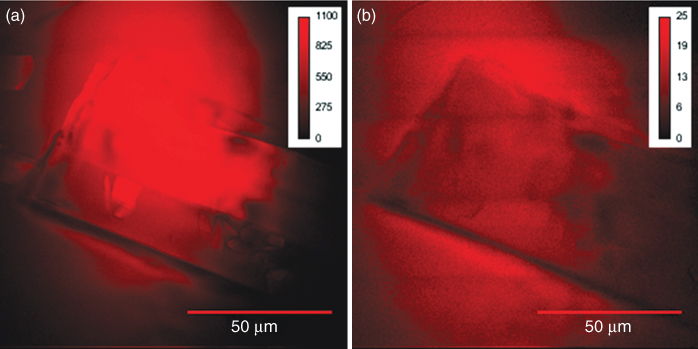
The ability of chemical imaging offered by CARS microscopy presents tempting opportunities for unique studies within nutrient research and industry. By simultaneously collecting images of the C—C (1660 cm−1) and CH2 (2845 cm−1) stretch vibrations of lipids, a ratio can be formed, reflecting the relative contents of unsaturated fatty acids (Enejder et al., 2007). This is a highly relevant parameter, as it has been shown that dietary supplementation of Polyunsaturated Fatty Acids (PUFAs) such as in omega-3 has a positive health effect by repressing lipid synthesis and increasing lipid oxidation in adipose tissue (Sampath et al., 2004). Figure 10.8 a dual-CARS image, representing CH2 and C—C vibrations, shows a glycerol tripalmitate crystal composed of a saturated fatty acid found to large extent in mammalian lipids (e.g., cream, milk, meat). The crystal is surrounded by omega-3 oil extracted from fish, with high contents of PUFAs. The crystal generates a strong resonant CARS signal at the general lipid vibration of CH2, whereas merely nonresonant background light can be observed at the C—C vibration, typical for unsaturated lipids. In contrast, the omega-3 oil generates a resonant signal not only at the general lipid vibration but also at the C—C vibration because of the presence of PUFAs. This allows visual separation of lipids at a microscopic level with respect to their degree of saturation, and possibly also dynamic changes thereof.
Figure 10.8 A dual-CARS microscopic image probing (a) the CH2 vibration (2845 cm−1) and (b) the C—C vibration (1660 cm−1) for chemical imaging of the proportion of saturated and unsaturated lipids. A glycerol tripalmitate crystal is shown, composed of saturated fatty acids typically found in mammalian lipids, as, for instance, in cream. It generates a strong resonant CARS signal at the CH2 vibrational frequency in (a) and merely a nonresonant background at the C—C vibration in (b). The crystal is surrounded by omega-3 oil from fish, with high contents of unsaturated fatty acids that generates a resonant signal at both vibrations. Excitation powers were 40 mW (pump/probe beam at 817 nm, CH2), 38 mW (pump/probe beam at 907 nm, C—C), and 28 mW (Stokes beam at 1064 nm) with an integration time of 20 s.
10.8.3 Lipid Dynamics and Metabolism in Living Cells and Organisms
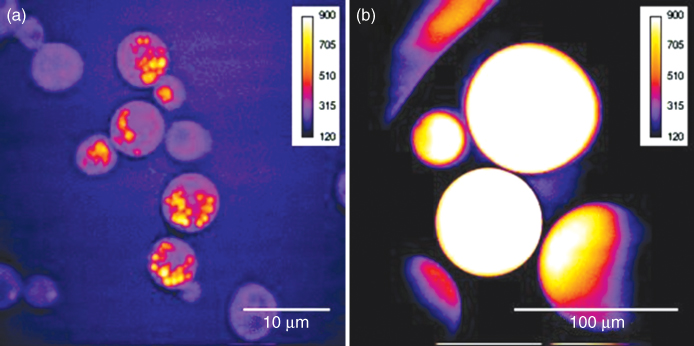
One of the strongest Raman scatterers in biological matter is the C–H bond with its different symmetric and antisymmetric stretch vibrations in the range of 2845–2950 cm−1. All organic molecules contain C–H bonds, but lipids have a dominating fraction. Thus, in living matter, lipids are the most likely molecules to fulfill the minimum requirements to generate a coherent signal larger than the nonresonant background. By tuning the wavelengths of the excitation beams to match the C–H stretch vibrations, the principle organelle observed in most living cells are consequently the lipid droplet, primarily consisting of densely packed triacylglycerols (Zweytick et al., 2000). They can vary in number and size, from several micrometer-sized droplets typically observed in yeast cells (Fig. 10.9a) to a 100-μm-large reservoir filling the entire cell, as in the case of the mammalian fat-storing cell, the adipocyte (Fig. 10.9b).
Figure 10.9 CARS microscopic images of lipid stores with (a) a size less than 1μm in yeast cells and (b) completely filling the entire cell in human adipocytes (diameters of 30–80 μm). The CH2 vibration (2845 cm−1) was probed with a pump/probe beam at 817 nm accompanied by a Stokes beam at 1064 nm. Excitation powers were 40 mW for the pump/probe beam and 28 mW for the Stokes beam, with an integration time of 20 s.
Owing to the urgent need for better understanding of mammalian lipid storage and metabolism regulation, in order to explain the mechanisms behind metabolic diseases, this has been the focus of several applied CARS microscopic studies. Nan et al., monitored the accumulation of lipid stores in 3T3-L1 cells during their differentiation into an adipocyte phenotype with many of the morphological, biochemical, and insulin-responsive features of the normal rodent adipocyte (Nan et al., 2003). The authors report that the lipid stores are newly synthesized during the differentiation process, following a clearance of the initially accumulated lipid deposits. The same group has studied the trafficking of lipid stores in mouse adrenal cortical cells and concludes that it occurs primarily in a subdiffusive manner in general (Nan et al., 2006). However, in conjunction with the production of steroid hormones, an active transport of the lipid deposits along the microtubules was observed for interaction with mitochondria. The accumulation of lipid stores has also been monitored in human hepatoma cells exposed to a drug for treatment of hepatitis C, altering the number and size of peroxisomes (Rakic et al., 2006).
Recently, wide-field CARS microscopy has been employed to distinguish cultivated mouse pre-adipocytes that were fed different diets (linoleic acid vs arachidonic acid), using the ratio between the strong –C–H CARS signal at 2850 cm−1 and the —C–H vibration around 3015 cm−1 for distinction (Heinrich et al., 2008). The quantitative comparison is challenging, since the —C–H resonance is weak, but it was possible to quantitatively assess differences on the order of only 5% in the concentration of polyunsaturated fatty lipids, which was checked against control measurements by High Performance Liquid Chromatography (HPLC). This nicely demonstrates that CARS microscopy can investigate lipid metabolism at the level of individual cells, which is clearly not possible in chromatography.
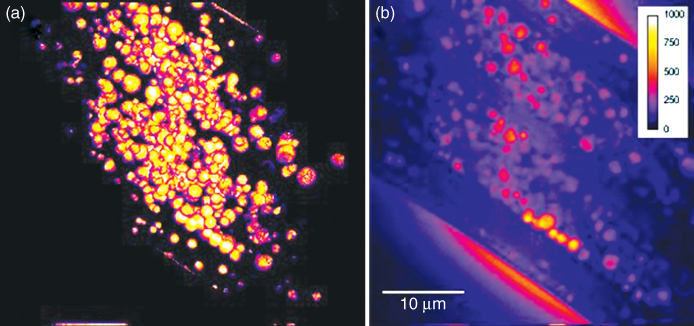
Lipid metabolism is regulated not only at a cellular level but also at an organism-wide level by the endocrine system and environmental cues. The accumulation of lipid stores during normal development as well as during stress-related conditions was studied in the nematode C. elegans (Hellerer et al., 2007). Figure 10.10 shows a CARS microscopic volume image of the three-dimensional distribution of lipid stores in a living C. elegans nematode, illustrating the excellent 3D-imaging capabilities of scanning CARS microscopy. A low energy status at the cellular level was observed to trigger the mobilization of lipid stores, whereas external caloric restriction and other environmental stresses promoted lipid storage and growth arrest. As the lipid regulatory genes of C. elegans have many human homologs (Ashrafi et al., 2003), these observations may contain relevant information with respect to the worldwide search for the causes of obesity.
Figure 10.10 A normalized CARS volume image (a) showing the three-dimensional distribution of lipid stores in a living C. elegans nematode (daf-2 mutant, L3). The volume image was reconstructed from a z-stack of 67 slides (40 × 40 μm) covering a depth of 20.1 μm, each with an integration time of 20 s. One of the central image planes is shown in (b), where the number of CARS photons registered is color coded according to the color bar. The CH2 vibration at 2845 cm−1 was probed with the excitation powers 7.5 mW (1064 nm) and 15 mW (817 nm). This nicely illustrates the superior three-dimensional imaging capabilities of CARS microscopy.
10.8.4 Cell Hydrodynamics
The largest Raman cross section in biological matter is that of the O–H stretch mode in a broad range of 3000–3800 cm−1, characteristic of liquid water. Water plays a principal and versatile role in cell and molecular biology. It influences protein and nucleic acid structure and function, as well as overall cellular activity. Thus, a method by which hydrodynamical phenomena can be observed at a cellular level is likely to provide unique insight into the tasks and properties of the most abundant molecule in living matter. The potential of CARS microscopy for this has been illustrated by monitoring the plasma membrane permeability of water for the amoebae Dictyostelium discoideum (Potma et al., 2001). By flushing the cells with D2O as a contrast agent while probing the O–H vibration, line scans of the CARS signal were collected versus time, indicating the presence of a region in the vicinity of the membrane where the mobility of water is reduced. By probing the O–H stretch mode of interlamellar water molecules in concentric phospholipid bilayers in combination with the CH2 stretch mode of lipid hydrocarbon chains, an ordering of water molecules was observed (Cheng et al., 2003). It was shown that the water molecules align with their symmetry axis along the direction normal to the bilayer. Thus, this suggests that not only the distribution but also the orientation of specific molecules can be visualized by means of CARS microscopy.
10.8.5 Tumor Cells
The unique ability of CARS microscopy for imaging with high resolution in three dimensions was utilized for the monitoring of growth and invasion of the brain tumor glioblastoma multiforme (Kaufman et al., 2005). By varying the properties of the model tissue matrix, consisting of a three-dimensional collagen matrix, it was shown that the density of collagen fibers determines the tumor growth pattern.
10.8.6 Tissue Imaging
Owing to the low absorption and scattering properties of biological matter for the NIR excitation light typically used for CARS microscopy, images of cells in tissue can also be collected. The ordering degree of lipids in the axonal myelin sheath was visualized in spinal cord white matter samples from guinea pigs, showing that the lipids are in the liquid ordered phase (Haifeng et al., 2005). In addition, water molecules residing between adjacent bilayers of the myelin sheath were shown to be ordered with their symmetry axis perpendicular to that of the CH2 groups of the lipids. A useful probe depth in spinal cord tissue, still allowing clear contrast of parallel axons, was estimated to be approximately 250 μm. This shows the potential for the use of CARS microscopy for studies of spinal cord injuries as well as the important category of demyelinating diseases.
Video-rate CARS microscopy shows the potential for imaging dynamic phenomena in living tissue in real time. This was exemplified in the skin of a mouse in vivo, clearly depicting the sebaceous glands, corneocytes, and adipocytes at a probe depth of up to 100 μm (Evans et al., 2005). However, the probe depth was limited by the working distance of the microscope objective. The diffusion of externally applied mineral oil was monitored; it penetrated the stratum corneum, although it did not reach the dermis.
The development of fiber-based CARS microscopy promises imaging of tissue in living organisms, even of deeper lying organs (Legare et al., 2006).
10.8.7 Imaging of Proteins and DNA
The Raman cross sections of DNA and protein are significantly lower than that of lipids. Thus, few studies of these relevant macromolecules have been conducted so far, as it requires the development of techniques that allow an improvement of the sensitivity by at least an order of magnitude. Large efforts are presently made to reduce the impact of the nonresonant background (Burkacky et al., 2006; Cheng et al., 2001a; Ganikhanov et al., 2006a; Potma et al., 2006; Volkmer et al., 2002; von Vacano et al., 2006; ) and to enhance the signal by means of surface-enhanced Raman scattering (Koo et al., 2005) and thereby enable the visualization of weak Raman scatterers.
However, CARS images of proteins in yeast cells and epithelial cells have been reported (Cheng et al., 2001a; Hashimoto et al., 2000), and the chromosomes in an NIH3T3 cell were visualized during the metaphase by tuning to the DNA backbone vibrational band, the PO2− symmetric stretching vibration at 1090 cm−1 (Cheng and Xie, 2004). Clusters and networks of DNA have been depicted by scanning a silver tip over the sample and thus generating a locally enhanced CARS signal (Ichimura et al., 2004). Owing to an excitation volume limited to the end of the tip, a spatial resolution far beyond the diffraction limit of light was obtained.
10.9 Conclusions
CARS microscopy has many distinctive characteristics that facilitate functional imaging of complex and heterogeneous samples with high molecular specificity. As no exogenous labeling is required, samples and processes can be studied under close to natural conditions in a way not possible with present microscopic techniques. Thus, CARS microscopy has the potential to generate new and quite unique insights into the fascinating worlds of bio-, materials- and nanosciences. With major efforts being made to improve the sensitivity of the technique in order to lower the detection limit and to make the instrumentation more user-friendly and compact, it is anticipated that CARS microscopy will soon become an important tool within a broad range of disciplines.
10.10 Acknowledgements
The continuous support by the Swedish Research Council is gratefully acknowledged by A. Enejder. C. Brackmann is financially supported by the Trygger Foundation. The authors thank Madeleine Åkeson for her assistance in collecting many of the images shown. Samples were provided by Professors Marc Pilon, Lena Gustafsson, Joakim Norbeck, Malin Lönn, and Ann-Sofie Sandberg at Chalmers University of Technology and Göteborg University, Sweden. Part of the presented research was supported by the Austrian Science Fund FWF (grant P16658_N02).
Andresen ER, Keiding SR, Potma EO. Picosecond anti-Stokes generation in a photonic-crystal fiber for interferometric CARS microscopy. Opt Express 2006;14:7246–7251.
Ashrafi K, Chang FY, Watts JL, Fraser AG, Kamath RS, Ahringer J, Ruvkun G. Genome-wide RNAi analysis of Caenorhabditis elegans fat regulatory genes. Nature 2003;421:268–272.
Begley RF, Harvey AB, Byer RL. Coherent anti-Stokes Raman spectroscopy. Appl Phys Lett 1974;25:387–390.
Burkacky O, Zumbusch A, Brackmann C, Enejder A. Dual-pump coherent anti-Stokes-Raman scattering microscopy. Opt Lett 2006;31:3656–3658.
Cheng JX, Book LD, Xie XS. Polarization coherent anti-Stokes Raman scattering microscopy. Opt Lett 2001a;26:1341–1343.
Cheng JX, Pautot S, Weitz DA, Xie XS. Ordering of water molecules between phospholipid bilayers visualized by coherent anti-Stokes Raman scattering microscopy. Proc Natl Acad Sci U S A 2003;100:9826–9830.
Cheng JX, Volkmer A, Book LD, Xie XS. An epi-detected coherent anti-Stokes Raman scattering (E-CARS) microscope with high spectral resolution and high sensitivity. J Phys Chem B 2001b;105:1277–1280.
Cheng JX, Volkmer A, Xie XS. Theoretical and experimental characterization of coherent anti-Stokes Raman scattering microscopy. J Opt Soc Am B 2002a;19:1363–1375.
Cheng JX, Jia YK, Zheng G, Xie XS. Laser-scanning coherent anti-Stokes Raman scattering microscopy and applications to cell biology. Biophys J 2002b;83:502–509.
Cheng JX, Volkmer A, Book LD, Xie XS. Multiplex coherent anti-Stokes Raman scattering microspectroscopy and study of lipid vesicles. J Phys Chem B 2002c; 106:8493–8498.
Cheng JX, Xie XS. Coherent anti-Stokes Raman scattering microscopy: instrumentation, theory, and applications. J Phys Chem B 2004;108:827–840.
Druet SAJ, Taran JPE. CARS spectroscopy. Prog Quantum Electron 1981;7(1):1–72.
Duncan M, Reintjes J, Manuccia T. Scanning coherent anti-Stokes Raman microscope. Opt Lett 1982;7:350–352.
Eesley GL. Coherent Raman Spectroscopy. New York: Pergamon Press; 1981.
Enejder A, Brackmann C, Burkacky O, Åkeson M. Dual CARS-CARS microscopy. In: Periasamy A, So PTC, editors. Multiphoton Microscopy in the Biomedical Sciences. Proceedings of the International Society for Optical Engineering; 2007. p. 6442.
Evans CL, Potma EO, Puoris'haag M, Côté D, Lin CP, Xie XS. Chemical imaging of tissue in vivo with video-rate coherent anti-Stokes Raman scattering microscopy. Proc Natl Acad Sci U S A 2005;102(46):16807–16812.
Evans CL, Potma EO, Xie XS. Coherent anti-Stokes Raman scattering spectral interferometry: determination of the real and imaginary components of nonlinear susceptibility chi(3) for vibrational microscopy. Opt Lett 2004;29:2923–2925.
Ganikhanov F, Carrasco S, Xie SX, Katz M, Seitz W, Kopf D. Broadly tunable dual-wavelength light source for coherent anti-Stokes Raman scattering microscopy. Opt Lett 2006b;31(9):1292–1294.
Ganikhanov F, Evans CL, Saar BG, Xie XS. High-sensitivity vibrational imaging with frequency modulation coherent anti-Stokes Raman scattering (FM CARS) microscopy. Opt Lett 2006a;31(12):1872–1874.
Haifeng W, Fu Y, Zickmund P, Shi R, Cheng JX. Coherent anti-Stokes Raman scattering imaging of axonal myelin in live spinal tissues. Biophys J 2005;89:581–591.
Hashimoto M, Araki T, Kawata S. Molecular vibration imaging in the fingerprint region by use of coherent anti-Stokes Raman scattering microscopy with a collinear configuration. Opt Lett 2000;25:1768–1770.
Heinrich C, Bernet S, Ritsch-Marte M. Wide-field coherent anti-Stokes Raman scattering microscopy. Appl Phys Lett 2004;84:816–818.
Heinrich C, Bernet S, Ritsch-Marte M. Nanosecond microscopy with spectroscopic resolution. New J Phys 2006;8:36–43.
Heinrich C, Hofer A, Ritsch A, Ciardi C, Bernet S, Ritsch-Marte M. Selective imaging of saturated and unsaturated lipids by wide-field CARS-microscopy. Opt Express 2008;16:2597–2708.
Hellerer T, Axäng C, Brackmann C, Hillertz P, Pilon M, Enejder A. Monitoring of lipid storage in C. elegans using CARS microscopy. Proc Natl Acad Sci U S A 2007;104:14658–14663.
Hellerer T, Enejder AMK, Zumbusch A. Spectral focusing: high spectral resolution spectroscopy with broad-bandwidth laser pulses. Appl Phys Lett 2004;85:25–27.
Ichimura T, Hayazawa N, Hashimoto M, Inouye Y, Kawata S. Tip-enhanced coherent anti-Stokes Raman scattering for vibrational nanoimaging. Phys Rev Lett 2004;92(22):220801.
Jones DJ, Potma EO, Cheng JX, Burfeindt B, Pang Y, Ye J, Xie XS. Synchronization of two passively mode-locked, picosecond lasers within 20 fs for coherent anti-Stokes Raman scattering microscopy. Rev Sci Instrum 2002;73(8):2843–2848.
Kaufman LJ, Brangwynne CP, Kasza KE, Filippidi E, Gordon VD, Deisboeck TS, Weitz DA. Glioma expansion in collagen I matrices: analyzing collagen concentration-dependent growth and motility patterns. Biophys J 2005;89:635–650.
Kee TW, Cicerone MT. Simple approach to one-laser, broadband coherent anti-Stokes Raman scattering microscopy. Opt Lett 2004;29(23):2701–2703.
Koo TW, Chan S, Berlin AA. Single-molecule detection of biomolecules by surface-enhanced coherent anti-Stokes Raman scattering. Opt Lett 2005;30(9):1024–1026.
Legare F, Evans CL, Ganikhanov F, Xie XS. Towards CARS endoscopy. Opt Express 2006;14(10):4427–4432.
Lotem H, Lynch RT Jr, Bloembergen N. Interference between Raman resonances in four-wave difference mixing. Phys Rev A 1976;14:1748–1755.
Maiman TH. Stimulated optical radiation in Ruby. Nature 1960;187:493–494.
Maker P, Terhune R. Study of optical effects due to an induced polarization third order in the electric field strength. Phys Rev A 1965;137:801–818.
Müller M, Schins JM. Imaging the thermodynamic state of lipid membranes with multiplex CARS microscopy. J Phys Chem B 2002;106(14):3715–3723.
Müller M, Squier J, De Lange CA, Brakenhoff GJ. CARS microscopy with folded BoxCARS phasematching. J Microsc 2000;197:150–158.
Nan XL, Cheng JX, Xie XS. Vibrational imaging of lipid droplets in live fibroblast cells with coherent anti-Stokes Raman scattering microscopy. J Lipid Res 2003;44:2202–2208.
Nan XL, Potma EO, Xie XS. Nonperturbative chemical imaging of organelle transport in living cells with coherent anti-Stokes Raman scattering microscopy. Biophys J 2006;91(2):728–735.
Oron D, Dudovich N, Silberberg Y. Single-pulse phase-contrast nonlinear Raman spectroscopy. Phys Rev Lett 2002;89:273001.
Oron D, Dudovich N, Silberberg Y. Femtosecond phase-and-polarization control for background-free coherent anti-Stokes Raman spectroscopy. Phys Rev Lett 2003;90: 213902.
Potma EO, de Boeij WP, van Haastert PJ, Wiersma DA. Real-time visualization of intracellular hydrodynamics in single living cells. Proc Natl Acad Sci USA 2001;98:1577–1582.
Potma EO, de Boeij WP, Wiersma DA. Nonlinear coherent four-wave mixing in optical microscopy. J Opt Soc Am B 2000;17:1678–1684.
Potma EO, Evans CL, Xie XS. Heterodyne coherent anti-Stokes Raman scattering (CARS) imaging. Opt Lett 2006;31(2):241–243.
Potma EO, Jones DJ, Cheng JX, Xie XS, Ye J. High-sensitivity coherent anti-Stokes Raman scattering microscopy with two tightly synchronized picosecond lasers. Opt Lett 2002;27:1168–1170.
Potma EO, Xie XS. Detection of single lipid bilayers with coherent anti-Stokes Raman scattering (CARS) microscopy. J Raman Spectrosc 2003;34:642–650.
Rajadhyaksha M, Anderson RR, Webb RH. Video-rate confocal scanning laser microscope for imaging human tissues in vivo. Appl Opt 1999;38:2105–2115.
Rakic B, Sagan MS, Noestheden M, Bélanger S, Nan X, Evans CL, Xie XS, Pezacki JP. Peroxisome proliferator-activated receptor alpha antagonism inhibits hepatitis C virus replication. Chem Biol 2006;13(1):23–30.
Rinia HA, Bonn M, Müller M, Vartiainen EM. Quantitative CARS spectroscopy using the maximum entropy method: the main lipid phase transition. ChemPhys Chem 2007;8(2):279–287.
Sampath H, Ntambi JM. Polyunsaturated fatty acid regulation of gene expression. Nutr Rev 2004;62(9):333–339.
Schaller RD, Ziegelbauer J, Lee LF, Haber LH, Saykaylly RJ. Chemically selective imaging of subcellular structure in human hepatocytes with coherent anti-Stokes Raman scattering (CARS) near-field scanning optical microscopy (NSOM). J Phys Chem B 2002;106:8489–8492.
Shen YR The Principles of Nonlinear Optics. New York: John Wiley & Sons; 1984.
Simons K, Toomre D. Lipid rafts and signal transduction. Nat Rev Mol Cell Biol 2000;1:31–39.
Volkmer A, Book LD, Xie XS. Time-resolved coherent anti-Stokes Raman scattering microscopy: imaging based on Raman free induction decay. Appl Phys Lett 2002;80(9):1505–1507.
Volkmer A, Cheng JX, Xie XS. Vibrational imaging with high sensitivity via epidetected coherent anti-Stokes Raman scattering microscopy. Phys Rev Lett 2001;87(2): 023901.
von Vacano B, Buckup T, Motzkus M. Highly sensitive single-beam heterodyne coherent anti-Stokes Raman scattering. Opt Lett 2006;31(16):2495–2497.
Wurpel GW, Rinia HA, Müller M. Imaging orientational order and lipid density in multilamellar vesicles with multiplex CARS microscopy. J Microsc 2005;218(Part 1):37–45.
Wurpel GWH, Schins JM, Müller M. Direct measurement of chain order in single phospholipid mono- and bilayers with multiplex CARS. J Phys Chem B 2004;108(11):3400–3403.
Zheltikov AM. Coherent anti-Stokes Raman scattering: from proof-of-the-principle experiments to femtosecond CARS and higher order wave-mixing generalizations. J Raman Spectrosc 2000;31(8–9):653–667.
Zumbusch A, Holtom GR, Xie XS. Three-dimensional vibrational imaging by coherent anti-Stokes Raman scattering. Phys Rev Lett 1999;82:4142–4145.
Zweytick D, Athenstaedt K, Daum G. Intracellular lipid particles of eukaryotic cells. Biochim Biophys Acta 2000;1469:101–120.