
Chapter 6
Toward A 3D View of Cellular Architecture: Correlative Light Microscopy and Electron Tomography
6.1 Introduction
The terms “multimodality imaging” and “correlative microscopy” are employed in the biomedical literature to designate any combination of two or more microscopic techniques applied to the same region in a biological specimen. “Correlative microscopy” should not be confused with “fluorescence correlation microscopy,” which is a method to measure diffusion of fluorescent molecules in cells (Brock and Jovin, 1998). The purpose of multimodality imaging is to obtain complementary data, each imaging modality providing different information on the specimen that is under investigation. Correlative Light and Electron Microscopy (CLEM) is by far the most widespread form of multimodality imaging.
CLEM makes use of the fact that imaging with photons on one hand, and electrons on the other, offers specific advantages over one another. For instance, the low magnification range inherent to Light Microscopy (LM) is particularly well suited for the rapid scanning of large and heterogeneous sample areas, while the high resolution that can be achieved by Electron Microscopy (EM) allows for the subsequent zooming in on selected areas of interest to obtain ultrastructural detail. A further advantage of LM is that it can be used to study dynamic processes, up to the molecular level, in living cells and tissues. The recent surge in live-cell imaging research has catalyzed a renewed interest in CLEM methodologies, as the interpretation of the dynamic processes observed by LM often requires high resolution information from EM data. CLEM is also gaining in momentum in the field of cryoelectron microscopy where the low contrast conditions and low electron dose requirements put a constraint on the detection efficacy.
Current CLEM procedures face a number of challenges. First, sample preparation methods for LM and EM can be quite divergent because of different requirements for preservation, embedding, sectioning, and counterstaining. Therefore, alternative sample preparation protocols that are suitable for both LM and EM need to be devised. Second, CLEM often requires the correlated localization of specific molecules in cells or tissues, for which specialized detection systems need to be developed. Standard detection methods are based on tagging of molecules either with fluorochromes for LM or with gold particles for EM and are thus less suitable for CLEM where the tag should ideally be visible in both modalities. Third, the transition from imaging by LM to EM may involve handling and additional processing of samples, which can lead to changes in orientation and morphology of the sample. This in turn can hamper the finding back of and correlation with previously established areas of interest.
This chapter discusses past, present, and prospective strategies for CLEM. Special emphasis is given to 3D imaging methods, in particular electron tomography.
6.2 Historical Perspective
When Porter, Claude, and Fullam published in their 1945 landmark article the earliest transmission electron microscopic images of an intact cell, describing for the first time the endoplasmic reticulum, they made a side-by-side comparison with light microscopic images (Porter et al., 1945). Although they did not perform genuine CLEM—the light and electron micrographs were not taken from the same cells—the authors clearly felt the need to correlate their electron microscopic observations with the more familiar light microscopic data as a means to validate their novel findings. Thus, in a sense, CLEM is as old as the earliest applications of EM to biological samples. In the 1950s–1980s, numerous “correlated light and electron microscopic” studies were published based on the same concept of comparing structures observed by LM with similar structures visualized by EM. True CLEM emerged in the early 1970s and culminated in the 1980s with the publication of a dedicated book in the authoritative Hayat series on EM techniques (Hayat, 1987), and with the development of instrumentation such as a combined instrument for LM and scanning EM (Wouters and Koerten, 1982) and the commercial LEM 2000 (Akashi Seisakusho Ltd., Tokyo, Japan) for LM and transmission EM. Interestingly, and perhaps ironically, among the first genuine CLEM applications were studies that combined EM with live-cell imaging (Buckley, 1971), the latter being again responsible for the recent revival of CLEM. Neuroanatomy was another field of research that pioneered CLEM techniques to facilitate sampling of central nervous tissue for EM (Hollander, 1970).
The 1990s saw a steady decrease in the use of EM for life science studies (Geuze, 1999). Several factors were responsible for this decline. First, the genomics era was in full bloom, and the inherent emphasis on functional/mechanistic studies overshadowed the static images and descriptive data that EM produced. Second, there had been major developments in LM, the most important of which was the introduction of “turnkey” systems for confocal laser scanning microscopy (Paddock, 1996). These systems offered improved resolution up to the subcellular level, while requiring less investment, infrastructure, and expertise than a typical EM setup. Hence, confocal microscopes replaced the electron microscopes in many cell biology laboratories. Last but not least, the discovery of Green Fluorescent Protein (GFP; see Section 6.4.1.1) and the demonstration that it could be used to tag proteins genetically stirred a revolution in biomedical research, as it allowed for the tracking of specific proteins in living cells by means of fluorescence microscopy.
In the present postgenomics climate, EM is coming back with a vengeance. Despite the dip in EM-based research during the previous decade, the development of novel EM technologies moved forward at a steady pace, resulting in several breakthrough applications. Among them are electron tomography (see Section 6.5.4) and cryoelectron tomography (see Section 6.5.5), which are techniques for high resolution 3D visualization and which are gradually becoming mainstream tools in structural molecular biology. As discussed in more detail later, (cryo)electron tomography is often hampered by the lack of landmarks in the 2D views used to select areas of interest. CLEM has the potential to play an important role here by facilitating the search for such areas of interest. In addition, CLEM is taking front stage in live-cell imaging, where there is growing demand for fine structural information on processes whose dynamics have been recorded light microscopically.
6.3 Stains for CLEM
Biological specimens are notorious for their high intrinsic translucency and electron permeability. As a result, images produced by LM and Transmission Electron Microscopy (TEM) exhibit poor contrast. Specialized imaging techniques can be used to enhance contrast, such as differential interference contrast (DIC) for LM (Salmon and Tran, 2003), energy filtering for TEM (de Bruijn et al., 1993), and Z-contrast imaging for Scanning Transmission Electron Microscopy (STEM) (Carlemalm and Kellenberger, 1982). Alternatively, contrast enhancement can be achieved by means of chemical staining. Despite the obvious drawback of possible structural and chemical sample alteration that is inherent to such staining procedures, histochemical and cytochemical techniques are still widely employed and will remain popular because of their relative ease of use and the high level of morphologic detail they can reveal. Stains for LM are mostly dye based (chromophores and fluorophores), whereas EM stains employ electron-dense heavy atoms (osmium, uranium, and lead compounds). Thus, usually, the same stain cannot be visualized both by LM and EM. There are, however, a few exceptions, such as the Golgi-impregnation procedure, which is based on a silver-precipitation reaction and used to stain neurons (Fairen, 2005). In general, LM and EM stains can be combined, but the thinness of ultrathin sections required for EM reduces the uptake of LM dyes thereby diminishing the intensity of the stain. Jones et al., reported that toluidine blue is a suitable LM stain for epoxy sections of osmicated tissue if the section thickness is above 100 nm (Jones et al., 1982). The toluidine blue stain is useful in surgical histopathology, as it allows for the LM detection of areas of diagnostic importance in thin sections of human biopsies.
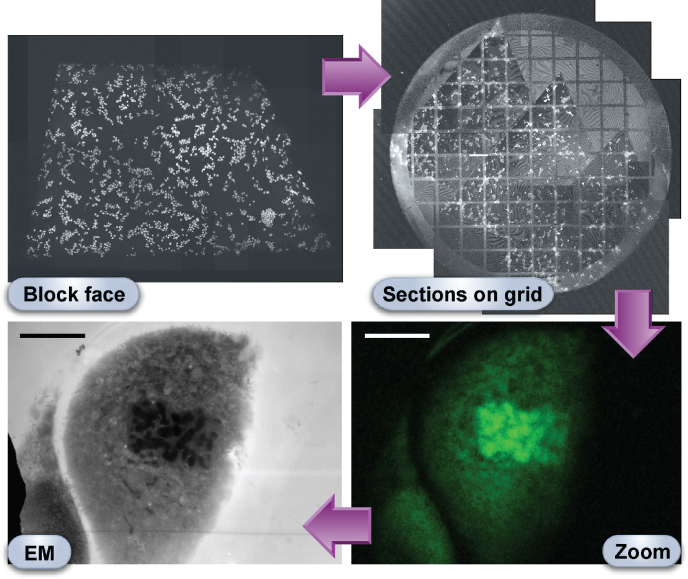
An alternative approach for staining biological samples for CLEM is the inclusion of low molecular weight fluorescent dyes, such as acridine orange and saffranin O, in the substitution medium used during freeze substitution (the principle of freeze substitution is discussed in Section 6.5.6) (Biel et al., 2003; Pfeiffer et al., 2003). The rationale for this method is that just as molecules with a molecular weight up to 700 Da are washed out of the sample during freeze substitution (Pfeiffer et al., 2000), small molecules can also infiltrate the sample. Originally, the technique was developed for staining of high pressure frozen samples (see Section 6.5.5 for the principle of high pressure freezing), and the fluorescence signal was recorded by confocal laser scanning microscopy through the block face of a specimen block. Ultrathin sections were subsequently cut from the same block face, and EM images were correlated with the corresponding slices in three-dimensional reconstructions of confocal image stacks (Biel et al., 2003). The protocol was therefore rather cumbersome and laborious. In our laboratory, we have successfully labeled nuclei of chemically fixed cells and tissues with acridine orange and visualized the fluorescence directly in ultrathin sections, thus allowing for the correlation of LM and EM in the exact same slice (Fig. 6.1) (van Driel et al., 2008).
Figure 6.1 CLEM in action. African green monkey kidney epithelial cells (Vero) grown under standard cell culture conditions were plunge frozen in liquid-nitrogen-cooled ethane, freeze substituted, and flat embedded in Lowicryl HM20 resin. Acridine orange, a fluorescent label for DNA and RNA, was added to the acetone/uranyl acetate mixture used as solvent and fixative, respectively, during the freeze-substitution step. After trimming of the specimen block, fluorescently labeled cells could be observed in the block face, viewed with a confocal laser scanning microscope. The fluorescence was retained in ultrathin sections of 100 nm, cut from the block face and collected on an electron microscope grid. The fluorescence micrographs of the block face and sections on grid each represent a montage of 16 individual images acquired with a 10X objective and stitched with the help of image processing software. As demonstrated in the zoom image taken at higher magnification (63X objective), acridine orange enabled the selection of a rare mitotic event. By means of a coordinate system, the same cell was easily retrieved in the electron microscope. The electron micrograph was acquired at a relatively low magnification to allow for direct comparison with the fluorescence micrograph. In addition to facilitating the search for dividing cells, acridine orange can also help identify cells with characteristic nuclear patterns in complex tissues (e.g. neutrophils, Langerhans cells, and tumor cells). The block face in the upper left panel measures about 2 × 1 mm, the grid in the upper right panel has a diameter of 3 mm, and the scale bars in the bottom panels represent 10 μm.
6.4 Probes for CLEM
While the histo- and cytochemical stains discussed earlier provide visual clues of gross features that can be used as landmarks in a multimodal coordinate system, molecular probes or indicators can be employed to label and detect specific molecules in and around cells. In addition, there are probes that can detect ions, pH, membrane potential, enzymatic activities, and molecular interactions.
6.4.1 Probes to Detect Exogenous Proteins
6.4.1.1 Green Fluorescent Protein
Genetically encoded indicators have become extremely popular among cell and molecular biologists as a tool to study the spatiotemporal expression of proteins in living cells. For this purpose, cells or whole organisms are genetically altered so that they express one or more proteins of interest ectopically with a built-in amino acid sequence that serves as the indicator. The most widely used sequence is 238 amino acids long and encodes for GFP (Chalfie et al., 1994). The gene for GFP, which is a naturally occurring fluorescent protein, was isolated from the jellyfish Aequorea victoria (Prasher et al., 1992). GFP emits green light when illuminated with blue light. In the jellyfish, the blue light is generated upon the binding of Ca2+ ions to the luminescent protein aequorin (Shimomura, 2005). In the laboratory, the blue light is generated by lasers or mercury or xenon vapor lamps. Several mutants of GFP that emit stronger fluorescence and at different wavelengths have been engineered (Tsien, 2005), the latter allowing for the detection of molecular interactions by means of specialized microscopic techniques such as Fluorescence Energy Resonance Transfer (FRET) and Fluorescence Lifetime Imaging (FLIM).
Unfortunately, GFP cannot be observed directly by EM, thus restricting somewhat its usefulness for CLEM. Nevertheless, several procedures have been established for correlated LM and EM detection of GFP. A number of these procedures are based on the principle of 3,3′-Diaminobenzidine (DAB) oxidation by free oxygen radicals. The free radicals can be formed during the enzymatic conversion of peroxide by Horseradish Peroxidase (HRP) or during photobleaching of fluorochromes by means of intense illumination and with oxygen present. When DAB is oxidized, it polymerizes and precipitates at the site of oxidation. The osmiophilic DAB precipitate becomes electron dense when treated with osmium tetroxide and can thus be visualized by EM (Hanker, 1979; Maranto, 1982).
In principle, the fluorescence of GFP itself could be used to photo-oxidize DAB. However, this is currently a matter of debate in the literature. On one hand, Because the GFP chromophore is buried inside the protein, and because of the lack of an aqueous environment, it would not be able to generate sufficient free radicals for efficacious photoconversion of DAB (Gaietta et al., 2002; Mironov et al., 2000). On the other, Monosov et al. demonstrated that GFP targeted to peroxisomes in yeast cells was able to photo-oxidize DAB at sufficient levels to permit EM localization (Monosov et al., 1996); Grabenbauer et al. recently reported on an improved method for GFP-mediated photo-oxidation (Grabenbauer et al., 2005). The improvements of the method, which they termed GRAB for Gfp Recognition after Bleaching, consisted in the reduction of background by quenching of autofluorescence and blocking of endogenous enzyme activities and in the use of elevated oxygen content throughout the photoconversion reaction. To this date, and to the best of our knowledge, only the two studies mentioned here have employed photo-oxidation by GFP. Additional studies will be needed to further validate the practicability and universality of the approach, and the development of GFP derivatives with higher sensitivity for illumination-based EM detection may be needed to unleash its full potential.
An alternative method that also uses DAB oxidation to reveal GFP by EM, one that appears more widely accepted, is based on the detection of GFP by GFP antibodies that in turn are decorated by HRP-conjugated secondary antibodies (Mironov et al., 2000; Mironov et al., 2005). In a typical experiment, the GFP signal is first monitored in living cells by means of time-lapse fluorescence microscopy, that is, live-cell imaging. When at a given point in time the GFP signal develops an interesting pattern that merits EM clarification, the cells are rapidly fixed to immobilize the GFP pattern and underlying structures. Thereafter, the cells are permeabilized to allow access of the antibodies to the GFP epitopes, the DAB precipitation reaction is carried out, and cells are postfixed with osmium tetroxide and embedded in a resin to permit ultramicrotomy. The GFP-HRP approach has been used successfully to identify and characterize transport intermediates along the secretory pathway (Polishchuk et al., 2000). A drawback of the procedure is that the requirements for immunolabeling (mild fixation and cell permeabilization) are antithetical to optimal conditions for ultrastructural preservation. This limitation could be overcome by adapting the GFP immunodetection strategy for use with ultrathin cryosections (Tokuyasu method; see also Section 6.5.6), which is advertised for its superior ultrastructural preservation while retaining immunogenicity. In this scenario, detection of GFP should be carried out using immunogold rather than immunoperoxidase labeling (Koster and Klumperman, 2003; Polishchuk et al., 2006; Verdijk et al., 2005; Westbroek et al., 2003). Usually, the preparation of cells for cryosectioning involves enzymatic or mechanic dispersion and centrifugation to obtain a cell pellet that is suitable for freezing. However, these steps will obliterate the spatial coordinates needed for correlating cells at the LM and EM level. To circumvent such problems, Oorschot et al. have developed a flat-embedding method that allows for ultracryotomy of cultured cells while preserving their topology (Oorschot et al., 2002).
The aforementioned procedures for the detection of GFP at the EM level suffer from limitations with regard to the precision of correlation that can be achieved between the LM and EM images. This is because the LM image represents an optical section through a cell layer, which cannot be exactly matched with the EM image that is taken from an ultrathin section cut through the same cell layer. Using high resolution (i.e., high numerical aperture) objectives in combination with image deconvolution, the optical section thickness that can be attained is typically around 200 nm, whereas an ultrathin section usually varies in thickness from 50 to 70 nm. In addition to this mismatch between optical and ultrathin section thickness, there may be a discrepancy between the relative depths in the cells at which the sections are taken. Furthermore, there may be differences in the planar angle of the light optical and electron optical section because of the realignment of the cell or tissue block in the ultramicrotome.
6.4.1.2 Tetracysteine Tags
Although GFP and its derivatives have been successfully incorporated into many different proteins without detectably interfering with the functions of these proteins, the considerable size of the GFP analogs (approximately 30 kDa) can pose a problem when coupled to smaller proteins (Evans and Martin, 2002; Frischknecht et al., 2006). This was elegantly demonstrated in a study by Andresen et al., which showed that the genetic tagging of GFP to β-tubulin was nonviable in haploid yeast cells, while tagging with shorter sequences did not interfere with the formation and dynamics of microtubules (Andresen et al., 2004). For this reason, alternative genetically encoded markers that are smaller and thus less likely to interfere with the biological function of the tagged protein are sought. A method that is becoming increasingly popular is based on protein tagging with a tetracysteine (4C) motif, which is a small peptide sequence of 10–20 amino acids containing two pairs of cysteine residues that flank a pair of spacer amino acids (Cys-Cys-Xaa-Xaa-Cys-Cys, where Xaa represents a noncysteine amino acid) (Giepmans et al., 2006; Tsien, 2005). This motif can bind to fluorescent biarsenical derivatives, each arsenic interacting with one of the cysteine doublets. The most widely employed biarsenical dyes are the green light emitting FlAsH (Fluorescein-Based Arsenical Hairpin Binder) and the red light emitting ReAsH (Resorufin-Based Arsenical Hairpin Binder) (Machleidt et al., 2007; Tsien, 2005). These dyes are membrane permeable and can therefore be used to label 4C tags in living cells (Gaietta et al., 2002; Rudner et al., 2005). Because arsenics are potentially cytotoxic, FlAsH and ReAsH need to be administered to the cells in combination with an antidote, such as 1,2-ethanedithiol or β-mercaptoethanol. In addition to reducing the toxicity of the biarsenical dyes, the antidote diminishes the fluorescence of the dyes before their binding to a 4C motif. Nevertheless, background fluorescence is an issue in this technique that can hamper the detection of weak signals. Part of this background fluorescence can be due to nonspecific binding of biarsenicals to endogenous proteins that are cysteine-rich (Stroffekova et al., 2001). Considerable effort has been directed toward optimizing the 4C/biarsenical labeling technique, and the future is likely to hold further improvements. Already, new biarsenical probes that produce less background have been devised, and novel 4C motifs that display higher affinity and stronger fluorescence have been found (Adams et al., 2002; Martin et al., 2005; Spagnuolo et al., 2006).
The 4C/biarsenical detection system can also be employed for CLEM. Gaietta et al., showed that ReAsH bound to tetracysteine motifs and immobilized by chemical fixation was able to photoconvert DAB (Gaietta et al., 2002). This technique allowed the authors to demonstrate differences in the intracellular trafficking route between newly synthesized and older connexins, which are the building blocks of gap junctions (Sosinsky et al., 2003).
6.4.1.3 Theme Variations: Split GFP and GFP-4C
As discussed in Sections 6.4.1.1 and 6.4.1.2, the currently available toolbox of genetic probes for live-cell imaging and CLEM has a number of limitations. Thus GFP and GFP analogs can cause functional interference and may produce only weak photoconversion reactions, while nonspecific reactions, cytotoxic effects, and the need for a reducing environment can plague the 4C/biarsenical system. Indeed, establishing a procedure for live-cell imaging and CLEM always implies that one needs to find a compromise between functional integrity and experimental feasibility. And for as long as the ideal probe remains to be discovered, there is merit in developing adaptations of existing detection systems that may remedy some of the side effects.
Ghosh et al., showed that when GFP is split into two polypeptides they will not fluoresce independently, but when coexpressed in bacteria they will reconstitute and fluoresce (Ghosh et al., 2000). However, in order for the reconstitution to occur, the polypeptide sequences needed to be linked to antiparallel leucine zipper domains. Cabantous et al., extended this research and engineered self-assembling GFP fragments (Cabantous et al., 2005). They showed that small GFP fragments (16 amino acids long), coupled to the protein of interest via a linker peptide, could self-assemble with the complementary GFP fragment that was expressed separately. Because the split GFP approach involves the coming together of two GFP fragments, it has been proved to be useful to study protein–protein interactions, coexpression, and conformational changes in proteins (Magliery et al., 2005; Zhang et al., 2004). In the future, it may also become a powerful alternative to the 4C/biarsenical system by displaying the same advantage as the latter (small tag attached to protein of interest) but without the disadvantages. It would be conceivable then to expand the complementary GFP fragment with an HRP sequence ( ∼ 44 kDa) to achieve optimal DAB oxidation for CLEM.
In a different adaptation published recently, part of the Golgi resident enzyme α-mannosidase II was fused to a hybrid tag containing both a GFP and a 4C sequence (Gaietta et al., 2006). This construct was used to study by means of CLEM the reassembly of the Golgi apparatus in daughter cells formed during mitosis. Live-cell imaging was carried out by monitoring the GFP fluorescence, while 4C/ReAsH was used to photoconvert DAB for visualization at the EM level. The advantage of this procedure lies in the fact that the photoconversion of DAB was not triggered by direct excitation of ReAsH but by FRET between GFP and ReAsH. Because FRET occurs only when the participating fluorochromes are less than ∼ 8 nm apart, the DAB precipitation becomes more specific as background fluorescence of ReAsH is virtually eliminated.
6.4.2 Probes to Detect Endogenous Proteins
The genetic approaches outlined in Section 6.4.1 can be very powerful for studying a protein's dynamic function, localization, and interactions. However, since a genetically tagged protein is always overexpressed in cells or tissues, it may affect in unpredictable ways its own behavior and that of its endogenous counterpart (Andresen et al., 2004; Hanson and Ziegler, 2004). Therefore, there is a constant necessity to obtain feedback from nontransformed cells or tissues. The most widespread detection system is based on the recognition of unique epitopes in proteins by monospecific antibodies. The antibodies can be visualized by fluorochromes, gold particles, or the product of an enzymatic reaction (e.g., HRP/DAB) (Sternberger, 1986). Often, the label is not conjugated to the primary antibody but to a secondary detection molecule that recognizes the primary antibody; the secondary molecule can be an antibody as well or the bacterially derived protein A and protein G. The advantages of indirect immunobased detection are that (i) the cross-linking of the label does not compromise the specificity of the primary antibody, (ii) it opens up the possibility of signal amplification, and (iii) the same secondary probe can be used to detect different primary antibodies.
Immunocytochemical procedures usually require prior chemical fixation of the biological material, and to ensure accessibility of intracellular epitopes to the detection molecules, membranes have to be permeabilized. Paradoxically, only mild chemical fixatives can be used, as the stronger fixatives suppress the immunogenicity of the specimen. Weak fixation and permeabilization have a negative impact on the ultrastructural preservation. It follows that protocols for immuno-EM necessitate a careful balance of antigenicity and preservation.
In addition to antibody-based detection systems, there are a number of compounds that display high affinity for specific proteins and that can be conjugated to fluorescent or other types of indicators. Classic examples are the cytoskeletal markers, phalloidin and paclitaxel. Phalloidin is a toxin derived from the death cap mushroom, Amanita phalloides, and binds specifically to filamentous actin (Small et al., 1999; Vetter, 1998; Wulf et al., 1979). Paclitaxel, better known by its trade name Taxol, is a compound derived from the bark of the Pacific yew tree, Taxus brevifolia, and labels microtubules (Manfredi et al., 1982). Eosin-labeled phalloidin is not only fluorescent but also suitable for photo-oxidation, ergo for CLEM (Capani et al., 2001). Because phalloidin and eosin are both small molecules, they can easily penetrate fixed cells and tissues.
6.4.2.1 Antifluorochrome Antibodies
Antibodies raised against fluorochromes can be used to bring a gold label in the vicinity of a fluorescent label. The feasibility of this approach was first demonstrated in the early 1990s by van Dam et al., who used gold-conjugated antibodies against Fluorescein Isothiocyanate (FITC) to detect at the ultrastructural level a protein (gut-associated circulating cathodic antigen) in the worm Schistosoma mansoni (van Dam et al., 1991). Hence the technique is potentially useful for CLEM studies. Recently, Coleman et al., reported that the fluorochrome Alexa Fluor 488 remains immunoreactive even after fixing with glutaraldehyde and osmium tetroxide, embedding in epoxy resin, and etching with sodium ethoxide (Coleman et al., 2006). They demonstrated that it was thus possible to perform pre-embedding immunolocalizations of a transporter and an ion channel in rat kidney and to detect the Alexa Fluor 488 label subsequently in semithin and thin plastic sections with anti-Alexa Fluor 488 antibodies. These antibodies were in turn detected by secondary antibodies conjugated either to a fluorophore for LM or to colloidal gold for EM.
6.4.2.2 Combined Fluorescent and Gold Probes
The ideal CLEM probe is self-contained and visible by LM as well as by EM. One possible design that has received reasonable attention in the literature is to conjugate to the same antibody or antibody fragment both a fluorochrome and a gold particle. Early attempts to generate such a probe led to the notion that fluorescence is quenched by colloidal gold, presumably by FRET from the fluorochrome to the gold particle (Powell et al., 1998). Despite that, secondary antibodies with both a fluorochrome conjugate and 5- or 10-nm colloidal gold are still commercially available. Kandela and Albrecht recently demonstrated that these are actually a mixture of antibodies carrying either fluorochromes only or both fluochromes and colloidal gold. They went on to show that the fluorescence of the colloidal-gold-conjugated antibodies was almost completely quenched (Kandela and Albrecht, 2007). These probes are therefore not suitable for a 1:1 colocalization as is ideally required for correlation between LM and EM, especially when taking into account the difference in penetration rate between antibodies with and without a gold label.
The problem of fluorescence quenching by gold can be overcome by using small gold cluster complexes, that is, nanogold, instead of colloidal gold (Robinson and Vandre, 1997). Owing to the smaller size of the gold particle, there is an additional advantage, namely, the probe can penetrate cells and tissues more readily. The accessibility of antigenic sites to FluoroNanogold probes is further increased by coupling the fluorochrome and nanogold to only that portion of an antibody (the Fab′ fragment) that binds to the antigen. However, nanogold particles are too small and display too little contrast to be observed by EM at the normal magnification range for heavy-metal-stained biological specimens. An enlargement step is therefore required to increase the size and contrast of the gold particles. This can be achieved either by gold toning or by silver enhancement (Baschong and Stierhof, 1998; Sawada and Esaki, 2000). Both techniques are prone to artifacts, ranging from ultrastructural modifications to nonspecific precipitations (Baschong and Stierhof, 1998). They also eliminate the fluorescent properties of the fluorochrome, so that fluorescence microscopy needs to be performed before the enlargement step. It is possible, however, to view the silver-enhanced immunogold signal by means of brightfield LM, thus allowing for precise correlation between the fluorescence and electron microscopic images. Notwithstanding the pitfalls associated with the use of FluoroNanogold, a number of studies have emphasized its potential for CLEM applications. Most notably, Takizawa and Robinson applied FluoroNanogold to ultrathin cryosections of human placental tissue and were thus able to investigate by CLEM the subcellular distribution of markers of caveolae and endosomes (Takizawa and Robinson, 2003). A spin-off of this research was the realization that because of their thinness, ultrathin cryosections yield very sharp fluorescence micrographs that lack z-axis blur (Mori et al., 2006).
6.4.2.3 Quantum Dots
Quantum Dots (Qds) are inorganic fluorescent semiconductor nanocrystals. They possess unique properties that are extremely advantageous for biomedical applications in general, and CLEM in particular: (i) QDs can be tuned to emit light at a wide spectrum of wavelengths by changing their composition and size; (ii) in comparison with organic fluorophores, QDs possess a long Stoke's shift and a narrow emission spectrum, thus allowing for superior spectral separation and improved detection sensitivity; (iii) QDs of different emission wavelengths can be excited by the same excitation wavelength, which facilitates imaging of multiple labels; (iv) unlike organic fluorophores, QDs can be illuminated over extended periods of time without showing any noticeable photobleaching; (v) because they are inorganic, QDs are resistant to biodegradation and can therefore be used for in vivo imaging over extended periods of time; (vi) QDs possess elevated two-photon absorptivity (up to 47,000 Goeppert-Mayer units), making them ideal for multiphoton fluorescence microscopy; and (vii) QDs are electron dense, and their sizes are within the range of immunogold particles, so that they can be detected by EM (Bruchez, 2005; Giepmans et al., 2005; Jaiswal and Simon, 2004; Larson et al., 2003; Nisman et al., 2004).
QDs are rapidly finding applications in many areas, ranging from nanotechnology to consumer electronics. The composition of QDs varies accordingly, and many laboratories are working on new and improved flavors. QDs that are employed in fluorescent probes typically possess a core–shell structure, the core consisting of cadmium selenide (CdSe) and the shell of zinc sulfide (ZnS). This core–shell configuration results in enhanced quantum yield and photostability. The size of the core determines the wavelength of the emitted light. Without modifications, QDs are toxic and hydrophobic, properties that are incompatible with studies in living cells, tissues, or whole organisms and that render difficult their conjugation to biomolecules. Therefore, QDs for biomedical research are encapsulated with a polymer to prevent leaking of the toxic metals and to permit binding of biomolecules. Nevertheless, the potential toxic effects of QDs remain an area of concern among many investigators (Chang et al., 2006; Hardman, 2006; Ryman-Rasmussen et al., 2007). It is a complicated matter because QDs can have such different compositions and consequently display very different degrees of toxicity.
QDs have been used and are commercially available as conjugates with secondary antibodies or streptavidin for indirect detection methods, but they can also be labeled directly to the primary detection molecule. Owing to their size and properties, QDs cannot traverse the membrane of cells, thus limiting their usefulness for live-cell imaging. It is therefore a challenge for current research to devise protocols that allow passage of QDs across the membrane of living cells. Hoshino et al., took a step in this direction by demonstrating that QDs conjugated with peptides that encode either a nuclear localization signal or a mitochondrial localization signal are rapidly targeted to nuclei or mitochondria, respectively, of cells in culture (Hoshino et al., 2004). Another strategy involves the uptake of QDs via endocytosis, allowing, for instance, monitoring of the dynamics of receptor internalization (Chang et al., 2006; Genovesio et al., 2006; Michalet et al., 2005; Seleverstov et al., 2006; Sundara Rajan and Vu, 2006). Recently, Duan and Nie reported that a surface coating of QDs with polyethylene glycol grafted polyethylimine allows the QDs to escape from endosomes via endosomolysis (Duan and Nie, 2007). Although it is a stretch to name these QDs “cell penetrating,” they represent promising candidates for intracellular delivery of QDs. Further data will be needed to assess their cytotoxicity and their ability to be stably conjugated to biological detection molecules such as antibodies.
6.4.2.4 Dendrimers
Dendrimers constitute an exciting new class of nanocarriers. They are named after their dendritic architecture, which consists of branched subunits attached to a central core. The surface of dendrimers can be modified to confer special properties pertaining to their biocompatibility (Najlah and D'Emanuele, 2006). Dendrimers have already found numerous applications in pharmaceutics. Their ability to encapsulate drugs allows for site-specific and controlled drug delivery, protection of drugs against premature biodegradation, decreased toxicity, and improved solubility. In addition to the entrapping of molecules within the dendritic structure, it is possible to conjugate molecules, such as antibodies, to surface groups of dendrimers (Roberts et al., 1990). Of special interest is the ability of dendrimers to enter cells, which renders them very useful as carriers for intracellular delivery (Najlah and D'Emanuele, 2006). As a matter of fact, dendrimers are already used quite successfully as gene carriers, that is, transfection agents, and are commercially available for that purpose (SuperFect reagent from Qiagen).
At the time of writing, there are no known CLEM applications yet that employ dendrimer nanotechnology. However, it is in the line of expectation that this will change soon, as there is growing awareness of the potential benefits of using dendrimers as nanoprobes. A particularly promising area of research involves the coating of QDs with dendrimers (Liu et al., 2006). In doing so, Wisher et al. recently demonstrated that dendrimer-coated QDs, with a total diameter of 11 nm, were internalized by NT2 cells and that these fluorescent nanocarriers could cotransport the calcium-binding protein, S100A4 (Wisher et al., 2006). The mechanism via which dendrimers are internalized appears to involve endocytosis. Escape of the dendrimers and their cargo from endosomal compartments are likely to represent a major obstacle for efficient cytosolic delivery. If future research unequivocally demonstrates that dendrimer-based nanoprobes can effectively translocate from endosomal compartments to the cytosol, they will become extremely powerful tools for live-cell imaging and CLEM detection of endogenous proteins and other molecules.
6.4.3 Probes to Detect Nonproteinaceous Molecules
In principle, all of the indicators discussed in Section 6.4.2 can also be employed to visualize biomolecules that are nonproteinaceous (e.g., lipids, nucleic acids, sugars). To this effect, they need to be conjugated to specific bioprobes. To name a few, lectins derived from either plants or animals are used to detect various sugar residues, oligonucleotides can be designed and synthesized to detect specific RNA and DNA sequences, and cholera toxin binds to plasma membrane ganglioside GM1, which partitions into lipid rafts. Some probes for nonproteinaceous molecules display intrinsic fluorescent properties, thereby obviating the need for conjugation to a separate fluorochrome. A widely used example of such a probe is FM 1-43, an amphipatic molecule that intercalates into the outer leaflet of lipid bilayers, after which its fluorescence increases greatly. FM 1-43 is often employed to visualize activity-dependent membrane recycling, that is, the coupled process of endocytosis and exocytosis, in nerve terminals (Cochilla et al., 1999). Of particular interest for CLEM, it has been shown that FM 1-43 can be detected at the EM level via photo-oxidation of DAB (Darcy et al., 2006; Henkel et al., 1996; Nishikawa and Sasaki, 1996).
6.5 Clem Applications
6.5.1 Diagnostic Electron Microscopy
The advent of Enzyme-Linked Immunosorbent Assay (ELISA) and nucleic acid amplification tests has led to a considerable diminution in the diagnostic use of EM (Biel and Gelderblom, 1999). Nevertheless, there are still numerous clinically important diseases where EM excels as a diagnostic tool. These include skin and renal diseases involving structural defects of components of the extracellular matrix, in particular collagen; ciliary disorders such as Kartagener's syndrome where dynein arms and other components of the axoneme are absent or defective; lysosomal storage diseases; and pulmonary conditions caused by intrapulmonary deposits, especially asbestos (Alroy and Ucci, 2006; Carlen and Stenram, 2005; Foster et al., 2005; Howell et al., 1998; Suzuki et al., 2005). Diagnostic EM is also a vital and powerful tool for the identification of infectious agents such as viruses. When combined with a negative stain procedure, it is a more rapid method for viral diagnosis than other diagnostic tests that are currently available (Biel and Gelderblom, 1999). Moreover, and in contrast to other tests, diagnostic EM does not require any prior assumptions about the nature of the infectious agent, so that even unexpected pathogens can be detected. It is this same undirectedness that renders EM also important as a tool for assessing tumor cell lineage in the course of tumor diagnosis. Examples of ultrastructural determinants for cell lineage are Birbeck granules (Langerhans cells), lamellar bodies (alveolar epithelial type II cells), Weibel-Palade bodies (endothelial cells), and intercellular junctions (epithelial cells).
CLEM can complement diagnostic EM techniques as a means to facilitate the search in biopsies for areas of disease that require ultrastructural analysis. Thus, at the LM level, tissue samples can be surveyed to obtain rapidly relevant information on the orientation, architecture, and location of tissue components (Jones et al., 1982). It is then a matter of selecting areas of interest, which can be zoomed into at the EM level. To give an example, thin basement membrane nephropathy and X-linked Alport syndrome are glomerular disorders that are characterized by diffuse thinning of the glomerular basement membrane. Ultrastructural examination of renal biopsies is considered an essential step toward the final diagnosis of these diseases. However, the thickness of the glomerular basement membrane varies greatly, and to obtain accurate measurements, care must be taken that the methods for tissue preparation and morphometry are standardized. For instance, it is common practice to measure the thickness of the basement membrane in at least 2 glomeruli and at random sites in different capillary loops with the same orientation (Foster et al., 2005). It would be much less time consuming if the selection of areas to be measured could be done at the LM level.
The now defunct LEM 2000 combined light and electron microscope (Akashi Seisakusho Ltd., Tokyo, Japan) was equipped with a microprocessor that enabled the recording of coordinates for multiple areas of interest selected in LM mode. The coordinates could then be retrieved in EM mode to permit precise correlation with the LM fields of view. The LEM 2000 used a larger grid size (7 mm in diameter; for comparison, standard grid size is 3 mm), allowing for the observation of larger sample areas (Nelson, 1986). These features made the LEM 2000 an instrument of choice for diagnostic CLEM (Jones et al., 1982). It is therefore puzzling that the LEM 2000 has not become more of a mainstream microscope in pathology departments. Maybe it was introduced ahead of its time when its true potential could not yet be appreciated (the Commission of the European Communities decided on July 6, 1981, that the LEM 2000 may not be imported free of common customs tariffs duties because “apparatus of scientific value equivalent to the said apparatus, capable of being used for the same purposes, are currently being manufactured in the Community”). At present, it would be the right time to resurrect a combined light and electron microscope system, taking advantage of modern digital imaging techniques, microscope automation, and ever increasing computing resources. The LM mode of the LEM 2000 allowed only widefield images to be taken. Therefore, it was necessary to generate contrast by staining the ultrathin sections with toluidine blue. A modern version of an integrated CLEM system should also include the possibility of visualizing fluorescent signals in order to increase the palette of stains and probes that can be applied to specimens. As a matter of fact, such an integrated system has recently been developed. Named LEM, for light and electron microscope, it comprises a laser scanning fluorescence microscope built into a commercially available TEM (Agronskaia et al., (2008)). The principle of the LEM is illustrated schematically in Figure 6.2. The laser scanning fluorescence microscope of the LEM is a retractable unit mounted on one of the TEM's side ports. Imaging in LM and EM mode is done sequentially, using the original sample stage and specimen holder of the TEM. Intermodal coordinate retrieval is fully automated via software implementation. The lateral optical resolution of the Fluorescence Laser Scanning Microscope (FLSM) is estimated at 0.55 μm for an excitation wavelength of 470 nm. The power of the LEM system has been demonstrated already using several different biological samples. This integrated approach obliterates the disadvantages that accompany conventional CLEM procedures. It will be useful in many areas of biomedical research, such as diagnostic EM.
Figure 6.2 Schematic representation of the integrated light and electron microscope (LEM), which was recently developed as a novel approach to CLEM. The LEM comprises a Fluorescence Laser Scanning Microscope (FLSM) that is mounted as a retractable unit (depicted in orange) on one of the side ports of a commercial TEM (a). The FLSM is positioned perpendicular to the TEM specimen holder. In fluorescence microscopy mode (FM mode), the specimen and specimen holder are rotated 90° so that the specimen can be scanned by the laser beam of the FLSM unit (b). In TEM mode, the FLSM unit is retracted and the specimen tilted to the 0° position, allowing for imaging with the electron beam. (c) A typical fluorescence micrograph of a 300 μm × 300 μm area taken with the LEM in FM mode and a zoom of the boxed area acquired in TEM mode. The sample was a thin plastic section of rat duodenum in which the mucous granule fields of goblet cells were fluorescently labeled with Alexa Fluor 488 conjugated wheat germ agglutinin. The optical module of the FLSM (d) was designed to fit in the limited space available in the TEM column and to be vacuum compatible. For this reason, the objective consists of a single aspherical lens, shielded from the rest of the optical system by a thin, flat vacuum window. The fluorescence emission is detected by an Avalanche Photo Diode (APD). (With thanks to Dr Sasha Agronskaia for help with the recording of the fluorescence micrograph in (c)).

6.5.2 Ultrastructural Neuroanatomy
Neuroscientists have embraced and developed CLEM techniques to elucidate the intricate microcircuits formed by neuronal connections in the central nervous system and to correlate (electro)physiological data with morphological characteristics. Owing to their considerable size, neurons are readily classified at the LM level, while EM resolution is required to characterize their synaptic connectivity (Valentijn et al., 1989). For a long time, CLEM was performed by means of the combined Golgi-EM technique (Fairen, 2005; Peters, 2002). Central to this technique was the Golgi impregnation method, which randomly impregnated in tissue blocks a subset of neurons and glial cells with a metallic deposit. At the LM level, impregnated cells appeared dark, and cell bodies with their processes (dendrites and axons) could be viewed in three dimensions. The metallic impregnation was electron dense, so that the same neurons could be identified at the EM level. Several enhancements to the technique, such as deimpregnation and gold toning, resulted in finer ultrastructural detail (Fairen, 2005).
Today, the Golgi-EM technique has fallen from grace; as alternatives, more predictable methods are available. These include intracellular or juxtacellular injection of fluorescent tracers (e.g., lucifer yellow) and loading of synaptic vesicles with FM 1-43 or one of its spectral variants (Cochilla et al., 1999; Stewart, 1981). Photoconversion of DAB can then be used to obtain an electron-dense label for EM analysis (Maranto, 1982; Nikonenko et al., 2005). Another approach is to perform pre-embedding labeling of the tracer with silver-enhanced ultrasmall gold (Morozov et al., 2002).
6.5.3 Live-Cell Imaging
The recent surge in live-cell imaging research and the concomitant development of genetic probes account in a large part for the renaissance of CLEM techniques that is currently taking place. The combination of CLEM and live-cell imaging opens up the possibility to obtain ultrastructural information at a chosen moment during the progression of a dynamic process that was captured at LM resolution. Hence, instead of representing a static image with features of unknown pedigree, an EM micrograph now becomes a high resolution “snapshot” in which the features have a known history. The interpretational gain is therefore immense. An elegant example of the power of CLEM combined with live-cell imaging is the work of Svitkina and Borisy on actin dynamics (Svitkina and Borisy, 1998; Svitkina et al., 2003). By combining live-cell imaging of GFP-actin with platinum replica EM, these authors were able to develop models explaining the molecular mechanisms by which lamellipodia and filipodia are formed. This is also a demonstration of live-cell imaging at its simplest: making use of unique features to detect actin filaments at the EM level, there was no need to apply a label for EM visualization.
The studies by Svitkina and Borisy took advantage of the fact that the cellular protrusions they investigated were thin enough to be imaged in toto. It is a commonly encountered problem, however, that the cells in which a dynamic process is observed are too thick for subsequent EM analysis. The current remedy is embedding of the cells in either ice or a resin, followed by ultrathin sectioning. The drawback of this strategy, as discussed in Section 6.4.1.1, is that an optical section recorded by LM can never be matched exactly with an ultrathin section because of differences in section thickness and section angle. In the worst-case scenario, it could result in a fluorescent signal being attributed erroneously to an ultrastructural feature that is not at all present in the optical section from which the fluorescence was recorded. A prospective solution that depends on the implementation of image processing routines is to perform multimodal alignment of three-dimensional reconstructions of both LM image stacks and EM tilt series (see Section 6.5.4).
When the fluorescent signal under investigation stems from a genetically tagged protein that does not display any particular structural feature recognizable at the EM level, additional processing is required to convert the fluorescent label in an electron-dense label. Photoconversion of DAB and (silver-enhanced) immunogold labeling are the currently available options. Photoconversion appears to yield the best results when the DAB precipitation is confined to a fully or partially membrane-enclosed space, such as the lumen of a Golgi cisterna, a synaptic vesicle, or a dendritic spine (Capani et al., 2001; Darcy et al., 2006; Grabenbauer et al., 2005). Owing to the nature of the reaction, DAB staining is rather diffuse. As a consequence, there is limited high resolution information available in DAB-labeled structures. Immunogold labeling, on the other hand, can be capricious, as several parameters pertaining to sample preparation (e.g., fixation, permeabilization) influence the efficacy and uniformity of the label. In this regard, when one scrutinizes published examples, the correlation between fluorescent and immunogold signals can sometimes be quite obscure.
6.5.4 Electron Tomography
Analogous to the miscellaneous forms of tomography used in modern diagnostic medicine—several of which are discussed in the present volume—electron tomography is a technique that generates a 3D reconstruction, that is, a tomogram, from a series of 2D images taken of a 3D object at different viewing angles (Koster et al., 1997; McEwen and Marko, 2001). As its name indicates, electron tomography deals with 2D images that are acquired with an electron microscope. The high resolution of EM enables electron tomography to model structures that are as small as macromolecules. The different 2D viewing angles are obtained by tilting the specimen in the electron beam while acquiring images at discrete tilt angles (McIntosh et al., 2005). With increasing tilt angles, the path length of the electron beam through the specimen increases gradually, up to a point where the majority of the electrons are scattered and image detail is lost. In practice, this means that the maximum usable range of tilt angles goes from − 70 to 70°. As a consequence, tomograms display a so-called missing wedge artifact due to the lack of 3D information at higher tilt angles. The missing wedge is characteristic for electron tomography, that is, it is not found in medical tomographies. It causes a distortion along the viewing axis perpendicular to the tilt axis, which results in the fading of linear structures such as membranes and fibers. Fortunately, the missing wedge artifact can be greatly reduced by tilting the specimen around two orthogonal axes, resulting in a dual-axis tomogram (Marsh, 2005; McIntosh et al., 2005).
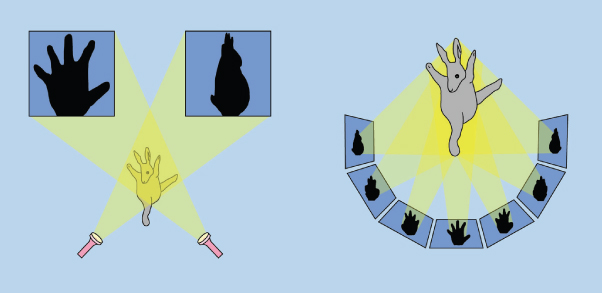
The development and implementation of electron tomographic techniques goes hand in hand with the ongoing progress in computer-assisted microscope automation, digital image acquisition, and computing resources (Leapman, 2004). A powerful computing environment is important not only to display the large data sets tomograms consist of but also to calculate the 3D reconstructions from the 2D data. Several algorithms are available to generate tomograms, but the most commonly used are based on the principle of back projection (Fig. 6.3).
Figure 6.3 The principle of electron tomography. Depending on the projection angle of the light source, the 3D rabbit will cast a different 2D shadow. By analogy, a 3D biological sample will generate varying 2D projections when it is tilted in the electron microscope. By back projection of a series of 2D images into a virtual 3D space, the source 3D object can be reconstructed. (Based on a cartoon by John O'Brien, which appeared in The New Yorker magazine).
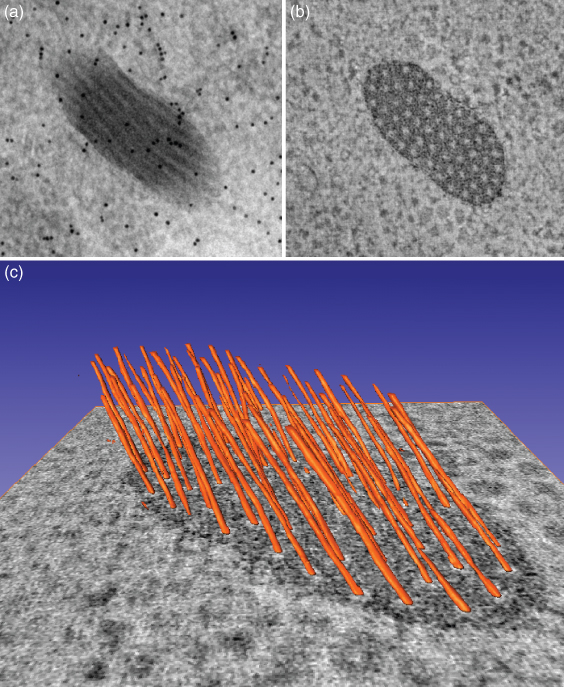
With an appropriate viewer program, tomograms can be browsed slice by slice, and along any of the three axes. Each tomographic slice represents an image that is just a few nanometers thick. The resolution is comparably high on all three axes. Conversely, in a conventional 2D electron micrograph the lateral resolution is also in the order of a few nanometers, but the z-axial resolution is limited by the section thickness (typically 50–70 nm; Fig. 6.4) (McIntosh et al., 2005). The fine structural detail in three dimensions revealed by a tomogram can be overwhelmingly complex. It is therefore common practice to generate graphic models in which features of interest are accentuated by different colors; shadows and color gradients are applied to simulate lighting and perspective (for some colorful examples, see References Marsh, 2005; McIntosh et al., 2005; Trucco et al., 2004). These graphic representations can be drawn by hand or generated with the assistance of image processing routines such as an edge detection filter.
Figure 6.4 The power of electron tomograpy. Images illustrate alternative views of a Weibel-Palade body, a specialized secretory granule, in a human umbilical vein endothelial cell. The Weibel-Palade body measures approximately 450 × 200 nm. (a) A standard 2D electron micrograph. Note the ill-defined boundaries of the Weibel-Palade body, which appears to contain seven longitudinal striations running in parallel. The black dots correspond to 10-nm gold particles; they were applied on the section as fiducial markers to aid in the alignment of the tomographic images. (b) A tomographic slice 4 nm thick taken from the reconstruction of the Weibel-Palade body after imaging by dual-axis tomography. Note that the boundaries are much sharper and that the organelle now contains 58 cross-sectioned tubules. (c) A 3D model of the internal organization of the Weibel-Palade body, superimposed on a tomographic slice. Evidently, the tomography data reveal important features that are masked in the 2D micrograph.
Electron tomography is still too time consuming to allow for live 3D browsing of a specimen. For this reason, areas of interest need to be selected in 2D views. If the electron-accelerating voltage of the electron microscope is sufficiently elevated or if an energy filter is used, high resolution electron tomograms can be made from specimens that are up to 400 nm thick, and yet thicker specimens have been imaged with special high voltage electron microscopes. Even at more standard specimen sizes (around 200 nm thick) for electron tomography, it can be difficult to find areas of interest in a 2D image because of the stacking of electron-dense features that obscure the image. In this respect, CLEM has the potential to facilitate the search for areas of interest, as the section thickness will not obscure photon-based imaging. Crucial for this application is the availability of fluorescent labeling protocols that are compatible with thin plastic sections and EM processing. An alternative approach that is interesting to highlight here is the GRAB technique by Grabenbauer et al., already mentioned in Section 6.4.1.1, which allowed the authors to study by means of CLEM and electron tomography the Golgi distribution of the glycosylation enzyme N-acetylgalactosaminyltransferase (Grabenbauer et al., 2005).
Apart from aiding in the retrieval of areas of interest, CLEM techniques are also invaluable for electron tomography in combination with live-cell imaging. Thus McEwen et al. used video LM to track chromosome movement in living cells and subsequently employed CLEM to perform electron tomography on the kinetochores of the same chromosomes (McEwen et al., 1997).
6.5.5 Cryoelectron Microscopy
Electron microscopists working in the life sciences have always been concerned with possible side effects of chemical fixation, dehydration, embedding, and contrasting on the ultrastructural preservation of tissues, cells, or isolated macromolecular complexes (see, e.g., Murk et al., 2003). Thus, the question arises as to what extent structural and molecular interactions observed in heavily processed specimens reflect the functioning in living cells. Cryoelectron microscopy emerged out of an urge to address this very question (Lucic et al., 2005; McIntosh, 2001). Central to cryoelectron microscopic techniques is the preservation of biological specimens in their native, that is, hydrated, state. This is done via vitrification, a process whereby the specimen is cooled very rapidly to liquid nitrogen temperatures, so that the water in and around the specimen becomes vitreous, that is, an amorphous or noncrystalline liquid (Costello, 2006). In the process, all molecules become immobilized without any alteration in their location or chemical composition. This is sometimes referred to as cryofixation, which is a confusing term because it wrongly suggests that the molecules are cross-linked.
The most commonly used vitrification methods are plunge freezing and high pressure freezing (Braet et al., 2007; McDonald and Auer, 2006; McIntosh et al., 2005). The former consists in the plunging of the specimen into a cryogen, ethane or propane, that is cooled by liquid nitrogen, and the latter uses high pressure (around 2100 bar) combined with rapid freezing to prevent ice crystal formation. Plunge freezing is limited by a vitrification depth of just a few micrometers and is therefore suitable only for thin cells and suspensions of macromolecules. High pressure freezing, on the other hand, permits cryoimmobilization of samples up to 0.2 mm thick and is therefore also suitable for tissue fragments such as biopsies.
There is a price to be paid when studying biological samples in their native state. First, samples need to remain cooled at all times after vitrification to avoid ice crystal formation, which will occur if the temperature rises to − 135°C or higher (Al-Amoudi et al., 2004). This requires highly specialized equipment and techniques for handling and imaging. Second, cryoelectron micrographs display an elevated signal to noise ratio because of the lack of image contrast. The reason for this is that the samples cannot be stained and they can only be viewed under low electron dose conditions in order to avoid radiation damage. Third, when the specimen thickness reaches 1μm or above, it cannot be observed anymore by a regular TEM. This restriction can be overcome by cutting ultrathin vitreous sections of the objects that are too large for direct observation (Al-Amoudi et al., 2004). This approach, termed CEMOVIS for Cryoelectron Microscopy of Vitreous Sections, adds to the complexity and required skills of the whole sample preparation procedure. Despite all the limitations mentioned here, several laboratories around the world perform cryo-EM and CEMOVIS routinely and successfully.
Cryo-EM is most rewarding when combined with tomography. Cryoelectron tomography allows for the 3D imaging of cellular components in a close-to-native state, with a resolution of 4–5 nm, high enough to detect macromolecular complexes (Grunewald et al., 2003; Steven and Aebi, 2003). There is increasing awareness that many of a cell's molecules are organized in larger macromolecular complexes or machines (Chiu et al., 2006; Nogales and Grigorieff, 2001), of which the ribosome is the quintessential example (Medalia et al., 2002); other examples are the nuclear pore complex (Beck et al., 2004) and the proteasome (Nickell et al., 2007; Walz et al., 1998). One of the most exciting applications of cryoelectron tomography is to map the cellular distribution of such macromolecular complexes. The mapping is achieved with the help of computational methods, in particular, pattern-recognition algorithms such as template matching via cross-correlation. This field of research, which was baptized “visual proteomics” by one of its front-runners, the Baumeister group at the Max Planck Institute in Martinsried, Germany, aims at establishing 3D atlases of supramolecular structures in cells (Nickell et al., 2006). Once available, these atlases would have the potential to provide novel insights into the spatial regulation of protein interactions.
The aforementioned low contrast conditions and low electron dose requirements for cryo-EM make it particularly difficult to retrieve areas of interest. Quite frequently, one only knows if the selected areas are interesting after the final image or tilt series is collected and enhanced by image processing routines. Several laboratories are currently developing cryo-CLEM methods as a tool to identify areas for subsequent cryo-EM analysis (Leis et al., 2005; Sartori et al., 2005). The technical challenge these laboratories are facing is that fluorescence microscopy needs to be performed on specimens kept at liquid nitrogen temperatures, while using optics that yield sufficient resolution to obtain subcellular detail. Furthermore, labeling with a fluorescent marker needs to be carried out before the cryoimmobilization procedure. This is an additional complication, because many fluorescent probes cannot penetrate the plasma membrane of living cells without additional treatment, such as microinjection, lipofection, or electroporation.
6.5.6 Immuno Electron Microscopy
Ultrastructural studies emanating from a cell biological question often call for the localization of a specific protein. Immunogold detection is the most widely used method. There are several strategies for decorating the protein of interest with an immunogold tag. Pre-embedding immunogold labeling is carried out on chemically fixed material before resin embedding. To enhance penetration of the antibodies and gold particles, the specimen is usually permeabilized. This can be done by using a detergent to extract membranes or by using a number of freeze-thaw cycles to puncture membranes with ice crystals (Stirling, 1990); some investigators even go as far as smashing tissue fragments in a homogenizer (Michalet et al., 2005). It will come as no surprise that these techniques yield poor ultrastructural preservation.
Much better preservation can be obtained with postembedding immunogold labeling on ultrathin sections. The Tokuyasu method, named after its inventor, utilizes ultrathin sections of chemically fixed material, cut by means of cryoultramicrotomy (Liou et al., 1996; Tokuyasu, 1973); the labeling and microscopy, however, is performed at room temperature. This technique can be combined with electron tomography, and as such, it has enabled Zeuschner et al., to analyze COPII-coated transport carriers between the endoplasmic reticulum and the Golgi apparatus (Zeuschner et al., 2006). Immunogold labeling can also be performed on ultrathin sections of resin-embedded specimens. Acrylate- and methacrylate-based resins can be directly labeled, while epoxy resins require additional treatment, such as surface etching with sodium ethoxide, for antigen retrieval (Groos et al., 2001; Newman and Hobot, 1999). Freeze substitution is the preferred method for specimen infiltration with resin, as it results in improved morphology and immunoreactivity (Shiurba, 2001. The principle behind freeze substitution is to replace the ice in a cryoimmobilized specimen by an organic solvent (e.g., acetone or methanol) while a low temperature is maintained (-80 to − 90°C) (Giddings, 2003; Shiurba, 2001). As the temperature is slowly raised, fixatives added to the solvent will start to cross-link biomolecules in the sample. Subsequently, the sample is infiltrated with resin, and the resin is polymerized either by UV illumination at low temperatures ( − 30°C) or by warming (60°C).
The postembedding immunostaining techniques can be adapted for CLEM by using bifunctional probes, such as antibodies conjugated to FluoroNanogold, HRP/DAB, or QDs (Groos et al., 2001; Robinson et al., 2001). Alternatively, probes that only provide visual clues at the LM level to reveal histoarchitectural features can be used, which can aid in general orientation and identification of specific areas (McNary et al., 1964). In a number of studies, CLEM has been carried out on adjacent ultrathin and semithin sections cut by cryoultramicrotomy (Mironov et al., 2003; van der Wel et al., 2005). The rationale for this approach is that the semithin cryosectioning technique allows for the sampling of larger tissue areas, typically 2 × 2 mm; this facilitates the pinpointing of areas of interest, which can then be isolated by further trimming of the specimen block to an area, typically 300 × 200 μm, suitable for ultrathin sectioning and immunogold labeling for immuno-EM (van der Wel et al., 2005).
6.6 Future Perspective
The ultimate CLEM experiment would yield a 3D reconstruction that combines perfectly aligned fluorescence microscopic and electron tomographic data taken throughout a whole cell or tissue fragment, with a resolution in all three planes of 100–200 nm and 3–4 nm, respectively. The apotheosis would be complete if such a CLEM image volume could in turn be correlated with a 3D volume obtained by a type of medical tomography, for instance, computer tomography (CT). The main ingredients for achieving these goals are already available. Thus confocal laser scanning microscopy followed by deconvolution-based image restoration allows for optical sectioning of a cell with a z-resolution that is nearly as good as the lateral resolution of 100–200 nm (Agard et al., 1989; Hell et al., 1997). Methods for serial section electron tomography have been developed together with algorithms to join multiple tomograms (Marsh, 2005; Soto et al., 1994). The bottleneck at present is that such an endeavor would take many months if not years to complete. This is mainly due to a lack of computational tools for high throughput analysis of complex 3D data sets.
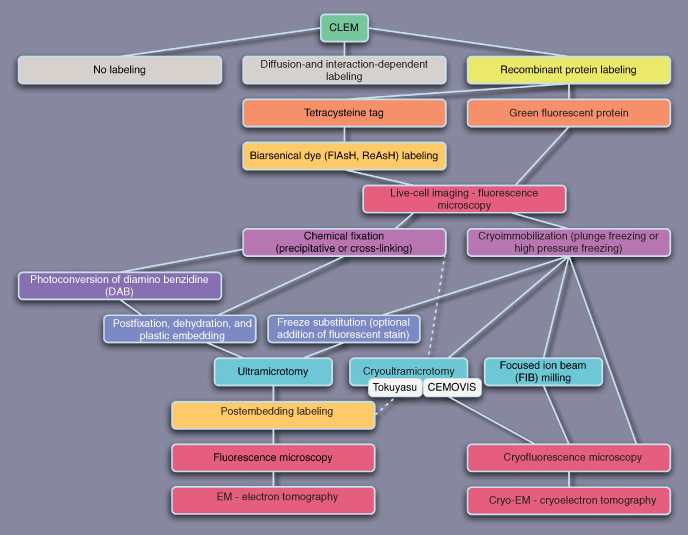
Another consideration for future directions in CLEM is the development of universally applicable protocols. Presently, many different recipes for CLEM are described in the literature, and especially for the novice venturing in this field of research, the information and available options may be daunting. This is well illustrated in Figures 6.5–6.7, which recapitulate the various CLEM strategies
discussed here. Clearly, an important reason for this amalgam of methods is the lack of a multifunctional probe that can be used ubiquitously. QDs are promising, but currently their applicability is restricted by their difficulty to traverse cell membranes. The same problem haunts fluoronanogold probes, albeit to a lesser extent, but their need for silver enhancement is not without complications as well. Future developments in the field of multimodal indicators are therefore eagerly awaited. A new generation of reporters that have the potential to form multifunctional probes is represented by infrared up-converting phosphors (Corstjens et al., 2005).
Figure 6.5 Schematic representation of possible CLEM strategies. For the sake of clarity, the flowchart has been broken down into three parts on the basis of labeling methods. This figure deals with CLEM without any labeling.
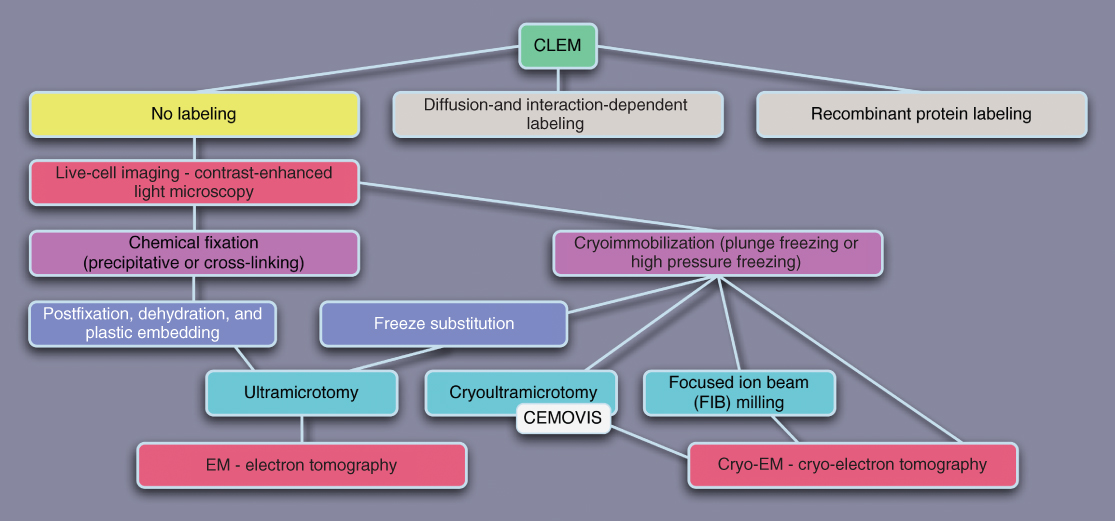
Figure 6.6 Schematic representation of possible CLEM strategies using diffusion- and interaction-dependent labeling techniques.
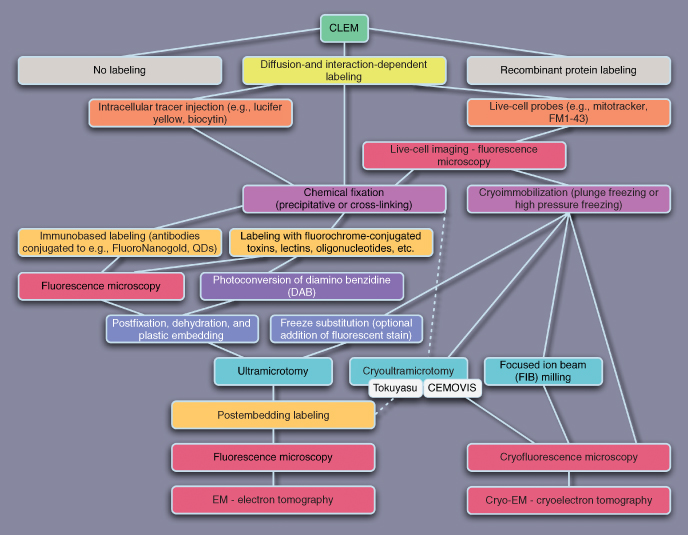
Figure 6.7 Schematic representation of possible CLEM strategies using recombinant protein labeling. Note that the tetracysteine method actually uses a combination of genetic tagging and diffusion-/interaction-dependent labeling.
New developments in instrumentation for EM and LM will also have a great impact on CLEM applications. Notably, Focused Ion Beam (FIB) technology is showing promise as a tool to thin whole frozen-hydrated cells so that they can be imaged by cryo-EM (Marko et al., 2006; Marko et al., 2007). It would be extremely helpful if a fluorescence microscopic signal could be used as a guide for the FIB procedure. In parallel, light microscopic techniques that exceed the diffraction limit of resolution by at least fivefold (e.g., Total Internal Reflectance Fluorescence Microscopy (TIRFM) and 4Pi microscopy) (Egner and Hell, 2005; Schneckenburger, 2005) have been developed. Recent advances in wet EM, also referred to as Environmental Scanning Electron Microscopy (ESEM), are likely to boost CLEM applications as well (Timp et al., 2006). Unlike conventional EM, wet EM permits the observation of hydrated samples without the need for specimen preparation (Muscariello et al., 2005).
Unquestionably, there are interesting times ahead for EM and LM techniques in general, and for CLEM in particular.
Adams SR, Campbell RE, Gross LA, Martin BR, Walkup GK, Yao Y, Llopis J, Tsien RY. New biarsenical ligands and tetracysteine motifs for protein labeling in vitro and in vivo: synthesis and biological applications. J Am Chem Soc 2002;124(21):6063–6076.
Agard DA, Hiraoka Y, Shaw P, Sedat JW. Fluorescence microscopy in three dimensions. Methods Cell Biol 1989;30:353–377.
Agronskaia AV, Valentijn JA, van Driel LF, Schneijdenberg CT, Humbel BM, van Bergen en Henegouwen PM, Verkleij AJ, Koster AJ, Gerritsen HC. Integrated fluorescence and transmission electron microscopy J Struct Biol 2008;164(2):183–9.
Al-Amoudi A, Chang JJ, Leforestier A, McDowall A, Salamin LM, Norlen LP, Richter K, Blanc NS, Studer D, Dubochet J. Cryo-electron microscopy of vitreous sections. EMBO J 2004;23(18):3583–3588.
Alroy J, Ucci AA. Skin biopsy: a useful tool in the diagnosis of lysosomal storage diseases. Ultrastruct Pathol 2006;30(6):489–503.
Andresen M, Schmitz-Salue R, Jakobs S. Short tetracysteine tags to beta-tubulin demonstrate the significance of small labels for live cell imaging. Mol Biol Cell 2004;15(12):5616–5622.
Baschong W, Stierhof YD. Preparation, use, and enlargement of ultrasmall gold particles in immunoelectron microscopy. Microsc Res Tech 1998;42(1):66–79.
Beck M, Forster F, Ecke M, Plitzko JM, Melchior F, Gerisch G, Baumeister W, Medalia O. Nuclear pore complex structure and dynamics revealed by cryoelectron tomography. Science 2004;306(5700):1387–1390.
Biel SS, Gelderblom HR. Diagnostic electron microscopy is still a timely and rewarding method. J Clin Virol 1999;13(1–2):105–119.
Biel SS, Kawaschinski K, Wittern KP, Hintze U, Wepf R. From tissue to cellular ultrastructure: closing the gap between micro- and nanostructural imaging. J Microsc 2003; 212(Pt 1):91–99.
Braet F, Wisse E, Bomans P, Frederik P, Geerts W, Koster A, Soon L, Ringer S. Contribution of high-resolution correlative imaging techniques in the study of the liver sieve in three-dimensions. Microsc Res Tech 2007;70(3):230–242.
Brock R, Jovin TM. Fluorescence correlation microscopy (FCM)-fluorescence correlation spectroscopy (FCS) taken into the cell. Cell Mol Biol 1998;44(5):847–856.
Bruchez MP. Turning all the lights on: quantum dots in cellular assays. Curr Opin Chem Biol 2005;9(5):533–537.
de Bruijn WC, Sorber CW, Gelsema ES, Beckers AL, Jongkind JF. Energy-filtering transmission electron microscopy of biological specimens. Scanning Microsc 1993;7(2):693–708, discussion 709.
Buckley IK. A simple technique for comparative light and electron microscopy of designated living cultured cells. Lab Invest 1971;25(4):295–301.
Cabantous S, Terwilliger TC, Waldo GS. Protein tagging and detection with engineered self-assembling fragments of green fluorescent protein. Nat Biotechnol 2005;23(1):102–107.
Capani F, Deerinck TJ, Ellisman MH, Bushong E, Bobik M, Martone ME. Phalloidin-eosin followed by photo-oxidation: a novel method for localizing F-actin at the light and electron microscopic levels. J Histochem Cytochem 2001;49(11):1351–1361.
Carlemalm E, Kellenberger E. The reproducible observation of unstained embedded cellular material in thin sections: visualisation of an integral membrane protein by a new mode of imaging for STEM. EMBO J 1982;1(1):63–67.
Carlen B, Stenram U. Primary ciliary dyskinesia: a review. Ultrastruct Pathol 2005;29(3–4):217–220.
Chalfie M, Tu Y, Euskirchen G, Ward WW, Prasher DC. Green fluorescent protein as a marker for gene expression. Science 1994;263(5148):802–805.
Chang E, Thekkek N, Yu WW, Colvin VL, Drezek R. Evaluation of quantum dot cytotoxicity based on intracellular uptake. Small 2006;2(12):1412–1417.
Chiu W, Baker ML, Almo SC. Structural biology of cellular machines. Trends Cell Biol 2006;16(3):144–150.
Cochilla AJ, Angleson JK, Betz WJ. Monitoring secretory membrane with FM1-43 fluorescence. Annu Rev Neurosci 1999;22:1–10.
Coleman RA, Liu J, Wade JB. Use of anti-fluorophore antibody to achieve high-sensitivity immunolocalizations of transporters and ion channels. J Histochem Cytochem 2006;54(7):817–827.
Corstjens PL, Li S, Zuiderwijk M, Kardos K, Abrams WR, Niedbala RS, Tanke HJ. Infrared up-converting phosphors for bioassays. IEEE Proc Nanobiotechnol 2005;152(2):64–72.
Costello MJ. Cryo-electron microscopy of biological samples. Ultrastruct Pathol 2006;30(5):361–371.
van Dam GJ, Bogitsh BJ, Fransen JA, Kornelis D, van Zeyl RJ, Deelder AM. Application of the FITC-anti-FITC-gold system to ultrastructural localization of antigens. J Histochem Cytochem 1991;39(12):1725–1728.
Darcy KJ, Staras K, Collinson LM, Goda Y. Constitutive sharing of recycling synaptic vesicles between presynaptic boutons. Nat Neurosci 2006;9(3):315–321.
van Driel LF, Knoops K, Koster AJ, Valentijn JA. Fluorescent labeling of resin-embedded sections for correlative electron microscopy using tomography-based contrast enhancement. J Struct Biol 2008;161(3):372–83.
Duan H, Nie S. Cell-penetrating quantum dots based on multivalent and endosome-disrupting surface coatings. J Am Chem Soc 2007;129:3333–3338.
Egner A, Hell SW. Fluorescence microscopy with super-resolved optical sections. Trends Cell Biol 2005;15(4):207–215.
Evans WH, Martin PE. Lighting up gap junction channels in a flash. Bioessays 2002;24(10):876–880.
Fairen A. Pioneering a golden age of cerebral microcircuits: the births of the combined Golgi-electron microscope methods. Neuroscience 2005;136(3):607–614.
Foster K, Markowitz GS, D'Agati VD. Pathology of thin basement membrane nephropathy. Semin Nephrol 2005;25(3):149–158.
Frischknecht F, Renaud O, Shorte SL. Imaging today's infectious animalcules. Curr Opin Microbiol 2006;9(3):297–306.
Gaietta G, Deerinck TJ, Adams SR, Bouwer J, Tour O, Laird DW, Sosinsky GE, Tsien RY, Ellisman MH. Multicolor and electron microscopic imaging of connexin trafficking. Science 2002;296(5567):503–507.
Gaietta GM, Giepmans BN, Deerinck TJ, Smith WB, Ngan L, Llopis J, Adams SR, Tsien RY, Ellisman MH. Golgi twins in late mitosis revealed by genetically encoded tags for live cell imaging and correlated electron microscopy. Proc Natl Acad Sci U S A 2006;103(47):17777–17782.
Genovesio A, Liedl T, Emiliani V, Parak WJ, Coppey-Moisan M, Olivo-Marin JC. Multiple particle tracking in 3-D + t microscopy: method and application to the tracking of endocytosed quantum dots. IEEE Trans Image Process 2006;15(5):1062–1070.
Geuze HJ. A future for electron microscopy in cell biology? Trends Cell Biol 1999;9(3):92–93.
Ghosh I, Hamilton AD, Regan L. Antiparallel leucine zipper-directed protein reassembly: application to the green fluorescent protein. J Am Chem Soc 2000;122(23):5658–5659.
Giddings TH. Freeze-substitution protocols for improved visualization of membranes in high-pressure frozen samples. J Microsc 2003;212(Pt 1):53–61.
Giepmans BN, Adams SR, Ellisman MH, Tsien RY. The fluorescent toolbox for assessing protein location and function. Science 2006;312(5771):217–224.
Giepmans BN, Deerinck TJ, Smarr BL, Jones YZ, Ellisman MH. Correlated light and electron microscopic imaging of multiple endogenous proteins using Quantum dots. Nat Methods 2005;2(10):743–749.
Grabenbauer M, Geerts WJ, Fernadez-Rodriguez J, Hoenger A, Koster AJ, Nilsson T. Correlative microscopy and electron tomography of GFP through photooxidation. Nat Methods 2005;2(11):857–862.
Groos S, Reale E, Luciano L. Re-evaluation of epoxy resin sections for light and electron microscopic immunostaining. J Histochem Cytochem 2001;49(3):397–406.
Grunewald K, Medalia O, Gross A, Steven AC, Baumeister W. Prospects of electron cryotomography to visualize macromolecular complexes inside cellular compartments: implications of crowding. Biophys Chem 2003;100(1–3):577–591.
Hanker JS. Osmiophilic reagents in electronmicroscopic histocytochemistry. Prog Histochem Cytochem 1979;12(1):1–85.
Hanson DA, Ziegler SF. Fusion of green fluorescent protein to the C-terminus of granulysin alters its intracellular localization in comparison to the native molecule. J Negat Results Biomed 2004;3(1):2.
Hardman R. A toxicologic review of quantum dots: toxicity depends on physicochemical and environmental factors. Environ Health Perspect 2006;114(2):165–172.
Hayat MA. Correlative Microscopy in Biology: Instrumentation and Methods. London: Academic Press, Inc.; 1987.
Hell SW, Schrader M, van der Voort HT. Far-field fluorescence microscopy with three-dimensional resolution in the 100-nm range. J Microsc 1997;187(Pt 1):1–7.
Henkel AW, Lubke J, Betz WJ. FM1-43 dye ultrastructural localization in and release from frog motor nerve terminals. Proc Natl Acad Sci U S A 1996;93(5):1918–1923.
Hollander H. The section embedding (SE) technique. A new method for the combined light microscopic and electron microscopic examination of central nervous tissue. Brain Res 1970;20(1):39–47.
Hoshino A, Fujioka K, Oku T, Nakamura S, Suga M, Yamaguchi Y, Suzuki K, Yasuhara M, Yamamoto K. Quantum dots targeted to the assigned organelle in living cells. Microbiol Immunol 2004;48(12):985–994.
Howell DN, Payne CM, Miller SE, Shelburne JD. Special techniques in diagnostic electron microscopy. Hum Pathol 1998;29(12):1339–1346.
Jaiswal JK, Simon SM. Potentials and pitfalls of fluorescent quantum dots for biological imaging. Trends Cell Biol 2004;14(9):497–504.
Jones S, Chapman SK, Crocker PR, Carson G, Levison DA. Combined light and electron microscope in routine histopathology. J Clin Pathol 1982;35(4):425–429.
Kandela IK, Albrecht RM. Fluorescence quenching by colloidal heavy metals nanoparticles: implications for correlative fluorescence and electron microscopy. Scanning 2007;29:152–161. [E-pub ahead of print].
Koster AJ, Grimm R, Typke D, Hegerl R, Stoschek A, Walz J, Baumeister W. Perspectives of molecular and cellular electron tomography. J Struct Biol 1997;120(3):276–308.
Koster AJ, Klumperman J. Electron microscopy in cell biology: integrating structure and function. Nat Rev Mol Cell Biol 2003;9 Suppl: SS6–SS10.
Larson DR, Zipfel WR, Williams RM, Clark SW, Bruchez MP, Wise FW, Webb WW. Water-soluble quantum dots for multiphoton fluorescence imaging in vivo. Science 2003;300(5624):1434–1436.
Leapman RD. Novel techniques in electron microscopy. Curr Opin Neurobiol 2004;14(5):591–598.
Leis A, Andrees L, Gruska M, Al-Amoudi A, Sartori A, Dubochet J, Baumeister W. Cryo-electron tomography and fluorescence microscopy of unicellular algae in vitreous cryosections. Microsc Microanal 2005;11 Suppl 2:330–331.
Liou W, Geuze HJ, Slot JW. Improving structural integrity of cryosections for immunogold labeling. Histochem Cell Biol 1996;106(1):41–58.
Liu J, Li H, Wang W, Xu H, Yang X, Liang J, He Z. Use of ester-terminated polyamidoamine dendrimers for stabilizing quantum dots in aqueous solutions. Small 2006;2(8–9):999–1002.
Lucic V, Forster F, Baumeister W. Structural studies by electron tomography: from cells to molecules. Annu Rev Biochem 2005;74:833–865.
Machleidt T, Robers M, Hanson GT. Protein labeling with FlAsH and ReAsH. Methods Mol Biol 2007;356:209–220.
Magliery TJ, Wilson CG, Pan W, Mishler D, Ghosh I, Hamilton AD, Regan L. Detecting protein-protein interactions with a green fluorescent protein fragment reassembly trap: scope and mechanism. J Am Chem Soc 2005;127(1):146–157.
Manfredi JJ, Parness J, Horwitz SB. Taxol binds to cellular microtubules. J Cell Biol 1982;94(3):688–696.
Maranto AR. Neuronal mapping: a photooxidation reaction makes Lucifer yellow useful for electron microscopy. Science 1982;217(4563):953–955.
Marko M, Hsieh C, Moberlychan W, Mannella CA, Frank J. Focused ion beam milling of vitreous water: prospects for an alternative to cryo-ultramicrotomy of frozen-hydrated biological samples. J Microsc 2006;222(Pt 1):42–47.
Marko M, Hsieh C, Schalek R, Frank J, Mannella C. Focused-ion-beam thinning of frozen-hydrated biological specimens for cryo-electron microscopy. Nat Methods 2007;4:215–217.
Marsh BJ. Lessons from tomographic studies of the mammalian Golgi. Biochim Biophys Acta 2005;1744(3):273–292.
Martin BR, Giepmans BN, Adams SR, Tsien RY. Mammalian cell-based optimization of the biarsenical-binding tetracysteine motif for improved fluorescence and affinity. Nat Biotechnol 2005;23(10):1308–1314.
McDonald KL, Auer M. High-pressure freezing, cellular tomography, and structural cell biology. Biotechniques 2006;41(2):137, 139, 141 passim.
McEwen BF, Heagle AB, Cassels GO, Buttle KF, Rieder CL. Kinetochore fiber maturation in PtK1 cells and its implications for the mechanisms of chromosome congression and anaphase onset. J Cell Biol 1997;137(7):1567–1580.
McEwen BF, Marko M. The emergence of electron tomography as an important tool for investigating cellular ultrastructure. J Histochem Cytochem 2001;49(5):553–564.
McIntosh JR. Electron microscopy of cells: a new beginning for a new century. J Cell Biol 2001;153(6):F25–F32.
McIntosh R, Nicastro D, Mastronarde D. New views of cells in 3D: an introduction to electron tomography. Trends Cell Biol 2005;15(1):43–51.
McNary WF Jr, Rosan RC, Kerrigan JA. Fluorescent microscopy of thin sections as an adjunct to electron microscopy. J Histochem Cytochem 1964;12:216–217.
Medalia O, Weber I, Frangakis AS, Nicastro D, Gerisch G, Baumeister W. Macromolecular architecture in eukaryotic cells visualized by cryoelectron tomography. Science 2002;298(5596):1209–1213.
Michalet X, Pinaud FF, Bentolila LA, Tsay JM, Doose S, Li JJ, Sundaresan G, Wu AM, Gambhir SS, Weiss S. Quantum dots for live cells, in vivo imaging, and diagnostics. Science 2005;307(5709):538–544.
Mironov A Jr, Latawiec D, Wille H, Bouzamondo-Bernstein E, Legname G, Williamson RA, Burton D, DeArmond SJ, Prusiner SB, Peters PJ. Cytosolic prion protein in neurons. J Neurosci 2003;23(18):7183–7193.
Mironov AA, Beznoussenko GV, Luini A, Polishchuk RS. Visualizing intracellular events in vivo by combined video fluorescence and 3-D electron microscopy. Methods Enzymol 2005;404:43–57.
Mironov AA, Polishchuk RS, Luini A. Visualizing membrane traffic in vivo by combined video fluorescence and 3D electron microscopy. Trends Cell Biol 2000;10(8):349–353.
Monosov EZ, Wenzel TJ, Luers GH, Heyman JA, Subramani S. Labeling of peroxisomes with green fluorescent protein in living P. pastoris cells. J Histochem Cytochem 1996;44(6):581–589.
Mori M, Ishikawa G, Takeshita T, Goto T, Robinson JM, Takizawa T. Ultrahigh-resolution immunofluorescence microscopy using ultrathin cryosections: subcellular distribution of caveolin-1alpha and CD31 in human placental endothelial cells. J Electron Microsc (Tokyo) 2006;55(2):107–112.
Morozov Y, Khalilov I, Ben-Ari Y, Represa A. Correlative fluorescence and electron microscopy of biocytin-filled neurons with a preservation of the postsynaptic ultrastructure. J Neurosci Methods 2002;117(1):81–85.
Murk JL, Posthuma G, Koster AJ, Geuze HJ, Verkleij AJ, KLeijmeer MJ, Humbel BM. Influence of aldehyde fixation on the morphology of endosomes and lysosomes: quantitative analysis and electron tomography. J Microsc 2003;212(Pt 1):81–90.
Muscariello L, Rosso F, Marino G, Giordano A, Barbarisi M, Cafiero G, Barbarisi A. A critical overview of ESEM applications in the biological field. J Cell Physiol 2005;205(3):328–334.
Najlah M, D'Emanuele A. Crossing cellular barriers using dendrimer nanotechnologies. Curr Opin Pharmacol 2006;6(5):522–527.
Nelson AC. Computer-aided microtomography with true 3-D display in electron microscopy. J Histochem Cytochem 1986;34(1):57–60.
Newman GR, Hobot JA. Resins for combined light and electron microscopy: a half century of development. Histochem J 1999;31(8):495–505.
Nickell S, Kofler C, Leis AP, Baumeister W. A visual approach to proteomics. Nat Rev Mol Cell Biol 2006;7(3):225–230.
Nickell S, Mihalache O, Beck F, Hegerl R, Korinek A, Baumeister W. Structural analysis of the 26S proteasome by cryoelectron tomography. Biochem Biophys Res Commun 2007;353(1):115–120.
Nikonenko I, Boda B, Alberi S, Muller D. Application of photoconversion technique for correlated confocal and ultrastructural studies in organotypic slice cultures. Microsc Res Tech 2005;68(2):90–96.
Nishikawa S, Sasaki F. Internalization of styryl dye FM1-43 in the hair cells of lateral line organs in Xenopus larvae. J Histochem Cytochem 1996;44(7):733–741.
Nisman R, Dellaire G, Ren Y, Li R, Bazett-Jones DP. Application of quantum dots as probes for correlative fluorescence, conventional, and energy-filtered transmission electron microscopy. J Histochem Cytochem 2004;52(1):13–18.
Nogales E, Grigorieff N. Molecular Machines: putting the pieces together. J Cell Biol 2001;152(1):F1–10.
Oorschot V, de Wit H, Annaert WG, Klumperman J. A novel flat-embedding method to prepare ultrathin cryosections from cultured cells in their in situ orientation. J Histochem Cytochem 2002;50(8):1067–1080.
Paddock SW. Further developments of the laser scanning confocal microscope in biomedical research. Proc Soc Exp Biol Med 1996;213(1):24–31.
Peters A. Examining neocortical circuits: some background and facts. J Neurocytol 2002;31(3–5):183–193.
Pfeiffer S, Beese M, Boettcher M, Kawaschinski K, Krupinska K. Combined use of confocal laser scanning microscopy and transmission electron microscopy for visualisation of identical cells processed by cryotechniques. Protoplasma 2003;222(3–4):129–137.
Pfeiffer S, Vielhaber G, Vietzke JP, Wittern KP, Hintze U, Wepf R. High-pressure freezing provides new information on human epidermis: simultaneous protein antigen and lamellar lipid structure preservation. Study on human epidermis by cryoimmobilization. J Invest Dermatol 2000;114(5):1030–1038.
Polishchuk RS, Polishchuk EV, Marra P, Alberti S, Buccione R, Luini A, Mironov AA. Correlative light-electron microscopy reveals the tubular-saccular ultrastructure of carriers operating between Golgi apparatus and plasma membrane. J Cell Biol 2000;148(1):45–58.
Polishchuk RS, San Pietro E, Di Pentima A, Tete S, Bonifacino JS. Ultrastructure of long-range transport carriers moving from the trans Golgi network to peripheral endosomes. Traffic 2006;7(8):1092–1103.
Porter KR, Claude A, Fullam EF. A study of tissue culture cells by electron microscopy: methods and preliminary observations. J Exp Med 1945;81(3):233–246.
Powell RD, Halsey CM, Hainfeld JF. Combined fluorescent and gold immunoprobes: reagents and methods for correlative light and electron microscopy. Microsc Res Tech 1998;42(1):2–12.
Prasher DC, Eckenrode VK, Ward WW, Prendergast FG, Cormier MJ. Primary structure of the Aequorea victoria green-fluorescent protein. Gene 1992;111(2):229–233.
Roberts JC, Adams YE, Tomalia D, Mercer-Smith JA, Lavallee DK. Using starburst dendrimers as linker molecules to radiolabel antibodies. Bioconjug Chem 1990;1(5):305–308.
Robinson JM, Takizawa T, Pombo A, Cook PR. Correlative fluorescence and electron microscopy on ultrathin cryosections: bridging the resolution gap. J Histochem Cytochem 2001;49(7):803–808.
Robinson JM, Vandre DD. Efficient immunocytochemical labeling of leukocyte microtubules with FluoroNanogold: an important tool for correlative microscopy. J Histochem Cytochem 1997;45(5):631–642.
Rudner L, Nydegger S, Coren LV, Nagashima K, Thali M, Ott DE. Dynamic fluorescent imaging of human immunodeficiency virus type 1 gag in live cells by biarsenical labeling. J Virol 2005;79(7):4055–4065.
Ryman-Rasmussen JP, Riviere JE, Monteiro-Riviere NA. Surface coatings determine cytotoxicity and irritation potential of quantum dot nanoparticles in epidermal keratinocytes. J Invest Dermatol 2007;127(1):143–153.
Salmon ED, Tran P. High-resolution video-enhanced differential interference contrast light microscopy. Methods Cell Biol 2003;72:289–318.
Sartori A, Gatz R, Beck F, Kossel A, Leis A, Baumeister W, Plitzko JM. Correlation microscopy: bridging the gap between light- and cryo-electron microscopy. Microsc Microanal 2005;11 Suppl 2:16–17.
Sawada H, Esaki M. A practical technique to postfix nanogold-immunolabeled specimens with osmium and to embed them in Epon for electron microscopy. J Histochem Cytochem 2000;48(4):493–498.
Schneckenburger H. Total internal reflection fluorescence microscopy: technical innovations and novel applications. Curr Opin Biotechnol 2005;16(1):13–18.
Seleverstov O, Zabirnyk O, Zscharnack M, Bulavina L, Nowicki M, Heinrich JM, Yezhelyev M, Emmrich F, O'Regan R, Bader A. Quantum dots for human mesenchymal stem cells labeling. A size-dependent autophagy activation. Nano Lett 2006;6(12):2826–2832.
Shimomura O. The discovery of aequorin and green fluorescent protein. J Microsc 2005;217(Pt 1):1–15.
Shiurba R. Freeze-substitution: origins and applications. Int Rev Cytol 2001;206:45–96.
Small J, Rottner K, Hahne P, Anderson KI. Visualising the actin cytoskeleton. Microsc Res Tech 1999;47(1):3–17.
Sosinsky GE, Gaietta GM, Hand G, Deerinck TJ, Han A, Mackey M, Adams SR, Bouwer J, Tsien RY, Ellisman MH. Tetracysteine genetic tags complexed with biarsenical ligands as a tool for investigating gap junction structure and dynamics. Cell Commun Adhes 2003;10(4–6):181–186.
Soto GE, Young SJ, Martone ME, Deerinck TJ, Lamont S, Carragher BO, Hama K, Ellisman MH. Serial section electron tomography: a method for three-dimensional reconstruction of large structures. Neuroimage 1994;1(3):230–243.
Spagnuolo CC, Vermeij RJ, Jares-Erijman EA. Improved photostable FRET-competent biarsenical-tetracysteine probes based on fluorinated fluoresceins. J Am Chem Soc 2006;128(37):12040–12041.
Sternberger LA. Immunocytochemistry. New York: John Wiley & Sons; 1986.
Steven AC, Aebi U. The next ice age: cryo-electron tomography of intact cells. Trends Cell Biol 2003;13(3):107–110.
Stewart WW. Lucifer dyes-highly fluorescent dyes for biological tracing. Nature 1981;292(5818):17–21.
Stirling JW. Immuno- and affinity probes for electron microscopy: a review of labeling and preparation techniques. J Histochem Cytochem 1990;38(2):145–157.
Stroffekova K, Proenza C, Beam KG. The protein-labeling reagent FLASH-EDT2 binds not only to CCXXCC motifs but also non-specifically to endogenous cysteine-rich proteins. Pflugers Arch 2001;442(6):859–866.
Sundara Rajan S, Vu TQ. Quantum dots monitor TrkA receptor dynamics in the interior of neural PC12 cells. Nano Lett 2006;6(9):2049–2059.
Suzuki Y, Yuen SR, Ashley R. Short, thin asbestos fibers contribute to the development of human malignant mesothelioma: pathological evidence. Int J Hyg Environ Health 2005;208(3):201–210.
Svitkina TM, Borisy GG. Correlative light and electron microscopy of the cytoskeleton of cultured cells. Methods Enzymol 1998;298:570–592.
Svitkina TM, Bulanova EA, Chaga OY, Vignjevic DM, Kojima S, Vasiliev JM, Borisy GG. Mechanism of filopodia initiation by reorganization of a dendritic network. J Cell Biol 2003;160(3):409–421.
Takizawa T, Robinson JM. Ultrathin cryosections: an important tool for immunofluorescence and correlative microscopy. J Histochem Cytochem 2003;51(6):707–714.
Timp W, Watson N, Sabban A, Zik O, Matsudaira P. Wet electron microscopy with quantum dots. Biotechniques 2006;41(3):295–298.
Tokuyasu KT. A technique for ultracryotomy of cell suspensions and tissues. J Cell Biol 1973;57(2):551–565.
Trucco A, Polishchuk RS, Martella O, Di Pentima A, Fusella A, Di Giandomenico D, San Pietro E, Beznoussenko GV, Polishchuk EV, Baldassarre M, Buccione R, Geerts WJ, Koster AJ, Burger KN, Mironov AA, Luini A. Secretory traffic triggers the formation of tubular continuities across Golgi sub-compartments. Nat Cell Biol 2004;6(11):1071–1081.
Tsien RY. Building and breeding molecules to spy on cells and tumors. FEBS Lett 2005;579(4):927–932.
Valentijn JA, van Daal JH, Jenks BG, van Abeelen JH. A method permitting precise trimming of resin-embedded tissue for ultrathin sectioning in pre-embedding immunoelectronmicroscopy. J Neurosci Methods 1989;30(1):55–58.
Verdijk P, Dijkman R, Plasmeijer EI, Mulder AA, Zoutman WH, Mommaas MA, Tensen CP. A lack of Birbeck granules in Langerhans cells is associated with a naturally occurring point mutation in the human Langerin gene. J Invest Dermatol 2005;124(4):714–717.
Vetter J. Toxins of Amanita phalloides. Toxicon 1998;36(1):13–24.
Walz J, Erdmann A, Kania M, Typke D, Koster AJ, Baumeister W. 26S proteasome structure revealed by three-dimensional electron microscopy. J Struct Biol 1998;121(1):19–29.
van der Wel NN, Fluitsma DM, Dascher CC, Brenner MB, Peters PJ. Subcellular localization of mycobacteria in tissues and detection of lipid antigens in organelles using cryo-techniques for light and electron microscopy. Curr Opin Microbiol 2005;8(3):323–330.
Westbroek W, Lambert J, Bahadoran P, Busca R, Herteleer MC, Smit N, Mommaas M, Ballotti R, Naeyaert JM. Interactions of human Myosin Va isoforms, endogenously expressed in human melanocytes, are tightly regulated by the tail domain. J Invest Dermatol 2003;120(3):465–475.
Wisher AC, Bronstein I, Chechik V. Thiolated PAMAM dendrimer-coated CdSe/ZnSe nanoparticles as protein transfection agents. Chem Commun (Camb) 2006;15:1637–1639.
Wouters CH, Koerten HK. Combined light microscope and scanning electron microscope, a new instrument for cell biology. Cell Biol Int Rep 1982;6(10):955–959.
Wulf E, Deboben A, Bautz FA, Faulstich H, Wieland T. Fluorescent phallotoxin, a tool for the visualization of cellular actin. Proc Natl Acad Sci U S A 1979;76(9):4498–4502.
Zeuschner D, Geerts WJ, van Donselaar E, Humbel BM, Slot JW, Koster AJ, Klumperman J. Immuno-electron tomography of ER exit sites reveals the existence of free COPII-coated transport carriers. Nat Cell Biol 2006;8(4):377–383.
Zhang S, Ma C, Chalfie M. Combinatorial marking of cells and organelles with reconstituted fluorescent proteins. Cell 2004;119(1):137–144.