

84 2.7 Business Impact Analysis (BIA)
market position, and customer expectations, or how they could restore
normal operations, or what resources they would require to operate in nor-
mal mode.
Interdependence between various functions (internal and external) is
crucial information obtained as part of the analysis. While consolidating
the information gathered from the questionnaires/discussions and ranking
the functions to derive the recovery priority, one must not overlook func-
tions that are considered low priority on their own but, however, have some
critical functions depending on them. By virtue of this dependence, they
also become important.
2.7.10 Establish Time Frames for Service
Interruption Measurement
It is often necessary to establish standard time frames for measuring periods
of outage when normal business services could become interrupted. Based
on each business’s unique recovery needs, organizations can come up with
standard recovery time frames for the business function classifications cited
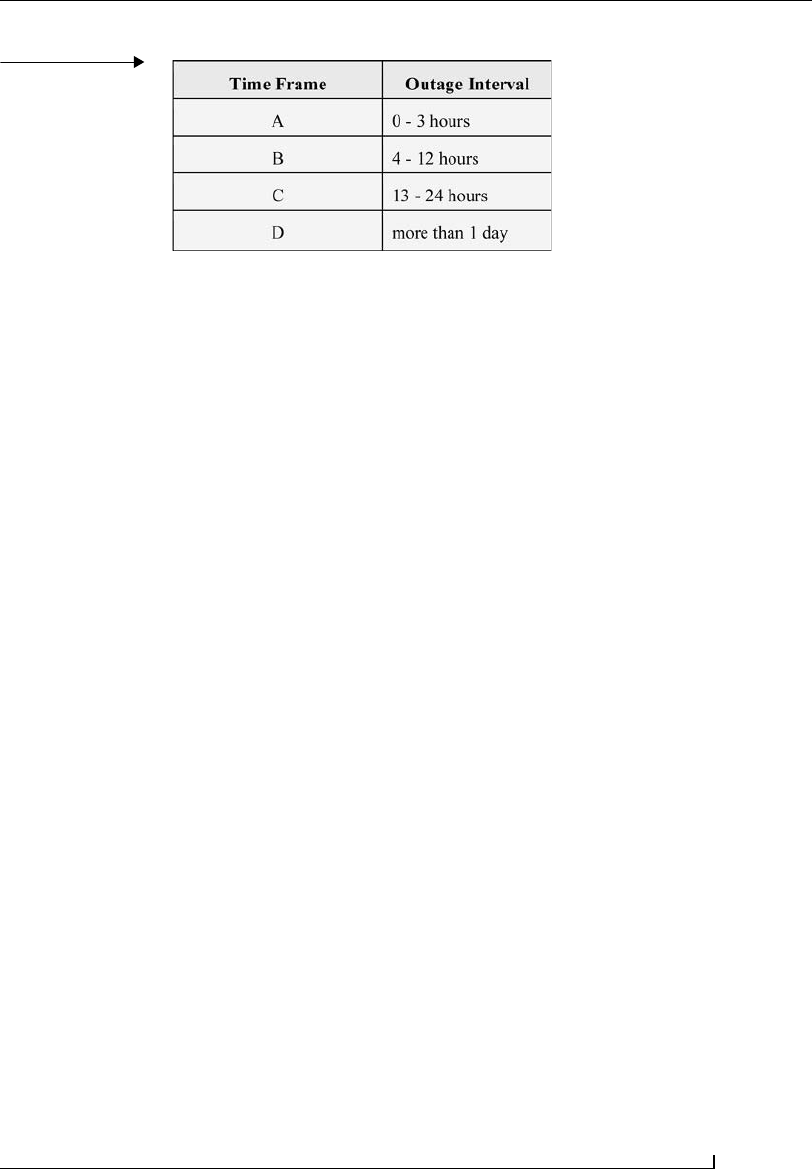
previously. For example, for critical functions, recovery should occur in less
than one day and, using the time frame/outage interval chart shown in Fig-
ure 2.27, those recovery procedures could be instituted for each phase of
recovery, using the various time frames. For Time Frame A, actions that
must be taken within the first three hours of an outage would be identified
and checklists would be made for that phase of recovery. Once those actions
were completed, then actions needed in the next time frame would begin.
The process would continue until critical functions were restored. For
essential functions, perhaps recovery would be necessary with a two- to
three-day time frame. Necessary functions would be required to be recov-
ered in four to seven days, and desirable functions would be reinstated
within fourteen days. For each key business process, an assessment is made
of the financial and operational impact of outages. These time frames are
applied to each critical function or key process to assist in quantifying the
level of severity of the outage. Of course, the chart should be adjusted to
satisfy the needs of each business entity. These are only examples.
2.7.11 Determine Financial and Operational Impact
Cost considerations must not be overlooked. Keep in mind that revenue
losses and opportunity losses will be directly proportional to the time taken
for recovery. Following an interruption, losses become intolerable within a
specific period. This is the recovery window. Selection of the correct strate-
2.7 Business Impact Analysis (BIA) 85
Chapter 2
gies should be based on the recovery window resulting from the impact
analysis process. Therefore, if intolerable impacts would occur in one week
or less, a hotter recovery strategy is indicated. A hot strategy is one that
requires most of the recovery resources to be already in place and ready to
use. If intolerable impacts would occur after longer periods, a colder recov-
ery strategy is indicated. A cold strategy is one in which recovery resources
are put in place following an interruption. Even with a cold strategy, it is
critical that the recovery resources be identified, listed, prearranged, and
preplanned as to how/where they will be acquired and how/when they will
be delivered, installed, and used. Usually, a combination of recovery strate-
gies should be planned.
The cost of a recovery strategy will be inversely proportional to the time
permitted for recovery. The cost of the possible recovery strategy must be
compared with the actual loss due to the outage before accepting the strat-
egy. If the solution proposed costs much more than the projected losses, it
will not be possible to justify the investment to the management. When
presenting the findings of the business impact analysis, express the results in
business terms. Quantifying the impact, possibly in terms of money, will
catch the attention of the management. Stating the impact in terms of time
will help in proposing concrete recovery goals. Stating the requirements in
technical terms will help in planning the recovery strategies. Ultimately, the
BIA must justify the continuity plan and aid selection of the best possible
recovery strategy within the budget. As an example, if an interruption of
electrical power, isolated to one power panel, caused the e-mail server in an
organization to become unavailable, a loss of e-mail for three hours would
have a quantification factor calculated using Time Frame A. Now, let’s sup-
pose there are 1,000 employees working during the time of the outage. We
will assume the outage occurred during the morning hours, when e-mail is
most often read by employees. If we are to assume that at 8:00 am approxi-
mately 50% of the employees were in the office checking e-mail, at 9:00 am
that number increased to 75%, and at 10:00 am 90% of employees were
Figure 2.27
Time frame/outage
interval chart.
..................Content has been hidden....................
You can't read the all page of ebook, please click here login for view all page.