Chapter 10
Tracing and Debugging
What’s in This Chapter
- Breakpoints
- The Watches and Autos windows
- Breakpoint conditions, hit counts, and filters
- Enabling and disabling breakpoints
- Debug and trace listeners
Wrox.com Downloads for This Chapter
Please note that all the code examples for this chapter are available as a part of this chapter’s code download on the book’s website at www.wrox.com/go/csharp5programmersref on the Download Code tab.
Visual Studio’s code editor includes tools that help you avoid bugs. Some of the things the editor does to help you include
- Providing IntelliSense to help you use methods and parameters correctly
- Identifying variables that are used before initialization or that are declared but never used
- Detecting unreachable code
- Flagging methods with a non-
voidreturn type that don’t return a value on all code paths - Providing a renaming tool so that you can easily rename objects without missing references
Despite those tools, however, bugs are as certain in programming as death and taxes. Although it is theoretically possible for a program to be bug-free, chances are good that any nontrivial program contains bugs. Actually, in some testing strategies it’s an axiom that the program contains bugs. The goal is not to fix every bug but to fix so many of the bugs that those that remain occur extremely rarely.
Although this book is about the C# language and not Visual Studio, any reasonably complete C# book should provide some coverage of debugging tools and techniques. This chapter briefly describes some of the tools Visual Studio provides to help you track down and eliminate bugs. It also explains tracing methods that you can use to figure out what a program is doing and hopefully what it is doing wrong.
The Debug Menu
The Debug menu contains commands that are generally useful when you debug a program. They include commands to set and clear breakpoints, one of Visual Studio’s most useful features.
A breakpoint is a spot in the code that is marked to suspend execution. When the program reaches a line marked with a breakpoint, execution pauses so that you can examine the program’s status. While execution is paused, you can hover over variables to see their values, enter expressions in the Immediate window to evaluate them, and change values by setting variables equal to new values in the Immediate window. You can even edit the code to some extent and then continue running.
To set a breakpoint, place the cursor in the code editor on the line where you want to pause execution. Then press F9 or click in the margin to the left of the line of code to create the breakpoint. To remove a breakpoint, place the cursor on the line, and press F9 or click in the margin again.
The commands that are visible in the Debug window change depending on several conditions, such as the type of file you have open, whether the program is running, the line of code that contains the cursor, and whether that line contains a breakpoint. The following list briefly summarizes the most important items available in the Debug menu while execution is stopped at a breakpoint.
- Windows—This submenu’s commands display other debugging-related windows. The following section describes this menu’s most useful commands.
- Continue (F5)—This command makes the program continue execution until it finishes or it reaches another breakpoint.
- Break All (Ctrl+Break)—This command pauses the program’s execution. You can then examine the program’s state, examine and change variables’ values, and modify the code before you resume execution.
- Stop Debugging (Ctrl+Alt+Break)—This command stops the program and ends its debugging session. Note that this stops the program immediately, so it doesn’t get a chance to run form closing event handlers and any other cleanup code that it would run if it halted normally.
- Step Into (F8 or F11)—This command makes the debugger execute the current line of code. If that code calls a method, the debugger steps into that method.
- Step Over (Shift+F8 or F10)—This command makes the debugger execute the current line of code. If that code calls a method, the debugger steps over that method. (If the method contains a breakpoint, execution pauses there.)
- Step Out (Ctrl+Shift+F8)—This command makes the debugger run until it leaves the method it is currently executing (or until it reaches a breakpoint). Execution pauses when the program reaches the line of code that called this method.
- QuickWatch (Shift+F9)—This command displays a dialog box that gives information about the selected code object. If the object is a variable, the dialog enables you to reevaluate it or change its value. Click the Add Watch button to add the value to a watch window. (See the entry “Watch” in the next section for more information on watch windows.)
- Exceptions (Ctrl+Alt+E)—This command displays the dialog box shown in Figure 10-1. Use the dialog to make the debugger stop the program when a particular kind of exception is thrown or unhandled.
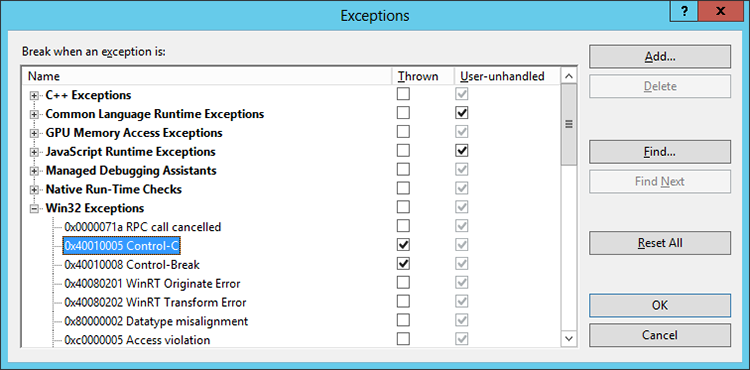
Figure 10-1: The Exceptions dialog box enables you to determine how the debugger handles exceptions.
- Toggle Breakpoint (F9)—This command toggles whether the current code line contains a breakpoint.
- New Breakpoint—This submenu’s single command Break At Function (Ctrl+B) displays a dialog box that enables you to specify a function and a line within that function where the program should break.
- Delete All Breakpoints (Ctrl+Shift+F9)—This command removes all breakpoints from the entire solution.
- Enable All Breakpoints—This command enables all disabled breakpoints.
- Disable All Breakpoints—This command disables all breakpoints but leaves them in the solution so that you can re-enable them later. (You can disable individual breakpoints by right-clicking the breakpoint’s margin and selecting Disable Breakpoint.)
The Debug ⇒ Windows Submenu
The Debug menu’s Windows submenu contains commands that display debugging-related windows. The following list briefly describes the most useful of these windows. The sections that follow this one provide more detail about the Breakpoints, Command, and Immediate windows.
- Immediate (Ctrl+G)—This window enables you to examine variable and execute C# statements. The section “The Immediate Window” later in this chapter describes this window in more detail.
- Locals (Ctrl+Alt+V, L)—This window displays the values of variables defined in the local context. To change a value, click it and enter the new value. Click the plus and minus signs to the left of a complex value such as an object to expand or collapse it.
- Breakpoints (Ctrl+Alt+B)—This window, which is shown in Figure 10-2, displays the solution’s breakpoints, their locations, and their conditions. Use the toolbar to create a new function breakpoint, delete a breakpoint, delete all breakpoints, enable or disable all breakpoints, go to a breakpoint’s source code, and change the columns displayed by the dialog box. Select or clear the check boxes on the left to enable or disable breakpoints. Right-click a breakpoint to change its properties. See the section “The Breakpoints Window” later in this chapter for more detail.
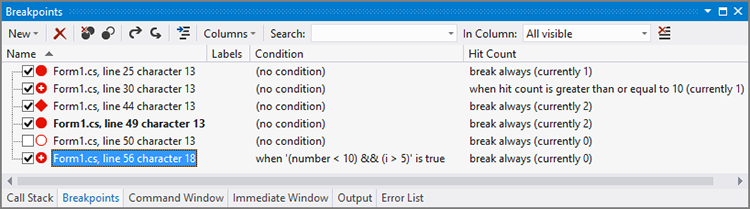
Figure 10-2: The Breakpoints window helps you manage breakpoints.
- Output—This window displays output produced by
Consolestatements. - Autos (Ctrl+Alt+V, A)—This window displays the values of local and global variables used in the current and previous lines of code.
- Call Stack (Ctrl+L)—This window lists the methods that have called other methods to reach the program’s current point of execution. Double-click a line to jump to the corresponding code in the program’s call stack.
- Watch—The Watch submenu contains the commands Watch 1, Watch 2, Watch 3, and Watch 4. These commands display four different watch windows that display the values of variables and expressions when the program is paused. When you create a watch using the QuickWatch command described in the preceding section, the new watch is placed in the Watch 1 window. You can click and drag a watch from one watch window to another to make a copy of the watch in the second window.
- Modules—This window displays information about the DLL and EXE files used by the program. It shows each module’s filename and path; whether it is optimized; whether it is your code (rather than an installed library); and whether debugging symbols are loaded. It also shows each module’s load order (lower-numbered modules are loaded first), version, and timestamp.
Often it is useful to make the visible debug windows occupy separate tabs in the same area at the bottom of the IDE. That enables you to switch between them quickly and easily without them taking up too much space.
The Breakpoints Window
The Breakpoints window lists all the breakpoints. If you double-click a breakpoint in the list, you can easily jump to the code that holds it.
The icons to the left of the breakpoints shown in Figure 10-2 give information about their properties. The following list describes the icons.
- Solid red circle—This indicates an ordinary breakpoint.
- White plus sign—This indicates the breakpoint is modified by a condition, hit count, or filter. The following text describes these.
- Diamond—This indicates the breakpoint performs some special action when it is reached. Normally, the action prints a message in the Immediate window showing values that you specify.
- Hollow circle or diamond—This indicates the breakpoint has been disabled.
Right-click a breakpoint and select Condition to display the dialog box shown in Figure 10-3. By default, a breakpoint pauses execution whenever it is reached. You can use this dialog box to add an additional condition that determines whether the breakpoint pauses the program when it is reached. In Figure 10-3, the breakpoint pauses execution if the expression (number < 10) && (i > 5) is true when the code reaches the breakpoint.
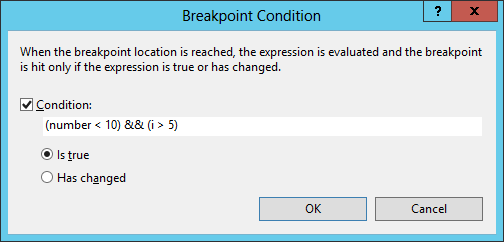
Figure 10-3: The Breakpoint Condition dialog box enables you to specify a condition that determines whether execution pauses at the breakpoint.
Right-click a breakpoint and select Hit Count to display the Breakpoint Hit Count dialog box, as shown in Figure 10-4. Each time the code reaches a breakpoint, it increments the breakpoint’s hit count. You can use this dialog box to make the breakpoint interrupt execution when it has been reached a specific number of times, a multiple of some number of times, or at least a certain number of times.
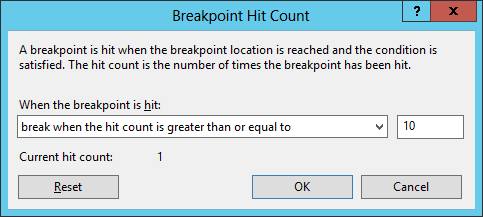
Figure 10-4: The Breakpoint Hit Count dialog box enables you to make a breakpoint’s activation depend on the number of times the code has reached it.
Right-click a breakpoint and select Filter to display the Breakpoint Filter dialog box, shown in Figure 10-5. You can enter a filter expression to make the breakpoint pause execution only for certain machines, processes, or threads.
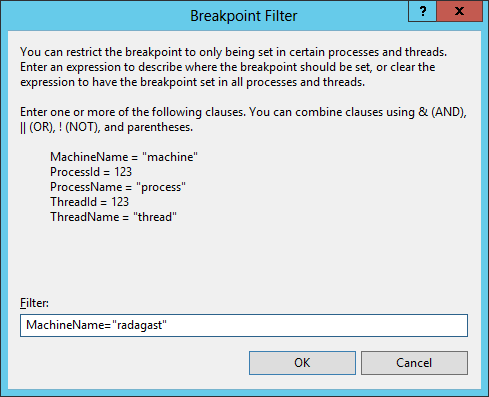
Figure 10-5: The Breakpoint Filter dialog box enables you to make a breakpoint’s activation depend on the machine, process, or thread.
Right-click a breakpoint and select When Hit to display the When Breakpoint Is Hit dialog box, as shown in Figure 10-6. Here you can specify the actions the debugger takes when the breakpoint is activated. Select the Print a Message check box to make the program display a message in the Immediate window. Select the Continue Execution check box to make the program continue running without stopping after it displays its message.
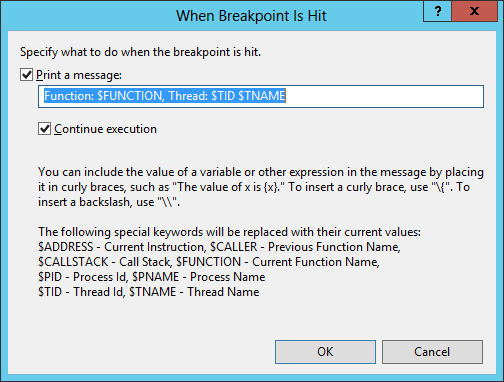
Figure 10-6: The When Breakpoint Is Hit dialog box enables you to make a breakpoint display a message when it is hit.
The Immediate Window
The Immediate window enables you to evaluate expressions and execute commands while the program is stopped in the debugger. One of the more useful commands displays a variable’s or expression’s value. Simply type the variable or expression and press Enter to see its value.
You can also set a variable’s value in the Immediate window. Simply type the variable’s name, the equal sign, and its new value. For example, the statement Width = 300 sets Width equal to 300. If the code is running in a Windows Form, and no other variable named Width is defined, this would set the form’s width to 300.
In addition to viewing and modifying variable values, the Immediate window enables you to execute methods so that you can easily test them. For example, suppose you have written a CheckPrinter method. Then you could type the statement CheckPrinter() in the Immediate window to execute that method.
Executing methods in the Immediate window enables you to test them quickly and easily without writing user interface code to handle all possible situations. You can call a method passing it different parameters to see what happens. If you set breakpoints within the method, the debugger pauses execution there.
The Debug and Trace classes provide several methods such as Write and WriteLine for displaying output. They let your program display information about what it is doing.
When you initially configure Visual Studio for C#, that information is written into the Immediate window. You can change that behavior in two ways. First, you can select Tools ⇒ Options, go to Debugging, and select General. If you uncheck the “Redirect All Output Window text to the Immediate Window” option, the Debug and Trace writing methods send output to the Output window instead of the Immediate window. (Even though that option says it redirects all output, it actually redirects only Debug and Trace output, not output generated by Console writing methods such as Console.WriteLine.)
The second method for changing where Debug and Trace output goes is to implement trace listeners. This is a useful and complicated enough technique that it is described in the following section.
Trace Listeners
The breakpoints described in the previous sections are extremely useful for figuring out what a program is doing. They let you step through the code as it executes to see what steps the program executes and to see what values are contained in variables.
However, sometimes a breakpoint can interfere with the program’s operation, so it prevents you from observing its normal behavior. For example, if the program uses event handlers to track the mouse’s position, a breakpoint stops the event handlers so that the program can’t track the mouse anymore.
Sometimes it’s hard to predict when an error will occur. For example, if a program encounters a bug only after running for several hours, it may be impractical to step through the code until a mistake occurs.
In those cases, it may be better to record events as they occur in a log or text file and then look at the record later. By default the Trace and Debug classes send their output to the Immediate or Console window. However, those classes share a Listeners collection that keeps track of listener objects that should receive that output.
Initially, that collection holds the DefaultTraceListener object, but you can remove that object or add new listeners if you like. Other listeners can send output to other locations such as log files, system event logs, or text files.
The .NET Framework provides the following three kinds of trace listener classes.
ConsoleTraceListener—Sends output to the Console windowEventLogTraceListener—Sends output to an event logTextWriterTraceListener—Sends output to a stream such as aFileStream
The TraceIntoTextFile example program, which is available for download on the book’s website, uses the following code to demonstrate a trace listener.
private void Form1_Load(object sender, EventArgs e)
{
    // Create the trace output file.
    Stream stream = File.Create("DebugLog.txt");

    // Create a TextWriterTraceListener for the trace output file.
    Debug.Listeners.Add(new TextWriterTraceListener(stream));

    // Write a startup note into the trace file.
    Debug.WriteLine(DateTime.Now.ToString() + ": Debugging session started");
}

// Create and process a Student.
private void processButton_Click(object sender, EventArgs e)
{
    Student student = new Student()
    {
        FirstName = firstNameTextBox.Text,
        LastName = lastNameTextBox.Text,
        Street = streetTextBox.Text,
        City = cityTextBox.Text,
        State = stateTextBox.Text,
        Zip = zipTextBox.Text
    };
    ProcessStudent(student);
}


// Process a student.
private void ProcessStudent(Student student)
{
    Debug.WriteLine("ProcessStudent");
    Debug.Indent();
    Debug.WriteLine("Name:    " + student.FirstName + " " + student.LastName);
    Debug.WriteLine("Address: " + student.Street);
    Debug.WriteLine("         " + student.City + " " + student.State + " " +
        student.Zip);
    Debug.Unindent();

    ///... Process the student here...
}

// Close the Debug trace file.
private void Form1_FormClosing(object sender, FormClosingEventArgs e)
{
    Debug.WriteLine(DateTime.Now.ToString() + ": Debugging session ended");
    Debug.Close();
}
When the form loads, the program creates a file named DebugLog.txt. It uses that file’s stream to create a new TextWriterTraceListener and adds it to the Debug object’s Listeners collection.
The program then uses Debug.WriteLine to write a start message. Because the Debug object’s Listeners collection contains the default listener in addition to the new TextWriterTraceListener, the message is displayed in the Immediate window and written into the file.
If you enter information about a student in the form’s TextBoxes and then click the Process button, the processButton_Click event handler executes. It creates a new Student object and passes it to the ProcessStudent method.
The ProcessStudent method uses Debug statements to display the Student’s information in the Immediate window and to write it into the listener file. The method uses Debug.Indent and Debug.Unindent to indent the Student’s information.
When you later close the form, the Form1_FormClosing event handler uses Debug.WriteLine to display an ending message. It then calls Debug.Close to flush any output that hasn’t been written into the listener file and to close the file. If you skip this step, some of the output is likely to be lost.
The following text shows sample output written into the listener file.
4/1/2014 3:06:25 PM: Debugging session started
ProcessStudent
    Name:    Rod Stephens
    Address: 1337 Leet St
             Bugsville AZ 87654
4/1/2014 3:06:27 PM: Debugging session ended
You can make a couple of useful changes to the previous program. First, you can open the listener file for appending instead of writing over previous output. Second, you can allow sharing when you open the file, so other programs such as Microsoft Word and Notepad can view the file while the program is still running. (If you allow sharing, you need to flush output every time you write or set AutoFlush to true. Otherwise the other program won’t see the latest items written into the file.)
The following code shows how you can open the listener file and allow sharing.
// Open the trace output file. Allow sharing and use AutoFlush.
Stream stream = File.Open("DebugLog.txt",
    FileMode.Append, FileAccess.Write, FileShare.Read);
Debug.AutoFlush = true;
Summary
C# and Visual Studio cannot debug your programs for you, but they do provide the tools you need to do it yourself. Breakpoints are particularly useful. They enable you to pause execution at selected lines of code, so you can examine the program’s variables and step through execution line by line to see what the program is doing, and hopefully what it is doing wrong. You can place conditions on breakpoints, so they stop the program only under certain conditions, such as when a breakpoint has been reached a certain number of times or when a variable contains a particular value.
The Debug and Trace classes provide methods that the program can use to display diagnostic information in the Immediate window. By adding trace listeners to those classes, you can save information in other places such as event logs or text files without interrupting the program. Later you can analyze that information to see what the program did.
The chapters in Part II, “C# Language Elements,” of this book focus on small-scale programming issues. They explain how to create variables, perform calculations, and overload operators; how to control program flow with statements such as if, switch, for, and while; how to select and arrange data with LINQ; and how to use debugging and tracing tools to understand what a program is doing and find bugs.
The chapters in Part III, “Object-Oriented Programming,” move to a higher level and describe object-oriented concepts. They explain key object-oriented concepts, how to build structures and classes, how to use collection classes, and how to use generics to make one class work with many data types.
Exercises
- The following code shows a recursive implementation of a Factorial function. (Recursive means it calls itself.)
private long Factorial(long number)
{
    if (number <= 1) return 1;
    return number * Factorial(number - 1);
}
Use the
Debugclass’s methods to trace this method’s execution. Each call to theFactorialmethod should indicate when it is called and with what parameter. Before returning, each call should display its result. Use indentation to make it easier to match calls and results. For example, the following text shows the output while calculatingFactorial(4).Factorial(4) Factorial(3) Factorial(2) Factorial(1) Result: 1 Result: 2 Result: 6 Result: 24 - Modify the program you wrote for Exercise 1 so that each call to the
Factorialmethod displays its parameter and result as in the following text.Factorial(1) = 1 Factorial(2) = 2 Factorial(3) = 6 Factorial(4) = 24 - Can you modify the program you wrote for Exercise 2 to efficiently use
Debugstatements to display each call and its result in the order in which they are called? For example, can you make the program display the following trace when callingFactorial(4)?Factorial(4) = 24 Factorial(3) = 6 Factorial(2) = 2 Factorial(1) = 1 - Suppose your customer insists that you produce an output similar to the one described in Exercise 3. Modify the
Factorialmethod to produce this kind of display. (Hint: You may want to make larger changes to the method, for example, changing its parameter list or return value.) - The
DebugandTraceclasses let a program provide different levels of output depending on whether theDEBUGandTRACEpreprocessor symbols are defined. Create aPrintMessagemethod that takes two parameters: a debugging level and a message. If the debugging level is less than or equal to a corresponding preprocessor symbol, display the message in the Console window. (For example, if the symbolDEBUG2is defined and the method’s debugging level is less than or equal to 2, display the message.)Compare this method to the
DebugandTraceclasses. How could you improve this method? - Build a program that writes
DebugandTracemessages into the file Messages.txt instead of displaying them in the Console or Immediate window. Open the file for append, allow read-only sharing, automatically flush the log files, and include the time with each message. Write a few messages usingDebug,Trace, andConsole. Before the program closes the file, open the file with Microsoft Word and Notepad to verify that you can do it. - One limitation to the
DebugandTraceclasses is that they share the sameListenerscollection, so you can’t sendDebugoutput to one location andTraceoutput to another. Write a method calledLogMessagethat takes two parameters: a filename and a message. The method should append the current time plus the message to the indicated file. (Chapter 19, “File System Objects,” has a lot to say about reading and writing files. For now just useSystem.IO.File.AppendAllTextto add text to the file.) Then rewrite the program you wrote for Exercise 6 to use that method to write messages into the files DebugLog.txt and TraceLog.txt.