
Chapter 5
Network Visibility and Segmentation
This chapter covers the following topics:
Introduction to Network Visibility
IP Flow Information Export (IPFIX)
Cisco Cognitive Threat Analytics (CTA) and Encrypted Traffic Analytics (ETA)
NetFlow Collection Considerations and Best Practices
Configuring NetFlow in Cisco IOS and Cisco IOS-XE
Introduction to Network Segmentation
Micro-segmentation with Cisco ACI
The following SCOR 350-701 exam objectives are covered in this chapter:
Domain 6: Secure Network Access, Visibility, and Enforcement
6.4 Describe the benefits of device compliance and application control
6.5 Explain exfiltration techniques (DNS tunneling, HTTPS, email, FTP/SSH/SCP/SFTP, ICMP, Messenger, IRC, NTP)
6.6 Describe the benefits of network telemetry
6.7 Describe the components, capabilities, and benefits of these security products and solutions:
6.7.a Cisco Stealthwatch
6.7.b Cisco Stealthwatch Cloud
6.7.a Cisco Stealthwatch
6.7.c Cisco pxGrid
6.7.d Cisco Umbrella Investigate
6.7.e Cisco Cognitive Threat Analytics
6.7.f Cisco Encrypted Traffic Analytics
6.7.g Cisco AnyConnect Network Visibility Module (NVM)
“Do I Know This Already?” Quiz
The “Do I Know This Already?” quiz allows you to assess whether you should read this entire chapter thoroughly or jump to the “Exam Preparation Tasks” section. If you are in doubt about your answers to these questions or your own assessment of your knowledge of the topics, read the entire chapter. Table 5-1 lists the major headings in this chapter and their corresponding “Do I Know This Already?” quiz questions. You can find the answers in Appendix A, “Answers to the ‘Do I Know This Already?’ Quizzes and Q&A Sections.”
Table 5-1 “Do I Know This Already?” Section-to-Question Mapping
Foundation Topics Section |
Questions |
Introduction to Network Visibility |
1 |
NetFlow |
2–3 |
IP Flow Information Export (IPFIX) |
4–5 |
NetFlow Deployment Scenarios |
6 |
Cisco Stealthwatch |
7–8 |
Cisco Cognitive Threat Analytics (CTA) and Encrypted Traffic Analytics (ETA) |
9 |
NetFlow Collection Considerations and Best Practices |
10 |
Configuring NetFlow in Cisco IOS and Cisco IOS-XE |
11 |
Configuring NetFlow in NX-OS |
12 |
Introduction to Network Segmentation |
13 |
Micro-segmentation with Cisco ACI |
14 |
Segmentation with Cisco ISE |
15 |
1. Which of the following technologies can be deployed to gain network visibility and awareness of security threats?
NetFlow
IPFIX
Cisco Stealthwatch
All of these answers are correct.
2. Which of the statements is true about NetFlow?
NetFlow supports IPv4 and IPv6.
NetFlow supports IPv4 and IPv6 was introduced with IPFIX.
IPFIX supports only IPv4.
None of these answers is correct.
3. A flow is a unidirectional series of packets between a given source and destination. In a flow, the same source and destination IP addresses, source and destination ports, and IP protocol are shared. This is often referred to as the ________.
five-tuple
five elements
NetFlow intelligence
IPFIX
4. IPFIX was originally created based on which of the following?
NetFlow v5
NetFlow v9
Flexible NetFlow
None of the above
5. IPFIX is considered what type of protocol?
IPFIX is considered to be an active protocol.
IPFIX is considered to be a pull protocol.
IPFIX is considered to be a passive protocol.
IPFIX is considered to be a push protocol.
6. Which of the following is a NetFlow deployment best practice?
NetFlow should be enabled as close to the access layer as possible (user access layer, data center access layer, in VPN termination points, and so on).
All NetFlow records belonging to a flow should be sent to the same collector.
To gain network visibility, Test Access Ports (TAPs) or Switched Port Analyzer (SPAN) ports must be configured when the Cisco Stealthwatch FlowSensors are deployed.
All of these answers are correct.
7. Which of the following is a physical or virtual appliance that can generate NetFlow data when legacy Cisco network infrastructure components are not capable of producing line-rate, unsampled NetFlow data?
Stealthwatch FlowSensor
Stealthwatch FlowCollector
Stealthwatch FlowReplicator
Stealthwatch FlowGenerator
8. Which of the following statements is not true?
In Amazon AWS, the equivalent of NetFlow is called VPC Flow Logs.
Google Cloud Platform supports VPC Flow Logs (or Google-branded GPC Flow Logs).
In Microsoft’s Azure, traffic flows are collected in network security group (NSG) flow logs.
In Microsoft’s Azure, the equivalent of NetFlow is called VPC Flow Logs.
9. Which of the following are components of the Cisco ETA solution to identify malicious (malware) communications in encrypted traffic through passive monitoring, the extraction of relevant data elements, and a combination of behavioral modeling and machine learning?
NetFlow
Cisco Stealthwatch
Cisco Cognitive Threat Analytics
All of these answers are correct.
10. Which type of the following deployment models has the advantage of limiting the overhead introduced by NetFlow?
FlowCollectors deployed at multiple sites and placed close to the source producing the highest number of NetFlow records.
FlowCollectors deployed in a centralized area and placed to handle the highest number of NetFlow records.
Using asymmetric routing to send NetFlow records to the same SMC, not to different collectors.
None of the above.
11. Which of the following are the main Flexible NetFlow components?
Records
Flow monitors
Flow exporters
Flow samplers
All of the options are correct.
12. In NX-OS, NetFlow CLI commands are not available until you enable which of the following commands?
netflow collection enable
feature netflow
ip netflow enable
ip netflow run
13. Which of the following are Layer 2 technologies that security professionals have used for policy enforcement and segmentation? (Select two.)
VLANs
Routing protocols
VRFs
Route reflectors
14. A micro-segment in ACI is also often referred to as ____________.
uSeg SGT
uSeg EPGs
SCVMM
None of these answers is correct.
15. Cisco ISE scales by deploying service instances called “______” in a distributed architecture.
personas
SGTs
uSeg EPGs
pxGrid
Foundation Topics
Introduction to Network Visibility
Network visibility is one of the most important pillars within any cybersecurity program and framework. In fact, two of the most important components of a cybersecurity program that go together are visibility and control. Total network visibility and complete control of all elements in your network is easier said than done (especially when organizations have their applications and data hosted in multi-cloud environments). However, at least maintaining a good level of visibility among all these environments is crucial to maintain services and business continuity. You must design an architecture that should be flexible while improving security without relying on a single technology or product. Multiple technologies and features are used throughout the network to obtain visibility into network behavior and to maintain control during abnormal or malicious behavior.
How good is your network if you cannot manage it when an outbreak or attack is underway? Visibility is twofold. Network administrators and cybersecurity professionals should always have complete visibility of networking devices and the traffic within their infrastructure. At the same time, intruders must not have visibility to unnecessary services or vulnerable systems that can be exploited within an organization.
The following are the most common technologies that can be used to obtain and maintain complete network visibility:
NetFlow
IPFIX
Cisco Stealthwatch
Intrusion detection system/intrusion prevention system (IDS/IPS)
Cisco Advanced Malware Protection (AMP) for Endpoints and Networks
NetFlow
NetFlow is a technology originally created by Cisco that provides comprehensive visibility into all network traffic that traverses a Cisco-supported device. NetFlow was initially created for billing and accounting of network traffic and to measure other IP traffic characteristics such as bandwidth utilization and application performance. NetFlow has also been used as a network-capacity planning tool and to monitor network availability. Nowadays, NetFlow is used as a network security tool because its reporting capabilities provide nonrepudiation, anomaly detection, and investigative capabilities. As network traffic traverses a NetFlow-enabled device, the device collects traffic flow information and provides a network administrator or security professional with detailed information about such flows.
NetFlow provides detailed network telemetry that allows the administrator to perform the tasks:
See what is actually happening across the entire network.
Identify DoS attacks.
Quickly identify compromised endpoints and network infrastructure devices.
Monitor network usage of employees, contractors, or partners.
Obtain network telemetry during security incident response and forensics.
Detect firewall misconfigurations and inappropriate access to corporate resources.
Defending against cybersecurity attacks is becoming more challenging every day, and it is not going to get any easier. The threat landscape is evolving to a faster, more effective, and more efficient criminal economy profiting from attacks against users, enterprises, services providers, and governments. Organized cybercrime, with its exchange of exploits, is booming and fueling a very lucrative economy. Threat actors nowadays have a clear understanding of the underlying security technologies and their vulnerabilities. Hacker groups now follow software development life cycles, just like enterprises follow their own. These bad actors perform quality-assurance testing against security products before releasing them into the underground economy. They continue to find ways to evade common security defenses. Attackers follow techniques such as the following:
Port and protocol hopping
Tunneling over many different protocols
Encryption
Utilization of droppers
Social engineering
Exploitation of zero-day vulnerabilities
Security technologies and processes should not focus only on defending against Internet threats, but should also provide the ability to detect and mitigate the impact after a successful attack.
Security professionals must maintain visibility and control across the extended network during the full attack continuum:
Before the attack takes place
During an active attack
After an attacker starts to damage systems or steal information
Cisco next-generation security products provide protection throughout the attack continuum. Devices such as the Cisco Firepower Threat Defense (FTD) and Cisco AMP provide a security solution that helps discover threats and enforce and harden policies before an attack takes place. In addition, you can detect attacks before, during, and after they have already taken place with NetFlow. These solutions provide the capabilities to contain and remediate an attack to minimize data loss and additional network degradation.
The Network as a Sensor and as an Enforcer
Many organizations fail to use one of the strongest tools that can help protect against today’s security threats: the network itself. For example, Cisco Catalyst switches, data center switches, Aggregation Services Routers (ASRs), Integrated Services Routers (ISRs), next-generation firewalls (NGFWs), next-generation intrusion prevention systems (NGIPs), NetFlow generation appliances (Cisco Stealthwatch FlowSensors), Advanced Malware Protection (AMP), and wireless products, in conjunction with the Cisco Application Centric Infrastructure, can protect before, during, and after an attack.
The network can be used in security in two different, fundamental ways:
The network as a sensor: NetFlow allows you to use the network as a sensor, giving you deep and broad visibility into unknown and unusual traffic patterns, in addition to compromised devices.
The network as an enforcer: You can use Cisco TrustSec to contain attacks by enforcing segmentation and user access control. Even when bad actors successfully breach your network defenses, you thus limit their access to only one segment of the network.
What Is a Flow?
A flow is a unidirectional series of packets between a given source and destination. In a flow, the same source and destination IP addresses, source and destination ports, and IP protocol are shared. This is often referred to as the five-tuple. Figure 5-1 illustrates a five-tuple example.
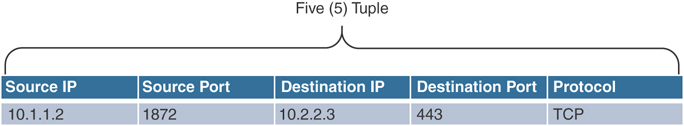
Figure 5-1 Five-Tuple Example
Figure 5-2 shows an example of a flow between a client and a server.
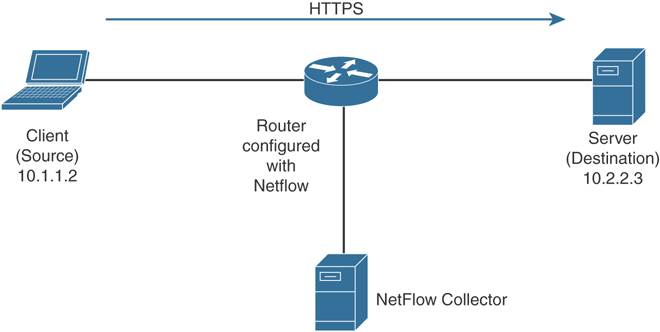
Figure 5-2 Basic NetFlow Example Deployment
In Figure 5-2, the client (source) establishes a connection to the server (destination). When the traffic traverses the router (configured for NetFlow), it generates a flow record. At the very minimum, the five-tuple is used to identify the flow in the NetFlow database of flows kept on the device.
Depending on the version of NetFlow, the router can also gather additional information, such as type of service (ToS) byte, differentiated services code point (DSCP), the device’s input interface, TCP flags, byte counters, and start and end times.
Flexible NetFlow, Cisco’s next-generation NetFlow, can track a wide range of Layer 2, IPv4, and IPv6 flow information, such as the following:
Source and destination MAC addresses
Source and destination IPv4 or IPv6 addresses
Source and destination ports
ToS
DSCP
Packet and byte counts
Flow timestamps
Input and output interface numbers
TCP flags and encapsulated protocol (TCP/UDP) and individual TCP flags
Sections of packet for deep packet inspection
All fields in IPv4 header, including IP-ID, TTL, and others
All fields in IPv6 header, including Flow Label, Option Header, and others
Routing information such as next-hop address, source autonomous system number (ASN), destination ASN, source prefix mask, destination prefix mask, Border Gateway Protocol (BGP) next hop, and BGP policy accounting traffic index
NetFlow protocol data units (PDUs), also referred to as flow records, are generated and sent to a NetFlow collector after the flow concludes or expires (times out).
There are three types of NetFlow cache:
Normal cache: This is the default cache type in many infrastructure devices enabled with NetFlow and Flexible NetFlow. The entries in the flow cache are removed (aged out) based on the configured timeout active seconds and timeout inactive seconds settings.
Immediate cache:
Flow accounts for a single packet
Desirable for real-time traffic monitoring and distributed DoS (DDoS) detection
Used when only very small flows are expected (for example, sampling)
Permanent cache:
Used to track a set of flows without expiring the flows from the cache.
The entire cache is periodically exported (update timer).
The cache is a configurable value.
After the cache is full, new flows will not be monitored.
Uses update counters rather than delta counters.
Many people often confuse a flow with a session. All traffic in a flow is going in the same direction; however, when the client establishes the HTTP connection (session) to the server and accesses a web page, it represents two separate flows. The first flow is the traffic from the client to the server, and the other flow is from the server to the client.
NetFlow was originally created for IP accounting and billing purposes; however, it plays a crucial role for the following:
Network security
Traffic engineering
Network planning
Network troubleshooting
NetFlow for Network Security and Visibility
NetFlow is a tremendous security tool. It provides nonrepudiation, anomaly detection, and investigative capabilities. Complete visibility is one of the key requirements when identifying and classifying security threats.
The first step in the process of preparing your network and staff to successfully identify security threats is achieving complete network visibility. You cannot protect against or mitigate what you cannot view/detect. You can achieve this level of network visibility through existing features on network devices you already have and on devices whose potential you do not even realize. In addition, you should create strategic network diagrams to clearly illustrate your packet flows and where, within the network, you may enable security mechanisms to identify, classify, and mitigate the threat. Remember that network security is a constant war. When defending against the enemy, you must know your own territory and implement defense mechanisms in place.
NetFlow for Anomaly Detection and DDoS Attack Mitigation
You can use NetFlow as an anomaly-detection tool. Anomaly-based analysis keeps track of network traffic that diverges from “normal” behavioral patterns. Of course, you must first define what is considered to be normal behavior. You can use anomaly-based detection to mitigate DDoS attacks and zero-day outbreaks. DDoS attacks are often used maliciously to consume the resources of your hosts and network that would otherwise be used to serve legitimate users. The goal with these types of attacks is to overwhelm the victim network resources, or a system’s resources such as CPU and memory. In most cases, this is done by sending numerous IP packets or forged requests.
A particularly dangerous attack is when an attacker builds up a more powerful attack with a more sophisticated and effective method of compromising multiple hosts and installing small attack daemons. This is what many call zombies or bot hosts/nets. Subsequently, an attacker can launch a coordinated attack from thousands of zombies onto a single victim. This daemon typically contains both the code for sourcing a variety of attacks and some basic communications infrastructure to allow for remote control.
Typically, an anomaly-detection system monitors network traffic and alerts and then reacts to any sudden increase in traffic and any other anomalies.
Figure 5-3 shows a dashboard from the Cisco Stealthwatch Cloud, which is displaying network traffic during a DDoS attack.

Figure 5-3 Anomaly Detection with NetFlow and Stealthwatch Cloud Example
As you can see in the graph illustrated in Figure 5-3, the amount of traffic (in gigabits per second) increases after 8:00 a.m. until after 9 a.m. If this spike in traffic is not a normal occurrence on other days, this may be an anomaly. In some cases, misconfigured hosts and servers can send traffic that consumes network resources unnecessarily. Having the necessary tools and mechanisms to identify and classify security threats and anomalies in the network is crucial.
Data Leak Detection and Prevention
Many network administrators, security professionals, and business leaders struggle in the effort to prevent data loss within their organizations. The ability to identify anomalous behavior in data flows is crucial to detect and prevent data loss. The application of analytics to data collected via NetFlow can aid security professionals in detecting anomalous large amounts of data leaving the organization and abnormal traffic patterns inside of the organization.
Using NetFlow along with identity management systems, an administrator can detect who initiated the data transfer, the hosts (IP addresses) involved, the amount of data transferred, and the services used.
In addition, the administrator can measure how long the communications lasted and the frequency of the same connection attempts.
Incident Response, Threat Hunting, and Network Security Forensics
NetFlow is often compared to a phone bill. When police want to investigate criminals, for instance, they often collect and investigate their phone records. NetFlow provides information about all network activity that can be very useful for incident response and network forensics. This information can help you discover indicators of compromise (IOCs).
The National Institute of Standards and Technology (NIST) created the following methodology on security incident handling, which has been adopted by many organizations, including service providers, enterprises, and government organizations:
Step 1. Preparation
Step 2. Detection and analysis
Step 3. Containment, eradication, and recovery
Step 4. Post-incident activity (postmortem and lessons learned)
NetFlow plays a crucial role in the preparation phase and the detection and analysis phase. Information collected in NetFlow records can be used to identify, categorize, and scope suspected incidents as part of the identification. NetFlow data also provides great benefits for attack traceback and attribution. In addition, NetFlow provides visibility of what is getting into your network and what information is being exfiltrated out of your network.
Figure 5-4 shows an example of how a botnet is performing a DDoS attack against the corporate network. NetFlow in this case can be used as an anomaly-detection tool for the DDoS attack and also as a forensics tool to potentially find other IOCs of more sophisticated attacks that may be carried out incognito.
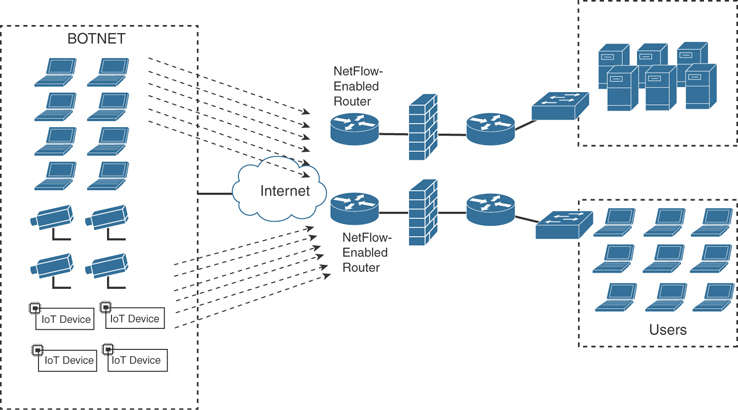
Figure 5-4 Detecting What Is Getting into Your Network
Figure 5-5 shows how a “stepping-stone” attack is carried out in the corporate network. A compromised host in the call center department is exfiltrating large amounts of sensitive data to an attacker on the Internet from a server in the data center.
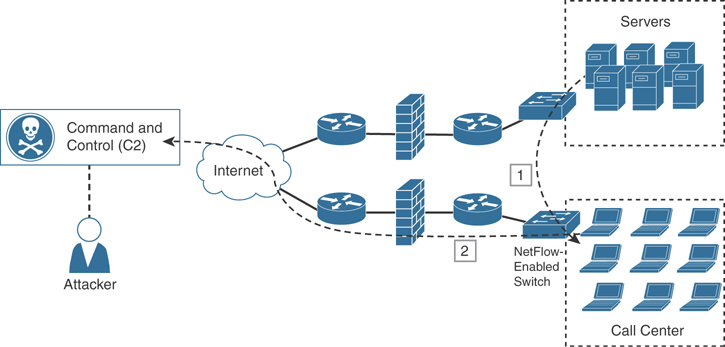
Figure 5-5 Detecting What Is Getting Out of Your Network
You can also use NetFlow in combination with DNS records to help you detect suspicious and malicious traffic, such as the following:
Suspicious requests to .gov, .mil, and .edu sites when you do not even do business with any of those entities
Large amount of traffic leaving the organization late at night to suspicious sites
Traffic to embargoed countries that should not have any business partners or transactions
Suspicious virtual private network (VPN) requests and VPN traffic
Requests and transactions to sites without any content
Pornography sites or any other corporate policy violations
Illegal file-sharing sites
Crypto mining informational sites
Syslog and packet captures are also often used in network forensics; however, an area where these traditional network forensics tools fall short is in coverage. For instance, it is very difficult to deploy hundreds of sniffers (packet-capture devices) in the networks of large organizations. In addition, the cost will be extremely high. When a security incident or breach is detected, the incident responders need answers fast! They do not have time to go over terabytes of packet captures, and they can definitely not analyze every computer on the network to find the root cause, miscreant, and source of the breach. You can use NetFlow to obtain a high-level view of what is happening in the network, and then the incident responder can perform a deep-dive investigation with packet captures and other tools later in the investigation. Sniffers can be then deployed as needed in key locations where suspicious activity is suspected. The beauty of NetFlow is that you can deploy it anywhere you have a supported router, switch, Cisco ASA, or Cisco FTD; alternatively, you can use Cisco Stealthwatch FlowSensor.
NetFlow can fill in some of the gaps and challenges regarding the collection of packet captures everywhere in the network. It is easier to store large amounts of NetFlow data because it is only a transactional record. Therefore, administrators can keep a longer history of events that occurred on their networks. Historical records can prove very valuable when investigating a breach. Network transactions can show you where an initial infection came from, what command-and-control channel was initiated by the malware, what other computers on the internal network were accessed by that infected host, and whether other hosts in the network reached out to the same attacker or command-and-control system, as demonstrated earlier at a high level.
The logging facility on Cisco routers, switches, Cisco ASA, Cisco FTD, and other infrastructure devices allows you to save syslog messages locally or to a remote host. By default, routers send logging messages to a logging process. The logging process controls the delivery of logging messages to various destinations, such as the logging buffer, terminal lines, a syslog server, or a monitoring event correlation system such as Elastic Search, Logstash and Kibana (known as the ELK stack), Graylog, Splunk, and others. You can set the severity level of the messages to control the type of messages displayed, in addition to a timestamp to successfully track the reported information. Every security professional and incident responder knows how important it is to have good logs. There is no better way to find out what was happening in a router, switch, and firewall at the time that an attack occurred. However, like all things, syslog has limitations. You have to enable the collection of logs from each endpoint; so in many environments, syslog coverage is incomplete, and after a computer has been compromised, it is not possible to trust the logs coming from that device anymore. Syslog is extremely important, but it cannot tell you everything.
Many network telemetry sources can also be correlated with NetFlow while responding to security incidents and performing network forensics, including the following:
Dynamic Host Configuration Protocol (DHCP) logs
VPN logs
Network address translation (NAT) information
802.1X authentication logs
Server logs (syslog)
Web proxy logs
Spam filters from e-mail security appliances such as the Cisco Email Security Appliance (ESA)
Figures 5-6, 5-7, and 5-8 list different event types, their source, and respective events that can be combined with NetFlow while responding to security incidents and performing network forensics.
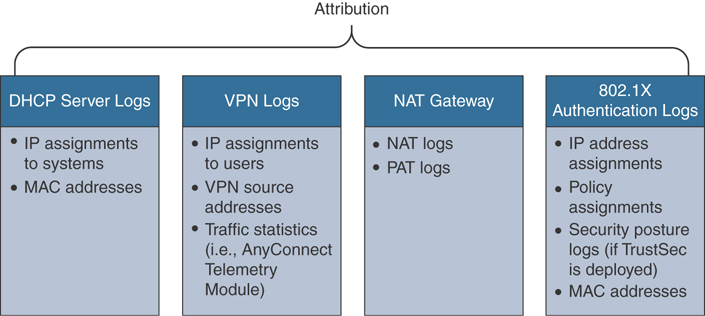
Figure 5-6 Event Types and Sources for Attribution

Figure 5-7 Event Types and Sources to Understand Underlying System Activity

Figure 5-8 Web Proxy, Spam Filter, and Firewall Logs for Incident Response
Figure 5-6 shows event types and respective sources that can be used for attribution.
Figure 5-7 shows event types and respective sources of underlying system activity.
Figure 5-8 shows event types of web proxy, spam filters, and firewall logs.
It is extremely important that your syslog and other messages are timestamped with the correct date and time. This is why the use of Network Time Protocol (NTP) is strongly recommended.
Network forensics can be an intimidating topic for many security professionals. Everyone knows that forensic investigation may entail many other sources of information from end hosts, servers, and any affected systems. Each forensics team needs to be focused on many different areas, such as the following:
Having a thorough knowledge of assets, risks, impact, and likelihood of events.
Practicing incident response policies and procedures in mock events and collecting things like NetFlow on a regular basis to analyze what is happening in the network.
Awareness of current vulnerabilities and threats.
Understanding evidence handling and chain of custody. (Even NetFlow events can be used as evidence.)
Enacting mitigation based on evidence collected.
Knowing the documentation requirements for evidence, depending on your country and local laws.
Understanding the analysis process during and after the incident.
Having a framework for communications, both within the team and external to the team.
Traffic Engineering and Network Planning
NetFlow can also be used for traffic engineering and network planning. For example, you can use NetFlow to understand many things that can be tuned and further engineered in the network, such as understanding what are the non-mission-critical traffic-taxing network resources (for example, end users downloading audio or video files, or visiting Facebook, Twitter, and other social networking sites). Network configuration problems in infrastructure devices can be inferred by observing NetFlow. In the case of service providers, NetFlow correlation with BGP benefits peering and IP transit analysis (profitability, costs, violations, and so on). In enterprise networks, correlation with internal gateway protocols, such as Open Shortest Path First (OSPF), Enhanced Interior Gateway Routing Protocol (EIGRP), and Routing Information Protocol (RIP), can provide similar benefits.
You can also use NetFlow as a troubleshooting tool. For instance, you might have users complaining that Voice over IP (VoIP) calls or Cisco TelePresence video calls are failing or that the quality is very poor. Reviewing NetFlow data might indicate that many users are inappropriately streaming YouTube, Netflix, or Hulu videos. Using this data, the network administrator can create access lists to block traffic to some of these sites (or all) and/or create Quality of Service (QoS) policies to prioritize the VoIP and Cisco TelePresence traffic.
An example of capacity planning may be a planned merger with another company that will add hundreds or thousands of new users to internal corporate resources. Another example is a new application that may have numerous users where the network administrator might need to provision additional bandwidth or capacity to different areas of the network.
NetFlow Versions
There have been several versions of NetFlow throughout the years. Table 5-2 lists all versions of NetFlow and a brief description of the features supported.
Table 5-2 NetFlow Versions
NetFlow Version |
Description |
Version 1 (v1) |
(Obsolete) The first implementation of NetFlow. NetFlow v1 was limited to IPv4 without network masks and autonomous system numbers (ASNs). |
Version 2 (v2) |
Never released to the public. |
Version 3 (v3) |
Never released to the public. |
Version 4 (v4) |
Never released to the public. |
Version 5 (v5) |
One of the most popular versions of NetFlow in earlier implementations. Although it is still being used in some environments, NetFlow v5 is now obsolete. |
Version 6 (v6) |
(Obsolete) No longer supported. |
Version 7 (v7) |
(Obsolete) No longer supported. Introduced a source router field. |
Version 8 (v8) |
(Obsolete) No longer supported. |
Version 9 (v9) |
Template-based implementation of NetFlow. Introduced support for IPv6, Multiprotocol Label Switching (MPLS), and Border Gateway Protocol (BGP) next hop. |
Flexible NetFlow |
Template-based and modeled after NetFlow v9. |
IPFIX |
Although IPFIX is not a version of NetFlow, it is the IETF standard based on NetFlow v9 that also introduced several extensions. |
IP Flow Information Export (IPFIX)
The Internet Protocol Flow Information Export (IPFIX) is a network flow standard led by the Internet Engineering Task Force (IETF). IPFIX was created for a common, universal standard of export for the flow information from routers, switches, firewalls, and other infrastructure devices. IPFIX defines how flow information should be formatted and transferred from an exporter to a collector. IPFIX is documented in RFC 7011 through RFC 7015 and RFC 5103. Cisco NetFlow Version 9 is the basis and main point of reference for IPFIX. IPFIX changes some of the terminologies of NetFlow, but in essence they are the same principles as NetFlow Version 9.
IPFIX defines different elements that are grouped into the following 12 categories according to their applicability:
Identifiers
Metering and exporting process configuration
Metering and exporting process statistics
IP header fields
Transport header fields
Sub-IP header fields
Derived-packet properties
Min/max flow properties
Flow timestamps
Per-flow counters
Miscellaneous flow properties
Padding
IPFIX is considered to be a push protocol. Each IPFIX-enabled device regularly sends IPFIX messages to configured collectors (receivers) without any interaction by the receiver. The sender controls most of the orchestration of the IPFIX data messages. IPFIX introduces the concept of templates, which make up these flow data messages to the receiver. IPFIX also allows the sender to use user-defined data types in its messages. IPFIX prefers the Stream Control Transmission Protocol (SCTP) as its transport layer protocol; however, it also supports the use of the Transmission Control Protocol (TCP) or User Datagram Protocol (UDP) messages.
Traditional Cisco NetFlow records are usually exported via UDP messages. The IP address of the NetFlow collector and the destination UDP port must be configured on the sending device. The NetFlow standard (RFC 3954) does not specify a specific NetFlow listening port. The standard or most common UDP port used by NetFlow is UDP port 2055, but other ports like 9555, 9995, 9025, and 9026 can also be used. UDP port 4739 is the default port used by IPFIX.
IPFIX Architecture
IPFIX uses the following architecture terminology:
Metering process (MP): Generates flow records from packets at an observation point. The metering process timestamps, samples, and classifies flows. The MP also maintains flows in an internal data structure and passes complete flow information to an exporting process (EP).
EP: Sends flow records via IPFIX from one or more MPs to one or more collecting processes (CPs).
CP: Receives records via IPFIX from one or more EPs.
Figure 5-9 illustrates these concepts and the architecture.
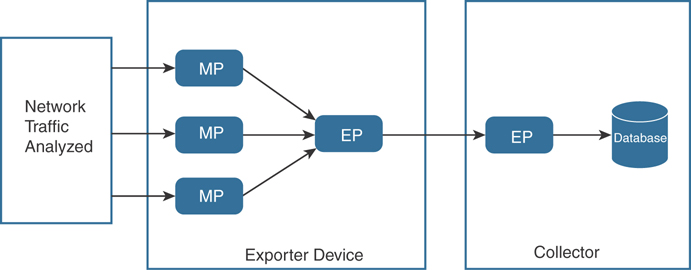
Figure 5-9 IPFIX High-Level Architecture
Understanding IPFIX Mediators
IPFIX introduces the concept of mediators. Mediators collect, transform, and re-export IPFIX streams to one or more collectors. Their main purpose is to allow federation of IPFIX messages. Mediators include an intermediate process (ImP) that allows for the following:
NetFlow data to be kept anonymously
NetFlow data to be aggregated
Filtering of NetFlow data
Proxying of web traffic
IP translation
Figure 5-10 shows a sample architecture that includes an IPFIX mediator.

Figure 5-10 IPFIX Mediator Example
IPFIX Templates
An IPFIX template describes the structure of flow data records within a data set. Templates are identified by a template ID, which corresponds to a set ID in the set header of the data set. Templates are composed of (information element [IE] and length) pairs. IEs provide field type information for each template. Figure 5-11 illustrates these concepts.

Figure 5-11 IPFIX Template Structure
IPFIX covers nearly all common flow collection use cases, such as the following:
The traditional five-tuple (source IP address, destination IP address, source port, destination port, and IP protocol)
Packet treatment such as IP next-hop IPv4 addresses, BGP destination ASN, and others
Timestamps to nanosecond resolution
IPv4, IPv6, ICMP, UDP, and TCP header fields
Sub-IP header fields such as source MAC address and wireless local area network (WLAN) service set identifier (SSID)
Various counters (packet delta counts, total connection counts, top talkers, and so on)
Flow metadata information such as ingress and egress interfaces, flow direction, virtual routing and forwarding (VRF) information
There are numerous others defined at the Internet Assigned Numbers Authority (IANA) website: http://www.iana.org/assignments/ipfix/ipfix.xhtml.
Figure 5-12 shows an example of a template that includes different information element lengths and the association with the respective data set of flow records.
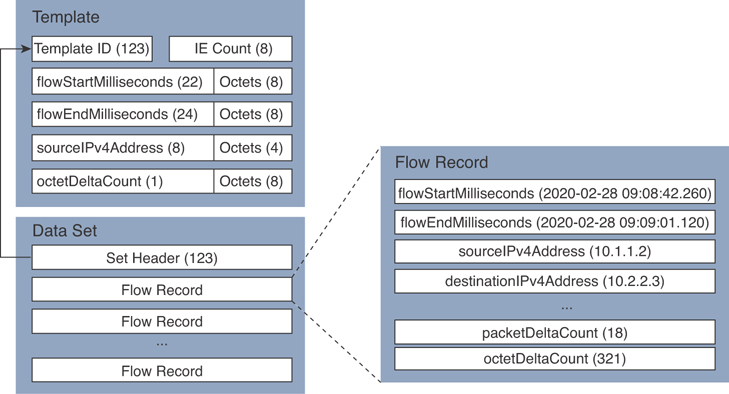
Figure 5-12 Detailed IPFIX Template Example
As shown in Figure 5-12, the template ID matches the set header of the related data set (123) in this example. Then the data set includes a series of flow records. An example of the flow record is shown in the block diagram on the right.
Option Templates
Option templates are a different type of IPFIX templates used to define records referred to as options that are associated with a specified scope. A scope may define an entity in the IPFIX architecture, including the exporting process, other templates, or a property of a collection of flows. Flow records describe flows, and option records define things other than flows, such as the following:
Information about the collection infrastructure
Metadata about flows or a set of flows
Other properties of a set of flows
Understanding the Stream Control Transmission Protocol (SCTP)
IPFIX uses SCTP, which provides a packet transport service designed to support several features beyond TCP or UDP capabilities. These features include the following:
Packet streams
Partial reliability (PR) extension
Unordered delivery of packets or records
Transport layer multihoming
Many refer to SCTP as a simpler state machine than features provided by TCP with an “a la carte” selection of features. PR-SCTP provides a reliable transport with a mechanism to skip packet retransmissions. It allows multiple applications with different reliability requirements to run on the same flow association. In other words, it combines the best effort reliability of UDP while still providing TCP-like congestion control.
SCTP ensures that IPFIX templates are sent reliably by improving end-to-end delay. RFC 6526 introduces additional features such as per-template drop counting with partial reliability and fast template reuse.
Exploring Application Visibility and Control and NetFlow
The Cisco Application Visibility and Control (AVC) solution is a collection of services available in several Cisco network infrastructure devices to provide application-level classification, monitoring, and traffic control. The Cisco AVC solution is supported by the Cisco Integrated Services Routers (ISR), Cisco ASR 1000 Series Aggregation Service Routers (ASR 1000s), and Cisco Wireless LAN Controllers (WLCs). The following are the capabilities Cisco AVC provides:
Application recognition
Metrics collection and exporting
Management and reporting systems
Network traffic control
Application Recognition
Cisco AVC uses existing Cisco Network-Based Application Recognition Version 2 (NBAR2) to provide deep packet inspection (DPI) technology to identify a wide variety of applications within the network traffic flow, using Layer 3 to Layer 7 data.
NBAR works with QoS features to help ensure that the network bandwidth is best used to fulfill its main primary objectives. The benefits of combining these features include the ability to guarantee bandwidth to critical applications, limit bandwidth to other applications, drop selective packets to avoid congestion, and mark packets appropriately so that the network and the service provider’s network can provide QoS from end to end.
Metrics Collection and Exporting
Cisco AVC includes an embedded monitoring agent that is combined with NetFlow to provide a wide variety of network metrics data. The types of metrics the monitoring agent collects include the following:
TCP performance metrics such as bandwidth usage, response time, and latency
VoIP performance metrics such as packet loss and jitter
These metrics are collected and exported in NetFlow v9 or IPFIX format to a management and reporting system.
In Cisco IOS and Cisco IOS-XE routers, metrics records are sent out directly from the data plane when possible, to maximize system performance. However, if more complex processing is required on the Cisco AVC–enabled device, such as if the user requests that a router keep a history of exported records, the records may be exported from the route processor at a lower speed.
You can use QoS capabilities to control application prioritization. Protocol discovery features in Cisco AVC show you the mix of applications currently running on the network. This helps you define QoS classes and polices, such as how much bandwidth to provide to mission-critical applications and how to determine which protocols should be policed. Per-protocol bidirectional statistics are available, such as packet and byte counts as well as bit rates.
After administrators classify the network traffic, they can apply the following QoS features:
Class-based weighted fair queuing (CBWFQ) for guaranteed bandwidth
Enforcing bandwidth limits using policing
Marking for differentiated service downstream or from the service provider using type of service (ToS) bits or DSCPs in the IP header
Drop policy to avoid congestion using weighted random early detection (WRED)
NetFlow Deployment Scenarios
You can enable NetFlow on network devices at all layers of the network to record and analyze all network traffic and identify threats such as malware that could be spreading laterally through the internal network; in other words, malware that spreads between adjacent hosts in the network. The following sections describe different types of NetFlow deployment scenarios within an enterprise network. These deployment scenarios include the following:
User access layer
Wireless LANs
Internet edge
Data center
NetFlow in site-to-site and remote-access VPNs
NetFlow in cloud environments
NetFlow Deployment Scenario: User Access Layer
Figure 5-13 shows an enterprise corporate network where NetFlow is enabled on the access layer switches on different sections of the network.

Figure 5-13 NetFlow Enabled at the User Access Layer
If the access switches do not support NetFlow, you can deploy a Cisco Stealthwatch FlowSensor to generate the NetFlow data. The Cisco Stealthwatch FlowSensor must be placed in a Layer 1 or Layer 2 adjacent manner to the monitoring area of the network.
NetFlow Deployment Scenario: Wireless LAN
NetFlow can be enabled in wireless LAN (WLAN) deployments. An administrator can configure NetFlow in combination with Cisco AVC in Cisco WLCs. The following are a few facts about the hardware and software requirements for AVC and NetFlow support in Cisco WLCs:
Cisco AVC works on traffic from Cisco wireless access points (APs) configured in local mode or enhanced local mode. APs configured in local mode provide wireless service to clients in addition to limited time-sliced attacker scanning. There is an enhanced local mode feature (just called enhanced local mode) that, like local mode, provides wireless service to clients, but when scanning off-channel, the radio dwells on the channel for an extended period of time, allowing enhanced attack detection.
Cisco AVC also works with FlexConnect central switching and OfficeExtend Access Point (OEAP) traffic.
Cisco AVC is based on port, destination, and heuristics, which allows reliable packet classification with deep visibility.
Cisco AVC looks into the initial setup of the client flow (first 10 to 20 packets), so loading on the controller system is minimal.
Cisco AVC and NetFlow support is available for all Cisco controllers supporting Cisco WLC Software Version 7.4 or later.
Figure 5-14 shows a simple topology where an AP is providing wireless connectivity to clients in the corporate network while managed by a Cisco WLC. NetFlow is enabled in the Cisco WLC, as well as other Cisco AVC features.

Figure 5-14 NetFlow-Enabled Wireless Network Devices
Cisco WLC and APs establish a Control And Provisioning of Wireless Access Points (CAPWAP) tunnel between them for communication. CAPWAP is an IETF standard that is based on its predecessor, the Lightweight Access Point Protocol (LWAPP). CAPWAP provides an upgrade path from Cisco products that use LWAPP to next-generation Cisco wireless products to interoperate with third-party APs and to manage radio frequency identification (RFID) readers and similar devices.
NetFlow Deployment Scenario: Internet Edge
You can also deploy NetFlow in the Internet edge to see what traffic is knocking on your door and what is leaving your network. The Cisco ASR 1000 series routers provide multigigabit performance to meet the requirements for Internet gateway functions for medium and large organizations. The architecture of the Cisco ASRs include the Cisco QuantumFlow Processor, which provides a lot of high-performance features such as application layer gateways (ALGs), all Layer 4 to Layer 7 zone-based firewall session processing, high-speed NAT and firewall translation logging, as well as NetFlow Event Logging (NEL). NEL uses NetFlow v9 templates to log binary syslog to NEL collectors, allowing not only the use of NAT at multigigabit rates but also the ability to record NAT and firewall session creation and teardown records at very high speeds.
Figure 5-15 shows how two ASR Cisco ASR 1000 series routers are connected to two different Internet service providers (ISPs) and enabled for NetFlow. The ISP edge is a critical part of the Internet edge because it provides the interface to the public Internet infrastructure.
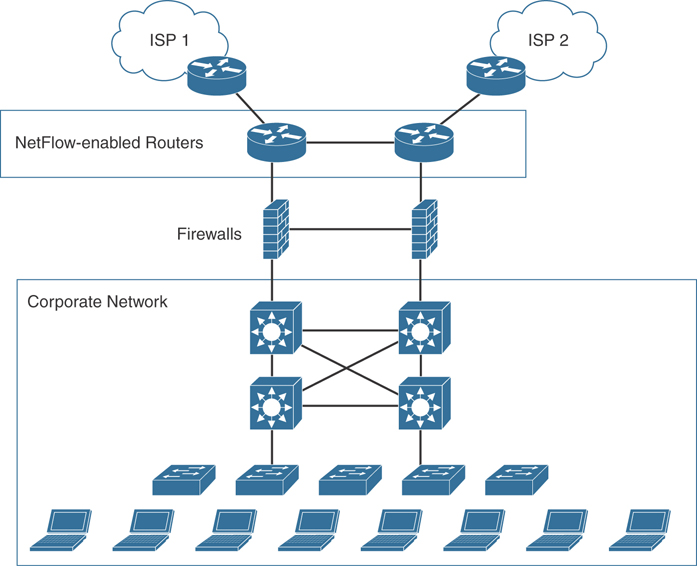
Figure 5-15 NetFlow Enabled at the Internet Edge
The Internet edge can be built out of many platforms and components that might fail or that might be subject to attack. Designing a redundant architecture helps eliminate single points of failure, thereby improving the availability and resiliency of the network.
NetFlow Deployment Scenario: Data Center
The data center can be a very complex world. It not only provides a rich set of services and architectures, but it also hosts the crown jewels of your organization. It is extremely important to maintain visibility of everything that is happening in the data center. The concepts of “north-to-south” and “east-to-west” are often used when trying to describe the types of communication (or flow) within and to the outside of the data center:
North-to-south IP traffic is the communication with end users and external entities.
East-to-west is the communication between entities in the data center.
Figure 5-16 demonstrates the concepts of north-to-south and east-to-west communication.
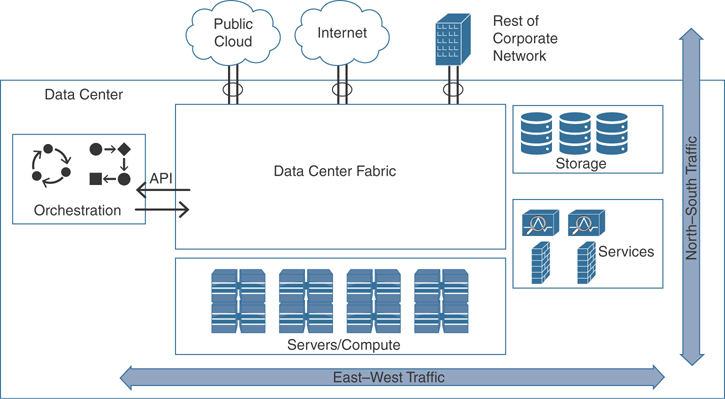
Figure 5-16 North-to-South and East-to-West Communication in the Data Center
The data center has many different high-throughput and low-latency requirements, in addition to increasing high-availability requirements. In addition, automated provisioning and control with orchestration, monitoring, and management tools are crucial.
The data center architecture consists of three primary modular layers with hierarchical interdependencies:
Data center foundation: Primary building block of the data center on which all other services rely. Despite the size of the data center, the foundation must be resilient, scalable, and flexible to support data center services that add value, performance, and reliability. The data center foundation provides the computing necessary to support the applications that process information and the seamless transport between servers, storage, and the end users who access the applications.
Data center services: Includes infrastructure components to enhance the security of the applications and access to critical data. It also includes virtual switching services to extend the network control in a seamless manner from the foundation network into the hypervisor systems on servers to increase control and lower operational costs (as well as other application resilience services).
User services: Includes email, order processing, and file sharing or any other applications in the data center that rely on the data center foundation and services like database applications, modeling, and transaction processing.
Examples of the data center service insertion components include the following:
Firewalls
Intrusion prevention systems (IPSs)
Application delivery features
Server load balancing
Network analysis tools (such as NetFlow)
Virtualized services deployed in a distributed manner along with virtual machines
Application Centric Infrastructure (ACI) automated framework components for service insertion
NetFlow collection in large data centers can be very challenging because of the large amount of data being generated at very high rates. In this case, the Cisco Stealthwatch FlowSensor provides a high-performance solution for flow visibility in multigigabit data centers.
Figure 5-17 illustrates how two Cisco Stealthwatch FlowSensors are deployed in the data center services architecture.

Figure 5-17 Cisco Stealthwatch FlowSensors in the Data Center
The Cisco Stealthwatch FlowSensor can be placed to receive data from the physical access, aggregation, and core layers to maintain complete visibility of all traffic within the data center, in addition to traffic that is leaving the data center (north-to-south and east-to-west traffic). Traffic within the virtual environment (VM-to-VM traffic) can be monitored using the Nexus 1000V, and traffic entering and leaving the data center can be monitored using edge devices such as the Cisco ASA, Cisco FTD, and Nexus 7000 and Nexus 9000 switches. Strategically placing the Stealthwatch FlowSensors in the aggregation and core layers ensures effective monitoring of traffic within the data center and provides additional statistics for traffic leaving the data center.
If the deployment of the Cisco Stealthwatch FlowSensor is not possible, you can enable NetFlow in the Cisco ASA or enabled in any other strategic areas of the data center such as data center distribution switches and access switches.
NetFlow Deployment Scenario: NetFlow in Site-to-Site and Remote VPNs
Many organizations deploy VPNs to provide data integrity, authentication, and data encryption to ensure confidentiality of the packets sent over an unprotected network or the Internet. VPNs are designed to avoid the cost of unnecessary leased lines. You can also strategically enable NetFlow in VPN termination points for both site-to-site and remote-access VPN scenarios.
Remote-access VPNs enable users to work from remote locations such as their homes, hotels, and other premises as if they were directly connected to their corporate network.
Figure 5-18 shows how two remote-access VPN clients connect to a Cisco ASA in the corporate network.

Figure 5-18 NetFlow in Remote-Access VPNs
The remote-access clients use the Cisco AnyConnect Secure Mobility Client. One is creating a Secure Sockets Layer (SSL) VPN tunnel, and the other is creating an IPsec tunnel.
NetFlow Secure Event Logging (NSEL) can be enabled at the Cisco ASA to monitor traffic from any type of remote-access client VPN termination.
You can also configure the Cisco AnyConnect client with the Network Visibility Module (NVM). NVM collects network flow information from an endpoint on or off premises. This allows you to maintain visibility into network-connected devices and user behaviors by sending this flow information to Cisco Stealthwatch. You can also take advantage of this feature to perform capacity and service planning, auditing, compliance, and security analytics. NVM monitors application use by leveraging expanded IPFIX elements. You can also use NVM to classify logical groups of applications, users, or endpoints.
Site-to-site (otherwise known as LAN-to-LAN) VPNs enable organizations to establish VPN tunnels between two or more network infrastructure devices in different sites so that they can communicate over a shared medium such as the Internet. Many organizations use IPsec, generic routing encryption (GRE), Dynamic Multipoint VPN (DMVPN), FlexVPN, and Multiprotocol Label Switching (MPLS) VPN as site-to-site VPN protocols. Typically, site-to-site VPN tunnels are terminated between two or more network infrastructure devices, whereas remote-access VPN tunnels are formed between a VPN headend device and an end-user workstation or hardware VPN client. Figure 5-19 shows a site-to-site VPN example.

Figure 5-19 NetFlow in Site-to-Site VPNs
In Figure 5-19, two site-to-site VPNs are terminated in the router (R1) at the corporate headquarters. One of the tunnels connects to a router (R2) at a business partner in Boston, Massachusetts, and the second tunnel connects the corporate headquarters to a remote branch office router (R3) in Raleigh, North Carolina. In this example, NetFlow is enabled in R1 to monitor traffic coming from both of the remote locations.
Cisco Stealthwatch
Cisco acquired Lancope several years ago and further developed their Stealthwatch solution. The Cisco Stealthwatch solution uses NetFlow telemetry and contextual information from the Cisco network infrastructure. This solution allows network administrators and cybersecurity professionals to analyze network telemetry in a timely manner to defend against advanced cyber threats, including the following:
Network reconnaissance
Malware proliferation across the network for the purpose of stealing sensitive data or creating back doors to the network
Communications between the attacker (or command-and-control servers) and the compromised internal hosts
Data exfiltration
Cisco Stealthwatch aggregates and normalizes considerable amounts of NetFlow data to apply security analytics to detect malicious and suspicious activity. The Cisco Stealthwatch Management Console (SMC) provides a rich graphical unit interface (GUI) with many visualizations and telemetry information.
The following are the primary components of the Cisco Stealthwatch solution:
FlowCollector: A physical or virtual appliance that collects NetFlow data from infrastructure devices.
Stealthwatch Management Console (SMC): The main management application that provides detailed dashboards and the ability to correlate network flow and events.
Flow licenses: Required to aggregate flows at the Stealthwatch Management Console. (Flow licenses define the volume of flows that may be collected.)
The following are optional components of the Cisco Stealthwatch System:
FlowSensor: A physical or virtual appliance that can generate NetFlow data when legacy Cisco network infrastructure components are not capable of producing line-rate, unsampled NetFlow data.
FlowReplicator: A physical appliance used to forward NetFlow data as a single data stream to other devices. The FlowReplicator is also known as the UDP Director.
Figure 5-20 illustrates the components of the Cisco Stealthwatch solution and its integration with Cisco ISE for identity services and Cisco Talos for threat intelligence ingest.
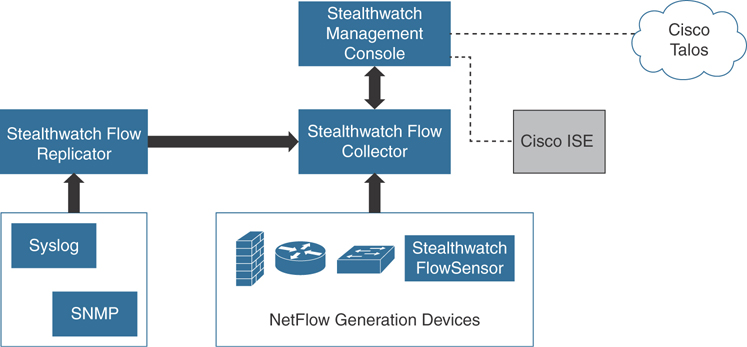
Figure 5-20 The Cisco Stealthwatch Solution Components
Stealthwatch Cloud
Stealthwatch Cloud is a Software as a Service (SaaS) cloud solution. You can use Stealthwatch Cloud to monitor many different public cloud environments, such as Amazon’s AWS, Google Cloud Platform, and Microsoft Azure. All of these cloud providers support their own implementation of NetFlow:
In Amazon AWS, the equivalent of NetFlow is called VPC Flow Logs. You can obtain detailed information about VPC Flow Logs in AWS at https://docs.aws.amazon.com/vpc/latest/userguide/flow-logs.html.
Google Cloud Platform also supports VPC Flow Logs (or Google-branded GPC Flow Logs). You can obtain detailed information about VPC Flow Logs in Google Cloud Platform at https://cloud.google.com/vpc/docs/using-flow-logs.
In Microsoft’s Azure, traffic flows are collected in Network Security Group (NSG) flow logs. NSG flow logs are a feature of Network Watcher. You can obtain additional information about Azure’s NSG flow logs and Network Watcher at https://docs.microsoft.com/en-us/azure/network-watcher/network-watcher-nsg-flow-logging-overview.
Figure 5-21 shows the Cisco Stealthwatch Cloud AWS Visualizations Network Graph. The AWS Visualizations Network Graph allows you to explore the nodes you have deployed in AWS, and when you mouse over each node, additional information is provided.

Figure 5-21 The Cisco Stealthwatch Cloud AWS Visualizations Network Graph
Figure 5-22 shows the Cisco Stealthwatch Cloud AWS Visualizations Security Groups screen, which allows you to explore the AWS security groups that are deployed.

Figure 5-22 The Cisco Stealthwatch Cloud AWS Visualizations Security Groups
Figure 5-23 shows the Cisco Stealthwatch Cloud AWS Visualizations Identity and Access Management (IAM) screen. The AWS Visualizations IAM screen allows you to explore the AWS IAM permissions. You can obtain detailed information about AWS IAM at https://aws.amazon.com/iam/.
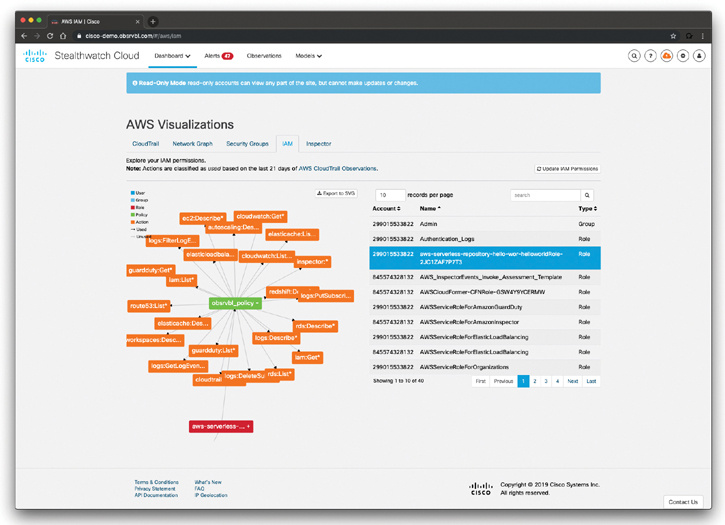
Figure 5-23 The Cisco Stealthwatch Cloud AWS Visualizations AWS IAM Permissions
If you navigate to the Alerts tab in the Cisco Stealthwatch Cloud portal, you can drill down to any of the alerts being generated. Figure 5-24 shows the details about an alert (Excessive Access Attempts).

Figure 5-24 Excessive Access Attempts Alert in Cisco Stealthwatch Cloud
You can click any of the “supporting observations” shown at the bottom of Figure 5-24 to get additional details. Figure 5-25 shows the details of one of the supporting observations. In Figure 5-25, you can see a visualization of the history of the device metrics, the different IP addresses associated with such an alert, as well as other traffic statistics.

Figure 5-25 Details of the Supporting Observations in Cisco Stealthwatch Cloud
You can perform profiling of the applications and associated connections and then obtain the results under the Profiling tab, as shown Figure 5-26.
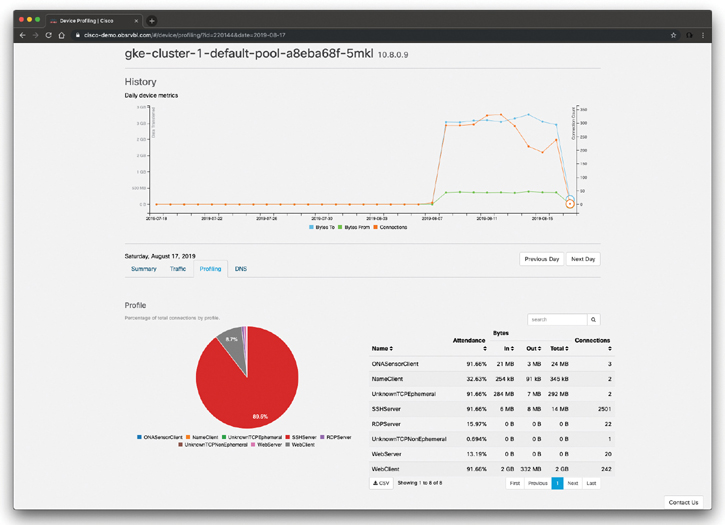
Figure 5-26 Connection Profiling in Cisco Stealthwatch Cloud
If you navigate to Dashboard > Network Dashboard, you can obtain very detailed visualizations of everything that is happening in the observed environment. Figure 5-27 shows the Cisco Stealthwatch Cloud Network Dashboard.

Figure 5-27 The Cisco Stealthwatch Cloud Network Dashboard
On-Premises Monitoring with Cisco Stealthwatch Cloud
You can also monitor on-premises networks in your organizations using Cisco Stealthwatch Cloud. In order to do so, you need to deploy at least one Cisco Stealthwatch Cloud Sensor appliance (virtual or physical appliance). The Cisco Stealthwatch Cloud Sensor appliance can be deployed in two different modes (not mutually exclusive):
Processing network metadata from a SPAN or a network TAP
Processing metadata out of NetFlow or IPFIX flow records
Figure 5-28 illustrates how the Stealthwatch Cloud Sensor appliance is deployed in a corporate network to send network metadata information to the Cisco Stealthwatch Cloud.
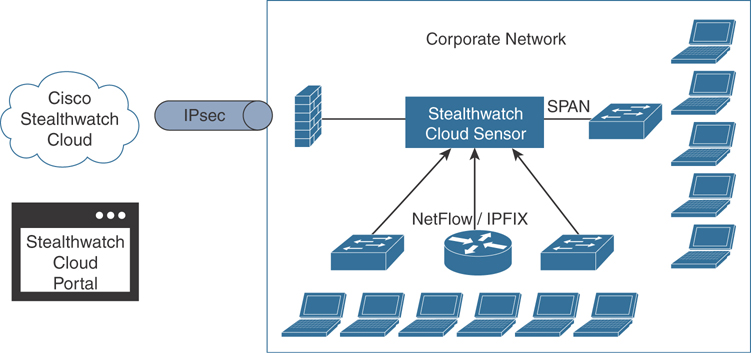
Figure 5-28 The Cisco Stealthwatch Cloud On-Premises Monitoring
Cisco Stealthwatch Cloud Integration with Meraki and Cisco Umbrella
Cisco Stealthwatch Cloud can also be integrated with Meraki and Cisco Umbrella. The following document details the integration with Meraki: https://www.cisco.com/c/dam/en/us/td/docs/security/stealthwatch/cloud/portal/SWC_Meraki_DV_1_1.pdf.
The following document outlines how to integrate Stealthwatch Cloud with the Cisco Umbrella Investigate REST API in order to provide additional information in the Stealthwatch Cloud environment for external entity domain information: https://www.cisco.com/c/dam/en/us/td/docs/security/stealthwatch/cloud/portal/SWC_Umbrella_DV_1_0.pdf.
Exploring the Cisco Stealthwatch On-Premises Appliances
The Cisco Stealthwatch Security Insight Dashboard displayed in Figure 5-29 can be used to quickly see the events that have triggered alarms within your premises. Some of the graphics provide data for the past 7 days (such as the Alarms by Type), and some information concerns data for the last 24 hours (such as the Today’s Alarms statistics, the Flow Collection Trend, and the Top Applications visualization).
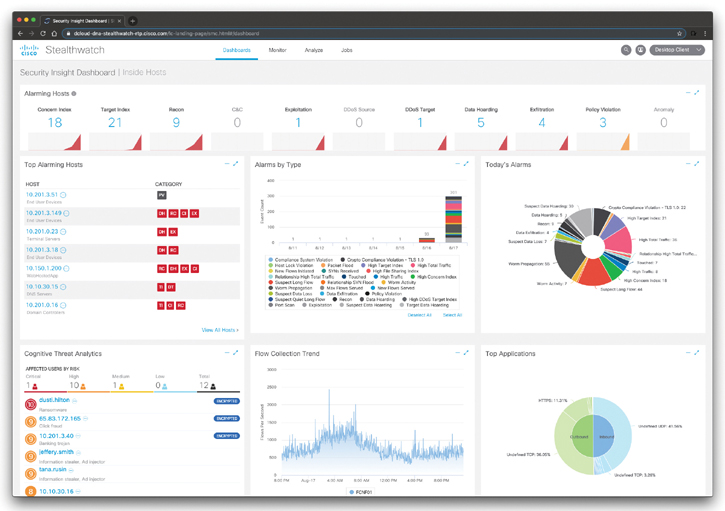
Figure 5-29 The Cisco Stealthwatch On-Premises Security Insight Dashboard
If you click any of the alarming hosts, you can drill down to the specifics of each host and associated traffic, as demonstrated in Figure 5-30.
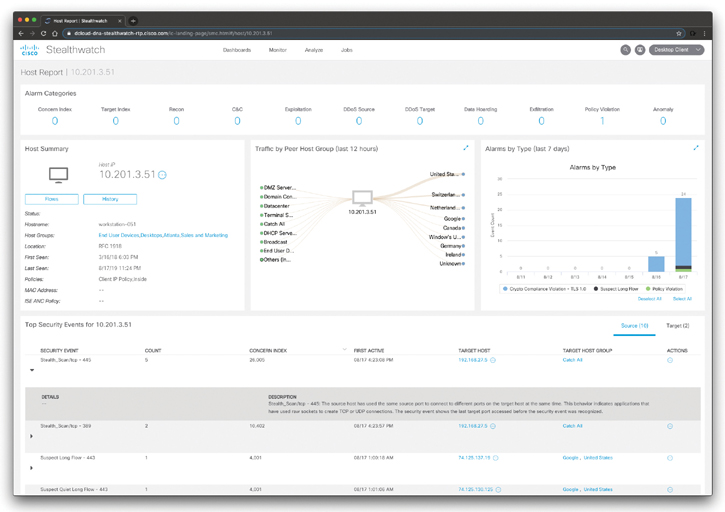
Figure 5-30 The Cisco Stealthwatch Host Report
In the Host Report page shown in Figure 5-30, you can view information about a single host’s activity as far back as the last 7 days to determine if there is a security risk associated with that host. The information shown pertains to an individual host. You can also use this page to assign a host to one or more host groups.
You can also perform very detailed flow searches by navigating to Analyze > Flow Search, as demonstrated in Figure 5-31.
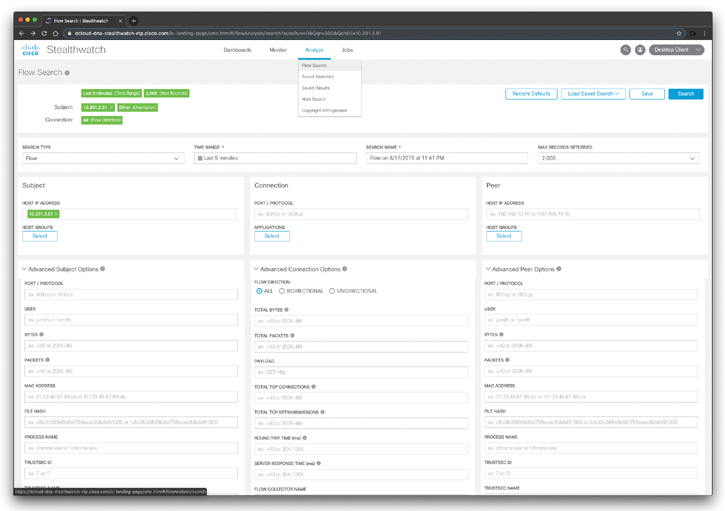
Figure 5-31 The Cisco Stealthwatch Flow Search
The Flow Search page shown in Figure 5-31 is useful as a way of monitoring the behavior of a host or range of hosts at a high level. If you need more detail or want to perform an in-depth forensic investigation, you can then use the Advanced Options section. The Advanced Options section allows you to define a search using more specific settings than those in the main section. You can use this capability to perform in-depth forensic investigation of suspicious behavior involving a specific host or for a specific time interval. You can use the Advanced Options section to fine tune settings, so the search returns the data that is most relevant for your cybersecurity forensics investigation.
Figure 5-32 shows the results of the flow search.
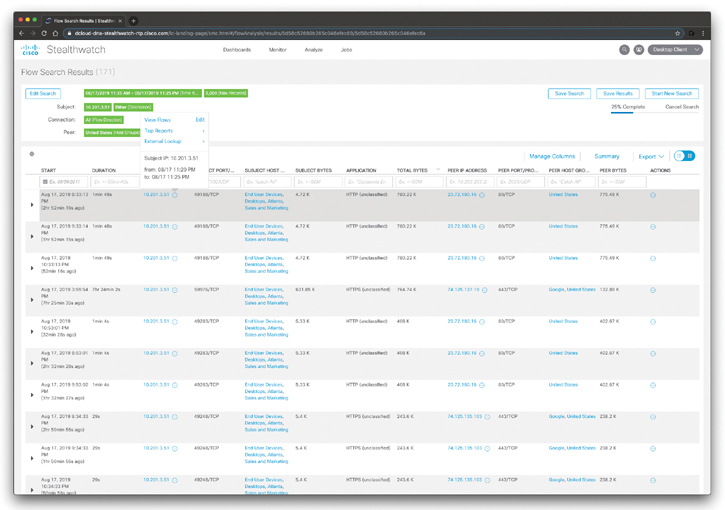
Figure 5-32 The Cisco Stealthwatch Flow Search Results
Threat Hunting with Cisco Stealthwatch
Threat hunting is the concept of “proactively” or “actively” searching for advanced threats that may evade your security products and capabilities. There are different methodologies for threat hunting:
Threat intelligence-driven hunting using threat intelligence feeds and reports, malware analysis, and other vulnerability assessment methods.
Machine learning-based or analytics-driven methods.
Situational or “Crown Jewel” analysis, where you start with a critical system or network in mind and base your “hypothesis” of what an attacker can do to those resources and what indicators should be collected.
Threat hunting is all about a hypothesis of what an advanced threat actor could do to compromise your assets, systems and/or underlying network.
You can use many of the capabilities of Cisco Stealthwatch to perform threat hunting. For instance, the Host Report shown in Figure 5-30 can be used to quickly identify high-level, important information about a specific host, its location, the groups to which it belongs, and the policy assigned to it. You can then start answering questions like the following: Who is this host contacting? Based on the Traffic by Peer Host Group, are there any host groups that raise concerns or questions? Is the volume of traffic reasonable? What is this host doing that I should be concerned about? Are any of the alarm categories at the top of the page showing a volume of alarms that causes concern? If so, you can click the number of active alarms for the category you want to investigate.
You can also use the Application Traffic visualizations to determine which applications this host is using the most. Which ones are transferring the most data? How many are being used to contact inside hosts, and how many are being used to contact outside hosts? Do the results represent normal trends for your system and this host?
You can also navigate to Monitor > Hosts to access the Inside Hosts dashboard shown in Figure 5-33.
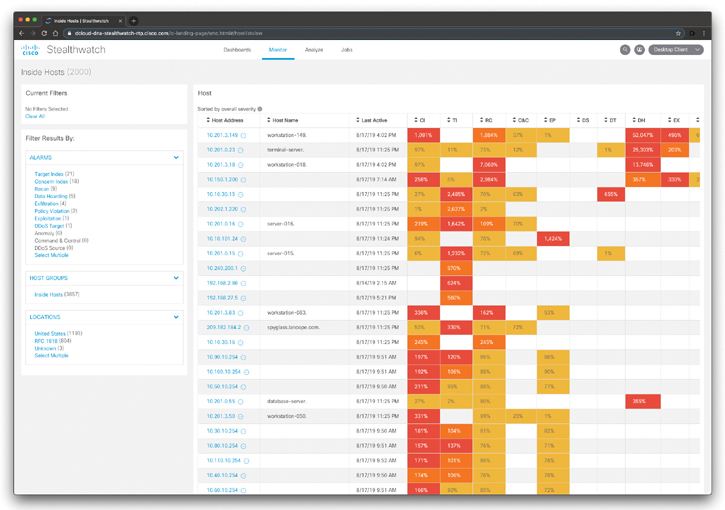
Figure 5-33 The Cisco Stealthwatch Flow Inside Hosts Dashboard
In the dashboard shown in Figure 5-33, you can view the inside hosts that have been active on your network in the last hour. You can also see the host group to which they belong, their location, and the categories of alarms the hosts are triggering.
You can perform a similar analysis for users by navigating to Monitor > Users, as shown in Figure 5-34.

Figure 5-34 The Cisco Stealthwatch Flow Users Dashboard
In the dashboard shown in Figure 5-34, you can see which users have been active in the last hour, as well as information about their sessions, location, and current alarms.
To investigate the activity of a specific user, click that user’s name to open the User Report. To investigate an alarm category for a specific user, click the alarm category column in that row.
Another very useful dashboard that can help you perform threat hunting is the Host Group Report. The Top Host Groups by Traffic screen allows you to visualize the top 10 inside and outside host groups with which the current host group has communicated within the last 12 hours. When you hover your cursor over a line connecting two host groups, the total amount of traffic transferred between these two host groups is displayed. The Host Group Report screen is shown in Figure 5-35.
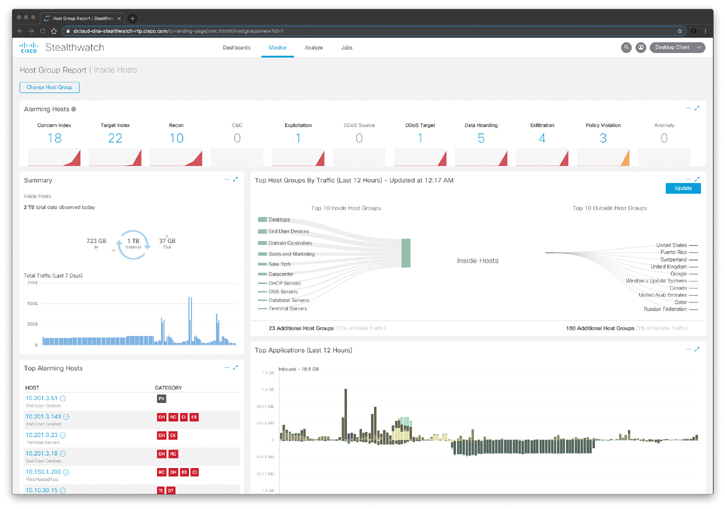
Figure 5-35 The Cisco Stealthwatch Flow Host Group Report
If you click a host group, a column, or the line between two host groups, you can access the context menu from which you can run a flow search or top report to view the traffic associated with the two host groups to conduct a deeper analysis into specific areas of interest. To view flows associated with a particular host, host group, or application, run a flow search. To view top reports that will give more in-depth information about specific areas of interest, run a top report search.
In Figure 5-35, the Concern Index (CI) indicates that the host’s concern index has either exceeded the CI threshold or rapidly increased. The Target Index indicates that the target IP (or host) has been the recipient of more than an acceptable number of scans or other malicious attacks.
Cisco Cognitive Threat Analytics (CTA) and Encrypted Traffic Analytics (ETA)
This section includes information about two solutions that integrate with Cisco Stealthwatch: Cisco Cognitive Threat Analytics (CTA) and Cisco Encrypted Traffic Analytics (ETA).
What Is Cisco ETA?
Cisco ETA can identify malicious (malware) communications in encrypted traffic through passive monitoring, the extraction of relevant data elements, and a combination of behavioral modeling and machine learning. Cisco ETA is able to do this without decrypting the packets traversing the network.
The Cisco ETA components are as follows:
NetFlow
Cisco Stealthwatch
Cisco Cognitive Threat Analytics
What Is Cisco Cognitive Threat Analytics?
Cisco Cognitive Threat Analytics (CTA) is a cloud-based Cisco solution that uses machine learning and statistical modeling of networks. Cisco CTA creates a baseline of the traffic in your network and identifies anomalies. Cisco CTA can also analyze user and device behavior, as well as web traffic to uncover malicious command-and-control communications and data exfiltration.
You can combine Cisco CTA, Cisco Stealthwatch, and Cisco ETA to provide a very comprehensive visibility solution within your organization. In the following section you will learn how Cisco Stealthwatch integrates with Cisco CTA and Cisco ETA to provide visibility of malicious encrypted communications without actually decrypting any packets.
Let’s start by analyzing potential ransomware encrypted traffic in the network. In Figure 5-29, you saw a user called “Dustin Hilton” that was flagged as an affected user under the Cognitive Threat Analytics widget in the Stealthwatch Security Insight dashboard. If you click that user, the screen shown in Figure 5-36 is displayed.

Figure 5-36 The Cisco Cognitive Threat Analytics Dashboard
You must have Cisco CTA configured on your network to display the information shown in Figure 5-36. Cognitive Threat Analytics quickly detects suspicious web traffic and/or NetFlow and responds to attempts to establish a presence in your environment and to attacks that are already underway. The Cisco CTA main dashboard identifies the suspicious traffic and displays the number of affected users or hosts, sorted by incident risk, that Cisco CTA has identified as active on your network. Additionally, it shows the top affected hosts with the incident type. You can hover the incident risk number for more information about the incident risk type.
When you click the user in the Cisco CTA main dashboard, the screen shown in Figure 5-37 is displayed.
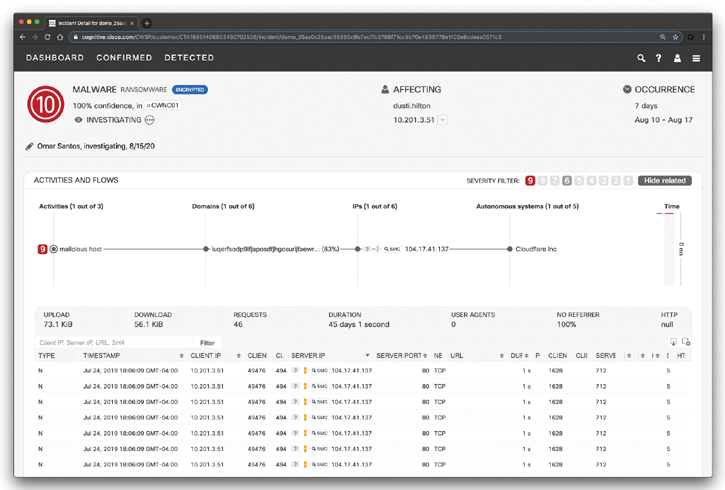
Figure 5-37 The Cisco Cognitive Threat Analytics Malware Investigation
You should always review the connected lines and check activities that are tied to the high-severity ones. In many cases, hosts may contain more malware traffic. You can assign an incident to an analyst to investigate. In the example in Figure 5-37, Omar Santos is investigating the incident. You can mark the incident after investigation. Even when communication is blocked, the machine is still infected. You should always aim to full remediation. Clean the infected system, and in case of reinfection, you may consider reimaging the device.
In Figure 5-37, you can also see the details about each flow. You can also click on the SMC icon by each flow to see the information in Cisco Stealthwatch Management Console.
The Cisco CTA Confirmed tab can be used to display very detailed information about affected users and related malicious traffic, as shown in Figure 5-38.

Figure 5-38 The Cisco Cognitive Threat Analytics Confirmed Dashboard
In the screen shown in Figure 5-38, you can add notes to the specific threat, see the affected users, and each of the malware occurrences. You can also see the infection history and the types of risks in the graphics displayed on the right of the screen. In addition, you can scroll down in the page and see statistics from Cisco’s Global Intelligence (Threat Grid), as shown in Figure 5-39. Threat Grid is the name of a company that Cisco acquired several years ago. The Threat Grid solution provides a way to analyze malware in a sandbox. Threat Grid combines advanced sandboxing capabilities with threat intelligence, and it is now integrated in many Cisco solutions such as Cisco CTA and Cisco AMP for Endpoints.

Figure 5-39 The Cisco Cognitive Threat Analytics Global Threat Intelligence and Threat Grid Integration
In Figure 5-39, you can see that the statistics are based on 32 samples of threat artifacts from Threat Grid that show network behaviors related to this “Confirmed” CTA threat category. You can also see the endpoint content security signatures associated with similar threats (Trojan.Agent, Win.Trojan.Agent, and Win.Trojan.Pramro) and common files appearing in threat samples that may be present at the endpoint.
If you keep scrolling down on the same page, the screen shown in Figure 5-40 is displayed.
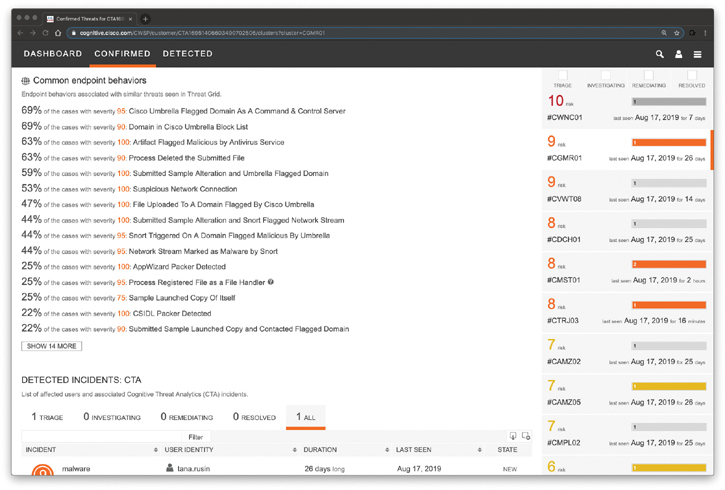
Figure 5-40 The Cisco Cognitive Threat Analytics Common Endpoint Behaviors and Integration with Cisco Umbrella
In Figure 5-40, you can see the endpoint behaviors associated with similar threats seen in Threat Grid. You can also see that some of the entries include threat intelligence information also coming from Cisco Umbrella, such as “Cisco Umbrella Flagged Domain As A Command & Control Server,” “Domain in Cisco Umbrella Block List,” “Submitted Sample Alteration and Umbrella Flagged Domain,” and others.
Figure 5-41 shows the “Detected” dashboard of Cisco CTA. In there you can see the number of incidents being triaged, investigated, remediated, resolved, or all of the incidents. In Figure 5-41, the malware (ransomware) incident is displayed.
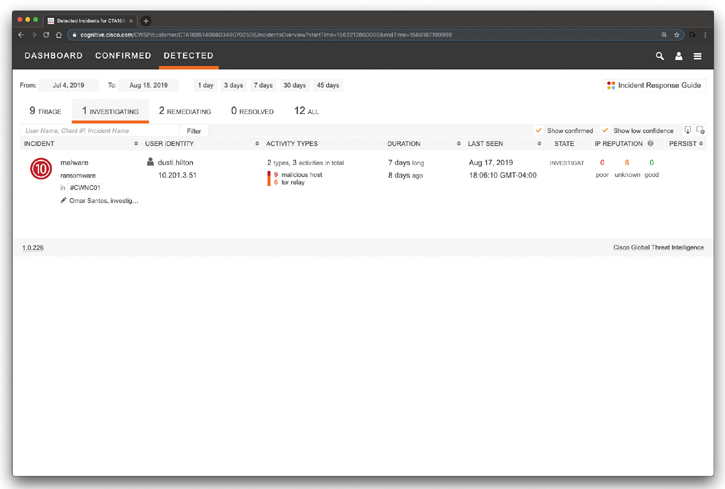
Figure 5-41 The Cisco Cognitive Threat Analytics Detected Dashboard Incident Being Investigated
Figure 5-42 shows the incidents being remediated.
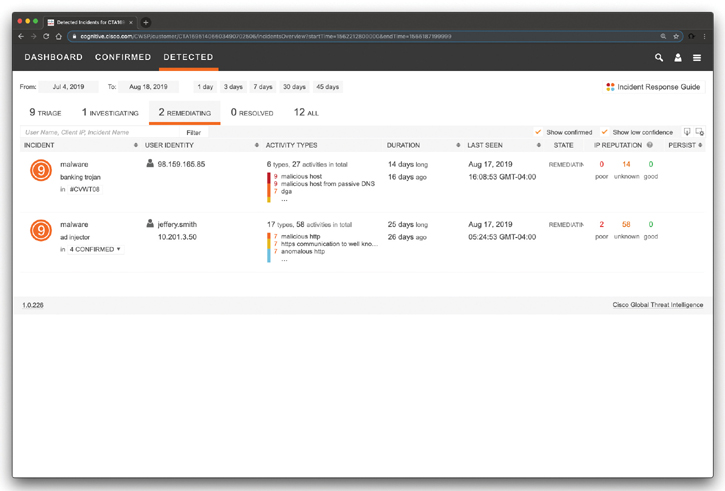
Figure 5-42 The Cisco Cognitive Threat Analytics Detected Dashboard Incidents Being Remediated
Cisco CTA also provides a high-level incident response guide describing how the CTA system assigns each incident a risk value based on expected damage. The incident response guide is shown in Figure 5-43.
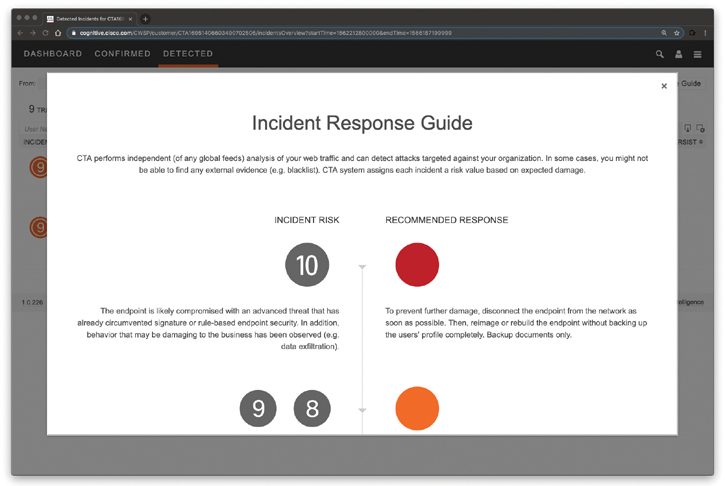
Figure 5-43 The Cisco Cognitive Threat Analytics Incident Response Guide
NetFlow Collection Considerations and Best Practices
Let’s switch back to NetFlow. The following are several best practices and general recommendations when preparing and designing where to enable NetFlow in your organization:
Minimizing NetFlow overhead: NetFlow collection should be done as close to the NetFlow generator as possible. For instance, in the data center, NetFlow can be enabled close to the servers or assets you want to monitor. Another example is in access switches of a network segment where the users you want to monitor reside.
Asymmetric routing considerations: All devices in the asymmetric route should send NetFlow records to the same collector, not to different collectors.
Distributed deployment: In a distributed deployment, FlowCollectors are deployed at multiple sites and are usually placed close to the source producing the highest number of NetFlow records. This deployment has the advantage of limiting the overhead introduced by NetFlow.
Centralized deployment: In a centralized deployment, all NetFlow collectors are placed in a single location. In some cases, the collectors can be configured behind a load balancer. This provides the benefit of a single collection location and possibly a single IP address globally for NetFlow collection. This deployment offers advantages in environments where NetFlow generators are far apart.
Bandwidth consideration: It is not recommended to collect NetFlow over wide area network (WAN) connections because there might be limitations in bandwidth between sites to consider, as well. You should plan ahead and identify the monitoring locations that make more sense for your environment.
Determining the Flows per Second and Scalability
One of the most important steps in the planning and design of NetFlow deployments is to determine and measure the flows per second (fps) volume that will be generated by the monitoring locations. The volume or fps indicates how many records the collectors must be able to receive and analyze.
Many different factors affect the volume of NetFlow records generated by network infrastructure devices. Forecasting an exact number can be difficult. As a general rule, a NetFlow-enabled device can generate between 1000 and 5000 fps per 1 gigabit per second (Gbps) of traffic passing through such a device. The number of fps fundamentally depends on the following:
Number of unique flows passing through the NetFlow-enabled device.
Number of new connections per second.
The lifetime of each of the flows. Some flows can be short-lived and others may be long-lived.
The network overhead introduced by NetFlow is also influenced by the number of fps and the NetFlow record size.
Careful planning is required when enabling NetFlow in high-impact areas of your network. You can start by enabling NetFlow in certain areas of your network and becoming familiar with the impact it may have in the rest of your deployment. A few tools are available that you can use to forecast the impact of enabling NetFlow in your network.
Configuring NetFlow in Cisco IOS and Cisco IOS-XE
In this section, you will learn how to configure NetFlow and specifically Flexible NetFlow. Flexible NetFlow provides enhanced optimization of the network infrastructure, reduces costs, and improves capacity planning and security detection beyond other flow-based technologies available today. Flexible NetFlow supports IPv6 and Network-Based Application Recognition (NBAR) 2 for IPv6 starting in Cisco IOS Software Version 15.2(1)T. It also supports IPv6 transition techniques (IPv6 inside IPv4). Flexible NetFlow can detect the following tunneling technologies that give full IPv6 connectivity for IPv6-capable hosts that are on the IPv4 Internet but that have no direct native connection to an IPv6 network:
Teredo
Intra-Site Automatic Tunnel Addressing Protocol (ISATAP)
6to4
6rd
Simultaneous Application Tracking
Flexible NetFlow tracks different applications simultaneously. For instance, security monitoring, traffic analysis, and billing can be tracked separately, and the information customized per application.
Flexible NetFlow allows the network administrator or security professional to create multiple flow caches or information databases to track. Conventionally, NetFlow has a single cache, and all applications use the same cache information. Flexible NetFlow supports the collection of specific security information in one flow cache and traffic analysis in another. Consequently, each NetFlow cache serves a different purpose. For instance, multicast and security information can be tracked separately and the results sent to two different collectors. Figure 5-44 shows the Flexible NetFlow model and how three different monitors are used. Monitor 1 exports Flexible NetFlow data to Exporter 1, Monitor 2 exports Flexible NetFlow data to Exporter 2, and Monitor 3 exports Flexible NetFlow data to Exporter 1 and Exporter 3.

Figure 5-44 The Flexible NetFlow Model
The following are the Flexible NetFlow components:
Records
Flow monitors
Flow exporters
Flow samplers
In Flexible NetFlow, the administrator can specify what to track, resulting in fewer flows. This helps to scale in busy networks and use fewer resources that are already taxed by other features and services.
Flexible NetFlow Records
Records are a combination of key and non-key fields. In Flexible NetFlow, records are appointed to flow monitors to define the cache that is used for storing flow data. There are seven default attributes in the IP packet identity or “key fields” for a flow and for a device to determine whether the packet information is unique or similar to other packets sent over the network. Fields such as TCP flags, subnet masks, packets, and number of bytes are non-key fields. However, they are often collected and exported in NetFlow or in IPFIX.
Flexible NetFlow Key Fields
There are several Flexible NetFlow key fields in each packet that is forwarded within a NetFlow-enabled device. The device looks for a set of IP packet attributes for the flow and determines whether the packet information is unique or similar to other packets. In Flexible NetFlow, key fields are configurable, which enables the administrator to conduct a more granular traffic analysis.
Figure 5-45 lists the key fields related to the actual flow, device interface, and Layer 2 services.
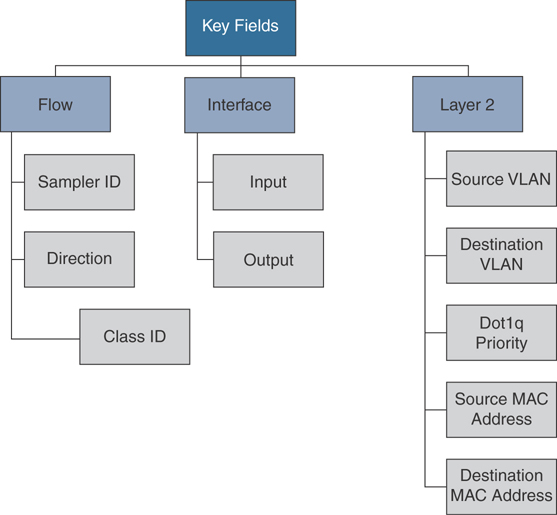
Figure 5-45 Flexible NetFlow Key Fields Related to Flow, Interface, and Layer 2
Figure 5-46 lists the IPv4- and IPv6-related key fields.

Figure 5-46 Flexible IPv4 and IPv6 Key Fields
Figure 5-47 lists the Layer 3 routing protocol-related key fields.
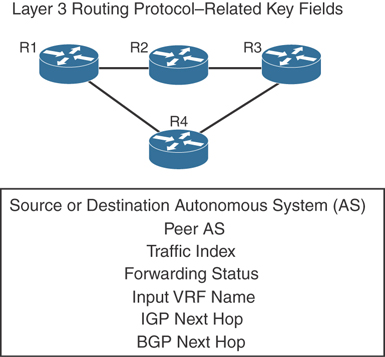
Figure 5-47 Flexible NetFlow Layer 3 Routing Protocol Key Fields
Figure 5-48 lists the transport-related key fields.

Figure 5-48 Flexible NetFlow Transport Key Fields
Figure 5-49 lists the multicast-related key fields.

Figure 5-49 Flexible NetFlow Multicast Key Fields
Flexible NetFlow Non-Key Fields
There are several non-key Flexible NetFlow fields. Network administrators can use non-key fields for different purposes. For instance, the number of packets and amount of data (bytes) can be used for capacity planning and also to identify denial-of-service (DoS) attacks, in addition to other anomalies in the network.
The following are the non-key fields related to counters:
byte counts
bytes long
bytes square sum
bytes square sum long
number of packets
packets long
bytes replicated
bytes replicated long
The following are the timestamp-related non-key fields:
sysUpTime first packet
sysUpTime last packet
absolute first packet
absolute last packet
The following are the IPv4-only non-key fields:
total length minimum
total length maximum
TTL minimum
TTL maximum
The following are the IPv4 and IPv6 non-key fields:
total length minimum
total length maximum
NetFlow Predefined Records
Flexible NetFlow includes several predefined records that can help an administrator or security professional start deploying NetFlow within their organization. Alternatively, they can create their own customized records for more granular analysis. As Cisco evolves Flexible NetFlow, many popular user-defined flow records could be made available as predefined records to make them easier to implement.
The predefined records guarantee backward compatibility with legacy NetFlow collectors. Predefined records have a unique blend of key and non-key fields that allows network administrators and security professionals to monitor different types of traffic in their environment without any customization.
User-Defined Records
As the name indicates, Flexible NetFlow gives network administrators and security professionals the flexibility to create their own records (user-defined records) by specifying key and non-key fields to customize the data collection. The values in non-key fields are added to flows to provide additional information about the traffic in the flows. A change in the value of a non-key field does not create a new flow. In most cases, the values for non-key fields are taken from only the first packet in the flow. Flexible NetFlow enables you to capture counter values such as the number of bytes and packets in a flow as non-key fields.
Flexible NetFlow adds a new NetFlow v9 export format field type for the header and packet section types. A device configured for Flexible NetFlow communicates with the collector what the configured section sizes are in the corresponding NetFlow v9 export template fields.
Flow Monitors
In Flexible NetFlow, flow monitors are applied to the network device interfaces to perform network traffic monitoring. Flow data is collected from the network traffic and added to the flow monitor cache during the monitoring process based on the key and non-key fields in the flow record.
Flow Exporters
The entities that export the data in the flow monitor cache to a remote system are called flow exporters. Flow exporters are configured as separate entities. Flow exporters are assigned to flow monitors. An administrator can create several flow exporters and assign them to one or more flow monitors. A flow exporter includes the destination address of the reporting server, the type of transport (User Datagram Protocol [UDP] or Stream Control Transmission Protocol [SCTP]), and the export format corresponding to the NetFlow version or IPFIX. You can configure up to eight flow exporters per flow monitor.
Flow Samplers
Flow samplers are created as separate components in a router’s configuration. Flow samplers are used to reduce the load on the device running Flexible NetFlow by limiting the number of packets selected for analysis.
Flow sampling exchanges monitoring accuracy for router performance. When you apply a sampler to a flow monitor, the overhead load on the router from running the flow monitor is reduced because the number of packets the flow monitor must analyze is reduced. The reduction in the number of packets that are analyzed by the flow monitor causes a corresponding reduction in the accuracy of the information stored in the flow monitor’s cache.
Flexible NetFlow Configuration
The sections that follow provide step-by-step configuration guidance on how to enable and configure Flexible NetFlow in a Cisco IOS or Cisco IOS-XE device. Figure 5-50 lists the Flexible NetFlow configuration steps in a sequential graphical representation.
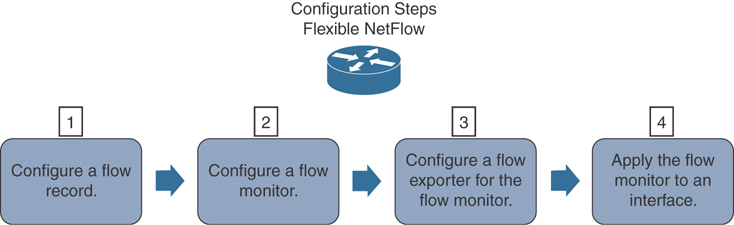
Figure 5-50 Flexible NetFlow Configuration Steps
The topology shown in Figure 5-51 is used in the following examples.
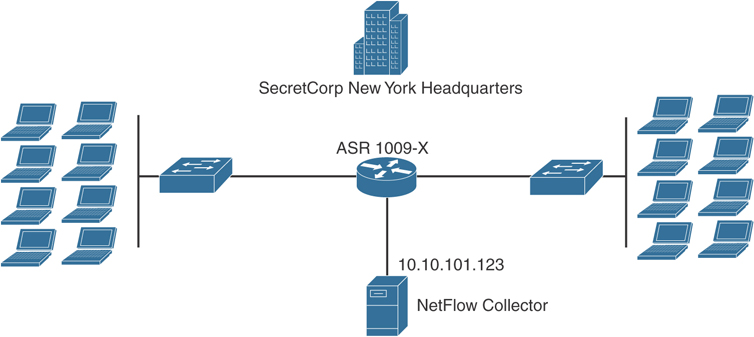
Figure 5-51 NetFlow Configuration Example Topology
A Cisco ASR 1009-X at the SecretCorp New York headquarters is configured for Flexible NetFlow.
Configure a Flow Record
The following are the steps required to configure a customized flow record.
Step 1. Log in to your router and enter into enable mode with the enable command:
NY-ASR1009-X>enable
Step 2. Enter into configuration mode with the configure terminal command:
NY-ASR1009-X#configure terminal
Enter configuration commands, one per line.  End with
CNTL/Z.
Step 3. Create a flow record with the flow record command. In this example, the record name is NY-ASR-FLOW-RECORD-1. After you enter the flow record command, the router enters flow record configuration mode. You can also use the flow record command to edit an existing flow record:
NY-ASR1009-X(config)# flow record NY-ASR-FLOW-RECORD-1
Step 4. (Optional) Enter a description for the new flow record:
NY-ASR1009-X(config-flow-record)# description FLOW
RECORD 1 for basic traffic analysis
Step 5. Configure a key field for the flow record using the match command. In this example, the IPv4 destination address is configured as a key field for the record:
NY-ASR1009-X(config-flow-record)# match ipv4 destination
address
The output of the match ? command shows all the primary options for the key field categories that you learned earlier in this chapter:
NY-ASR1009-X(config-flow-record)# match ?
  application   Application fields
  flow Flow     identifying fields
  interface     Interface fields
  ipv4 IPv4     fields
  ipv6 IPv6     fields
  routing       Routing attributes
  transport     Transport layer fields
Step 6. Configure a non-key field with the collect command. In this example, the input interface is configured as a non-key field for the record:
NY-ASR1009-X(config-flow-record)# collect interface input
The output of the collect ? command shows all the options for the non-key field categories that you learned earlier in this chapter:
NY-ASR1009-X(config-flow-record)# collect ?
  application   Application fields
  counter       Counter fields
  flow Flow     identifying fields
  interface     Interface fields
  ipv4 IPv4     fields
  ipv6 IPv6     fields
  routing       Routing attributes
  timestamp     Timestamp fields
  transport     Transport layer fields
Step 7. Exit configuration mode with the end command and return to privileged EXEC mode:
NY-ASR1009-X(config-flow-record)# end
You can use show flow record to show the status and fields for the flow record. If multiple flow records are configured in the router, you can use the show flow record name command to show the output of a specific flow record, as shown here:
NY-ASR1009-X# show flow record NY-ASR-FLOW-RECORD-1
flow record NY-ASR-FLOW-RECORD-1:
  Description:         Used for basic traffic analysis
  No. of users:        0
  Total field space:   8 bytes
  Fields:
    match ipv4 destination address
    collect interface input
Use the show running-config flow record command to show the flow record configuration in the running configuration, as shown next:
NY-ASR1009-X# show running-config flow record
Current configuration:
!
flow record NY-ASR-FLOW-RECORD-1
 description Used for basic traffic analysis
 match ipv4 destination address
 collect interface input
Configure a Flow Monitor for IPv4 or IPv6
The following are the steps required to configure a flow monitor for IPv4 or IPv6 implementations. In the following examples, a flow monitor is configured for the previously configured flow record.
Step 1. Log in to your router and enter into enable mode with the enable command:
NY-ASR1009-X>enable
Step 2. Enter into configuration mode with the configure terminal command:
NY-ASR1009-X# configure terminal
Enter configuration commands, one per line. End with
CNTL/Z.
Step 3. Create a flow monitor with the flow monitor command. In this example, the flow monitor is called NY-ASR-FLOW-MON-1:
NY-ASR1009-X(config)# flow monitor NY-ASR-FLOW-MON-1
Step 4. (Optional) Enter a description for the new flow monitor:
NY-ASR1009-X(config-flow-monitor)# description monitor
for IPv4 traffic in NY
Step 5. Identify the record for the flow monitor:
NY-ASR1009-X(config-flow-monitor)# record netflow
NY-ASR-FLOW-RECORD-1
In the following example, the record ? command is used to see all the flow monitor record options:
NY-ASR1009-X(config-flow-monitor)# record ?
  NY-ASR-FLOW-RECORD-1  Used for basic traffic analysis
  netflow               Traditional NetFlow collection
                        schemes
  netflow-original      Traditional IPv4 input NetFlow
                        with origin ASs
Step 6. Exit configuration mode with the end command and return to privileged EXEC mode:
NY-ASR1009-X(config-flow-record)# end
You can use show flow monitor to show the status and configured parameters for the flow monitor, as shown next:
NY-ASR1009-X# show flow monitor
Flow Monitor NY-ASR-FLOW-MON-1:
  Description:        monitor for IPv4 traffic in NY
  Flow Record:        NY-ASR-FLOW-RECORD-1
  Cache:
    Type:               normal (Platform cache)
    Status:             not allocated
    Size:               200000 entries
    Inactive Timeout:   15 secs
    Active Timeout:     1800 secs
    Update Timeout:     1800 secs
Use the show running-config flow monitor command to display the flow monitor configuration in the running configuration, as shown here:
NY-ASR1009-X# show running-config flow monitor
Current configuration:
!
flow monitor NY-ASR-FLOW-MON-1
 description monitor for IPv4 traffic in NY
 record NY-ASR-FLOW-RECORD-1
 cache entries 200000
Configure a Flow Exporter for the Flow Monitor
Complete the following steps to configure a flow exporter for the flow monitor to export the data that is collected by NetFlow to a remote system for further analysis and storage. This is an optional step. IPv4 and IPv6 are supported for flow exporters.
Step 1. Log in to the router and enter into enable and configuration mode, as you learned in previous steps.
Step 2. Create a flow exporter with the flow exporter command. In this example, the exporter name is NY-EXPORTER-1:
NY-ASR1009-X(config)# flow exporter NY-EXPORTER-1
Step 3. (Optional) Enter a description for the exporter:
NY-ASR1009-X(config-flow-exporter)# description exports
to New York Collector
Step 4. Configure the export protocol using the export-protocol command. In this example, NetFlow v9 is used. You can also configure legacy NetFlow v5 with the netflow-v5 keyword or IPFIX with the ipfix keyword. IPFIX support was added in Cisco IOS Software Release 15.2(4)M and Cisco IOS XE Release 3.7S.
NY-ASR1009-X(config-flow-exporter)# export-protocol
netflow-v9
Step 5. Enter the IP address of the destination host with the destination command. In this example, the destination host is 10.10.10.123:
NY-ASR1009-X(config-flow-exporter)# destination
10.10.10.123
Step 6. You can configure the UDP port used by the flow exporter with the transport udp command. The default is UDP port 9995.
Step 7. Exit the Flexible NetFlow flow monitor configuration mode with the exit command and specify the name of the exporter in the flow monitor:
NY-ASR1009-X(config)# flow monitor NY-ASR-FLOW-MON-1
NY-ASR1009-X(config-flow-monitor)# exporter NY-EXPORTER-1
You can use the show flow exporter command to view the configured options for the Flexible NetFlow exporter, as demonstrated here:
NY-ASR1009-X# show flow exporter
Flow Exporter NY-EXPORTER-1:
  Description:               exports to New York Collector
  Export protocol:           NetFlow Version 9
  Transport Configuration:
    Destination IP address:  10.10.10.123
    Source IP address:       209.165.200.225
    Transport Protocol:      UDP
    Destination Port:        9995
    Source Port:             55939
    DSCP:                    0x0
    TTL:                     255
    Output Features:         Used
You can use the show running-config flow exporter command to view the flow exporter configuration in the command-line interface (CLI):
NY-ASR1009-X# show running-config flow exporter
Current configuration:
!
flow exporter NY-EXPORTER-1
 description exports to New York Collector
 destination 10.10.10.123
You can use the show flow monitor name NY-ASR-FLOW-MON-1 cache format record command to display the status and flow data in the NetFlow cache for the flow monitor, as demonstrated here:
NY-ASR1009-X# show flow monitor name NY-ASR-FLOW-MON-1 cache
format record
  Cache type:                                   Normal (Platform cache)
  Cache size:                                   200000
  Current entries:                              4
  High Watermark:                               4
  Flows added:                                  132
  Flows aged:                                   42
    - Active timeout   (  3600 secs)            3
    - Inactive timeout (    15 secs)            94
    - Event aged                                0
    - Watermark aged                            0
    - Emergency aged                            0
IPV4 DESTINATION ADDRESS:  10.10.20.5
ipv4 source address:       10.10.10.42
trns source port:          25
trns destination port:     25
counter bytes:             34320
counter packets:           1112
IPV4 DESTINATION ADDRESS:  10.10.1.2
ipv4 source address:       10.10.10.2
trns source port:          20
trns destination port:     20
counter bytes:             3914221
counter packets:           5124
IPV4 DESTINATION ADDRESS:  10.10.10.200
ipv4 source address:       10.20.10.6
trns source port:          32
trns destination port:     3073
counter bytes:             82723
counter packets:           8232
Apply a Flow Monitor to an Interface
A flow monitor must be applied to at least one interface. To apply the flow monitor to an interface, use the ip flow monitor name input command in interface configuration mode, as demonstrated in Example 5-1.
Example 5-1 Applying a Flow Monitor to an Interface
NY-ASR1009-X(config)# interface  GigabitEthernet0/1/1
NY-ASR1009-X(config-if)# ip flow monitor NY-ASR-FLOW-MON-1 input
The flow monitor NY-ASR-FLOW-MON-1 is applied to interface GigabitEthernet0/1/1.
Example 5-2 shows the complete configuration.
Example 5-2 Flexible NetFlow Configuration
flow record NY-ASR-FLOW-RECORD-1
 description Used for basic traffic analysis
 match ipv4 destination address
 collect interface input
!
!
flow exporter NY-EXPORTER-1
 description exports to New York Collector
 destination 10.10.10.123
!
!
flow monitor NY-ASR-FLOW-MON-1
 description monitor for IPv4 traffic in NY
 record NY-ASR-FLOW-RECORD-1
 exporter NY-EXPORTER-1
 cache entries 200000
!
interface GigabitEthernet0/1/1
 ip address 209.165.200.233 255.255.255.248

 ip flow monitor NY-ASR-FLOW-MON-1 input
Flexible NetFlow IPFIX Export Format
You can also export Flexible NetFlow packets using the IPFIX export protocol. This feature is enabled with the export-protocol ipfix subcommand under the flow exporter. Example 5-3 shows how the Flexible NetFlow IPFIX Export Format feature is enabled in the flow exporter configured in the previous example.
Example 5-3 Flexible NetFlow Configuration
flow exporter NY-EXPORTER-1
 description exports to New York Collector
 destination 10.10.10.123
  export-protocol ipfix
Configuring NetFlow in NX-OS
The NetFlow configuration in the Cisco NX-OS software is very similar to the configuration in Cisco IOS and Cisco IOS-XE. The steps are the same:
Step 1. Define a flow record.
Step 2. Define a flow exporter.
Step 3. Define a flow monitor.
Step 4. Apply the flow monitor to an interface.
NetFlow CLI commands are not available until you enable the NetFlow feature with the feature netflow command.
Example 5-4 demonstrates how to define a flow record in Cisco NX-OS software.
Example 5-4 Defining a Flow Record in Cisco NX-OS
nx-os-sw1(config)# feature netflow
nx-os-sw1(config)# flow record myRecord
nx-os-sw1(config-flow-record)# description Custom-Flow-Record
nx-os-sw1(config-flow-record)# match ipv4 source address
nx-os-sw1(config-flow-record)# match ipv4 destination address
nx-os-sw1(config-flow-record)# match transport destination-port
nx-os-sw1(config-flow-record)# collect counter bytes
nx-os-sw1(config-flow-record)# collect counter packets
Example 5-5 demonstrates how to define a flow exporter in the Cisco NX-OS software.
Example 5-5 Defining a Flow Exporter in Cisco NX-OS software
nx-os-sw1(Config)# flow exporter myExporter
nx-os-sw1(Config-flow-exporter)# destination 192.168.11.2
nx-os-sw1(Config-flow-exporter)# source Ethernet2/2
nx-os-sw1(Config-flow-exporter)# version 9
Example 5-6 demonstrates how to define a flow monitor with a custom record in Cisco NX-OS software.
Example 5-6 Defining a Flow Monitor with a Custom Record in Cisco NX-OS software
nx-os-sw1(config)# flow monitor myMonitor
nx-os-sw1(config-flow-monitor)# description Applied Inbound on Ethernet 2/1
nx-os-sw1(config-flow-monitor)# record myRecord
nx-os-sw1(config-flow-monitor)# exporter myExporter
Example 5-7 demonstrates how to define a flow monitor with an original record in Cisco NX-OS software.
Example 5-7 Defining a Flow Monitor with an Original Record in Cisco NX-OS software
nx-os-sw1(config)# flow monitor myMonitor2
nx-os-sw1(config-Netflow-Monitor)# description monitor using predefined record
nx-os-sw1(config-Netflow-Monitor)# record netflow-original
nx-os-sw1(config-Netflow-Monitor)# exporter myExporter
Example 5-8 demonstrates how to adjust the NetFlow timers in Cisco NX-OS software.
Example 5-8 Adjusting the NetFlow Timers in Cisco NX-OS software
nx-os-sw1(config)# flow timeout active 120
nx-os-sw1(config)# flow timeout inactive 32
nx-os-sw1(config)# flow timeout fast 32 threshold 100
nx-os-sw1(config)# flow timeout session
nx-os-sw1(config)# flow timeout aggressive threshold 75
Example 5-9 demonstrates how to configure sampled NetFlow in Cisco NX-OS software.
Example 5-9 Configuring Sampled NetFlow in Cisco NX-OS software
nx-os-sw1(config)# sampler mySampler
nx-os-sw1(config-flow-sampler)# mode 1 out-of 1000
Example 5-10 demonstrates how to apply a NetFlow monitor and sampler to an interface in Cisco NX-OS software.
Example 5-10 Applying a NetFlow Monitor and Sampler
nx-os-sw1(config)# interface GigabitEthernet2/1
nx-os-sw1(config-if)# ip flow monitor myMonitor input sampler mySampler
Introduction to Network Segmentation
Network segmentation is the process of logically grouping network assets, resources, and applications. Segmentation provides the flexibility to implement a variety of services, authentication requirements, and security controls. Working from the inside out, network segments include the following types:
Enclave network: A segment of an internal network that requires a higher degree of protection. Internal accessibility is further restricted through the use of firewalls, VPNs, VLANs, and network access control (NAC) devices.
Trusted network (wired or wireless): The internal network that is accessible to authorized users. External accessibility is restricted through the use of firewalls, VPNs, and IDS/IPS devices. Internal accessibility may be restricted through the use of VLANs and NAC devices.
Semi-trusted network, perimeter network, or DMZ: A network that is designed to be Internet accessible. Hosts such as web servers and email gateways are generally located in the DMZ. Internal and external accessibility is restricted through the use of firewalls, VPNs, and IDS/IPS devices.
Guest network (wired or wireless): A network that is specifically designed for use by visitors to connect to the Internet. There is no access from the guest network to the internal trusted network.
Untrusted network: A network outside your security controls. The Internet is an untrusted network.
Data-Driven Segmentation
In the past, the consolidation and centralization of network infrastructure has been a key driver for segmentation. Previously isolated application infrastructures were migrated to common shared physical and virtual networks that require separation to maintain some level of isolation. Furthermore, numerous organizations host applications in the cloud (or multiple cloud providers) and use Software as a Service (SaaS) offerings. Because of this, network infrastructures have gone through a dramatic shift over the past few years with the introduction of network function virtualization, containers, and the Internet of Things (IoT) dilemma.
Numerous security professionals have used policy enforcement through Layer 2 technologies such as VLANs, virtual routing and forwarding (VRF), and virtual firewalls to provide network segmentation. You may ask yourself, if organizations have been already segmenting their network for many years, why do we still have so many data breaches where the root cause was “the lack of segmentation”? Before answering this question, let’s go over a few topics.
Traditionally, network architectures were built by placing the most important data in a well-guarded fortress (the data center). By doing this, you think that all your critical assets are protected by “the perimeter” and nothing can pass through your defenses if not explicitly allowed. What about insiders? What if an unauthorized entity is already inside your fortress? What if the unauthorized individual, malware, or bot has found a way to move your critical data out of your “perimeter”?
If you have limited segmentation and hundreds or thousands of users and applications, you may experience the “N×R” problem, where N is the number of user groups and R is the number of critical resources. In short, in most cases, every user group has access to pretty much every application in the organization. This concept is illustrated in Figure 5-52.
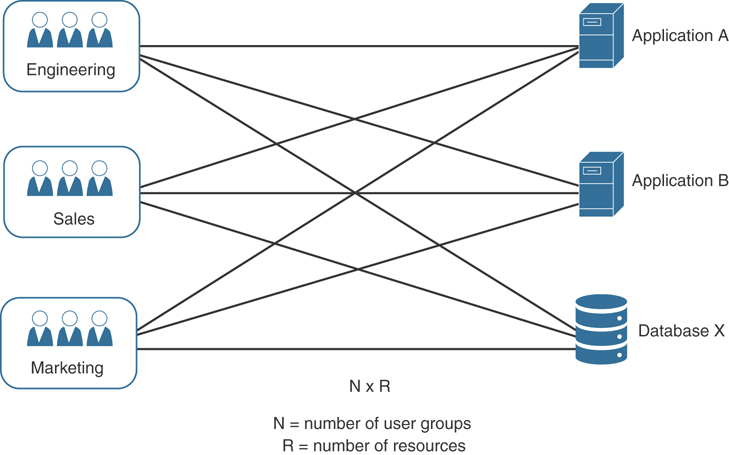
Figure 5-52 User Group to Resource (N×R) Relationship
This problem gets worse if access is provided at an individual user level without grouping users by a set of common characteristics. If you use the principle of least privilege, you can try to simplify this problem by explicitly allowing user groups to only access authorized resources they need to carry out their jobs. If you group the authorized user groups and related resources, the magnitude of this issue is reduced significantly. Figure 5-53 demonstrates a one-way segmentation policy allowing user groups to have appropriate access to the authorized resources.
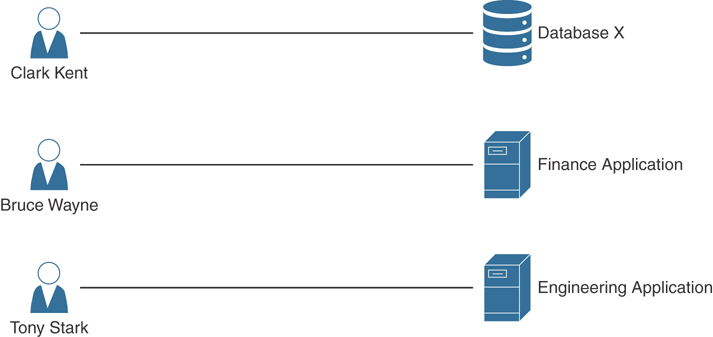
Figure 5-53 User Group to Resource (N+R) Relationship (one-way segmentation policy)
Traditionally, applications and services were simpler and not as diverse as they are nowadays. Only a few applications were used throughout an enterprise by a select group of users. These applications were hosted in a data center protected by a set of security and monitoring solutions. Nowadays, new applications are being created at a very fast pace, and those applications integrate with numerous others via APIs, streaming services, and so on. In addition, users are not confined to the physical perimeter of an office. Conventional data protection models are practically obsolete. Data itself could be stored anywhere from within your data center, the cloud (public, private, hybrid), or a business partner’s network.
Once-acceptable security measures such as segmenting the network, configuring VLANs, and deploying firewalls are no longer enough. Placing users and apps into VLANs and filtering traffic through access control lists achieves limited traffic separation. With network virtualization, cloud adoption, and the proliferation of devices, it is imperative to look at the entire context of the connection before allowing access to critical data. With cyber threats evolving, providing segmentation strictly at the network layer is not enough to ensure complete data protection.
Segmentation policies should be built based on data gathered about what users, applications, systems, and resources need to communicate. The segmentation policy should start at a high level, outlining the different zones within traditional network boundaries, such as the demilitarized zone (DMZ), data center, Internet edge, campus, then gradually drilling into each zone. This process should continue all the way to the application itself (more on this topic later in this chapter). Once all objects have been discovered, you should develop the segmentation policy based on the type and location of those objects and on the users who are requesting access to various resources hosting or containing data. Figure 5-54 illustrates this concept.

Figure 5-54 High-level segmentation policy
In Chapter 1, “Cybersecurity Fundamentals,” you learned that there are multiple access control models to choose from. The access control model used depends on the environment. Traditional network engineers are mostly familiar with network-based access control lists (ACLs). While they do provide a way to control access between the larger zones, they are difficult to be implemented in a very large environment and to be able to scale—mainly because they are mostly static and become difficult to manage over time. Many organizations nowadays are using a hybrid model, one that does not rely entirely on Open Systems Interconnection (OSI) Layer 3 and Layer 4 but also takes into consideration multiple access control models and that can provide application segmentation in a granular way.
Application-Based Segmentation
Another dilemma is the machine-to-machine communication between different systems and applications. How do you also segment and protect that in an effective manner?
In today’s virtualized and containerized environments, traffic between applications may never leave a physical device or server, as illustrated in Figure 5-55.
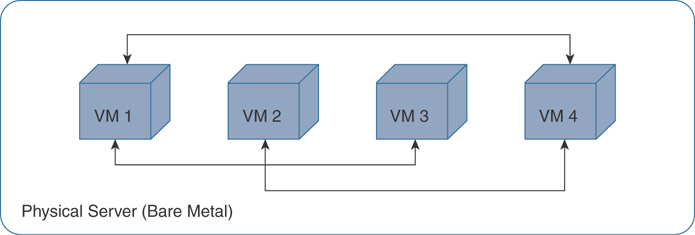
Figure 5-55 VM Traffic Never Leaving the Physical Server
This is why micro-segmentation is so popular nowadays. A solution of the past is to include virtual firewalls between VMs, as shown in Figure 5-56.
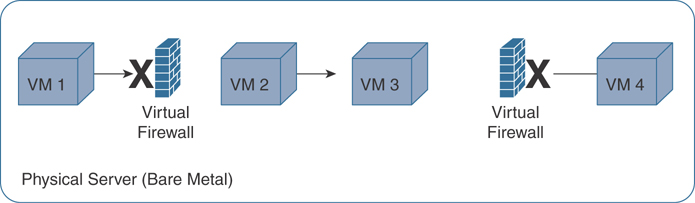
Figure 5-56 Virtual Firewalls for Segmentation
Machine-to-machine (or application-to-application) communication also needs to be segmented within an organization. For instance, let’s take a look at Figure 5-57. Do your Active Directory (AD) servers need to communicate to Network Time Protocol (NTP) servers? What is their relationship and data interaction?

Figure 5-57 Active Directory and NTP Communication
NTP implementations send and receive timestamps using UDP port 123. However, NTP servers can also use broadcasting or multicasting, where clients passively listen to time updates after an initial round-trip calibrating exchange. Which of the two need to be allowed or protected? Of course, this is a simple example, and in this case UDP port 123 can be used. However, what if an attacker can tunnel traffic over NTP and exfiltrate information from the organization? All these questions need to be answered when you are creating your segmentation strategy.
Furthermore, do you know what applications are running in your environment? What applications are talking to the cloud? Which are hosted in the cloud? How do you do application enumeration and mapping?
One of the most elegant solutions for micro-segmentations is the one provided by Cisco Application Centric Infrastructure (ACI).
Micro-Segmentation with Cisco ACI
Cisco ACI allows organizations to automatically assign endpoints to logical security zones called endpoint groups (EPGs). EPGs are used to group VMs within a tenant and apply filtering and forwarding policies to them. These EPGs are based on various network-based or VM-based attributes.
A micro-segment in ACI is also often referred to as a uSeg EPG. You can group endpoints in existing application EPGs into new micro-segment (uSeg) EPGs and configure network or VM-based attributes for those uSeg EPGs. With these uSeg EPGs, you can apply dynamic policies. You can also apply policies to any endpoints within the tenant. For instance, let’s say that you want to assign web servers to an EPG and then apply similar policies. By default, all endpoints within an EPG can communicate with each other. On the other hand, you can restrict access if this web EPG contains a mix of production and development web servers. To accomplish this, you can create a new EPG and automatically assign endpoints based on their VM name attribute, such as “prod-xxxx” or “dev-xxx.”
Micro-segmentation in Cisco ACI can be accomplished by integrating with vCenter or Microsoft System Center Virtual Machine Manager (SCVMM), Cisco ACI API (controller), and leaf switches.
Applying attributes to uSeg EPGs enables you to apply forwarding and security policies with greater granularity than you can to EPGs without attributes. Attributes are unique within the tenant.
You can apply uSeg EPGs using two types of attributes:
Network-based attributes: IP (IP address filter) and MAC (MAC Address Filter). You can apply one or more MAC or IP addresses to a uSeg EPG.
VM-based attributes: You can apply multiple VM-based attributes to a uSeg EPG. The VM-based attributes include Operating System Type, VMM Domain, Hypervisor Identifier, Datacenter, VM Identifier, VM Name, vNIC Domain Name, custom attributes, and tags.
Let’s take a look at the example illustrated in Figure 5-58.
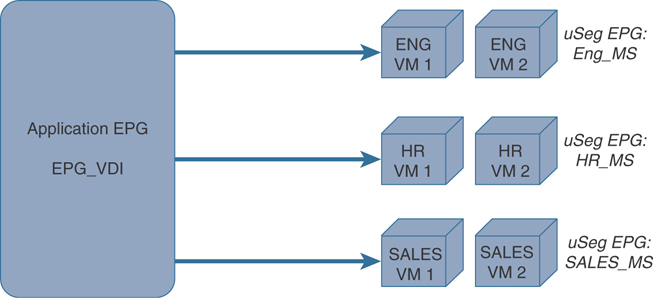
Figure 5-58 Micro-Segmentation with uSeg EPGs in Cisco ACI
In Figure 5-58, all Virtual Desktop Infrastructure (VDI) environments from the Engineering, Human Resources (HR), and Sales groups are moved to new uSeg EPGs (Eng_MS, HR_MS, and SALES_MS, respectively) to provide granular policies.
Segmentation with Cisco ISE
In Chapter 4, “Authentication, Authorization, Accounting (AAA) and Identity Management,” you learned about Cisco ISE, 802.1X, and the Cisco TrustSec solution. One of the benefits of these technologies is the ability to enforce granular policies and perform network segmentation. The first step when deploying Cisco ISE for segmentation is to know which assets need protecting. After that is accomplished, classification groups and mechanisms can be designed.
You typically create groups of assets, applications, and devices. These group names should be meaningful to the organization and to the protected asset (for instance, production servers belong to the “prod_servers” group, development servers belong to the “dev_servers” group, and so on). Subsequently, the security policy will reference these group names, so using meaningful names makes policy management very simple and straightforward.
You can perform classification in a static or dynamic way. For example, employees, guests, and contractors can be dynamically classified utilizing AAA services from Cisco ISE. If a supplicant is available on the clients, then 802.1X can be utilized, and if no supplicant is available, then MAC Authentication Bypass (MAB) or PassiveID/Easy Connect can be used. You can also configure Cisco ISE to display a web portal for guests to register and access the network (Web-Auth). Cisco ISE can use these methods to dynamically assign the users into the respective groups.
You can carry SGTs over VXLAN environments. If VXLAN is configured in your environment, the source SGT can be carried in every packet towards the enforcement point and enforced, as demonstrated in Figure 5-59. VXLAN is the protocol used when propagating the SGT across a Software-Defined Access (SDA) fabric, as shown in the following figure.

Figure 5-59 SGTs and VXLANs
The Scalable Group Tag Exchange Protocol (SXP)
The Scalable Group Tag Exchange Protocol (SXP) is a control plane protocol used to convey IP-to-SGT mappings to network devices when you cannot perform inline tagging. SXP provides capabilities to identify and classify IP packets to corresponding SGTs tracked in the mapping table within network devices. SPX uses peer-to-peer TCP connections over TCP port 64999. IP-to-SGT mappings are sent from the SXP speaker end of the connection to the SXP listener end. Cisco ISE supports both the SXP speaker and listener functionality. You can simplify propagation in your design by using Cisco ISE as an SXP speaker.
Cisco ISE learns the IP address of the user’s system when they authenticate onto the network. Then Cisco ISE assigns an SGT via the authorization table. Cisco ISE is the first platform in the network that learns of the IP-to-SGT mapping for dynamically authenticated endpoints. When Cisco ISE is configured for SXP and there is an SXP connection provisioned from ISE to the enforcement point, then the IP-to-SGT mappings for the users will be directly sent to the enforcement point, negating the need for inline tagging or multiple SXP connections from different zones in your network (campus, DMZ, data center, and so on).
The method of sending out IP-to-SGT mappings from ISE is particularly useful if the access switch does not support TrustSec. This process works with any vendor switch or wireless AP that is able to create and teardown sessions on Cisco ISE using RADIUS Authentication and Accounting.
Cisco ISE is a critical component to a segmentation design for many organizations. Cisco ISE interacts with network infrastructure devices and transfers SGTs, IP-to-SGT mapping propagation, policy enforcement, and SGACL download.
Even though all services can be enabled within a single instance, it is recommended to separate the services for increased scale and performance.
Figure 5-60 illustrates a distributed architecture, although for high availability, a PAN, three PSNs, a Monitoring and Troubleshooting (MnT) node, and an optional pxGrid node are deployed.

Figure 5-60 Cisco ISE Distributed Deployment for Network Segmentation
During the assignment of scalable groups in Cisco ISE deployments, most administrators initially think about user groups or server groups. On the other hand, you should also think about “network-device-to-network-device” and “network-device-to-network-services” communications. For instance, network-device-to-network-device communications include things like routing protocols (for example, EIGRP, OSPF, BGP), Cisco Discovery Protocol (CDP), Link Aggregation Control Protocol (LACP), and Link Layer Discovery Protocol (LLDP). Network-device-to-network-services communications include things like DHCP, DNS, RADIUS, SYSLOG, and SNMP. Cisco ISE provides an SGT for these types of communications and assigns it to network devices themselves. By default, this is SGT number 2 (SGT 2) and is named TrustSec_Devices. The recommended way to assign the TrustSec_Devices SGT to network devices is by deploying it within the environment-data download when the network device authenticates with Cisco ISE.
After the PAN and PSN nodes are installed and network devices are configured to send authentication to the PSN (or Cisco DNA Center in DNA-based deployments), the identity and location of the users are learned. MAC Authentication Bypass (MAB) or PassiveID can be used if devices do not support 802.1X. In addition, guest users can connect to the network using a configured captive portal and web authentication (WebAuth).
Cisco ISE can determine the type of device or endpoint connecting to the network by performing “profiling.” Profiling is done by using DHCP, SNMP, Span, NetFlow, HTTP, RADIUS, DNS, or NMAP scans to collect as much metadata as possible to learn the device fingerprint. The metadata or attributes collected are used to automate the categorization or “classification” of the device and to enforce appropriate access control policies.
SGT Assignment and Deployment
When SGTs are provisioned by Cisco ISE, they are downloaded to network devices within the environment data. Here are a few things to remember about classification and SGT provisioning:
Typically, servers are classified into groups using static classification.
IP- and Subnet-to-SGT mappings can be centrally managed from Cisco ISE and deployed to networking devices using SSH or SXP.
Additional static classification configurations can also be provisioned via CLI on the network devices.
Dynamic classification is typically used for user, endpoint, or guest authentications by using 802.1X, MAB, WebAuth, or PassiveID, or they can also be learned from a Cisco ACI APIC (in the case of a Cisco ACI deployment).
The network access switch or wireless AP needs to have AAA, RADIUS, and interface configuration deployed. In addition, Cisco ISE needs to have the network devices and authentication and authorization rules added. Within SDA, the total switch configuration is orchestrated by Cisco DNA Center, as are the network devices in ISE.
Initially Deploying 802.1X and/or TrustSec in Monitor Mode
Many organizations initially deploy 802.1X in monitor mode to scope the deployment and prevent user productivity from being impacted while changes are being implemented. This is because 802.1X Monitor Mode allows network connectivity even if authentication fails. Users will still be able to log in to the network in the case of any deployment problems, and the administrators will be able to gain visibility into any misconfigurations or connectivity challenges.
You can configure the Cisco ISE with the “log” keyword in each “permit statement” (policies allowing IP traffic) in order to obtain visibility of the deployment and user behavior. The “log” keyword on an access control entry generates a syslog message when the entry is matched. Policies will only be enforced if the cts role-based enforcement configuration command is applied to network devices (Cisco DNA Center controls this configuration within an SDA fabric). The cts role-based enforcement command can be used to enable enforcement on Layer 3 interfaces, and the cts role-based enforcement vlan-list vlan id command can be used to enable enforcement on Layer 2 interfaces.
Active Policy Enforcement
After you learn and tweak your configuration by deploying 802.1X and TrustSec in monitoring mode, the policies can be provisioned and enforced. Once you configure your deployment in “enforcement mode,” if there are IP-to-SGT mappings, then the associated policy protecting those SGTs will be downloaded from ISE. If you have an SDA deployment, contracts and policies are added in Cisco DNA Center and pushed to Cisco ISE via the Cisco ISE API.
To start the deployment of TrustSec and segmentation policies in Cisco ISE, you can navigate to Work Centers > TrustSec > Overview, as shown in Figure 5-61.
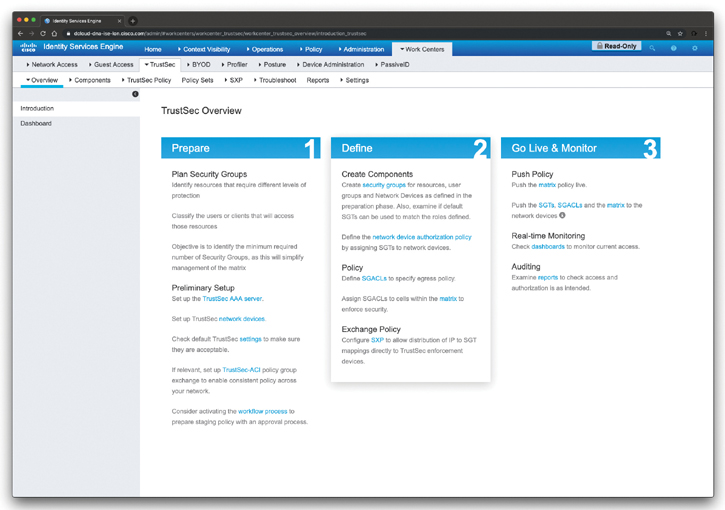
Figure 5-61 Cisco ISE TrustSec Overview
The screen shown in Figure 5-61 provides an overview of the TrustSec configuration and deployment steps in Cisco ISE.
Figure 5-62 shows the Cisco ISE TrustSec dashboard.
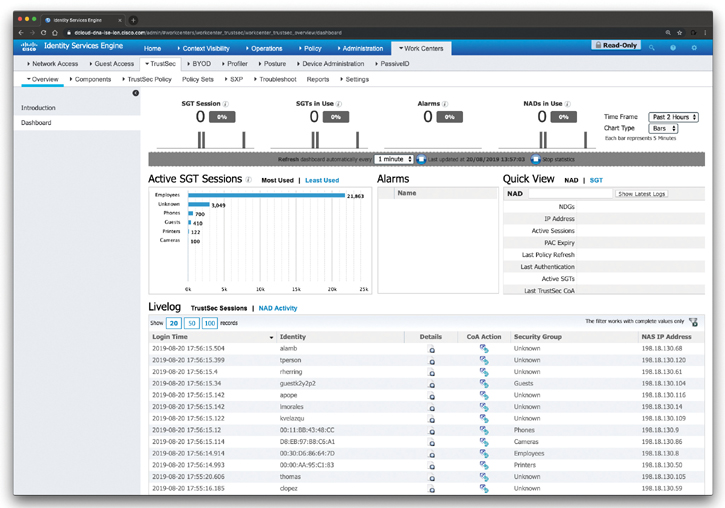
Figure 5-62 Cisco ISE TrustSec Dashboard
The Cisco ISE TrustSec dashboard is a centralized monitoring tool for the TrustSec deployment. The Cisco ISE TrustSec dashboard contains the following information:
General Metrics
Active SGT Sessions
Alarms
NAD / SGT Quick View
TrustSec Sessions / Live Log
Figure 5-63 shows information about the different TrustSec components and security groups configured in Cisco ISE.

Figure 5-63 Cisco ISE TrustSec Components and Security Groups
To view the configured policies in Cisco ISE, navigate to Work Centers > TrustSec > Policy Sets, as shown in Figure 5-64.

Figure 5-64 Cisco ISE TrustSec Policy Sets
You learned that the Source Group Tag (SGT) Exchange Protocol (SXP) is used to propagate the SGTs across network devices that do not have hardware support for TrustSec. SXP is used to transport an endpoint’s SGT, along with the IP address, from one SGT-aware network device to another. The data that SXP transports is called an IP-SGT mapping. The SGT to which an endpoint belongs can be assigned statically or dynamically, and the SGT can be used as a classifier in network policies. SXP uses TCP as its transport protocol to set up an SXP connection between two separate network devices. Each SXP connection has one peer designated as the SXP speaker and the other peer as the SXP listener. The peers can also be configured in a bidirectional mode, where each of them acts as both speaker and listener. Connections can be initiated by either peer, but mapping information is always propagated from a speaker to a listener. To configure SPX in Cisco ISE, navigate to Work Centers > TrustSec > SPX.
To view the TrustSec Policy Production Matrix, navigate to Work Centers > TrustSec > TrustSec Policy > Egress Policy > Matrix, as shown in Figure 5-65.
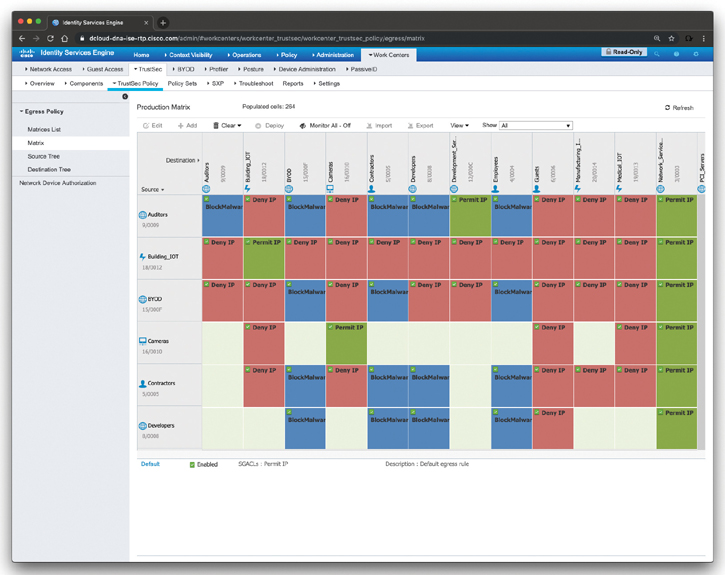
Figure 5-65 Cisco ISE TrustSec Production Policy Matrix
The screen shown in Figure 5-65 displays source-scalable groups down the left-hand side and destination-scalable groups across the top. In the intersection of the rows and columns, you find the actual enforcement instructions, otherwise known as Scalable Group Access Control Lists (SGACLs), and also known as contracts within Cisco DNA Center.
Cisco ISE TrustSec and Cisco ACI Integration
Although the SCOR exam does not cover ACI configuration or integration, this section is for your reference and to demonstrate how Cisco ISE allows you to synchronize SGTs and SXP mappings with the Internal Endpoint Groups (IEPGs), External Endpoint Groups (EEPGs), and endpoint (EP) configuration of Cisco ACI.
Cisco ISE supports packets coming from the ACI domain to the TrustSec domain by synchronizing the IEPGs and creating correlating read-only SGTs in ISE. These SGTs are used to map the endpoints configured in ACI and create correlating SXP mappings in ISE. These SGTs are displayed on the Security Groups page (with the value “ACI” in the Learned From field). You can view the SXP mappings on the All SXP Mappings page. These mappings are propagated to ACI only if the SXP device belongs to an SXP domain that is selected in the ACI Settings page. You can select the SGTs that are propagated to ACI. While adding a security group, you can specify whether the SGT should be propagated to ACI or not by using the Propagate to ACI option. When this option is enabled, the SXP mappings that are related to this SGT are propagated to ACI if the SXP device belongs to a VPN that is selected in the ACI Settings page.
You must enable the SXP service to use the ACI integration feature. ACI supports the packets coming from the TrustSec domain to the ACI domain by synchronizing the SGTs and creating correlating EEPGs. ACI creates subnets under EEPG based on the SXP mappings that are propagated from Cisco ISE. These subnets are not deleted from ACI, when the corresponding SXP mappings are deleted in Cisco ISE.
When an IEPG is updated in ACI, the corresponding SGT configuration is updated in Cisco ISE. A new EEPG is created in ACI when an SGT is added in Cisco ISE. When an SGT is deleted, the corresponding EEPG will be deleted in ACI. When an endpoint is updated in ACI, the corresponding SXP mapping is updated in Cisco ISE. If the connection with the ACI server is lost, Cisco ISE resynchronizes the data again when the connection is reestablished.
To integrate Cisco ISE with Cisco ACI, you must first import the Cisco ACI certificate into the Trusted Certificates Store under Administration > System > Certificates > Trusted Certificates > Import. Then you navigate to Work Centers > TrustSec > Settings > ACI Settings, as shown in Figure 5-66.
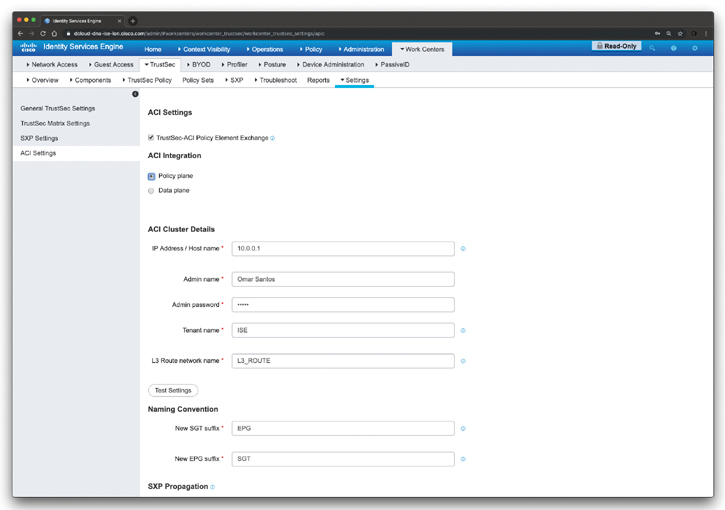
Figure 5-66 Integration of Cisco ISE TrustSec and Cisco ACI
After navigating to the screen shown in Figure 5-66, check the TrustSec-ACI Policy Element Exchange check box to synchronize SGTs and SXP mappings with IEPGs, EEPGs, and endpoint configuration of ACI. You can select Policy Plane if you want Cisco ISE to interact only with APIC data center to interchange SGT, EPG, and SXP information. Alternatively, if you select the Data Plane option, in addition to SGT, EPG, and SXP information, additional information is provided to the ASR devices that are connected between the TrustSec network and the APIC-controlled network. These ASR devices must contain the translation tables for SGT-to-EPG and EPG-to-SGT conversion.
Enter the following details if you have selected the Policy Plane option:
IP address/hostname
Admin name/password
The name of the tenant that is configured on the ACI
The name of the Layer 3 route network that is configured on the ACI for synchronizing the policy elements
The new SGT suffix that will be added to the SGTs that are newly created based on the EPGs learned from ACI
The new EPG suffix that will be added to the EPGs that are newly created in ACI based on the SGTs learned from Cisco ISE.
Enter the following details if you have selected the Data Plane option:
The IP address or hostname of the ACI server. You can enter three IP addresses or host names separated by commas.
The username and password of the ACI admin user.
The name of the tenant that is configured on the ACI.
The maximum number of IEPGs that will be converted to SGTs. IEPGs are converted in alphabetical order. The default value is 1000.
The maximum number of SGTs that will be converted to IEPGs. SGTs are converted in alphabetical order. The default value is 500.
The new SGT suffix that will be added to the SGTs that are newly created based on the EPGs learned from ACI.
The new EPG suffix that will be added to the EPGs that are newly created in ACI based on the SGTs learned from Cisco ISE.
Check the Propagate using SXP check box if you want to propagate the mappings to ACI using SXP.
Exam Preparation Tasks
As mentioned in the section “How to Use This Book” in the Introduction, you have a couple of choices for exam preparation: the exercises here, Chapter 12, “Final Preparation,” and the exam simulation questions in the Pearson Test Prep Software Online.
Review All Key Topics
Review the most important topics in this chapter, noted with the Key Topic icon in the outer margin of the page. Table 5-3 lists these key topics and the page numbers on which each is found.
Table 5-3 Key Topics for Chapter 5
Key Topic Element |
Description |
Page Number |
Section |
What Is a Flow? |
|
Section |
NetFlow for Network Security and Visibility |
|
List |
Listing and recognizing the methodology on security incident handling created by NIST that has been adopted by many organizations, including service providers, enterprises, and government organizations |
|
Tip |
Understanding how Cisco Stealthwatch FlowSensor can be deployed to a SPAN or network TAP |
|
List |
Describing the network telemetry sources that can also be correlated with NetFlow while responding to security incidents and performing network forensics |
|
Paragraph |
Describing the importance of time synchronization for network telemetry |
|
Section |
IP Flow Information Export (IPFIX) |
|
Section |
IPFIX Templates |
|
Section |
Understanding the Stream Control Transmission Protocol (SCTP) |
|
Section |
Exploring Application Visibility and Control and NetFlow |
|
Section |
NetFlow Deployment Scenarios |
|
Section |
Cisco Stealthwatch |
|
Section |
Threat Hunting with Cisco Stealthwatch |
|
Section |
What Is Cisco ETA? |
|
Section |
What Is Cisco Cognitive Threat Analytics? |
|
Section |
NetFlow Collection Considerations and Best Practices |
|
Section |
Configuring NetFlow in Cisco IOS and Cisco IOS-XE |
|
Section |
Data-Driven Segmentation |
|
Section |
Application-Based Segmentation |
|
Section |
Micro-Segmentation with Cisco ACI |
|
Section |
Segmentation with Cisco ISE |
Define Key Terms
Define the following key terms from this chapter and check your answers in the glossary:
Stream Control Transmission Protocol (SCTP)
Review Questions
The answers to these questions appear in Appendix A. For more practice with exam format questions, use the Pearson Test Prep Software Online.
1. You have been asked to provide a segmentation strategy for applications residing in Docker containers and in virtual machines in a large data center. Which of the following technologies will you choose for such deployment?
Cisco ETA
Cisco ACI
VLANs and firewalls
None of these answers is correct.
2. When you first deploy a Cisco ISE node, all the default services provided by the Administration, Policy Service, and Monitoring personas will be enabled. Which of the following statements is not true?
The Cisco ISE node will be in a standalone mode.
You must first configure a primary ISE node and then register secondary ISE nodes to the primary ISE node.
You must first configure the secondary ISE node and then the primary ISE node to avoid network disruption.
You cannot edit the personas or services of a standalone Cisco ISE node.
3. When SGTs are provisioned by Cisco ISE, they are downloaded to network devices within the environment data. Which of the following are things to take into consideration about classification and SGT provisioning?
Typically, servers are classified into groups using static classification.
IP and Subnet-to-SGT mappings can be centrally managed from Cisco ISE and deployed to networking devices using SSH or SXP.
Dynamic classification is typically used for user, endpoint, or guest authentications by using 802.1X, MAB, WebAuth, or PassiveID, or they can also be learned from a Cisco ACI APIC (in the case of a Cisco ACI deployment).
All of the options are correct.
4. Many organizations initially deploy 802.1X in ________ mode to scope the deployment and prevent user productivity from being impacted while changes are being implemented.
monitor
active
standby
high-availability
5. Depending on the version of NetFlow, the router can also gather additional information, such as which of the following?
Type of service (ToS) byte
Differentiated services code point (DSCP)
The device’s input interface
TCP flags
All of the options are correct.
6. Which of the following statements is not true?
The Cisco Stealthwatch FlowSensor is a network appliance that functions similarly to a traditional packet capture appliance or IDS in that it connects into a Switch Port Analyzer (SPAN), mirror port, or a Test Access Port (TAP).
The Cisco Stealthwatch FlowSensor augments visibility where NetFlow is not available in the infrastructure device (router, switch, and so on) or where NetFlow is available but you want deeper visibility into performance metrics and packet data.
You typically configure the Cisco Stealthwatch FlowSensor in combination with a Cisco Stealthwatch FlowCollector.
A Cisco Stealthwatch FlowSensor replaces a Cisco Stealthwatch FlowCollector in several deployment models.
7. Which of the following network telemetry sources can also be correlated with NetFlow while responding to security incidents and performing network forensics?
Syslog
802.1X authentication logs
VPN logs
All of these options are correct.
8. Which of the following NetFlow versions support templates? (Select all that apply.)
Flexible NetFlow
NetFlow v2
NetFlow v9
NetFlow v5
NetFlow v8
9. IPFIX uses which of the following protocols to provide a packet transport service designed to support several features beyond TCP or UDP capabilities?
SCP
SCTP
pxGrid
EPG
10. Cisco Stealthwatch components can be deployed as physical or virtual appliances. The two minimum required components are ___________.
SMC and FlowSensor
SMC and FlowCollector
FlowSensor and FlowCollector
None of these options is correct.