
Chapter 25
Network Software Tools and Commands
Specialized tasks require specialized tools, and installing network components is no exception. We use some of these tools, such as network scanners, on an everyday basis, but most of the software tools I'll be covering in this chapter are used mainly in the telecommunications industry.
Still, in order to meet the CompTIA Network+ objectives and also because you're likely to run across them in today's networking environments, it's very important that you're familiar with them.
Software Tools
To effectively test and troubleshoot networks, it is important to be aware of and know how to operate the many different types of tools available for you to use. We will start the chapter by going over many of the software applications designed for network testing and troubleshooting. Knowledge of how to use these tools allows you to locate, troubleshoot, and resolve any networking issues you may come across.
Wi-Fi Analyzers
When deploying and troubleshooting wireless networks, you must have some way to determine signal levers, noise readings, SSIDs, and interference to resolve most Wi-Fi related issues. Wi-Fi analyzers can look into the air and gather valuable information so you can see what is healthy and what is not. Using Wi-Fi analyzers, you can see the Wi-Fi coverage in an area and use that information for optimal access-point placement to get complete coverage and avoid dead spots.
Many vendors now have Wi-Fi analyzers built into access points and client software running on your laptop. Wireless controllers that manage multiple access points can also act as an analyzer and gather data from many access points in your network to give you a consolidated view of coverage, interference, and signal reception levels.
Protocol Analyzer/Packet Capture
Protocol analyzers, also called sniffers or network monitors, are used to capture packets in their raw format as they cross the network. Windows desktop operating systems before Windows Vista came with a built-in protocol analyzer called Network Monitor, but that is no longer the case, although you can download one for free that will work with the newer operating systems.
The Network Monitor tool that comes with these operating systems will capture only packets that are sourced from or destined to the computer on which the tool is running. Commercial sniffers like Wireshark and Omnipeek can capture any packets because they set the NIC to operate in promiscuous mode, which means the NIC processes all packets that it sees.
Protocol analyzers can be used to determine the type of traffic that you have in your network, and depending on the product and the bells and whistles contained therein, you may be able to sort the results based on port numbers, protocols, and so on. Another use of a sniffer is to examine the traffic that should be occurring on the network when something is not working to aid in troubleshooting. These devices can capture and display all packets involved in the connection setup, including, for example, request and response headers to a web server.
Let's review the series of four packet types that must occur for a DHCP client to receive an IP configuration from the server. As a review, those packets are as follows:
- DHCP Discover
- DHCP Offer
- DHCP Request
- DHCP ACK
If you turned on the analyzer and then executed the ipconfig/release and ipconfig/renew commands on the client (more on those commands later in this chapter), you should see these four packets in the analyzer's capture file. The packets would be interspersed with the hundreds and perhaps thousands of other packet types that would be captured, but by using the display filtering options in the software, you can easily segregate out the DHCP traffic. An example of the DHCP process, as seen in a capture, is shown in Figure 25.1.
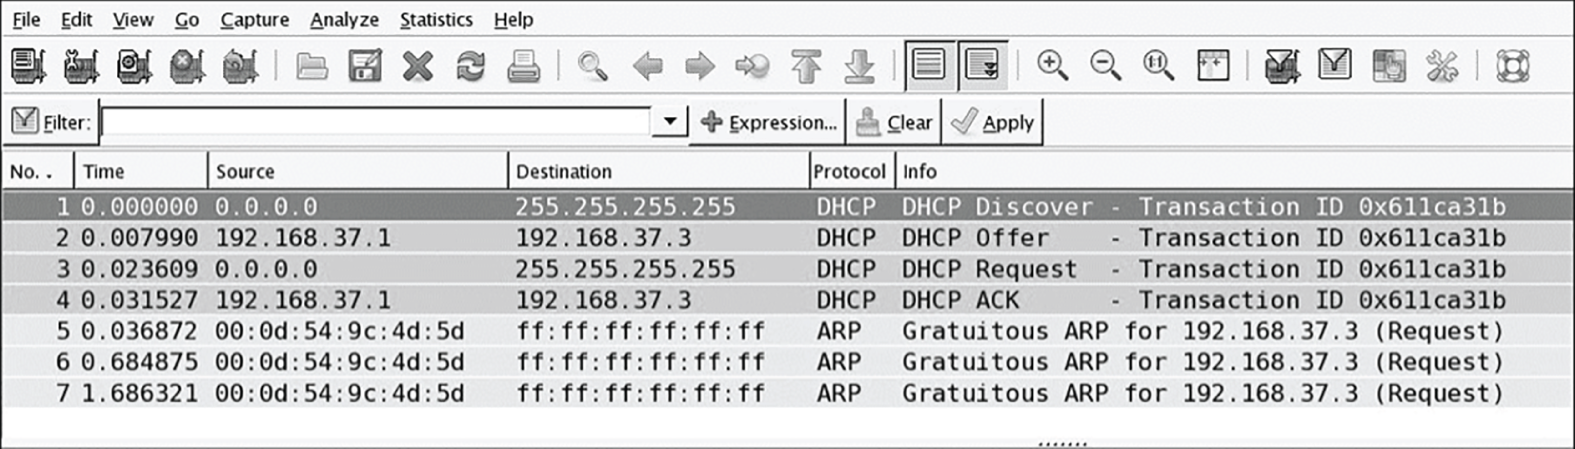
FIGURE 25.1 DHCP capture
If all you saw in the capture were the DHCP Discover packets with no DHCP Offer packets, you could reasonably assert that the DHCP server is not receiving the DHCP Offer packets (perhaps the DHCP server is located in another broadcast domain or perhaps it is not on). Additionally, you could examine fields in the DHCP Offer packets that may tell you that the DHCP server is out of addresses. The point is that the tool can be used to troubleshoot the issue.
Bandwidth Speed Testers
Users of a network often complain about the speed of the network. Network “speed” is in some ways a personal perception because some people have more patience than others. To determine when a network slowdown is real as opposed to perceived, you need to actually measure the throughput. That's what throughput testers are used for.
These devices, typically software based, work much like a protocol analyzer in that they measure the traffic seen on the network and can also classify the types of traffic that are eating up your bandwidth (which is probably what you really need to know). Figure 25.2 shows one version of this software by TamoSoft.
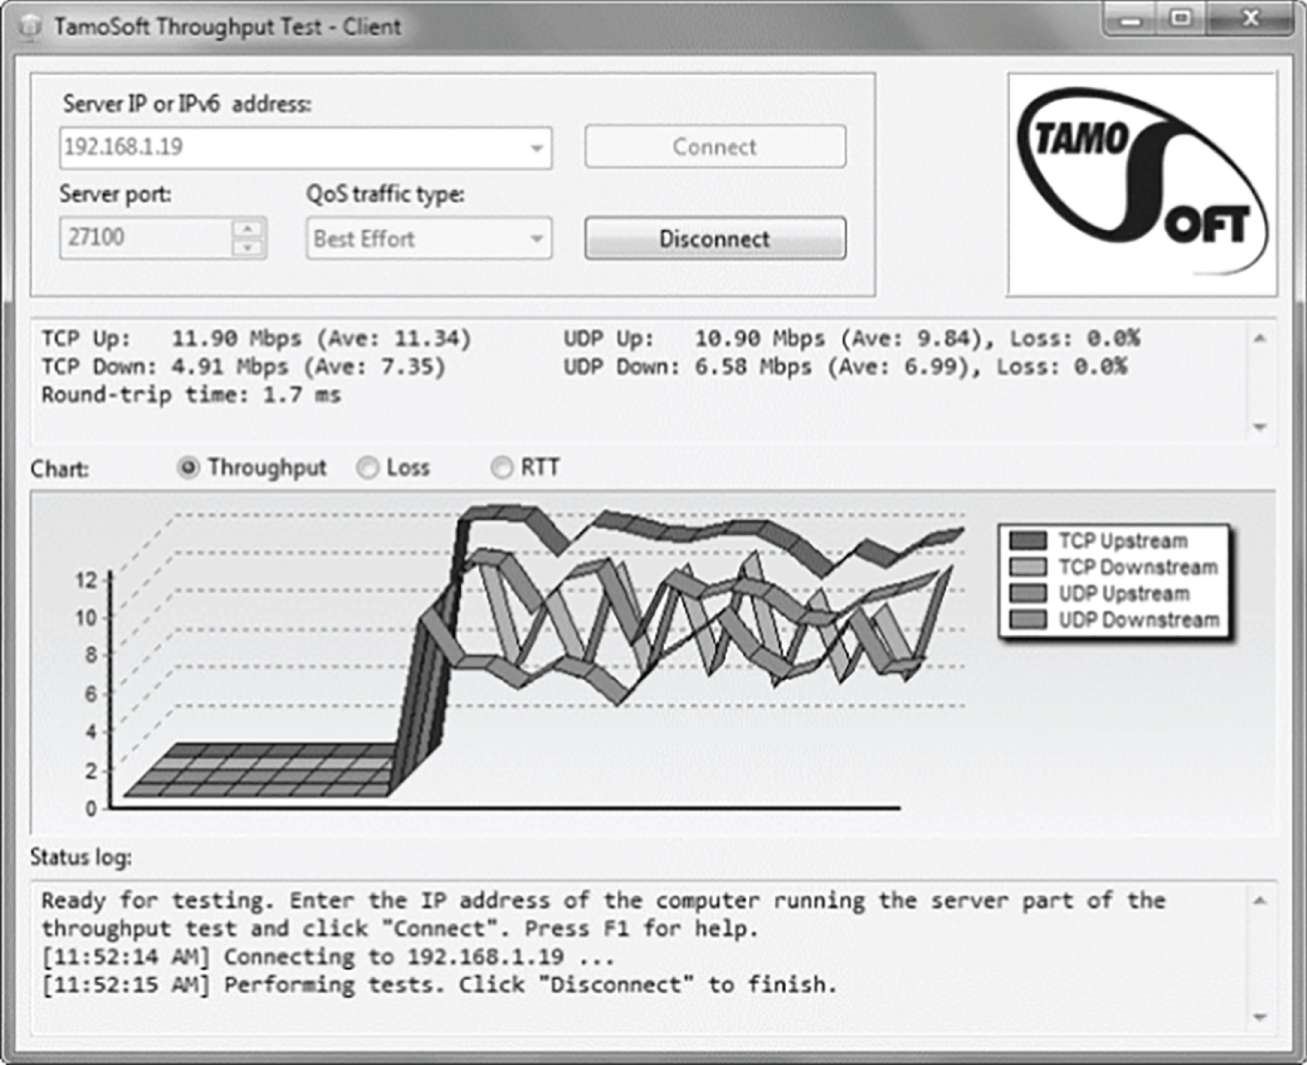
FIGURE 25.2 Throughput
This software is installed on a server and also on a client. In the figure, the software is measuring traffic between the client and a server. It shows the throughput for traffic in real time and in this shot is breaking that traffic up by unicast (TCP) and broadcast (UDP) types and by direction.
Earlier in this book, I discussed the importance of baselines, and this is another area where they are important. Network throughput figures mean little without a baseline with which comparisons can be made. How do you know what is abnormal when you don't know what normal is? Baselines should be taken when the network is operating well, but they should also be taken when the traffic load is normal.
IPerf is an open-source software tool that measures network throughput and is very handy for testing and creating baselines of your network. The software runs as a server on one end and a client on the other.
IPerf can run on both Linux and Windows operating systems. It is highly customizable, allowing you to specify if you want to use TCP or UDP and also the port numbers and packet size to use.
After the test is run, reports are generated that give you throughput, the parameters used, and a timestamp.
Port Scanners
A port scanner is a software tool designed to search a host for open ports. Those of us administering our networks use port scanners to ensure their security, but bad guys use them to find a network's vulnerabilities and compromise them. To port scan means to scan for TCP and UDP open ports on a single target host either to legitimately connect to and use its services for business and/or personal reasons or to find and connect to those ports and subsequently attack the host and steal or manipulate it for nefarious reasons.
In contrast, port sweeping means scanning multiple hosts on a network for a specific listening TCP or UDP port, like SQL. (SQL injection attacks are super common today.) This just happens to be a favorite approach used by hackers when trying to invade your network. They port sweep in a broad manner, and then, if they find something—in this case, SQL—they can port scan the particular host they've discovered with the desired service available to exploit and get what they're after. This is why it's a really good idea to turn off any unused services on your servers and routers and to run only the minimum services required on every host machine in your network. Do yourself a big favor and make sure this is in your security policy.
NetFlow Analyzers
The NetFlow protocol allows for the viewing and analysis of application-level traffic across an interface. NetFlow is a step above SNMP in that it looks at the actual conversations taking place on your network and, based on that information, allows you to gain deep visibility of what traffic is moving across your network.
NetFlow collects information on each unique traffic flow into and out of a network device interfaces. NetFlow collects source and destination addresses, application information, and quality of service (QoS) data and is very helpful in troubleshooting causes of networking problems.
A flow exporter is a network device such as a router that monitors traffic flowing in and out of an interface and exports not the complete packet but a summary of its contents to a flow collector. A flow collector is a server on the network that receives the flows from multiple exporters and consolidates the NetFlow data in a centralized storage location.
A NetFlow application then analyzes the data and creates reports, charts, graphs, and sometimes analytics on the received information.
Trivial File Transfer Protocol (TFTP) Server
When the time comes to upgrade the software on a piece of networking equipment such as a switch or router, the code is downloaded from the vendor site to your laptop or a management server. Then steps are taken to transfer the code to the actual device. One of the most common methods is to use the Trivial File Transfer Protocol (TFTP) as it is supported by all vendors.
A TFTP server is a small application that is available from a wide variety of developers as freeware for Windows and Linux computers. All that is needed is to run the TFTP server on your local machine and point its source directory to the location of the file to upload. Then from the network device, specify the IP address of the TFTP server and the name of the file you want to upload. TFTP is designed to be a simple, effective, and fast method to upload code to a network device.
Connectivity Software
There are times when you need to make a remote connection to a machine to perform troubleshooting but you are miles away. Connectivity software is designed to allow you to make a connection to the machine, see the desktop, and perform any action you could perform if you were sitting in front of it.
Microsoft has made what it calls Remote Desktop software available for free with Windows products since Windows NT. When this software is installed (by default in later versions) on both source and destination computers, a remote desktop connection can be made.
Commercial tools are also available that (of course) claim to have more functionality, and they probably do have a few extra bells and whistles. These include LogMeIn.com, GoToMyPC, and others. Figure 25.3 shows the window for a LogMeIn.com session.
The advantages of these connectivity tools are obvious. With these tools, you can do anything you need to on the machine as long as you can connect. They also allow you to see what a user is actually doing when they encounter a problem rather than having to rely on what they tell you they are doing. You can even show a user what they are doing wrong. Most of these tools allow for chat sessions and for either end of the connection to take control of the machine. You can also transfer files to them if required (maybe a DLL got deleted, for example).

FIGURE 25.3 LogMeIn session window
For networking, it is common to access the device’s command-line interface remotely. This will require you to use terminal emulation software. Today the Telnet protocol is rarely used because it has no security and all data is sent unencrypted. Secure Shell (SSH) is the preferred method of accessing a remote device command line from across a network. There are many free and commercial terminal emulation packages for you to use. The most common open-source emulator is PuTTY, and it supports Telnet, SSH, and serial interfaces. PuTTY is widely used and found in almost every networking shop. As for commercial packages, SecureCRT is popular and has an extensive feature set.
IP Scanner
It is often very helpful to know what is running on a server or networking device. Scanners can tell you what IP addresses are active and what they are “listening for.” All IP applications have an associated port number that is open for incoming connections, such as port 80 for HTTP and 443 for HTTPS. An IP scanner can be run on your local computer and will scan for open ports on each IP host. However, be very careful doing this on live production networks because security appliances such as Intrusion and firewall systems may generate an alarm when they detect scans as it may be an indication of fingerprinting your network by hackers.
Scanners can be used for network mapping by listing all of the active IP addresses in each subnet and what applications are running on them. There are many commercial and open-source scanners available on the market. Many have advanced features such as listing bugs and vulnerabilities of a scanned device and providing information on remediation.
Using traceroute
Most of us are running Transmission Control Protocol/Internet Protocol (TCP/IP) version 4 on our networks these days, so we absolutely need a way to test IP connectivity. But we also need to be able to test and verify IPv6 networks. The reason for this is that even though Microsoft makes the majority of client platforms, a lot of the commands used to test IP connectivity are really platform independent, and most of the platforms can now use both IPv4 and IPv6. Even so, keep in mind that the Network+ exam focuses on the basic concepts of the function and use of the TCP/IP utilities that come with Windows.
You can use several utilities, both command line and GUI, to verify TCP/IP function on Windows workstations, and most of them are listed in the chapter objectives. Here's a list of all the utilities I'm going to discuss:
Traceroute(tracertin Microsoft)ipconfig(ifconfigin Linux/Unix)pingarpnslookup(digin Linux/Unix)Resolving NamesMtr(pathping)- Nmap
routenbtstatnetstattcpdumpftptelnet
And by the way, it's very important that you don't just blow through the output that I've supplied for each command. Instead, pay serious attention to it because to meet the Network+ objectives, you'll be required to correctly identify each command's output.
So, let's cut right to the chase and take a look at some of these commands and their output. Oh, and do try and have fun with it!
For starters, let's pose these questions: Where do all those packets really go when we send them over the Internet? And, how do all the packets actually get to their destinations? Well, we can use the TCP/IP traceroute (tracert with Windows) command-line utility to help us answer both questions because its output will show us every router interface a TCP/IP packet passes through on the way to its destination.
Traceroute (trace for short) displays the path a packet takes to get to a remote device in all its glory by using something we call IP packet time to live (TTL) time-outs and Internet Control Message Protocol (ICMP) error messages. And it's also a handy tool for troubleshooting an internetwork because we can use it to figure out which router along a path through that internetwork happens to be causing a network failure when a certain destination machine or network is, or suddenly becomes, unreachable.
To use tracert, at a Windows command prompt, type tracert, a space, and the Domain Name Service (DNS) name or IP address of the host machine to which you want to find the route. The tracert utility will respond with a list of all the DNS names and IP addresses of the routers that the packet is passing through on its way. Plus, tracert uses TTL to indicate the time it takes for each attempt.
Following is the tracert output from my workstation in Boulder, Colorado, to my Lammle.com server in Dallas, Texas:
C:Users lammle>tracert www.lammle.comTracing route to lammle.com [206.123.114.186]over a maximum of 30 hops:1 1 ms <1 ms <1 ms dslmodem.domain.actdsltmp [192.168.0.1]2 53 ms 52 ms 52 ms hlrn-dsl-gw36-228.hlrn.qwest.net[207.225.112.228]3 52 ms 53 ms 52 ms hlrn-agw1.inet.qwest.net [71.217.189.25]4 75 ms 75 ms 74 ms dal-core-01.inet.qwest.net [67.14.2.53]5 76 ms 76 ms 76 ms dap-brdr-01.inet.qwest.net [205.171.225.49]6 76 ms 76 ms 76 ms 205.171.1.1107 75 ms 76 ms 106 ms xe-0-0-0.er2.dfw2.us.above.net [64.125.26.206]8 76 ms 76 ms 76 ms 209.249.122.74.available.above.net[209.249.122.74]9 76 ms 76 ms 76 ms 65.99.248.25010 76 ms 76 ms 76 ms pageuppro.pageuppro.com [206.123.114.186]Trace complete.
Were you able to see that the packet bounces through several routers before arriving at its destination? Good! This utility is useful if you are having problems reaching a web server on the Internet and you want to know if a wide area network (WAN) link is down or if the server just isn't responding. What this means to you is that, basically, wherever the trace stops is a great place to start troubleshooting. No worries here, though—the previous output shows that every router is up and responding. Last, notice the ms in the output. This is the latency of each hop, meaning the delay. Tracert (or traceroute) is a great troubleshooting tool you can use to find out where your network bottlenecks are.
If you use traceroute or tracert and receive an asterisk, this indicates that the attempt to reach that router took longer than the default time-out value. This is very good to know because it can mean that either the router is extremely busy or a particular link is slow. Another reason for getting an asterisk could be that the administrator has disabled ICMP on the router that the packet is trying to hop through.
Why would someone want to do that? For security reasons, that's why. It happens to be a typical strategic move done on the routers that interface with the ISP to conceal their actual location so bad guys can't hack into them and therefore into your internetwork. It's a good idea, and I highly recommend doing it.
In addition to traceroute and tracert, you can use pathping, which is a lot like traceroute:
C:UsersTodd Lammle>pathping lammle.comTracing route to lammle.com [184.172.53.52]over a maximum of 30 hops:0 WIN-Q14VTD8DH0G.localdomain [192.168.133.147]1 192.168.133.22 * * *Computing statistics for 25 seconds…Source to Here This Node/LinkHop RTT Lost/Sent = Pct Lost/Sent = Pct Address0 WIN-Q14VTD8DH0G.localdomain [192.168.133.147]0/ 100 = 0% |1 0ms 0/ 100 = 0% 0/ 100 = 0% 192.168.133.2Trace complete.C:UsersTodd Lammle>
This provides a nice feedback at the end of the output.
Using ipconfig, ifconfig, and ip
The utilities known as ipconfig (in Windows) and ifconfig/ip (in Unix/Linux/Mac) will display the current configuration of TCP/IP on a given workstation—including the current IP address, DNS configuration, configuration, and default gateway. In the following sections, I will show you how to use both.
Using the ipconfig Utility
With the new Mac, Windows 10, and Windows Server 2019 operating systems, you can now see the IPv6 configuration because IPv6 is enabled by default. The output of the ipconfig command provides the basic routed protocol information on your machine. From a DOS prompt, type ipconfig, and you'll see something like this:
C:Users lammle>ipconfigWindows IP ConfigurationEthernet adapter Local Area Connection:Connection-specific DNS Suffix . : domain.actdsltmpLink-local IPv6 Address . . . . . : fe80::2836:c43e:274b:f08c%11IPv4 Address. . . . . . . . . . . : 192.168.0.6Subnet Mask . . . . . . . . . . . : 255.255.255.0Default Gateway . . . . . . . . . : 192.168.0.1Wireless LAN adapter Wireless Network Connection:Connection-specific DNS Suffix . : qwest.netLink-local IPv6 Address . . . . . : fe80::20e7:7fb8:8a00:832b%10IPv4 Address. . . . . . . . . . . : 10.0.1.198Subnet Mask . . . . . . . . . . . : 255.255.255.0Default Gateway . . . . . . . . . : fe80::21b:63ff:fef3:3694%1010.0.1.1Tunnel adapter Local Area Connection* 6:Media State . . . . . . . . . . . : Media disconnectedConnection-specific DNS Suffix . :Tunnel adapter Local Area Connection* 7:Media State . . . . . . . . . . . : Media disconnectedConnection-specific DNS Suffix . :[output cut for brevity]
Wow, there sure are a lot of options in this output compared to the output for earlier versions of Windows! First, what's up with all these interfaces showing? I only have two—one Ethernet and one wireless. You can see that my Ethernet adapter shows up first, and it has an IP address, a mask, and a default gateway plus an IPv6 address and a DNS suffix. The next configured interface is the wireless local area network (LAN) adapter, which has an IP address, a mask, a default gateway, an IPv6 address, and the IPv6 default gateway as well. This IPv6 default gateway address is simply my router advertising that it runs IPv6 and saying, “I am the way out of the local LAN!”
The next adapters are disconnected because they are logical interfaces and I'm not using them—my machine actually shows eight, but I cut the output because it provides no new information. They're automatically inserted because IPv6 is installed and running on my machine, and these adapters allow me to run IPv6 over an IPv4-only network.
But just in case the ipconfig command doesn't provide enough information for you, try the ipconfig /all command—talk about details. Here's the beginning of that output:
C:Users lammle>ipconfig /allWindows IP ConfigurationHost Name . . . . . . . . . . . . : globalnet-toddPrimary Dns Suffix . . . . . . . : globalnet.localNode Type . . . . . . . . . . . . : HybridIP Routing Enabled. . . . . . . . : NoWINS Proxy Enabled. . . . . . . . : NoDNS Suffix Search List. . . . . . : globalnet.localdomain.actdsltmpqwest.netEthernet adapter Local Area Connection:Connection-specific DNS Suffix . : domain.actdsltmpDescription . . . . . . . . . . . : Intel(R) 82566MM GigabitNetwork ConnectionPhysical Address. . . . . . . . . : 00-1E-37-D0-E9-35DHCP Enabled. . . . . . . . . . . : YesAutoconfiguration Enabled . . . . : YesLink-local IPv6 Address . . . . . : fe80::2836:c43e:274b:f08c%11(Preferred)IPv4 Address. . . . . . . . . . . : 192.168.0.6(Preferred)Subnet Mask . . . . . . . . . . . : 255.255.255.0Lease Obtained. . . . . . . . . . : Monday, October 20, 2008 9:08:36 AMLease Expires . . . . . . . . . . : Tuesday, October 21, 2008 9:08:39 AMDefault Gateway . . . . . . . . . : 192.168.0.1DHCP Server . . . . . . . . . . . : 192.168.0.1DNS Servers . . . . . . . . . . . : 192.168.0.1205.171.3.65NetBIOS over Tcpip. . . . . . . . : EnabledWireless LAN adapter Wireless Network Connection:Connection-specific DNS Suffix . : qwest.netDescription . . . . . . . . . . . : Intel(R) Wireless WiFi Link 4965AGNPhysical Address. . . . . . . . . : 00-1F-3B-3F-4A-D9DHCP Enabled. . . . . . . . . . . : YesAutoconfiguration Enabled . . . . : YesLink-local IPv6 Address . . . . . : fe80::20e7:7fb8:8a00:832b%10(Preferred)IPv4 Address. . . . . . . . . . . : 10.0.1.198(Preferred)Subnet Mask . . . . . . . . . . . : 255.255.255.0Lease Obtained. . . . . . . . . . : Monday, October 20, 2008 10:43:53 AMLease Expires . . . . . . . . . . : Monday, October 20, 2008 2:43:53 PMDefault Gateway . . . . . . . . . : fe80::21b:63ff:fef3:3694%1010.0.1.1DHCP Server . . . . . . . . . . . : 10.0.1.1DNS Servers . . . . . . . . . . . : 10.0.1.1NetBIOS over Tcpip. . . . . . . . : EnabledTunnel adapter Local Area Connection* 6:Media State . . . . . . . . . . . : Media disconnectedConnection-specific DNS Suffix . :Description . . . . . . . . . . . : isatap.globalnet.localPhysical Address. . . . . . . . . : 00-00-00-00-00-00-00-E0DHCP Enabled. . . . . . . . . . . : NoAutoconfiguration Enabled . . . . : YesTunnel adapter Local Area Connection* 7:Media State . . . . . . . . . . . : Media disconnectedConnection-specific DNS Suffix . :Description . . . . . . . . . . . : isatap.{9572A79F-3A58-4E9B-9BD0-8F6FF2F058FC}Physical Address. . . . . . . . . : 00-00-00-00-00-00-00-E0DHCP Enabled. . . . . . . . . . . : NoAutoconfiguration Enabled . . . . : Yes[output cut]
As you can see, it's more of the same—a whole lot more. The most important thing I want you to notice is that I've received the hardware information about each interface, including the Media Access Control (MAC) address. Also significant is that I can see the Dynamic Host Configuration Protocol (DHCP) lease times and DNS addresses now.
But why stop here? There are two more valuable options you need to use with the ipconfig command. They are /release and /renew.
When you change networks, you need to get the IP address of that subnet and/or virtual LAN (VLAN). Windows 10 works most of the time without doing anything, but sometimes I do have to renew the IP configuration when changing networks. But that's easy—just type ipconfig /renew from a command prompt, and if you're connected to a DHCP server that's available, you'll then magically receive an IP address.
Now, if it still doesn't work, you'll need to release and renew your TCP/IP settings. To release your current DHCP TCP/IP information, you must elevate your command prompt or you'll get this warning:
C:Users lammle>ipconfig /releaseThe requested operation requires elevation.C:Users lammle>
Should this happen to you, left-click in the search box in the lower-left menu bar, then type in command prompt, right-click on the command prompt icon, and choose Run As Administrator. (Of course, you'll have to enter your name and password to do this if you are using Windows 10. But we love Windows 10, right? Okay, maybe not always.) Figure 25.4 shows how I did this.
Once your command prompt has been duly elevated, you can use the ipconfig /release command and then the ipconfig /renew command to get new TCP/IP information for your host.

FIGURE 25.4 Elevating your command prompt
Using the ifconfig Utility
There is a utility in Linux/Unix/Mac that will give you information similar to what ipconfig shows. It's called ifconfig (short for interface configuration). Although ipconfig and ifconfig show similar information, there are major differences between these two utilities. The ipconfig utility is mainly used to view the TCP/IP configuration for a computer. You can use ifconfig to do the same thing, but ifconfig can also be used to configure a protocol or a particular network interface.
The general syntax of the ifconfig command is as follows:
ifconfig interface [address [parameters]]
The interface parameter equals the Unix name of the interface, such as eth0. If the optional address parameter is specified, the ifconfig command sets the IP address for the interface to the address you've specified. When the ifconfig command is used by itself with no parameters, all configured interfaces will be reported on. But if only the interface name is specified, you'll get output that looks like this:
# ifconfig eth0eth0 Link encap 10Mbps Ethernet HWaddr 00:00:C0:90:B3:42inetaddr 172.16.0.2 Bcast 172.16.0.255 Mask 255.255.255.0 UPBROADCAST RUNNING MTU 1500 Metric 0RX packets 3136 errors 217 dropped 7 overrun 26TX packets 1752 errors 25 dropped 0 overrun 0
Looking at this, we can see that the eth0 interface is a 10 Mbps Ethernet interface. The interface's MAC and IP address information is displayed in this output as well. And, although not shown in the output, the ifconfig tool can show you the DNS information configured on the host.
Using the ip Utility
Newer versions of the Linux operating system have added the ip utility to replace the ifconfig command. This command serves the same purpose as ifconfig and is used to assign an address to a network interface and/or configure network interface parameters on Linux operating systems.
The ip command allows us to find out what interfaces are configured on the computer, view and configure their IP values, take an interface up or down, configure routing, display network status information, view and configure multicast values, view the ARP table, add or remove static routes, and view the host's routing table.
For example, to add the IP address of 192.168.1.1 to interface Ethenrnet0, use the following command:
#ip a add 192.168.1.1/255.255.255.0 dev eth0Using the iptables utility
Using the iptables Utility
While iptables is not part of the exam objectives, it is added here as it is an important Linux networking utility and good to be aware of. The iptables firewall utility is built for the Linux operating system. It is a command-line utility that uses what are called chains to allow or disallow traffic. When traffic arrives, iptables looks for a rule that addresses that traffic type, and if none exists, it will enforce the default rule. There are three different chain types:
- Input: Controls behavior for incoming connections
- Forward: Used for incoming connections that aren't being delivered locally (like a router would receive)
- Output: Used for outgoing connections
You can set the default action to accept, drop, or reject, with the difference between reject and drop being that reject sends an error message back to the source.
Examples of iptables
To block a connection from the device at 192.168.10.1, use this command:
iptables -A INPUT -s 192.168.10.1 -j DROP
To block all connections from all devices in the 172.16.0.0/16 network, use this command:
iptables -A INPUT -s 172.16.0.0/16 -j DROP
Here is the command to block SSH connections from 10.110.61.5:
iptables -A INPUT -p tcp --dport ssh -s 10.110.61.5 -j DROP
Use this command to block SSH connections from any IP address:
iptables -A INPUT -p tcp --dport ssh -j DROP
The following command is used to save the changes in Ubuntu:
sudo /sbin/iptables-save
In Red Hat/CentOS, use either of the following commands:
/sbin/service iptables save/etc/init.d/iptables save
Using the ping Utility
The ping utility is the most basic TCP/IP utility, and it's included with most TCP/IP stacks for most platforms. Windows, again, is no exception. In most cases, ping is a command-line utility, although there are many GUI implementations available. You use the ping utility for two primary purposes:
- To find out if a host is responding
- To find out if you can reach a host
Here's the syntax (you can use either command):
ping hostnameping IP address
If you ping any station that has an IP address, the ICMP that's part of that particular host's TCP/IP stack will respond to the request. The ICMP test and response looks something like this:
ping 204.153.163.2Pinging 204.153.163.2 with 32 bytes of data:Reply from 204.153.163.2: bytes=32 time<10ms TTL=128Reply from 204.153.163.2: bytes=32 time=1ms TTL=128Reply from 204.153.163.2: bytes=32 time<10ms TTL=128Reply from 204.153.163.2: bytes=32 time<10ms TTL=128
Because I've received a reply from the destination station (204.153.163.2, in this case), I know that I can reach the host and that it's responding to basic IP requests. Don't forget that you can use name resolution and ping to a name, such as ping www.sybex.com, and as long as that name can be resolved, you're golden.
Most versions of ping work the same way, but there are some switches you can use to specify certain information, like the number of packets to send, how big a packet to send, and so on. And if you're running the Windows command-line version of ping, just use the /? or –? switch to display a list of the available options like this:
C:Users lammle>ping /?Usage: ping [-t] [-a] [-n count] [-l size] [-f] [-i TTL] [-v TOS][-r count] [-s count] [[-j host-list] | [-k host-list]][-w timeout] [-R] [-S srcaddr] [-4] [-6] target_name
The command will also output a table showing what each of the options does, presented here in Table 25.1.
TABLE 25.1 Options for ping switches
| Option | Description |
|---|---|
-t | Pings the specified host until stopped. To see statistics and continue, press Ctrl+Break; to stop, press Ctrl+C. |
-a | Resolves addresses to hostnames. |
-n count | Specifies the number of echo requests to send. |
-l size | Sends the buffer size. |
-f | Sets the Don't Fragment flag in the packet (IPv4 only). |
-i TTL | Specifies the time to live of the packet. |
-v TOS | Specifies the type of service (IPv4 only). |
-r count | Records the route for count hops (IPv4 only). |
-s count | Specifies the time stamp for count hops (IPv4 only). |
-j host-list | Uses a loose source route along the host list (IPv4 only). |
-k host-list | Uses a strict source route along the host list (IPv4 only). |
-w timeout | Specifies the time-out to wait for each reply in milliseconds. |
-R | Uses the routing header to test the reverse route also (IPv6 only). |
-S srcaddr | Specifies the source address to use. |
-4 | Forces using IPv4. |
-6 | Forces using IPv6. |
As you can see, there's a plethora of options you can use with the ping command from a Windows DOS prompt. But I really want you to focus on a few from the previous output. (I'm going to go over only a few of them, but you can get on your host machine and play with all the options.)
The -a switch is very cool because if you have name resolution (such as a DNS server), you can see the name of the destination host even if you only know its IP address. The -n switch sets the number of echo requests to send, where four is the default, and the -w switch allows you to adjust the time-out in milliseconds. The default ping time-out is 1 second (1,000 ms).
The -6 is also nice if you want to ping an IPv6 host. By the way, unless you really love typing 128-bit addresses, this is a wonderful example of how important name resolution is. And then there's -t, which keeps the ping running. Here's an example of a ping to an IPv6 address:
C:Users lammle>ping -6 fe80::1063:16af:3f57:fff9Pinging fe80::1063:16af:3f57:fff9 from fe80::1063:16af:3f57:fff9%25with 32 bytes of data:Reply from fe80::1063:16af:3f57:fff9: time<1msReply from fe80::1063:16af:3f57:fff9: time<1msReply from fe80::1063:16af:3f57:fff9: time<1msReply from fe80::1063:16af:3f57:fff9: time<1msPing statistics for fe80::1063:16af:3f57:fff9:Packets: Sent = 4, Received = 4, Lost = 0 (0% loss),Approximate round trip times in milli-seconds:Minimum = 0ms, Maximum = 0ms, Average = 0msC:Users lammle>
From a MAC, you can use the ping6 command. Here are the options:
$ ping6usage: ping6 [-DdfHmnNoqrRtvwW] [-a addrtype] [-b bufsiz] [-B boundif][-c count][-g gateway] [-h hoplimit] [-I interface] [-i wait] [-l preload][-p pattern] [-S sourceaddr] [-s packetsize] [-z tclass][hops …] host
And if I want to have a continuous ping, I just use that -t option like this:
C:Users lammle>ping -t 192.168.0.1Pinging 192.168.0.1 with 32 bytes of data:Reply from 192.168.0.1: bytes=32 time=7ms TTL=255Reply from 192.168.0.1: bytes=32 time=1ms TTL=255Reply from 192.168.0.1: bytes=32 time=1ms TTL=255Reply from 192.168.0.1: bytes=32 time=1ms TTL=255Reply from 192.168.0.1: bytes=32 time=1ms TTL=255Reply from 192.168.0.1: bytes=32 time=1ms TTL=255Ping statistics for 192.168.0.1:Packets: Sent = 6, Received = 6, Lost = 0 (0% loss),Approximate round trip times in milli-seconds:Minimum = 1ms, Maximum = 7ms, Average = 2msControl-C^CC:Users lammle>
This ping will just keep going and going like the Energizer Bunny until you press Ctrl+C. And by the way, it's an awesome tool for troubleshooting links.
Using the Address Resolution Protocol
The Address Resolution Protocol (ARP) is part of the TCP/IP protocol stack. It's used to translate TCP/IP addresses to MAC addresses using broadcasts. When a machine running TCP/IP wants to know which machine on an Ethernet network is using a certain IP address, it will send an ARP broadcast that says, in effect, “Hey … exactly who is IP address xxx.xxx.xxx.xxx?” The machine that owns the specific address will respond with its own MAC address, supplying the answer. The machine that made the inquiry will respond by adding the newly gained information to its own ARP table.
In addition to the normal usage, the ARP designation refers to a utility in Windows that you can use to manipulate and view the local workstation's ARP table.
The Windows ARP Table
The ARP table in Windows includes a list of TCP/IP addresses and their associated physical (MAC) addresses. This table is cached in memory so that Windows doesn't have to perform ARP lookups for frequently accessed TCP/IP addresses like those of servers and default gateways. Each entry contains an IP address and a MAC address plus a value for TTL that determines how long each entry will remain in the ARP table.
Remember that the ARP table contains two kinds of entries:
- Dynamic
- Static
Dynamic ARP table entries are created whenever the Windows TCP/IP stack performs an ARP lookup but the MAC address isn't found in the ARP table. When the MAC address of the requested IP address is finally found, or resolved, that information is then added into the ARP table as a dynamic entry. Whenever a request to send a packet to the host is sent to the Data Link layer, the ARP cache is checked first before an ARP broadcast is sent out. Remember, the ARP request is broadcast on the local segment—it does not go through a router.
Static ARP table entries serve the same function as dynamic entries but are made manually using the arp utility.
Using the arp Utility
You now know that ARP is a protocol included in the TCP/IP suite. You also understand that ARP is used by IP to determine the MAC address of a device that exists on the same subnet as the requesting device. When a TCP/IP device needs to forward a packet to a device on the local subnet, it first looks in its own table, called an ARP cache or MAC address lookup table, for an association between the known IP address of the destination device on the local subnet and that same device's MAC address. The cache is called that because the contents are periodically weeded out.
If no association that includes the destination IP address can be found, the device will then send out an ARP broadcast that includes its own MAC and IP information as well as the IP address of the target device and a blank MAC address field. Filling in that blank is the object of the whole operation—it's the unknown value that the source device is requesting to be returned to it in the form of an ARP reply. Windows includes a utility called arp that allows us to check out the operating system's ARP cache. To view this, from a Windows DOS prompt, use the arp command like this:
C:Users lammle>arpDisplays and modifies the IP-to-Physical address translation tables usedby address resolution protocol (ARP).ARP -s inet_addr eth_addr [if_addr]ARP -d inet_addr [if_addr]ARP -a [inet_addr] [-N if_addr] [-v]
Table 25.2 describes the various options that you can use with the arp command.
Sheesh. Looking at that output really makes me wish we were all just running IPv6 because, as you already should know, IPv6 doesn't need ARP as well as many other annoying features and protocols required when running IPv4.
Of note, the Windows arp utility is primarily useful for resolving duplicate IP addresses. For example, let's say your workstation receives its IP address from a DHCP server but it accidentally receives the same address that some other workstation gets. And so, when you try to ping it, you get no response. Your workstation is basically confused—it's trying to determine the MAC address, and it can't because two machines are reporting that they have the same IP address. To solve this little snag, you can use the arp utility to view your local ARP table and see which TCP/IP address is resolved to which MAC address.
TABLE 25.2 arp options
| Option | Description |
|---|---|
-a | Displays current ARP entries by interrogating the current protocol data. If inet_addr is specified, the IP and physical addresses for only the specified computer are displayed. If more than one network interface uses ARP, entries for each ARP table are displayed. |
-g | Same as -a. |
-v | Displays current ARP entries in verbose mode. All invalid entries and entries on the loopback interface will be shown. |
inet_addr | Specifies an Internet address. |
-N | Displays the ARP entries for the network interface specified by if_addr. |
-d | Deletes the host specified by inet_addr.inet_addr may be wildcarded with * to delete all hosts. |
-s | Adds the host and associates the Internet address inet_addr with the physical address eth_addr. The physical address is given as six hexadecimal bytes separated by hyphens. The entry is permanent. |
eth_addr | Specifies a physical address. |
if_addr | If present, specifies the Internet address of the interface whose address translation table should be modified. If not present, the first applicable interface will be used. |
To display the entire current ARP table, use the arp command with the –a switch like so to show you the MAC address lookup table:
C:Users lammle>arp -aInterface: 192.168.0.6 --- 0xbInternet Address Physical Address Type192.168.0.1 00-15-05-06-31-b0 dynamic192.168.0.255 ff-ff-ff-ff-ff-ff static224.0.0.22 01-00-5e-00-00-16 static224.0.0.252 01-00-5e-00-00-fc static239.255.255.250 01-00-5e-7f-ff-fa static255.255.255.255 ff-ff-ff-ff-ff-ff staticInterface: 10.100.10.54 --- 0x10Internet Address Physical Address Type10.100.10.1 00-15-05-06-31-b0 dynamic10.100.10.255 ff-ff-ff-ff-ff-ff static224.0.0.22 01-00-5e-00-00-16 static224.0.0.252 01-00-5e-00-00-fc static239.255.255.250 01-00-5e-7f-ff-fa static
Now, from this output, you can tell which MAC address is assigned to which IP address. Then, for static assignments, you can tell which workstation has a specific IP address and if it's indeed supposed to have that address by examining your network documentation—you do have that record, right?
For DHCP-assigned addresses, you can begin to uncover problems stemming from multiple DHCP scopes or servers doling out identical addresses and other common configuration issues. And remember that under normal circumstances, you shouldn't see IP addresses in the ARP table that aren't members of the same IP subnet as the interface.
It's good to know that in addition to displaying the ARP table, you can use the arp utility to manipulate the table itself. To add static entries to the ARP table, you use the arp command with the –s switch. These static entries will stay in the ARP table until the machine is rebooted. A static entry essentially hardwires a specific IP address to a specific MAC address so that when a packet needs to be sent to that IP address, it will automatically be sent to that MAC address. Here's the syntax:
arp –s [IP Address] [MAC Address]
Simply replace the [IP Address] and [MAC Address] sections with the appropriate entries, like so:
arp –s 204.153.163.5 00–a0–c0–ab–c3–11
Now, take a look at your new ARP table by using the arp –a command. You should see something like this:
Internet Address Physical Address Type204.153.163.5 00–a0–c0–ab–c3–11 static
Finally, if you want to delete entries from the ARP table, you can either wait until the dynamic entries time out or use the –d switch with the IP address of the static entry you'd like to delete, like this:
arp –d 204.153.163.5
Doing so effectively deletes the entry from the ARP table in memory.
Using the nslookup Utility
Whenever you're configuring a server or a workstation to connect to the Internet, you've got to start by configuring DNS if you want name resolution to happen (that is, if you want to be able to type www.sybex.com instead of an IP address). When configuring DNS, it's a very good thing to be able to test what IP address DNS is returning to ensure that it's working properly. The nslookup utility allows you to query a name server and quickly find out which name resolves to which IP address.
The nslookup utility comes with Windows 10 as well as with most versions of Unix and Linux. You can run it from a Windows command prompt. At the command prompt, you can start the nslookup utility by typing nslookup and pressing Enter. When you're inside this utility, the command prompt will change from something similar to a C:> sign to a shorter > sign. It will also display the name and IP address of the default DNS server you will be querying (you can change it, if necessary). Then you can start using nslookup. The following output gives you a sample of the display after the nslookup command has been entered at the C:> prompt.
C:Users lammle>nslookupDefault Server: gnt-corpdc1.globalnet.localAddress: 10.100.36.12>
The primary job of nslookup is to tell you the many different features of a particular domain name, the names of the servers that serve it, and how they're configured. To get that, just type in a domain name at the > prompt, and the nslookup utility will then return this information:
> lammle.comServer: dslmodem.domain.actdsltmpAddress: 192.168.0.1
The non-authoritative answer is as follows:
Name: lammle.comAddress: 206.123.114.186
What this tells you is that the server that returned the information is not responsible (authoritative) for the zone information of the domain for which you requested an address and that the name server for the domain lammle.com is located at the IP address 206.123.114.186.
You can also ask nslookup for other information by setting a different option within nslookup. Just type set option at the > prompt and replace option with the actual option you want to use—for example, use >set type=mx to determine the IP address of your email server. If you can't decide which one you want, use the question mark (?) at the greater than sign (>) to see all available options.
If you type in nslookup and receive this reply,
NS request timed out.timeout was 2 seconds.***Can't find server name for address 206.123.114.186: Timed outDefault Server: UnKnownAddress: fec0:0:0:ffff::1
then you know your DNS servers are not answering. You need to get over to the DNS server, stat!
Resolving Names with the Hosts File
The hosts file is really a lot like DNS, except its entries are static for each and every host and server. Within the Hosts table, you'll find a collection of hostnames that devices reference for name-resolution purposes. And even though it works in both IPv4 and IPv6 environments, it's unlikely you will use it these days because the hosts file is a way-ancient relic left over from old Unix machines.
But just because it belongs in a museum, that doesn't mean you won't run into it now and then, which is the main reason I'm showing it to you. You can find the Hosts table in C:WindowsSystem32driversetc. Just double-click the file, and then choose to open the file in Notepad or another text editor. Here's the default information—it's really nothing more than an explanation of how to use it and the local hosts for both IP and IPv6:
# Copyright (c) 1993-2006 Microsoft Corp.## This is a sample HOSTS file used by Microsoft TCP/IP for Windows.## This file contains the mappings of IP addresses to host names. Each# entry should be kept on an individual line. The IP address should# be placed in the first column followed by the corresponding host name.# The IP address and the host name should be separated by at least one# space.## Additionally, comments (such as these) may be inserted on individual# lines or following the machine name denoted by a '#' symbol.## For example:## 102.54.94.97 rhino.acme.com # source server# 38.25.63.10 x.acme.com # x client host127.0.0.1 localhost::1 localhost
Because it's a plain ASCII text file, you add the IP address under the local hosts and then the name to which you want to resolve the IP address. It's a pretty simple configuration, and again, one I don't recommend using because you have to type in the names of every host on every machine in your network. DNS is definitely the name resolution of choice for networks today.
Using the Mtr Command (pathping)
Mtr, or My traceroute, is a computer program that combines the functions of the traceroute and ping utilities in a single network diagnostic tool. It also adds round-trip time and packet loss to the output—very cool.
Mtr probes routers on the route path by limiting the number of hops individual packets are allowed to traverse and listening to news of their termination. It will regularly repeat this process (usually once per second) and keep track of the response times of the hops along the path.
Mtr is great if you have Linux or Unix, but by default, it's not installed on Windows devices. Third-party applications of Mtr are available to install on Windows, but Microsoft did respond with its own version of Mtr—it's called pathping and it provides the same functions as Mtr. Here's a look at the output and the options:
C:Users lammle>pathpingUsage: pathping [-g host-list] [-h maximum:hops] [-i address] [-n][-p period] [-q num:queries] [-w timeout][-4] [-6] target_name
Table 25.3 lists the options of the Windows pathping command.
TABLE 25.3 pathping options
| Option | Description |
|---|---|
-g host-list | Uses a loose source route along the host list. |
-h maximum:hops | Specifies the maximum number of hops to search for the target. |
-i address | Uses the specified source address. |
-n | Does not resolve addresses to hostnames. |
-p period | Waits period milliseconds between pings. |
-q num:queries | Specifies the number of queries per hop. |
-w timeout | Waits timeout milliseconds for each reply. |
-4 | Forces using IPv4. |
-6 | Forces using IPv6. |
Using the Nmap Utility
Nmap is one of the most popular port scanning tools used today. After performing scans with certain flags set in the scan packets, security analysts (and hackers) can make certain assumptions based on the responses received. These flags are used to control the TCP connection process and so are present only in TCP packets. Figure 25.5 shows a TCP header with the important flags circled. Normally flags are “turned on” because of the normal TCP process, but hackers can craft packets to check the flags they want to check.

FIGURE 25.5 TCP flags
Figure 25.5 shows these flags, among others:
- URG: Urgent pointer field significant
- ACK: Acknowledgment field significant
- PSH: Push function
- RST: Reset the connection
- SYN: Synchronize sequence numbers
- FIN: No more data from sender
While application of a scan and interpretation of the responses are beyond the scope of this book, security analysts and hackers alike can perform scans with these flags set in the scan packets to get responses that allow them to determine the following information:
- If a port is open on a device
- If the port is blocked by a firewall before it gets to the device
Nmap can also be used as follows:
- To determine the live hosts on a network
- To create a logical “map” of the network
Using the route Command
I went over static routing in Chapter 9, “Introduction to IP Routing,” so you know that Windows devices like routers perform routing. Most of the time, it's a good idea to leave Windows alone, but it's still good to know how to add and delete routes on your Windows machines.
Probably the biggest reason for manipulating the routing table on a Windows server is to create a firewall. For instance, let's say we're running an Application layer firewall on a Windows server located between a screen subnet, formerly known as a demilitarized zone (DMZ), and the internal network. This scenario would mean the routing that's happening on the server or hosts located in the DMZ wouldn't be able to reach the internal network's hosts and vice versa.
To circumvent this problem, we would need to employ both static and default routing because while Windows 10 and Windows Server versions support some routing protocols, running routing protocols on hosts and servers wouldn't be a good solution for today's networks, and Microsoft knows that.
To view the routing table on a Windows device, use the route print command, as shown in Figure 25.6.
In this output, you can see that each of the routes were added automatically when the system booted up. (This is all based on the configuration of your IP stack.) To see all the options available with the route command, type the route command and then press Enter. To add a route to your routing table, use the following syntax:
route [-f] [-p] [Command [Destination] [mask Netmask] [Gateway][metric Metric]] [if Interface]]
Using the route Command Options
Let's start with the switches you can use:
-fUsing this switch with any of the options likeadd,change, ordeletewill clear the routing table of all entries that aren't host routes (routes with the subnet mask 255.255.255.255), the loopback network route or routes (routes with a destination of 127.0.0.0 and the subnet mask 255.0.0.0), and any multicast routes (those with a destination of 224.0.0.0 and the subnet mask 240.0.0.0).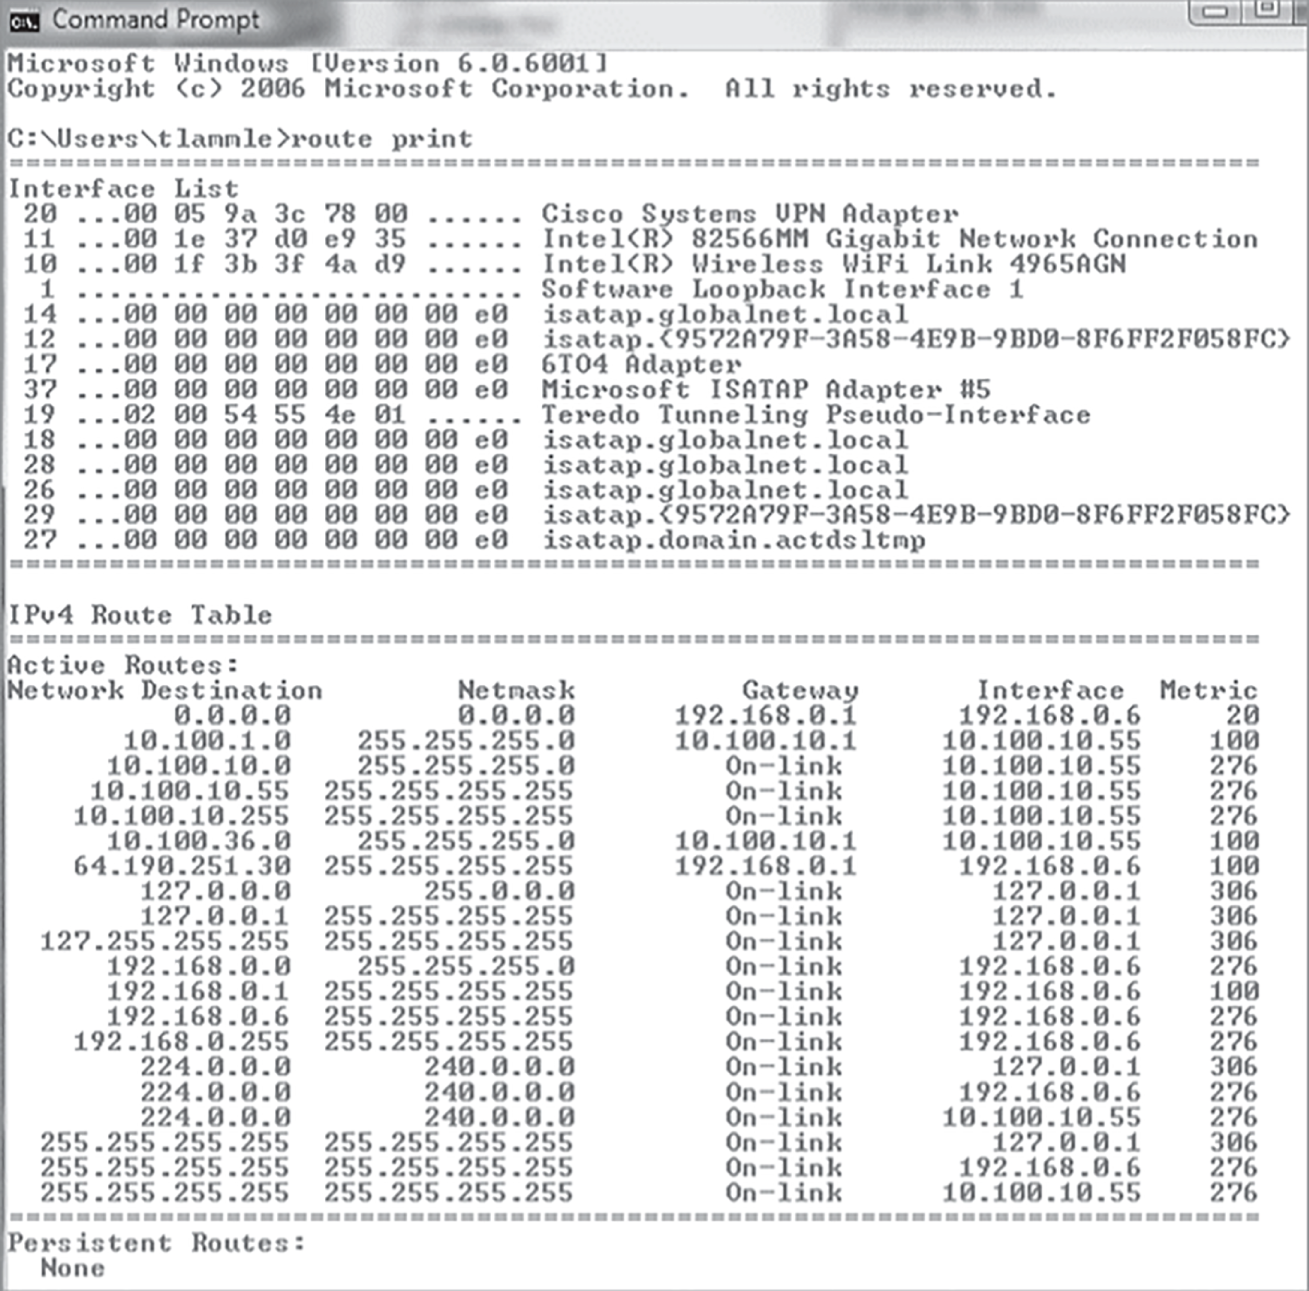
FIGURE 25.6
route printoutput-pIf you use this with theaddcommand, the individual route will be added to the Registry and then used to initialize the IP routing table whenever TCP/IP is started. Important to remember that by default, the routes you've statically added won't remain in the routing table the next time TCP/IP boots. And if you use-pwith theprintcommand, you'll get shown a list of the persistent routes that are stored in the Registry location ofHKEY_LOCAL_MACHINESYSTEMCurrentControlSetServicesTcpipParametersPersistentRoutes.
Now, let's take a look at how and when you would use the route command. Table 25.4 shows the command options available and what they do when you are using the route command with them.
TABLE 25.4 route command options
| Command | Purpose |
|---|---|
add | Adds a route |
change | Modifies an existing route |
delete | Deletes a route (or routes) |
print | Prints a route (or routes) |
Here's a description of some other tasks you can accomplish via the rest of the command's options:
- Destination This will give you the network destination of a given route. If the host bits of the network address are set to 0, it will be depicted with the destination's IP network address, an IP address for a specific host route, or the default route of 0.0.0.0.
- mask netmask This will provide you with the netmask—often referred to as the subnet mask—that's associated with the destination network. The default destination subnet mask is 0.0.0.0, and typically you'll see 255.255.255.255 representing a host route. It's really important to remember that the destination address can't be more specific than its corresponding subnet mask. What I'm saying is that there absolutely can't be a bit set to 1 in the destination address if the equivalent bit in the subnet mask is a 0.
- Gateway The gateway also depends on the network address and subnet mask, but it's even more specific and delimits what's called the next-hop IP address. For routes located on a local subnet, the gateway address maps directly to a particular interface. If the destination is on a remote network, the gateway IP address will direct packets to the neighboring router.
- metric metric Metric refers to the cost of a given route from the sending to the receiving device, and it's a value between 1 and 9999. Devices use this value to choose the best, or most efficient, routes among those in its routing table—the route with the lowest value wins. This decision can also include factors like the number of hops and the speed, reliability, and available bandwidth of the path being considered plus the various administrative aspects associated with it.
- if interface This tool depends on information from the gateway address and determines the interface index for the specific interface that needs to receive the data. You can get a list of interfaces along with their relevant interface indexes by typing the
route printcommand. - /? Using this will allow you to view help at the command prompt.
Some Examples of the route Command
Even though the finer points of the route command demand that you use caution when deploying some of the options, I'll still list the basics of the route command because it can be really useful. I highly recommend that you spend some time practicing them on a non-production server, though—especially at first.
- To display the entire IP routing table, type
route print. - To add a default route with the default gateway address 192.168.10.1, type
route add 0.0.0.0 mask 0.0.0.0 192.168.10.1. - To add a route to the destination 10.1.1.0 with the subnet mask 255.255.255.0 and the next-hop address 10.2.2.2, type
route add 10.1.1.0 mask 255.255.255.0 10.2.2.2. - If you want to, let's say, add a persistent route to the destination 10.100.0.0 with the subnet mask 255.255.0.0 and the next-hop address 10.2.0.1, type
route -p add 10.100.0.0 mask 255.255.0.0 10.2.0.1. If you want to delete the route to the destination 10.100.0.0 with the subnet mask 255.255.0.0, enterroute delete 10.100.0.0 mask 255.255.0.0. - And finally, if you want to change the next-hop address of a route with the destination 10.100.0.0 and the subnet mask 255.255.0.0 from 10.2.0.1 to 10.7.0.5, type
route change 10.100.0.0 mask 255.255.0.0 10.7.0.5.
Let's move on to some other important Windows utilities.
Using the nbtstat Utility
Microsoft Windows uses an interface called Network Basic Input/Output System (NetBIOS), which relates names with workstations and is an upper-layer interface that requires a transport protocol—usually TCP/IP. But IPv6 can be used as well. Deploying the nbtstat utility will achieve these three important things:
- Track NetBIOS over TCP/IP statistics
- Show the details of incoming and outgoing NetBIOS over TCP/IP connections
- Resolve NetBIOS names
Understand that because NetBIOS name resolution is primarily a Windows network utility, the nbtstat command is available only in Windows-based operating systems.
To display a basic description of nbtstat and its associated options, type nbtstat at the command line. Then, use these options to get a display of information about NetBIOS over TCP/IP hosts. Here are some of the tools, or switches, you can use:
–a | –A |
–c | –n |
–r | –R |
–S | –s |
The – a Switch
Making use of the –a switch will get you a remote machine's NetBIOS name table consisting of a list of every NetBIOS name the machine from which you've deployed the switch knows of. The –a switch produced the output from server S1 shown in Figure 25.7.
So, using this switch arranges the NetBIOS name-table information in table form with output in four columns. The Name column displays the NetBIOS name entry for the remote host machine.
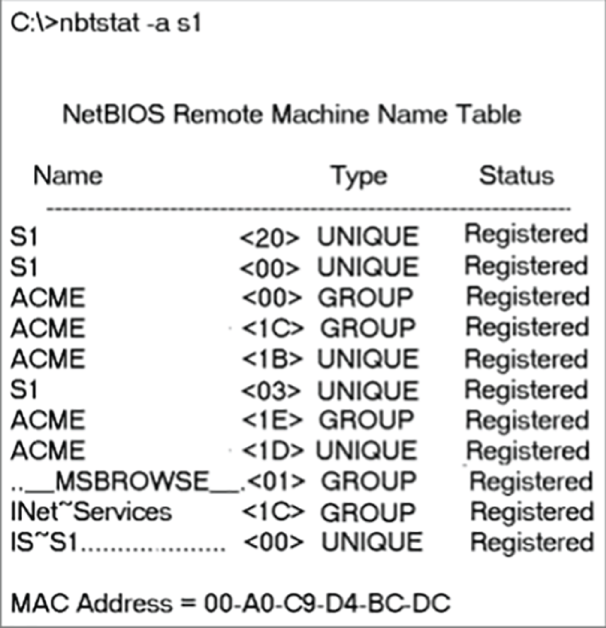
FIGURE 25.7 Sample output of the nbtstat –a command
The next column gives you a unique two-digit hexadecimal identifier for the NetBIOS name. This identifier represents the last byte of the NetBIOS name depicted in the Name column, and it's important because the same name could actually be used several times for the same machine. Plus, it identifies the specific service on the particular host that the name is referencing. Table 25.5 and Table 25.6 list the hexadecimal identifiers for unique and group hostnames.
The Type column refers to (surprise) the type of NetBIOS name being referenced. Unique NetBIOS names refer to individual hosts, and group names refer to logical groupings of workstations—either domains or workgroups.
The Status column gives you information about the status of a host's NetBIOS even if it hasn't been registered with the rest of the network.
TABLE 25.5 Last-byte identifiers for unique names
| Hex ID | Description |
|---|---|
| 00 | General name for the computer. |
| 03 | Messenger service ID used to send messages between a WINS server and a workstation. This is the ID registered with a WINS server. |
| 06 | Remote Access Server (RAS) server service ID. |
| 20 | File-serving service ID. |
| 21 | RAS client. |
| 53 | DNS. |
| 123 | Network Time Protocol (NTP). |
| 1B | Domain master browser ID. A NetBIOS name with this ID indicates the domain master browser. |
| 1F | Network Dynamic Data Exchange (NetDDE) service ID. |
| BE | Network monitor agent ID. |
| BF | Network monitor utility ID. |
TABLE 25.6 Last-byte identifiers for group names
| Hex ID | Description |
|---|---|
| 01 | Master browser for a domain to other master browsers. |
| 20 | Internet group name ID. This ID is registered with the WINS server to indicate which computers are used for administrative purposes. |
| 1C | Domain group name ID. |
| 1D | Master browser name. |
| 1E | Normal group name. |
The – A Switch
The –A switch works just like the –a switch and will give you the same output, but the syntax of the command is different. Obviously, you use an uppercase A instead of a lowercase one, and you also have to include the host's IP address instead of its NetBIOS name. To use it, type nbtstat followed by –A and finally the IP address of the specific host whose NetBIOS table you want to check out:
nbtstat –A 199.153.163.2
The – c Switch
Use the –c switch to display the local NetBIOS name cache on the workstation it's running on. Figure 25.8 shows sample output of the nbtstat –c command.
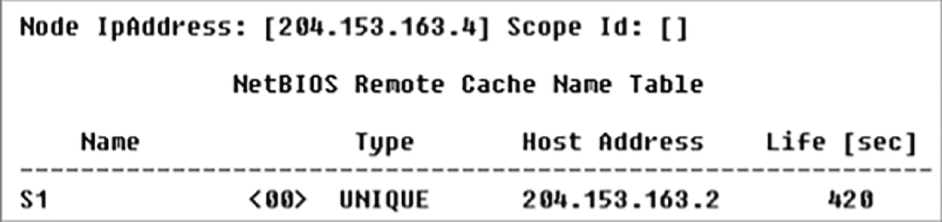
FIGURE 25.8 Sample output of the nbtstat –c command
Each entry in this display shows the NetBIOS name, the hex ID for the service that was accessed, the type of NetBIOS name (unique or group), the IP address that the name resolves to, and its life. The Life value shows how many seconds each entry will live in the cache. When this time expires, the entry will be deleted.
The – n Switch
The –n switch will give you the local NetBIOS name table on a Windows device. Figure 25.9 shows output that's similar to the output of the –a switch except for one important thing: What you're seeing is the NetBIOS name table for the machine you're running the command on instead of that of another host. Check it out.
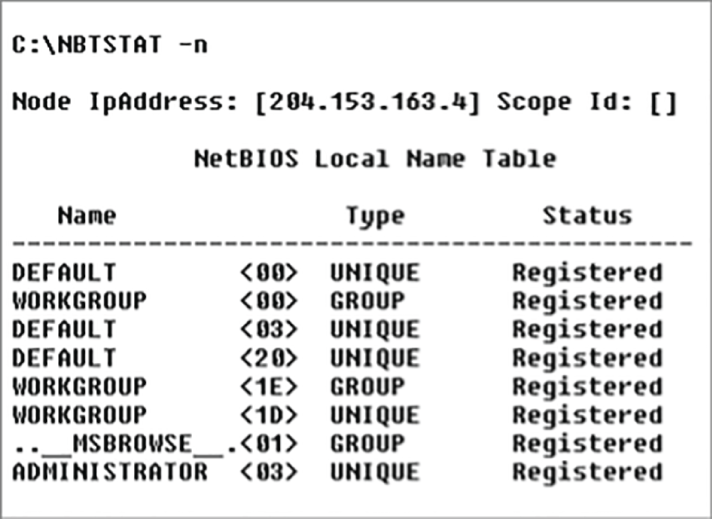
FIGURE 25.9 Sample output of the nbtstat –n command
The – r Switch
This switch is probably the one you'll use most often when you want to get a hold of NetBIOS over TCP/IP (NBT) statistics because it tells you exactly how many NetBIOS names have been resolved to TCP/IP addresses. Figure 25.10 shows sample output of the nbtstat –r command.
What you can see here is that the statistics are divided into two categories. First, there are the NetBIOS names resolution and registration statistics. This is how many names have been resolved or registered either by broadcasts on the local segment or via lookup from a DNS server.
Next you have the NetBIOS unique and group names and their associated hex IDs that were resolved or registered. In Figure 25.10, you can see that there's a distinct lack of information regarding names resolved by a name server. What this means is that the output is telling you that there's no WINS server operating—instead, all NetBIOS names were resolved by broadcast only.
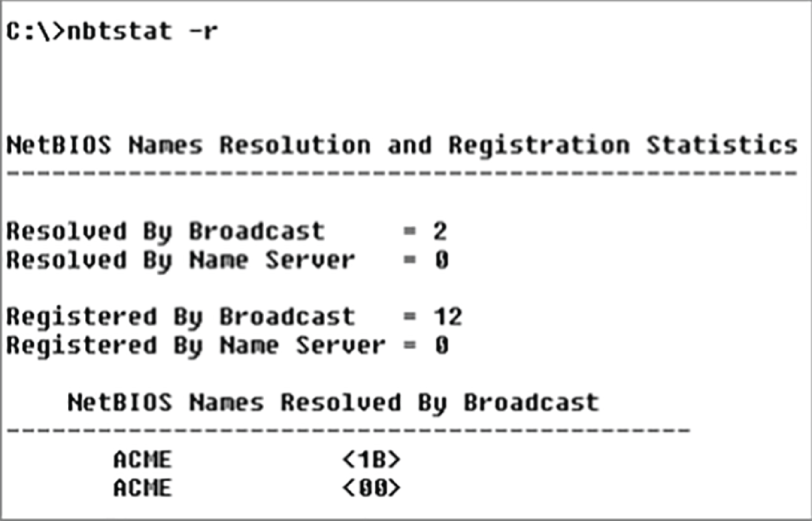
FIGURE 25.10 Sample output of the nbtstat –r command
The – R Switch
Unlike the –a and –A switches, -r and -R use the same letter but do not have anything in common.
Here's an example. Let's say you have a bad name in the NetBIOS name cache but the right name is in the LMHOSTS file instead. (The LMHOSTS file contains NetBIOS names of stations and their associated IP addresses.) Because the cache is consulted before the LMHOSTS file is, that bad address will remain in the cache until it expires.
This command is used when you want to purge the NetBIOS name table cache and reload the LMHOSTS file into memory. You do that by using the nbtstat command with the –R switch, like so:
nbtstat –R
You can practice this nbtstat -R command on your host to purge the NBT remote cache table.
The – S Switch
Using the -S switch will display the NetBIOS sessions table that lists all NetBIOS sessions to and from the host from which you issued the command. The –S switch displays both workstation and server sessions but lists remote addresses by IP address only.
Figure 25.11 shows sample output of the nbtstat –S command.
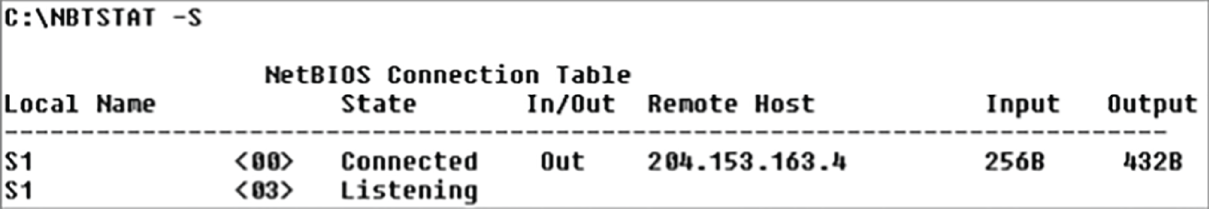
FIGURE 25.11 Sample output of the nbtstat –S command
Here you can see the NetBIOS name being displayed along with its hex ID and the status of each session. An entry in the In/Out column determines whether the connection has been initiated from the computer on which you're running nbtstat (outbound) or whether another computer has initiated the connection (inbound). The numbers in the Input and Output columns indicate in bytes the amount of data transferred between the stations.
The – s Switch
As with the –A and –a switches, the lowercase –s switch is similar to its uppercase sibling. The nbtstat –s command produces the same output as nbtstat –S except that it will also attempt to resolve remote-host IP addresses into hostnames. Figure 25.12 shows sample output from the nbtstat –s command.

FIGURE 25.12 Sample output of the nbtstat –s command
Note the similarities between Figure 25.11 and Figure 25.12.
Using the netstat Utility
Using netstat is a great way to check out the inbound and outbound TCP/IP connections on your machine. You can also use it to view packet statistics like how many packets have been sent and received, the number of errors, and so on.
When used without any options, netstat produces output similar to the following, which shows all the outbound TCP/IP connections. This utility is a great tool to use to determine the status of outbound web connections. Take a look:
C:Users lammle>netstatActive ConnectionsProto Local Address Foreign Address StateTCP 10.100.10.54:49545 gnt-exchange:epmap TIME_WAITTCP 10.100.10.54:49548 gnt-exchange:epmap TIME_WAITTCP 10.100.10.54:49551 gnt-exchange:1151 ESTABLISHEDTCP 10.100.10.54:49557 gnt-exchange:1026 ESTABLISHEDTCP 10.100.10.54:49590 gnt-exchange:epmap TIME_WAITTCP 127.0.0.1:49174 globalnet-todd:62514 ESTABLISHEDTCP 127.0.0.1:62514 globalnet-todd:49174 ESTABLISHEDTCP 192.168.0.6:2492 blugro2relay:2492 ESTABLISHEDTCP 192.168.0.6:2492 blugro3relay:2492 ESTABLISHEDTCP 192.168.0.6:49170 64.12.25.26:5190 ESTABLISHEDTCP 192.168.0.6:49171 oam-d05c:5190 ESTABLISHEDTCP 192.168.0.6:49473 205.128.92.124:http CLOSE_WAITTCP 192.168.0.6:49625 64-190-251-21:ftp ESTABLISHEDTCP 192.168.0.6:49628 210-11:http ESTABLISHEDTCP 192.168.0.6:49629 varp1:http ESTABLISHEDTCP 192.168.0.6:49630 varp1:http ESTABLISHEDTCP 192.168.0.6:49631 varp1:http ESTABLISHEDTCP 192.168.0.6:49632 varp1:http ESTABLISHEDTCP 192.168.0.6:49635 199.93.62.125:http ESTABLISHEDTCP 192.168.0.6:49636 m1:http ESTABLISHEDTCP 192.168.0.6:49638 spe:http ESTABLISHED
The Proto column lists the protocol being used. You can see that I'm connected to my Exchange server and an FTP server and that I have some HTTP sessions open; by the way, all of them use TCP at the Transport layer.
The Local Address column lists the source address and the source port (source socket). The Foreign Address column lists the address of the destination machine (the hostname if it's been resolved). If the destination port is known, it will show up as the well-known port. In the previous output, you see http instead of port 80 and ftp instead of port 21.
The State column indicates the status of each connection. This column shows statistics only for TCP connections because User Datagram Protocol (UDP) establishes no virtual circuit to the remote device. Usually, this column indicates ESTABLISHED when a TCP connection between your computer and the destination computer has been established. All sessions eventually time out and then close, and you can see that I have all of these listed in my netstat output.
The output of the netstat utility depends on the switch. By using the netstat /? command, we can see the options available to us.
C:Users lammle>netstat /?
All of the netstat switch options are listed in Table 25.7.
TABLE 25.7 netstat options
| Option | Description |
|---|---|
-a | Displays all connections and listening ports. |
-b | Displays the executable involved in creating each connection or listening port. In some cases, well-known executables host multiple independent components, and in these cases the sequence of components involved in creating the connection or listening port is displayed. Note that this option can be time consuming and will fail unless you have sufficient permissions. |
-e | Displays Ethernet statistics. This may be combined with the -s option. |
-f | Displays fully qualified domain names (FQDNs) for foreign addresses. |
-n | Displays addresses and port numbers in numerical form. |
-o | Displays the owning process ID associated with each connection. |
-p proto | Shows connections for the protocol specified by proto; proto may be TCP, UDP, TCPv6, or UDPv6. If used with the -s option to display per-protocol statistics, proto may be IP, IPv6, ICMP, ICMPv6, TCP, TCPv6, UDP, or UDPv6. |
-r | Displays the routing table. |
-s | Displays per-protocol statistics. By default, statistics are shown for IP, IPv6, ICMP, ICMPv6, TCP, TCPv6, UDP, and UDPv6; the -p option may be used to specify a subset of the default. |
-t | Displays the current connection offload state. Redisplays selected statistics, pausing interval seconds between each display. Press Ctrl+C to stop redisplaying statistics. If -t is omitted, netstat will print the current configuration information once. |
Simply type netstat followed by a space and then the particular switch you want to use. Some switches have options, but no matter what, the syntax is basically the same.
The – a Switch
When you use the –a switch, the netstat utility displays all TCP/IP connections and all UDP connections. Figure 25.13 shows sample output produced by the netstat –a command.
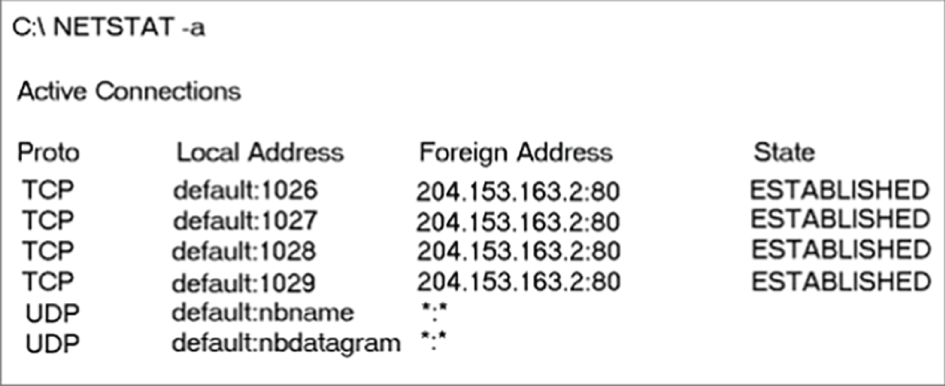
FIGURE 25.13 Sample output of the netstat –a command
The last two entries in Figure 25.13 show that the protocol is UDP and give the source-port nicknames nbname and nbdatagram. These are the well-known port numbers of 137 and 138, respectively. These port numbers are commonly seen on networks that broadcast the NetBIOS name of a workstation on the TCP/IP network. You can tell that this is a broadcast because the destination address is listed as *:* (meaning “any address, any port”).
The most common use for the –a switch is to check the status of a TCP/IP connection that appears to be hung. You can determine if the connection is simply busy or is actually hung and no longer responding.
The – e Switch
The -e switch displays a summary of all the packets that have been sent over the Network Interface Card (NIC) as of an instance. The Received and Sent columns show packets coming in as well as being sent:
C:Users lammle>netstat -eInterface StatisticsReceived SentBytes 7426841 7226953Unicast packets 25784 35006Non-unicast packets 1115 12548Discards 0 0Errors 0 71Unknown protocols 0
You can use the –e switch to display the following categories of statistics:
- Bytes The number of bytes transmitted or received since the computer was turned on. This statistic is useful for finding out if data is actually being transmitted and received or if the network interface isn't doing anything at all.
- Unicast Packets The number of packets sent from or received at this computer. To register in one of these columns, the packet must be addressed directly from one computer to another and the computer's address must be in either the source or destination address section of the packet.
- Non-unicast Packets The number of packets that weren't directly sent from one workstation to another. For example, a broadcast packet is a non-unicast packet. The number of non-unicast packets should be smaller than the number of unicast packets. If the number of non-unicast packets is as high as or higher than that of unicast packets, too many broadcast packets are being sent over your network. Definitely find the source of these packets and make any necessary adjustments to optimize performance.
- Discards The number of packets that were discarded by the NIC during either transmission or reception because they weren't assembled correctly.
- Errors The number of errors that occurred during transmission or reception. (These numbers may indicate problems with the network card.)
- Unknown Protocols The number of received packets that the Windows networking stack couldn't interpret. This statistic only shows up in the Received column because if the computer sent them, they wouldn't be unknown, right?
Unfortunately, statistics don't mean much unless they can be colored with time information. For example, if the Errors row shows 71 errors, is that a problem? It might be if the computer has been on for only a few minutes. But 71 errors could be par for the course if the computer has been operating for several days. Unfortunately, the netstat utility doesn't have a way of indicating how much time has elapsed for these statistics.
The – r Switch
You use the –r switch to display the current route table for a workstation so that you can see exactly how TCP/IP information is being routed. This will give you the same output as the route print command that we covered earlier in this chapter.
The – s Switch
Using the –s switch displays a variety of TCP, UDP, IP, and ICMP protocol statistics. But be warned—the output you'll get is really long, which may or may not be okay for you. For this book, it's way too long for me to insert. With that in mind, we can add another modifier called the -p switch.
The – p Switch
Like the –n switch, the –p switch is a modifier that's usually used with the –s switch to specify which protocol statistics to list in the output (IP, TCP, UDP, or ICMP). For example, if you want to view only ICMP statistics, you use the –p switch like so:
netstat –s –p ICMP
The netstat utility then displays the ICMP statistics instead of the entire gamut of TCP/IP statistics that the –s switch will typically flood you with. For a different example, let's use the -s and -p switches to retrieve some IPv6 information:
C:Users lammle>netstat -s -p IPV6IPv6 StatisticsPackets Received = 1400Received Header Errors = 0Received Address Errors = 6Datagrams Forwarded = 0Unknown Protocols Received = 0Received Packets Discarded = 451Received Packets Delivered = 10441Output Requests = 24349Routing Discards = 0Discarded Output Packets = 3575Output Packet No Route = 41Reassembly Required = 0Reassembly Successful = 0Reassembly Failures = 0Datagrams Successfully Fragmented = 0Datagrams Failing Fragmentation = 0Fragments Created = 0C:Users lammle>
Nice! Gets right to the point. Now, let's see the TCP connections my host has:
C:Users lammle>netstat -s -p tcpTCP Statistics for IPv4Active Opens = 7832Passive Opens = 833Failed Connection Attempts = 1807Reset Connections = 2428Current Connections = 11Segments Received = 1391678Segments Sent = 1340994Segments Retransmitted = 6246Active ConnectionsProto Local Address Foreign Address StateTCP 10.100.10.54:54737 gnt-exchange:1151 ESTABLISHEDTCP 10.100.10.54:54955 gnt-exchange:1026 ESTABLISHEDTCP 10.100.10.54:55218 gnt-exchange:epmap TIME_WAITTCP 127.0.0.1:2492 globalnet-todd:54840 ESTABLISHEDTCP 127.0.0.1:54516 globalnet-todd:62514 ESTABLISHEDTCP 127.0.0.1:54840 globalnet-todd:2492 ESTABLISHEDTCP 127.0.0.1:62514 globalnet-todd:54516 ESTABLISHEDTCP 192.168.0.6:2492 blugro2relay:2492 ESTABLISHEDTCP 192.168.0.6:2492 blugro3relay:2492 ESTABLISHEDTCP 192.168.0.6:54527 64.12.25.26:5190 ESTABLISHEDTCP 192.168.0.6:54531 oam-d05c:5190 ESTABLISHEDTCP 192.168.0.6:55163 207.123.44.123:http CLOSE_WAITC:Users lammle>
This kind of efficiency is exactly why it's good to use the -p modifier with the -s switch.
The – n Switch
The -n switch is a modifier for the other switches. When used with them, it reverses the natural tendency of netstat to use names instead of network addresses. In other words, when you use the –n switch, the output always displays network addresses instead of their associated network names. Following is output from the netstat command used with the netstat -n command. It's showing the same information but with IP addresses instead of names:
C:Users lammle>netstatActive ConnectionsProto Local Address Foreign Address StateTCP 10.100.10.54:54737 gnt-exchange:1151 ESTABLISHEDTCP 10.100.10.54:54955 gnt-exchange:1026 ESTABLISHEDTCP 127.0.0.1:2492 globalnet-todd:54840 ESTABLISHEDTCP 127.0.0.1:54516 globalnet-todd:62514 ESTABLISHEDTCP 127.0.0.1:54840 globalnet-todd:2492 ESTABLISHEDTCP 127.0.0.1:62514 globalnet-todd:54516 ESTABLISHEDTCP 192.168.0.6:2492 blugro2relay:2492 ESTABLISHEDTCP 192.168.0.6:2492 blugro3relay:2492 ESTABLISHEDTCP 192.168.0.6:54527 64.12.25.26:5190 ESTABLISHEDTCP 192.168.0.6:54531 oam-d05c:5190 ESTABLISHEDTCP 192.168.0.6:55163 207.123.44.123:http CLOSE_WAITC:Users lammle>netstat -nActive ConnectionsProto Local Address Foreign Address StateTCP 10.100.10.54:54737 10.100.36.13:1151 ESTABLISHEDTCP 10.100.10.54:54955 10.100.36.13:1026 ESTABLISHEDTCP 127.0.0.1:2492 127.0.0.1:54840 ESTABLISHEDTCP 127.0.0.1:54516 127.0.0.1:62514 ESTABLISHEDTCP 127.0.0.1:54840 127.0.0.1:2492 ESTABLISHEDTCP 127.0.0.1:62514 127.0.0.1:54516 ESTABLISHEDTCP 192.168.0.6:2492 65.55.239.100:2492 ESTABLISHEDTCP 192.168.0.6:2492 65.55.248.110:2492 ESTABLISHEDTCP 192.168.0.6:54527 64.12.25.26:5190 ESTABLISHEDTCP 192.168.0.6:54531 205.188.248.163:5190 ESTABLISHEDTCP 192.168.0.6:55163 207.123.44.123:80 CLOSE_WAITC:Users lammle>
Using tcpdump
The tcpdump utility is used to read either packets captured live from a network or packets that have been saved to a file. Although there is a Windows version called windump, tcpdump only works on Unix-like operating systems.
Examples of Using tcpdump
Use this command to capture traffic on all interfaces:
# tcpdump -i any
Here is the command to capture traffic on a particular interface:
# tcpdump -i eth0
And to filter traffic by IP, whether it's the source or the destination, use this command:
# tcpdump host 192.168.5.5
Using the File Transfer Protocol
You already know that File Transfer Protocol (FTP) is a subset of TCP/IP and that FTP is used for the transfer of files. In recent years, FTP has become a truly cross-platform protocol for transferring files. Because Internet (and thus TCP/IP) use has skyrocketed, almost every client and server platform has implemented FTP. Windows is no exception. Its TCP/IP stack comes with a command-line ftp utility.
To start the ftp utility, enter ftp at a command prompt. The result is an ftp command prompt:
C:Users lammle>ftpftp>
From this prompt, you can open a connection to an FTP server and upload and download files as well as change the way FTP operates. To display a list of all the commands you can use at the ftp command prompt, type help or ? and press Enter. To get help on a specific command, type help, a space, and then the name of the command. Here is some output from the help command:
ftp>helpCommands may be abbreviated. Commands are:! delete literal prompt send? debug ls put statusappend dir mdelete pwd traceascii disconnect mdir quit typebell get mget quote userbinary glob mkdir recv verbosebye hash mls remotehelpcd help mput renameclose lcd open rmdirftp>
In the following sections, I'll give you an introduction to uploading and downloading files because every network technician and administrator positively needs to know how to do this. As they come up, I'll go over the specific commands necessary to perform those two operations as well as any commands that relate to those processes. But first, let's look at how to begin the process.
Starting FTP and Logging In to an FTP Server
Of the two FTP file operations (download and upload), the ability to download files is definitely the more crucial for you to have down as a network technician or sys admin. The reason it's so important for you to master is that network and client operating system drivers and patches are located on FTP servers all over the Internet.
The first steps in starting an FTP download session are to determine the address of the FTP site and start the ftp utility. The FTP site typically has the same name as the website except that the first three characters are ftp instead of www. For example, Microsoft's website is www.microsoft.com. Its FTP site, on the other hand, is ftp.microsoft.com. We'll use my personal FTP site as an example for the rest of this section because it works, so I can actually log in to it.
First, start the ftp utility as demonstrated earlier, and then follow these steps:
- At the
ftpcommand prompt, typeopen, a space, and the name of the FTP server, like this:C:Users lammle>ftpftp>open ftp.lammle.comConnected to ftp.lammle.com.220---------- Welcome to Pure-FTPd [TLS] ----------220-You are user number 1 of 50 allowed.220-Local time is now 11:45. Server port: 21.220-IPv6 connections are also welcome on this server.220 You will be disconnected after 15 minutes of inactivity.User (ftp.lammle.com:(none)):enter230 Anonymous user logged inftp>As shown here, if the FTP server is available and running, you'll receive a response welcoming you to the server and asking you for a username. Right now, I just have Anonymous as the username (enabled by default on the FTP server), which means that anyone can log in to it. (By the way, don't bother trying this on my server because I disabled it for obvious reasons as soon as I finished writing this section.)
You can also start an FTP session by typing
ftp, a space, and the address of the FTP server (for example,ftpftp.globalnettraining.com). This allows you to start theftputility and open a connection in one step. Here's an example:C:Users lammle>ftp ftp.globalnettraining.comConnected to ftp.globalnettraining.com.220 Microsoft FTP ServiceUser (ftp.globalnettraining.com:(none)):todd331 Password required for todd.Password:not shown when typed230 User todd logged in.ftp>quit - Enter a valid username, and press Enter.
- Enter your password, and press Enter. (The password won't show up when you type it.)
All good, but if you want to access a private FTP server, as I'll demonstrate in a minute, you'll need to use the username and password given to you by the site's administrator. Oh, and sometimes you can use your email address as a password when accessing a public FTP server with a username like anonymous.
If you enter the wrong username and/or password, the server will tell you so by displaying the following and leaving you at the ftp command prompt:
530 Login IncorrectLogin failed.
This means you've got to try again and must start the login process over. If you're successful, the FTP server will welcome you and drop you back at the ftp command prompt. You're now ready to start uploading or downloading files.
Downloading Files
After you log in to the FTP server, you'll navigate to the directory that contains the files you want. Thankfully, the FTP command-line interface is similar to the DOS command-line interface. This is no surprise because DOS is based on Unix and FTP is a Unix utility. Table 25.8 lists and describes the common navigation commands for FTP. (Remember that these are also case sensitive.)
After you navigate to the directory and find the file you want to download, it's time to set the parameters for the type of file. Files come in two types:
- ASCII, which contains text
- Binary, which is all other files
If you set ftp to the wrong type, the file you download will contain gibberish. So if you're in doubt, set ftp to download files as binary files. Check out Table 25.8.
TABLE 25.8 Common FTP navigation commands
| Command | Description |
|---|---|
ls | Short for list. Displays a directory listing. Very similar to the DIR command in MS-DOS. |
cd | Short for change directory. Works almost identically to the MS-DOS CD command. Use it to change to a different directory and navigate the server's directory structure. |
pwd | Short for print working directory. Displays the current directory on the server. Useful if you forget where you are when changing to several locations on the server. |
lcd | Short for local change directory. Displays and changes the current directory on the local machine. Useful when you are downloading a file and aren't in the directory where you want to put the file. |
To set the file type to ASCII, type ascii at the ftp command prompt. ftp will respond by telling you that the file type has been set to A (ASCII):
ftp>asciiType set to A
To set the file type to binary, type binary at the ftp command prompt. ftp will respond by telling you that the file type has been set to I (binary):
ftp>binaryType set to I
To download the file, just use the get command like this:
ftp>get lammlepress.exe200 PORT command successful.150 Opening BINARY mode data connection for 'scrsav.exe'(567018 bytes).
The file will start downloading to your hard drive. Unfortunately, with its default settings, the ftp utility doesn't give you any indication of the progress of the transfer. When the file has downloaded, the ftp utility will display the following message and return you to the ftp command prompt:
226 Transfer complete.567018 bytes received in 116.27 seconds (4.88 Kbytes/sec)
Uploading Files
To upload a file to an FTP server, you've got to have rights on that specific server. These rights are assigned on a directory-by-directory basis. To upload a file, log in and then follow these steps:
- At the
ftpcommand prompt, typelcdto navigate to the directory on the local machine where the file resides. - Type
cdto navigate to the destination directory. - Set the file type to ASCII or binary.
- Use the
putcommand to upload the file.
The syntax of the put command looks like this:
ftp>put local file destination file
Let's say you want to upload a file called 1.txt on the local server but you want it to be called my.txt on the destination server. To accomplish that, use the following command:
ftp>put 1.txt my.txt
You'll get the following response:
200 PORT command successful.150 Opening BINARY mode data connection for collwin.zip226 Transfer complete.743622 bytes sent in 0.55 seconds (1352.04 Kbytes/sec)
When you're finished with the ftp utility, just type quit to return to the command prompt.
Using the Telnet Utility
Part of the TCP/IP protocol suite, Telnet is a virtual terminal protocol utility that allows you to make connections to remote devices, gather information, and run programs. Telnet was originally developed to open terminal sessions from remote Unix workstations to Unix servers. Although it's still used for that purpose, we now use it as a troubleshooting tool as well. Figure 25.14 shows the basic Telnet interface as it's being used to start a terminal session on a remote Unix host.

FIGURE 25.14 The Telnet utility
In today's Windows environments, Telnet is a basic command-line tool for testing TCP connections. You can telnet to any TCP port to see if it's responding—something that's especially useful when checking Simple Mail Transfer Protocol (SMTP) and HTTP (web) ports.
As you learned back in Chapter 6, “Introduction to the Internet Protocol,” each upper-layer service in a TCP stack has a number for its address. And by default, each network service that uses a particular address will respond to a TCP request on that specific port.
How to Enable Telnet in Windows
Because most people have the Windows 10 operating system running on their PCs these days, it's good to know that, by default, this operating system installs without Telnet available. But there's a way around that one—if you really must have a Telnet client enabled in the Windows operating system, here's how to do it:
- Open Control Panel.
- Select Programs And Features.
- In the left column, select Turn Windows Features On Or Off (get ready for the annoying User Account Control [UAC] prompt, and then enter your name and password).
- Select the Telnet check box (and any other obscure services you may want enabled), and wait while Windows thinks for a while and then reboots.
Nice—now you can go to Start and then type telnet in the Start search box to get a Telnet window to open for you. You can also open a DOS prompt and just type telnet from there. Here are the options that Windows provides with Telnet:
Microsoft Telnet> ?Commands may be abbreviated. Supported commands are:c - close close current connectiond - display display operating parameterso - open hostname [port] connect to hostname (default port 23).q - quit exit telnetset - set set options (type 'set ?' for a list)sen - send send strings to serverst - status print status informationu - unset unset options (type 'unset ?' for a list)?/h - help print help information
Now that we've finished talking about Telnet, my personal recommendation is that you never use it again. What? Yes, you read that right, and here's why.
Don't Use Telnet, Use Secure Shell
What? I just told you how to use Telnet, and now I am telling you not to use it. That's right, don't use Telnet! Telnet is totally insecure because it sends all data in crystal-clear text—including your name and password. And I'm pretty sure you know that's a really bad thing these days. If Microsoft doesn't even enable it on its latest OSs, then you know it really must be insecure.
So if you shouldn't use Telnet, what should you use instead? Secure Shell (SSH) is your answer. It provides the same options as Telnet, plus a lot more; but most important, it doesn't send any data in clear text. The thing is, your servers, routers, and other devices need to be enabled with SSH, and it's not configured by default on most devices.
Some configuration is usually necessary if you want things to work as they really should, and yes, sometimes it's a little painful to get everything running smoothly, but it's all worth it in the long run. Personally, I disable Telnet on all my routers and use SSH exclusively. No lie—I never use Telnet anymore if I can help it. Even so, you should still understand Telnet and get in some practice with it in case you do ever need it.
Summary
In this chapter, you learned about many of the utilities for using and troubleshooting TCP/IP. These utilities include GUI tools like protocol analyzers, throughput testers, and connectivity software like Remote Desktop, and they include command-line utilities like tracert, ping, arp, netstat, nbtstat, ipconfig, ifconfig, and nslookup.
We discussed many of the tools that are used for troubleshooting wireless, wired copper, and optical networks. The commonly used command-line tools for both the Windows and Linux operating systems were introduced, including ping, ipconfig/ifconfig/ip, nslookup/dig, traceroute/tracert, arp, netstat, hostname, route, telnet/SSH, tcpdump par, and nmap.
You also learned how these utilities are used, including their various options and switches and how they all affect the use of the utilities. Finally, you learned about how these utilities work within the TCP/IP suite such as NetFlow analyzers, terminal emulators, and IP network scanners.
Exam Essentials
- Describe some of the GUI tools available to assist in testing and troubleshooting. These include protocol analyzers, bandwidth speed testers, and connectivity software. Understand each product's purpose and how to use it.
- Know how to describe and use the troubleshooting information and statistics that
arpandnetstatprovide for you. Thearputility shows whether an IP address is being resolved to your MAC address (or someone else's, in case of conflicts). Thenetstatutility produces TCP/IP statistics. - Know how to diagnose a network by using TCP/IP's troubleshooting commands. The
pingcommand echoes back if a machine is alive and active on a network. Thetracertcommand shows the path that the ping packets take from source to target. Andtelnetenables a user to participate in a remote text-based session. - Know what the
tracertutility does. Thetracertutility finds the route from your computer to any computer on a network. - Know what the
pingutility does. Thepingutility determines whether a particular IP host is responding. - Know what the
ftputility does. Theftputility allows you to reliably download and upload files from and to an FTP server across the Internet. - Know what the
ipconfigandifconfigutilities do. Theipconfigutility displays TCP/IP configuration information for Windows NT and later operating systems. Theifconfigutility performs a similar function in Linux/Unix environments, in addition to performing certain interface-configuration tasks. - Know what the
nslookupanddigutilities do. Thenslookupanddigutilities allow you to look up DNS resolution information. - Identify
nmapandtcpdump. Whiletcpdumpis a command-line packet capture utility for Linux,nmapis a network reconnaissance tool that can identify live hosts, open ports, and the operating systems of devices. - Describe the use of the
iptablesutility.Iptablesis a firewall utility built for the Linux operating system. It is a command-line utility that uses what are called chains to allow or disallow traffic. When traffic arrives,iptableslooks for a rule that addresses that traffic type, and if none exists, it will enforce the default rule.
Written Lab
You can find the answers to the written labs in Appendix A. Write the answers to the following questions about command-line tools:
- What command can you type from a command prompt to see the hops a packet takes to get to a destination host?
- What tool would you use to verify a complaint about a slow network?
- You need your IP address, subnet mask, default gateway, and DNS information. What command will you type from a Windows command prompt?
- You need to log in as a dumb terminal to a server or Unix host and run programs. What application will you use?
- You need to add a route to your Windows server's routing table. What command will you use?
- You want to log in to a server and transfer files. What application will you use?
- You need to check your name-resolution information on your host. What command will you type from the command prompt?
- You want to use
netstat, but you want to see only the IP address, not the names of the hosts. Which modifier will you use? - You want the IP configuration on a Unix host. What command will you type at the command prompt?
- Which Windows command will show you the routing table of your host or server?
Review Questions
You can find the answers to the review questions in Appendix B.
- Which TCP/IP utility is most often used to test whether an IP host is up and functional?
ftptelnetpingnetstat
- Which TCP/IP utility will produce the following result?
Interface: 199.102.30.152Internet Address Physical Address Type199.102.30.152 A0–ee–00–5b–0e–ac dynamicarpnetstattracertnbtstat
- Which Windows utility can you use to connect to a machine 50 miles away to troubleshoot?
- Remote Desktop
netstatarp- Wireshark
- Which TCP/IP utility might produce the following output?
Reply from 204.153.163.2: bytes=32 time=1ms TTL=128Reply from 204.153.163.2: bytes=32 time=1ms TTL=128Reply from 204.153.163.2: bytes=32 time=1ms TTL=128Reply from 204.153.163.2: bytes=32 time<10ms TTL=128tracertpingWINSipconfig
- Which utility can you use to find the MAC and TCP/IP addresses of your Windows workstation?
pingipconfigipconfig /alltracerttelnet
- Which
pingcommands will verify that your local TCP/IP interface is working? (Choose all that apply.)ping 204.153.163.2ping 127.0.0.1ping localifping localhostping iphost
- Which new Linux command was added recently to configure IP and interface parameters?
nbtstatipconfigipifconfig
- You need to find a NIC's specific MAC address and IP address. Which command-line tool can you use to find this information without physically going to the computer?
pingnbtstatarpnetstatftp
- Which
netstatutility switch displays all connections and listening ports?–a–f-p-t
- Wireshark is an example of a ___________________ .
- Throughput tester
- Protocol analyzer
- Remote connection tool
- IDS
- Which utility produces output similar to the following?
1 110 ms 96 ms 107 ms fgo1.corpcomm.net [209.74.93.10]2 96 ms 126 ms 95 ms someone.corpcomm.net [209.74.93.1]3 113 ms 119 ms 112 ms Serial5–1–1.GW2.MSP1.alter.net [157.130.100.185]4 133 ms 123 ms 126 ms 152.ATM3–0.XR2.CHI6.ALTER.NET [146.188.209.126]5 176 ms 133 ms 129 ms 290.ATM2–0.TR2.CHI4.ALTER.NET [146.188.209.10]6 196 ms 184 ms 218 ms 106.ATM7–0.TR2.SCL1.ALTER.NET [146.188.136.162]7 182 ms 187 ms 187 ms 298.ATM7–0.XR2.SJC1.ALTER.NET [146.188.146.61]8 204 ms 176 ms 186 ms 192.ATM3–0–0.SAN–JOSE9– GW.ALTER.NET [146.188.144.133]9 202 ms 198 ms 212 ms atm3–0–622M.cr1.sjc.globalcenter.net [206.57.16.17]10 209 ms 202 ms 195 ms pos3–1–155M.br4.SJC.globalcenter.net [206.132.150.98]11 190 ms * 191 ms pos0–0–0–155M.hr3.SNV.globalcenter.net [206.251.5.93]12 195 ms 188 ms 188 ms pos4–1–0– 155M.hr2.SNV.globalcenter.net [206.132.150.206]13 198 ms 202 ms 197 ms www10.yahoo.com [204.71.200.75]arptracertnbtstatnetstat
- You are the network administrator. A user calls you complaining that the performance of the intranet web server is sluggish. When you try to ping the server, it takes several seconds for the server to respond. You suspect that the problem is related to a router that is seriously overloaded. Which workstation utility could you use to find out which router is causing this problem?
netstatnbtstattracertpingarp
- Which
ipconfigswitch will display the most complete listing of IP configuration information for a station?/all/renew/release/?
- Which utility will display a list of all the routers that a packet passes through on the way to an IP destination?
netstatnbtstattracertpingarp
- Which Windows TCP/IP utility could you use to find out whether a server is responding on TCP port 21?
tcpportpingnetstattelnet
- Which
arpcommand can you use to display the currently cached ARP entries?arparp –allarp -aipconfig -arparp -ipconfig
- Which command-line tool would best be used to verify DNS functionality in Linux?
netstatnbtstatdigicmparp
- Which of the following
arputility switches perform the same function? (Choose all that apply.)–g–A–d–a
- Which of the following is not a chain type used by
iptables?- Forward
- Backward
- Input
- Output
- Which command captures traffic on all interfaces?
tcpdump -i anytcpdump -i eth0tcpdump host 192.168.5.5tcpdump host all