
Chapter 22
Ensuring Network Availability
In this chapter you will learn about network availability and some of the ways to achieve a stable network. The environmental parameters include heat and humidity and must remain in satisfactory ranges. CPU load and memory utilization cannot exceed a maximum value without the network suffering low-performance problems.
We'll discuss common networking interface issues such as bandwidth; latency, which is the delay incurred as data crosses the network; and jitter, which is the variation in delay.
SNMP is a common and widely used network management protocol and application. SNMP systems use OIDs to identify individual parameters on devices and MIBs to define the data structure on the SNMP management system.
We'll also cover logging. Logging is used to collect, store, and analyze events occurring on the network as reported by the networking devices. Various types of logs can be collected to analyze traffic and audit reporting and general events using a syslog server.
Let's go ahead and get started on ensuring network availability.
Performance Metrics/Sensors
Most of today's modern networking equipment is wired up with sensors that collect very useful data on the health of your network. By effectively collecting, storing, and analyzing this data, you can determine what metrics are in the normal range and, more importantly, take action when they stray outside of the safe zone.
- Temperature When a piece of networking equipment overheats, bad things usually happen (trust me on this). Modern technology platforms have become increasingly dense silicon chips that give off heat that needs to be dissipated. There are elaborate mechanisms in the devices and data centers to remove this heat so they operate in their safe ranges. All devices will come with parameters for both maximum and minimum storage and operating ranges. Sensors in the room, cabinets, and enclosures can report operating temperatures to management systems that can take action if out of range. This can include automatically powering them off, increasing the airflow, or sending out an alert to the staff to take action.
- Central Processing Unit (CPU) Usage It is a good practice to use as much of the CPU cycles as you can. After all, you paid for them, and if they are not used, they are wasted. But wait, there is a line you don't want to cross and that's high CPU utilization. This is part hard science, part vendor recommendations, and part intuition on your part based on your experience. However, if a CPU stays pegged at 90 percent or higher all day long, you are pushing your luck. If a CPU pegs at 100 percent, the operating system or application software may become unstable, leading to failures. It is a good practice to monitor the CPU load and turn off unneeded services or upgrade to a higher-performing platform if required.
- Memory High memory utilization can be as severe as a saturated CPU. The operating system and applications require access to high-speed memory to function. If you run out of memory, the system may crash or have severe performance degradation. You can use your network monitoring tools to monitor memory and alarm if the utilization gets too high.
Network Metrics
Collecting and comparing metrics over time is a valuable exercise. Once a baseline has been established for these metrics, you can determine when an issue has gotten better or worse over time. It also allows you to determine if measures you have taken to improve a scenario have done so.
- Bandwidth In a perfect world, there would be unlimited bandwidth, but in reality, you're more likely to find Bigfoot. So, it's helpful to have some great strategies up your sleeve.
If you look at what computers are used for today, there's a huge difference between the files we transfer now versus those transferred even three to five years ago. Now we do things like watch movies online without them stalling, and we can send huge email attachments. Video teleconferencing is almost more common than Starbucks locations. The point is that the files we transfer today are really large compared to what we sent back and forth just a few years ago. And although bandwidth has increased to allow us to do what we do, there are still limitations that cause network performance to suffer miserably. Let's start with a few reasons why you need to carefully manage whatever amount of precious bandwidth you've got.
You now know that bandwidth is to networking as water is to life, and you're one of the lucky few if your network actually has an excess of it. Cursed is the downtrodden administrator who can't seem to find enough, and more fall into this category than the former. At times, your very sanity may hinge upon ensuring that your users have enough available bandwidth to get their jobs done on your network, and even if you've got a 1 Gbps connection, it doesn't mean all your users have that much bandwidth at their fingertips. What it really means is that they get a piece of it, and they share the rest with other users and network processes. Because it's your job to make sure as much of that 1 Gbps as possible is there to use when needed.
- Latency Most of us have clicked to open an application or clicked a web link only to have the computer just sit there staring back at us, helplessly hanging. That sort of lag comes when the resources needed to open the program or take us to the next page are not fully available. That kind of lag on a network is called latency—the time between when data is requested and the moment it actually gets delivered. The more latency, the longer the delay and the longer you have to stare blankly back at your computer screen, hoping something happens soon.
Latency affects some programs more than others. If you are sending an email, it may be annoying to have to wait a few seconds for the email server to respond, but that type of delay isn't likely to cause physical harm to you or a loved one. Applications that are adversely affected by latency are said to have high latency sensitivity. A common example of this is online gaming. Although it may not mean actual life or death, playing certain online games with significant delays can mean the untimely demise of your character—and you won't even know it. Worse, it can affect the entire experience for those playing with you, which can get you booted from some game servers. On a much more serious level, applications like remote surgery also have high latency sensitivity.
- Jitter Not every packet takes the same route to the destination, so some will be more delayed than others if they travel through a slower or busier network connection. The variation in packet delay is called jitter, and this can have a nastily negative impact on programs that communicate in real time.
Jitter occurs when the data flow in a connection is not consistent; that is, it increases and decreases in no discernable pattern. Jitter results from network congestion, timing drift, and route changes. Jitter is especially problematic in real-time communications like IP telephony and videoconferencing.
SNMP
Although Simple Network Management Protocol (SNMP) certainly isn't the oldest protocol ever, it's still pretty old, considering it was created way back in 1988 (RFC 1065)!
SNMP is an Application layer protocol that provides a message format for agents on a variety of devices to communicate with network management stations (NMSs)—for example, Cisco Prime or SolarWinds Orion. These agents send messages to the NMS station, which then either reads or writes information in the database that's stored on the NMS and called a management information base (MIB).
The NMS periodically queries or polls the SNMP agent on a device to gather and analyze statistics via GET messages. These messages can be sent to a console or alert you via email or SMS.
The command snmpwalk uses the SNMP GET NEXT request to query a network for a tree of information. Each piece of data on the device is identified by a string of numbers called an organizational identifier, or OID for short. For example, end devices running SNMP agents would send an SNMP trap to the NMS if a problem occurs. This is demonstrated in Figure 22.1.
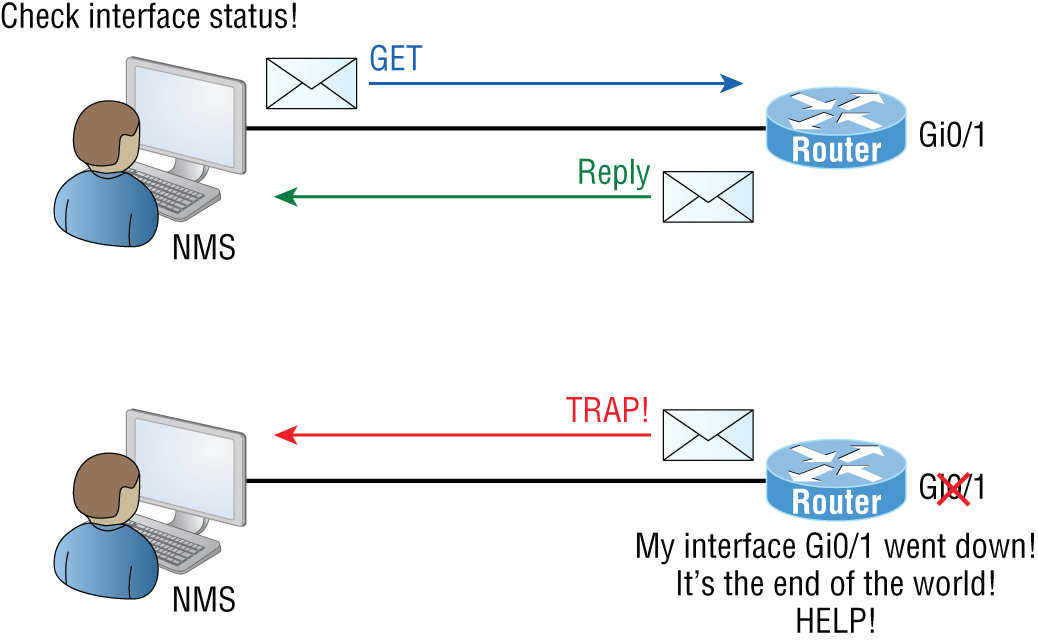
FIGURE 22.1 SNMP GET and TRAP messages
Admins can also use SNMP to provide some configuration to agents as well, called SET messages. In addition to polling to obtain statistics, SNMP can be used for analyzing information and compiling the results in a report or even a graph. Thresholds can be used to trigger a notification process when exceeded. Graphing tools are used to monitor the CPU statistics of devices like a core router. The CPU should be monitored continuously, and the NMS can graph the statistics. Notification will be sent when any threshold you've set has been exceeded.
SNMP has three versions, with version 1 being rarely, if ever, implemented today. Here's a summary of these three versions:
- SNMPv1 Supports plaintext authentication with community strings and uses only UDP.
- SNMPv2c Supports plaintext authentication with MD5 or SHA with no encryption but provides GET BULK, which is a way to gather many types of information at once and minimize the number of GET requests. It offers a more detailed error message reporting method, but it's not more secure than v1. It uses UDP even though it can be configured to use TCP.
- SNMPv3 Supports strong authentication with MD5 or SHA, providing confidentiality (encryption) and data integrity of messages via DES or DES-256 encryption between agents and managers. SNMPv3 Security with 256-bit AES encryption is available in many products today. AES-256 enhances encryption capabilities of SNMPv3 beyond the SNMPv3 standard. Some network devices, including most Cisco devices, support SNMP with 256-bit AES. Some other devices do not. The net-snmp agent does not support AES-256 with SNMPv3/USM. While most operating system platforms like Windows, Linux, and FreeBSD do not support it off-the-shelf, there are third-party SNMPv3 agents available for these platforms that support SNMPv3 with AES-256. GET BULK is a supported feature of SNMPv3, and this version also uses TCP.
Network Device Logs
All network devices will record events taking place that offer invaluable information to us network engineers. In this section, we will look at logging with reviews, specific logs of traffic flows, and logs that are used for auditing your network, and we'll end with the most widely used method of logging called the syslog.
- Log Reviews Generating a mountain of logging data does no good if you never review it and look for critical information on the health of your network. There are many amazing tools offered by commercial companies, tools such as Splunk and Cisco Tetration that analyze log data for very useful information. These tools can establish benchmarks and detect anomalies. Tools such as Kibana can mine your data and supply visualizations in many different formats that are good for monitoring dashboards and making pretty reports.
- Traffic Logs By collecting traffic logs at various points in your network, you can collect the needed data to establish baselines and monitor for events that exceed the baselines. Also, storing traffic logs allows you to search for events based on the time of day or user session. Network management systems can be configured to send out warnings if traffic utilization is outside of standard boundaries.
- Audit Logs By saving log data and using business intelligence tools in the data lake, you can provide audit reports configured to meet your needs. Many devices can export specific data and reports to meet general audit log requirements.
- Syslog Reading system messages from a switch's or router's internal buffer is the most popular and efficient method of seeing what's going on with your network at a particular time. But the best way is to log messages to a syslog server, which stores messages from you and can even time-stamp and sequence them for you, and it's easy to set up and configure! Figure 22.2 shows a syslog server and client in action.
Syslog allows you to display, sort, and even search messages, all of which makes it a really great troubleshooting tool. The search feature is especially powerful because you can use keywords and even severity levels. Plus, the server can email admins based on the severity level of the message.
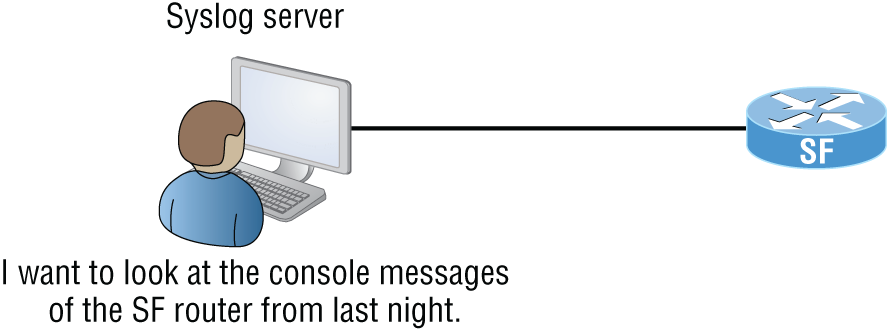
FIGURE 22.2 Syslog server and client
Network devices can be configured to generate a syslog message and forward it to various destinations. These four examples are popular ways to gather messages from Cisco devices:
- Logging buffer (on by default)
- Console line (on by default)
- Terminal lines (using the
terminal monitorcommand) - Syslog server
As you already know, all system messages and debug output generated by the IOS go out only the console port by default and are also logged in buffers in RAM. And you also know that routers aren't exactly shy about sending messages! To send message to the VTY lines, use the terminal monitor command.
So, by default, we'd see something like this on our console line:
*Oct 21 17:33:50.565:%LINK-5-CHANGED:Interface FastEthernet0/0,changed state to administratively down*Oct 21 17:33:51.565:%LINEPROTO-5-UPDOWN:Line protocol onInterface FastEthernet0/0, changed state to down
And the router would send a general version of the message to the syslog server that would be formatted something like this:
Seq no:timestamp: %facility-severity-MNEMONIC:description
The system message format can be broken down in this way:
- seq no This stamp logs messages with a sequence number, but not by default. If you want this output, you've got to configure it.
- timestamp Date and time of the message or event.
- facility The facility to which the message refers.
- severity A single-digit code from 0 to 7 that indicates the severity of the message. (See Table 22.1 for more information on the severity levels.)
- MNEMONIC Text string that uniquely describes the message.
- description Text string containing detailed information about the event being reported.
The severity levels, from the most severe to the least severe, are explained in Table 22.1. Informational is the default and will result in all messages being sent to the buffers and console.
Understand that only emergency-level messages will be displayed if you've configured severity level 0. But if, for example, you opt for level 4 instead, level 0 through 4 will be displayed, giving you emergency, alert, critical, error, and warning messages too. Level 7 is the highest-level security option and displays everything, but be warned that going with it could have a serious impact on the performance of your device. So always use debugging commands carefully with an eye on the messages you really need to meet your specific business requirements!
TABLE 22.1 Severity levels
| Severity Level | Explanation |
|---|---|
| Emergency (severity 0) | System is unusable. |
| Alert (severity 1) | Immediate action is needed. |
| Critical (severity 2) | Critical condition. |
| Error (severity 3) | Error condition. |
| Warning (severity 4) | Warning condition. |
| Notification (severity 5) | Normal but significant condition. |
| Information (severity 6) | Normal information message. |
| Debugging (severity 7) | Debugging message. |
Interface Statistics/Status
When troubleshooting, I usually take a look at the interface statistics when first investigating an issue. If the link is down, nothing else will work, so it is a good place to start. Most device manufacturers will show interface statistics either in a generalized format showing all of the links or on a highly detailed link statistics page for each individual interface. You can also enter specific commands to drill down to exactly what you are wanting to look at.
- Link State Up/Down Look to see if the physical link is down and also check to see if there is a protocol error causing the link to be down. Also, the link can be forced down by the administrator in the configuration.
- Speed and Duplex There are generally three duplex settings on each port of a network switch: full, half, and auto. In order for two devices to connect effectively, the duplex setting has to match on both sides of the connection. If one side of a connection is set to full and the other is set to half, they're mismatched. More elusively, if both sides are set to auto but the devices are different, you can also end up with a mismatch because the device on one side defaults to full and the other one defaults to half.
Duplex mismatches can cause lots of network and interface errors, and even the lack of a network connection. This is partially because setting the interfaces to full-duplex disables the CSMA/CD protocol. This is definitely not a problem in a network that has no hubs (and therefore no shared segments in which there could be collisions), but it can make things really ugly in a network where hubs are still being used. This means the settings you choose are based on the type of devices you have populating your network. If you have all switches and no hubs, feel free to set all interfaces to full-duplex, but if you've got hubs in the mix, you have shared networks, so you're forced to keep the settings at half-duplex. With all new switches produced today, leaving the speed and duplex setting to auto (the default on both switches and hosts) is the recommended way to go.
For Windows 10, right-click on Ethernet and then select Properties. Click Configure. Click the Advanced tab and set the Ethernet card's Speed & Duplex settings to 100 Mbps Full Duplex.
- Send/Receive Traffic When looking at the interface statistics, it is a good practice to look at the counters of the send and receive traffic. If it is incrementing or not will tell you the current activity and usually the activity in the recent past as well as the total values. By clearing the counters on the interface, you can see current information on the total traffic coming into and out of an interface.
- Cyclic Redundancy Checks (CRCs) By looking at an interface's CRC counters, you can determine if there are any errors on the link. If you see the CRC counter incrementing, you should check the physical interfaces on each end and the cabling interconnecting the interfaces.
- Protocol Packet and Byte Counts Some network devices have the added intelligence to provide detailed information on the traffic flowing through them by reporting protocol-level information. For example, firewalls can provide detailed information on HTTP and HTPS traffic. This can be helpful in troubleshooting protocol-specific problems.
Interface Errors
Your network's main purpose is to send and receive traffic as quickly and error free as possible. By monitoring your interface statistics and knowing the parameters to look for, you can identify and take action to correct the problem before an outage or degradation occurs.
- CRC Errors The cyclic redundancy check (CRC) is used to detect data corruption of a received frame. The network hardware runs a mathematical formula on the received data and the result is a value known as the CRC. This value is then compared to the value received that was calculated by the sender and included in the received frame. If they do not match, you'll receive a CRC error, which means the received data is not good. It would be a good time to check your network cabling and the sending and receiving physical interfaces as the source of the problem.
- Giants We have all been taught that bigger is always better. And while this can be true, it can also create some problems for us. Let us descend into the murky world of giant, baby giant, jumbo, and super jumbo frames. The Ethernet specification clearly calls out that the maximum transmission unit (MTU) of an Ethernet frame is 1500 bytes long. So, what is the problem? Well with all the enhancements and the natural evolution of Ethernet, frames have slowly begun to grow all the way up to 9000 bytes!
The problem arises when a giant frame larger than 1500 bytes tries to cross an interface that is set at the standard MTU of 1500. This clearly does not work! There are two things we can do here: either configure the sending device to that standard MTU size or change the configuration on your network interface to accept a larger MTU. If you have giant or jumbo frames on your network, you will need to make sure that all devices in the data path are configured to accept the larger size.
- Runts It would only make sense that if we can have giants running through our network, we may have a few runts too. The smallest an Ethernet frame can be is 64 bytes. Any frames of data that are smaller than this are not supposed to be there and are called runts. Where do they come from? Well, there should never be runts on your network, and if you see them, they are usually caused by collisions, bad network interface hardware, a buffer underrun, a duplex mismatch, or a software driver bug.
- Encapsulation Errors Data encapsulation means that additional information is added to the frame by the various layers in the OSI stack. Data can be added either before or after the existing data and at the other end of the process it is de-encapsulated by removing that information. This is often called headers and trailers.
An Ethernet frame can be encapsulated into other protocols for transmission, such as VXLAN, OTV, and virtualized networks such as hypervisors and the public cloud. When the software performs the encapsulation, if there is a failure in the process, it is logged as an encapsulation error. This is usually either a configuration problem or an issue with the software performing the process.
Environmental Factors and Sensors
Environmental monitors are designed to monitor the temperature, humidity, power, and air flow in an area or in a device. Temperature and humidity are both critical factors in the health of computing equipment. High temperatures lead to CPU overheating, and shortly thereafter, systems start rebooting.
High humidity cannot be tolerated because it leads to corrosion of electrical parts followed by shorts and other failures. Low humidity sounds good on paper, but with it comes static electricity buildup in the air, which can fry computer parts if it reaches them. Both of these conditions should be monitored.
A temperature and humidity monitor can save you and your precious devices from a total meltdown. By their very nature, networks often include lots of machines placed close together in one or several locations—like server rooms. Clearly, these devices, all humming along at once, generate quite a bit of heat.
Just like us, electronics need to “breathe,” and they're also pretty sensitive to becoming overheated, which is why you'll often need a jacket in a chilly server room. It's also why we need to set up and use temperature-monitoring devices. Twenty years ago or so, these devices didn't send alerts or give off any kind of alarms; they were just little plastic boxes that had pieces of round graph paper to graph temperature. The paper was good for a month, and for that duration, it would just spin around in a circle. As the temperature moved up or down, the pen attached to the temperature coil moved in or out, leaving a circle line around the paper. All of this allowed you to manually monitor the temperature modulation in the server room over time. Although intended to “alert” you when and if there were climate changes, it usually did so after the fact, and therefore, too late.
Today, these temperature/humidity systems can provide multiple sensors feeding data to a single control point—nice. Now we can much more accurately track the temperature in our server rooms dynamically in real time. The central control point is usually equipped with HTTP/HTTPS software that can send alerts and provide alarms via a browser should your server room experience a warming event.
Temperature/humidity monitors also come in a variety of flavors. They vary in size and cost and come in hardware and/or software varieties. The kind you need varies and is based on the size of the room and the number of devices in it. You can even get one that will just monitor your PC's internal heat.
What else will indicate you have a temperature problem in your server room? When you install new servers in a rack and you have network instability and other issues across all the servers in the rack but the power resources and bandwidth have been tested, this would be a good time to check your temperature monitor and verify that the servers are staying cool enough. Another red flag when it comes to environmental issues is a problem that occurs every day at the same time. This could be the time of day when the room temperature reaches the problematic stage.
Baseline
High-quality documentation should include a baseline for network performance because you and your client need to know what “normal” looks like in order to detect problems before they develop into disasters. Don't forget to verify that the network conforms to all internal and external regulations and that you've developed and itemized solid management procedures and security policies for future network administrators to refer to and follow.
In networking, baseline can refer to the standard level of performance of a certain device or to the normal operating capacity for your whole network. For instance, a specific server's baseline describes norms for factors like how busy its processors are, how much of the memory it uses, and how much data usually goes through the NIC at a given time.
A network baseline delimits the amount of bandwidth available and when it is available. For networks and networked devices, baselines include information about four key components:
- Processor
- Memory
- Hard-disk (or other storage) subsystem
- Wired/wireless utilization
After everything is up and running, it's a good idea to establish performance baselines on all vital devices and your network in general. To do this, measure things like network usage at three different strategic times to get an accurate assessment. For instance, peak usage usually happens around 8:00 a.m., Monday through Friday, or whenever most people log in to the network in the morning. After hours or on weekends is often when usage is the lowest. Knowing these values can help you troubleshoot bottlenecks or determine why certain system resources are more limited than they should be. Knowing what your baseline is can even tell you if someone's complaints about the network running like a slug are really valid—nice!
It's good to know that you can use network-monitoring software to establish baselines. Even some server operating systems come with software to help with network monitoring, which can help find baselines, perform log management, and even do network graphing as well so you can compare the logs and graphs at a later period of time on your network.
In my experience, it's wise to re-baseline network performance at least once a year. And always pinpoint new performance baselines after any major upgrade to your network's infrastructure.
NetFlow
What if we could take an X-ray of the traffic flows in your network to see what is connecting where? Well, with NetFlow, now you can! NetFlow can collect more granular information on traffic flows than SNMP is able to. After setting up your network routers, firewalls, and other devices such as VPN concentrators to collect information on the data that flows through them, you send this information over to a NetFlow collector for analysis.
The NetFlow collectors are software management applications running on servers that analyze the received information from your network. They show which devices are talking to each other and what the traffic flows look like; add timestamps, traffic peaks, and valleys; and produce nice charts and graphs of the data flowing through your network. This information is valuable for establishing baselines and troubleshooting. It is also used by the security team to help identify potentially suspicious activity.
The network devices send information such as source and destination IP address and applications such as if the traffic is web or e-mail traffic or from any other application.
Uptime
Uptime is the amount of time the system is up and accessible to your end users, so the more uptime you have the better. And depending on how critical the nature of your business is, you may need to provide four nines or five nines uptime on your network—that's a lot. Why is this a lot? Because you write out four nines as 99.99 percent, or better, you write out five nines as 99.999 percent! Now that is some serious uptime!
Downtime
What can I say… your late-night call comes in right after a network failure. Downtime can be a serious issue, or the impacts can be reduced with a good network design. As we all say, it depends.
All networks will eventually fail, and that is a strike in the downtime column.
High availability is a system-design protocol that guarantees a certain amount of operational uptime during a given period. The design attempts to minimize unplanned downtime—the time users are unable to access resources. In almost all cases, high availability is provided through the implementation of duplicate equipment (multiple servers, multiple NICs, etc.). Organizations that serve critical functions obviously need this; after all, you really don't want to blaze your way to a hospital ER only to find that they can't treat you because their network is down!
One of the highest standards in uptime is the ability to provide the five nines availability I mentioned earlier. This actually means the network is accessible 99.999 percent of the time—way impressive! Think about this. In one non-leap year, there are 31,536,000 seconds. If you are available 99.999 percent of the time, it means you can be down only 0.001 percent of the time, or a total of 315.36 seconds, or 5 minutes and 15.36 seconds per year—wow!
Summary
In this chapter you learned about network availability and some of the ways to achieve a stable network. The environmental parameters include heat and humidity and must remain in satisfactory ranges. CPU load and memory utilization cannot exceed a maximum value without the network suffering low-performance problems.
We discussed common networking interface issues such as bandwidth; latency, which is the delay incurred as data crosses the network; and jitter, which is the variation in delay.
SNMP is a common and widely used network management protocol and application. SNMP systems use OIDs to identify individual parameters on devices and MIBs to define the data structure on the SNMP management system.
Logging is used to collect, store, and analyze events occurring on the network as reported by the networking devices. Various types of logs can be collected to analyze traffic and audit reporting and general events using a syslog server.
Interface statistics report on the health of individual device interfaces and can include that state of the link, speed/duplex, the volume of traffic sent and received, the error rates using CRC checks, and sometimes protocol-specific data.
Interface errors are important to understand, and you should know what jumbo and runt frames are and what an encapsulation error is.
Baselines help you determine what normal operations are and when your network events are outside of what is considered to be normal operation.
NetFlow is an advanced protocol with which network devices send detailed traffic information for NetFlow application data from your devices to a centralized application. That centralized application then reports application and endpoint traffic flow information.
Exam Essentials
- Describe the critical need to monitor environment readings such as the temperature of the networking equipment. Excessive temperature readings can permanently destroy networking hardware and steps must be taken to monitor and react to high temperature conditions.
- Explain why high CPU and memory usage can affect network hardware performance. Both CPU and memory starvation can cause the networking platform to fail, reload, or have unpredictable results when there is not enough available CPU and memory on the platform.
- Describe SNMP. The Simple Network Management Protocol collects, monitors, and reports on the data retrieved from networking devices.
- Know what device logging is and the different uses for collecting log files. The syslog protocol is the standard for collecting events and logs sent from networking equipment. Various logs types include traffic, error, and audit logs. The syslog server stores these logs; each network device can also store logging information locally.
- Describe the various statistics generated by network interfaces. Network interfaces can report that status of a link, whether it is up or down, the speed and duplex, traffic/packet counters, and errors using the CRC checksums.
- Describe the different types of interface errors. Network interface errors include CRC checksum comparison errors indicating the frame has been corrupted. Giant frames are above the standard maximum Ethernet frame size of 1500 bytes and runts are under the minimum frame size of 64 bytes. Encapsulation errors indicate the process of adding or removing header data has failed.
- Know what a baseline is and why it is needed. To determine what is normal on your network, you must collect data in a baseline and then you can track ongoing operations to see if you exceed these values, which may indicate a problem in your network.
- Describe NetFlow. NetFlow is a standardized protocol that sends detailed traffic flow information to a collector station that shows which devices are talking to each other, at what time, and using what applications.
Written Lab
You can find the answers to the written labs in Appendix A. Write the answers to the following questions about statistics, sensors, and network availability.
- Which two device parameters should never reach full utilization?
- What are the average metrics collected over time?
- You want to collect logging data on ongoing operations on a centralized server. What application allows you to do this?
- Which interface operation determines if the data flow is one way or two way?
- In what per-second value are interface speeds recorded?
- You want to log in to a server and transfer files. What application will you use?
- Which interface parameter uses a mathematical calculation to derive errors?
- What is an Ethernet frame that is larger than the standard size called?
- What protocol collects detailed application-level traffic information?
- Which network management protocol is used to poll and collect information from networking devices?
Review Questions
You can find the answers to the review questions in Appendix B.
- What protocol provides detailed information on traffic flows between endpoints?
- Syslog
- SNMP
- NetFlow
- SPAN
- What networking protocol uses OIDs and MIBs for data collection?
- SPAN
- NetFlow
- Syslog
- SNMP
- What is a below-standard frame size called?
- Undercount
- Runt
- Nibble
- Short Frame
- What is one-way traffic flow called?
- Duplex
- Asymmetric
- Half-duplex
- Receive only auto-negotiation
- What is the average of collected metrics called?
- NetFlow
- SNMPv2c
- Management information base
- Baseline
- Syslog
- Which device components should never be allowed to reach full capacity? (Choose two.)
- Memory
- Voltage
- CPU
- Delay
- Which of the following mathematically determines network errors?
- SNMP
- NetFlow
- CRC
- Syslog
- What protocol is used to poll and collect information from networking devices?
- SPAN
- NetFlow
- Syslog
- SNMP
- What is the term for when a segment of data fails the addition or deletion of header information?
- Encapsulation error
- CRC
- NetFlow
- Frame reject
- What are two environmental variables that are commonly monitored? (Choose two.)
- Temperature
- Airflow
- Humidity
- Utilization
- Baselines commonly include which of the following?
- Processor
- Memory
- Storage subsystems
- Wired/wireless utilization
- All of the above
- What are two metrics that are tracked to account for utilization in operations?
- Syslog
- Uptime
- Downtime
- SNMP
- What is a system-design protocol that guarantees a certain amount of operational uptime during a given period?
- High availability
- Redundancy
- Hot standby
- Backup systems
- What is bi-directional traffic flow across an Ethernet interface?
- Full-duplex
- Two-way
- Duplex
- Symmetric
- What syslog severity level denotes that the system is unusable?
- Emergency
- Alert
- Critical
- Error
- What protocol is commonly used to collect audit information?
- SNMP
- NetFlow
- Syslog
- Kibana
- Which SNMP version added support for GET BULK operations?
- SNMPv1
- SNMPv2a
- SNMPv2c
- SNMPv3
- What is the variation in delay?
- Jitter
- Bandwidth variance
- Latency
- Egress latency
- What is end-to-end delay?
- Jitter
- Bandwidth variance
- Latency
- Egress latency
- Resource starvation of which of the following can cause a networking device to fail? (Choose two.)
- Memory
- bandwidth
- CRC utilization
- CPU utilization