
CHAPTER 3
Contracting and Project Outcomes: The Common Strategies
In this chapter we will define and present the project results for the four most common approaches to contracting engineering and construction services for industrial projects. One of these approaches has three forms, bringing the total number of strategies examined to six. These strategies account for about 80 percent of all industrial projects. Then we will discuss the advantages and disadvantages associated with each form. We will explore the underlying reasons they behave the way they do in Chapter 4.
The Key Performance Indicators and Their Measurement
We will discuss these six measures of project success:
- Construction safety
- Cost competitiveness
- Cost predictability
- Schedule competitiveness
- Schedule predictability
- Cycle time competitiveness
We will also discuss one other outcome that is significant for only one type of contract—startup and operability are poorer for EPC‐LS projects than for any other contract type. After controlling for the use of new technology, there are no significant differences in startup and operability among the other contract types.
Construction safety is described by three measures: the recordable incident rate (recordables), the days‐away‐from‐work/restricted work/job transfer rate (DARTs), and fatalities.1 Safety statistics follow a Poisson distribution in which a good many observations have zero in any category. Therefore, we examined the probability that an accident of a particular type (recordable, DART, or fatality) would occur for a project using a particular type of contracting strategy.
Cost competitiveness measures the capital cost of a given project versus other projects installing equivalent facilities. After normalization of costs, described in Chapter 2, cost competitiveness is measured using a number of statistical models: cost‐capacity models compare the cost as a function of output capacity and technical characteristics of a facility. Cost‐effectiveness models compare the efficiency of installing a given scope. Different models are used for different types of facilities (e.g., continuous chemical process plants, machine installation projects, batch process facilities, and so forth). Finally, costs are compared against like‐for‐like facilities in the IPA databases described in Chapter 2. We display cost effectiveness in the form of an index in which 1.0 is equal to industry average. Cost indices below 1.0 are more cost effective, and those above less so.
For facilities producing commodity products, that is, products that are sold primarily based on price rather than unique product characteristics, cost competitiveness is the single most important measure of project success provided that operability is not compromised. Companies that spend more capital to produce a commodity product than their competitors generate an inferior return on capital and are eventually forced out of business, usually through acquisition by a better competitor.
Although cost competitiveness is the single most important factor for commodity companies, it is often not seen as most important for a commodity project by the business sponsor of the project.2 That business sponsor may be more interested in speed or in avoiding any overrun than in cost effectiveness. Although there are times when a commodity project must be schedule‐driven,3 most schedule‐driven commodity projects are schedule‐driven for the interests of the particular business or business sponsor, not the corporation and its shareholders.
Cost predictability is simply whether a project overruns or underruns its authorization cost estimate. Perhaps not so simply, the actual cost and the estimated cost have been reconciled for changes of scope,4 location adjusted, and adjusted for inflation (escalation in project parlance) and for fluctuations in currency values. Only then is the ratio of actual‐to‐estimated costs calculated.
Schedule competitiveness is the time counterpart of cost competitiveness—how long did it take to execute5 the project relative to other projects of similar scope and size. Except in the most unusual of circumstances, projects should never be executed slowly. Some costs are simply a function of time, such as project management costs. More importantly, economic value is always time‐dependent. In certain industry sectors such as pharmaceuticals and consumer products, time can make or break the economic result. When market share is dependent on beating others to market, time and value are almost synonymous.
Schedule predictability is the measure of the time required for execution relative to the amount of time promised at authorization expressed as a percentage of promised time. The only adjustments made are for unusually bad weather striking the site during construction, force majeure events, or pandemic, such as COVID‐19. The priority attached to schedule during the front‐end development of a project (which is the period that matters most) differs by industrial sector, but in ways that are not entirely intuitive. Figure 3.1 shows the percentage of capital projects by sector for which schedule is the most sought after result as determined by the business sponsoring the project.
It makes sense that the sector with the most interest in schedule is pharmaceuticals because getting a drug to market in a timely way and ahead of the competition is often key to profitability. What is less obvious is why the minerals mining sector is almost the equal of pharma in putting schedule first. From an economic perspective, such schedule emphasis by minerals makes no sense. When one considers that the mining sector is the industry most characterized by internal competition for capital and poor project governance, the importance of schedule is more understandable, but not commendable. The other surprise is that consumer products lags all other sectors in schedule prioritization. Oil and gas projects put schedule first in just over one‐third of projects—about the same percentage as petroleum refining. The average is somewhat misleading for petroleum production because the percentage of schedule‐driven projects is very sensitive to the oil price at the time of authorization. Note as a matter of logic, by the way, that schedules should not be sensitive to market prices because the price cycle is usually shorter than the project execution and startup time. The same is true for major projects in refining and chemicals, but that reality does not often change behavior.
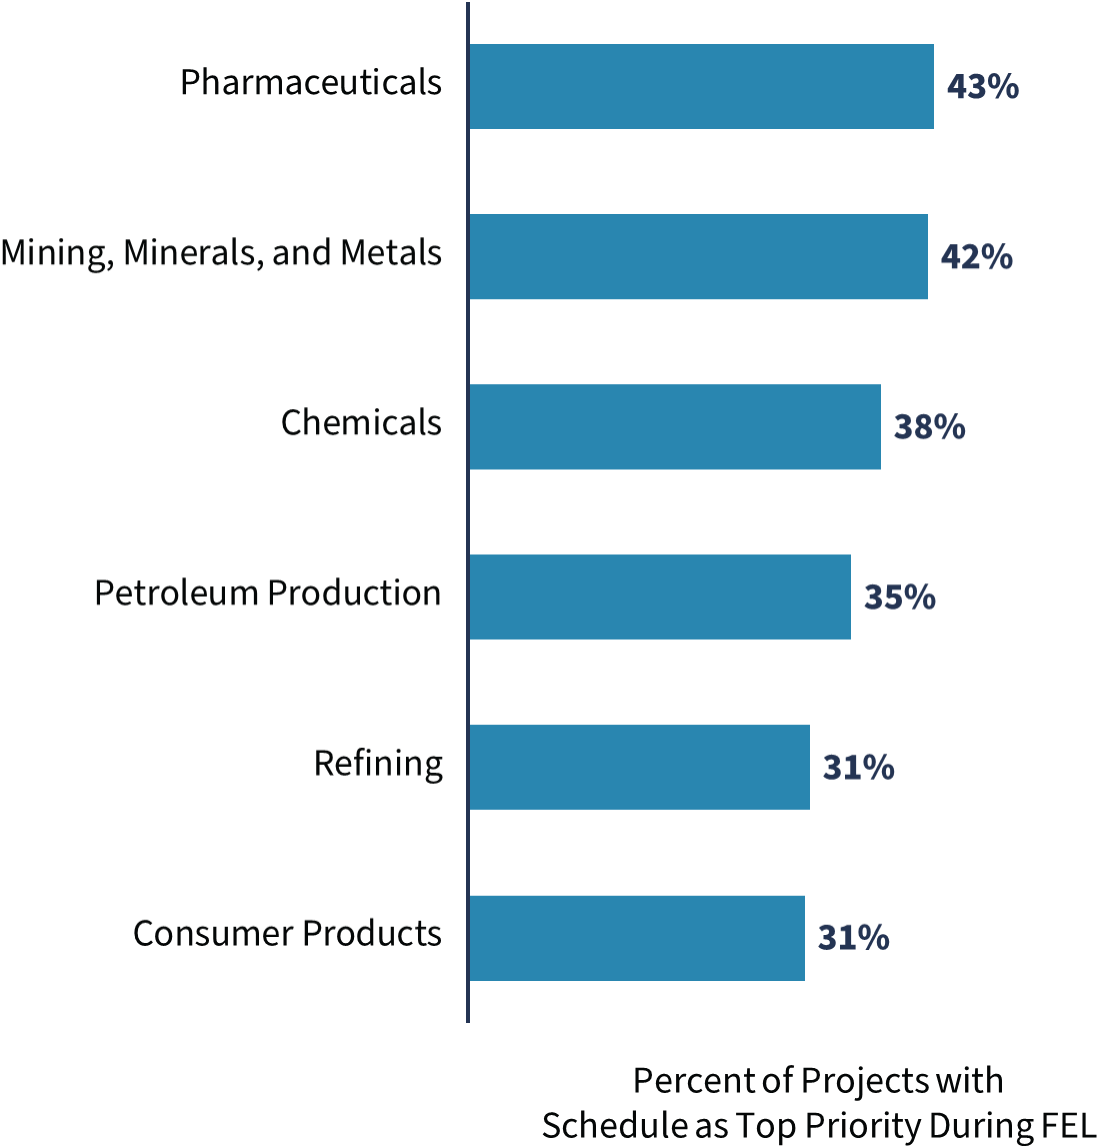
FIGURE 3.1 What industries prioritize schedule during FEL?
I raise the issue of schedule because schedule is one of the factors that guides decision‐making around contracting approach. Some contracting approaches have a degree of schedule flexibility, while others do not. We will come back to the issues of cost and schedule priorities throughout the book.
Cycle‐time competitiveness is our last measure of project outcomes. The cycle‐time clock starts when the business charters a team to start scope development for a new capital project and stops when the resulting facility is in steady‐state running (i.e., at the end of startup). Cycle time measures how long it takes a business idea to be translated into a business asset. Holding all driving factors, such as project size and complexity constant, cycle time has much more variance from project to project than execution time. The variation comes from the front‐end loading time. As Figure 3.2 shows, the front‐end loading time is driven by priority given to schedule by the business sponsor. When schedule pressure is highest, front‐end loading is accomplished in about 86 percent of industry average time. As schedule priority declines, the front‐end loading duration increases significantly. Unfortunately, the quality of front‐end loading tends to decline as schedule priority increases (Pr.|t|<.03), and the probability that the owner team was fully staffed during FEL declines even more significantly (Pr.|z|<.002).
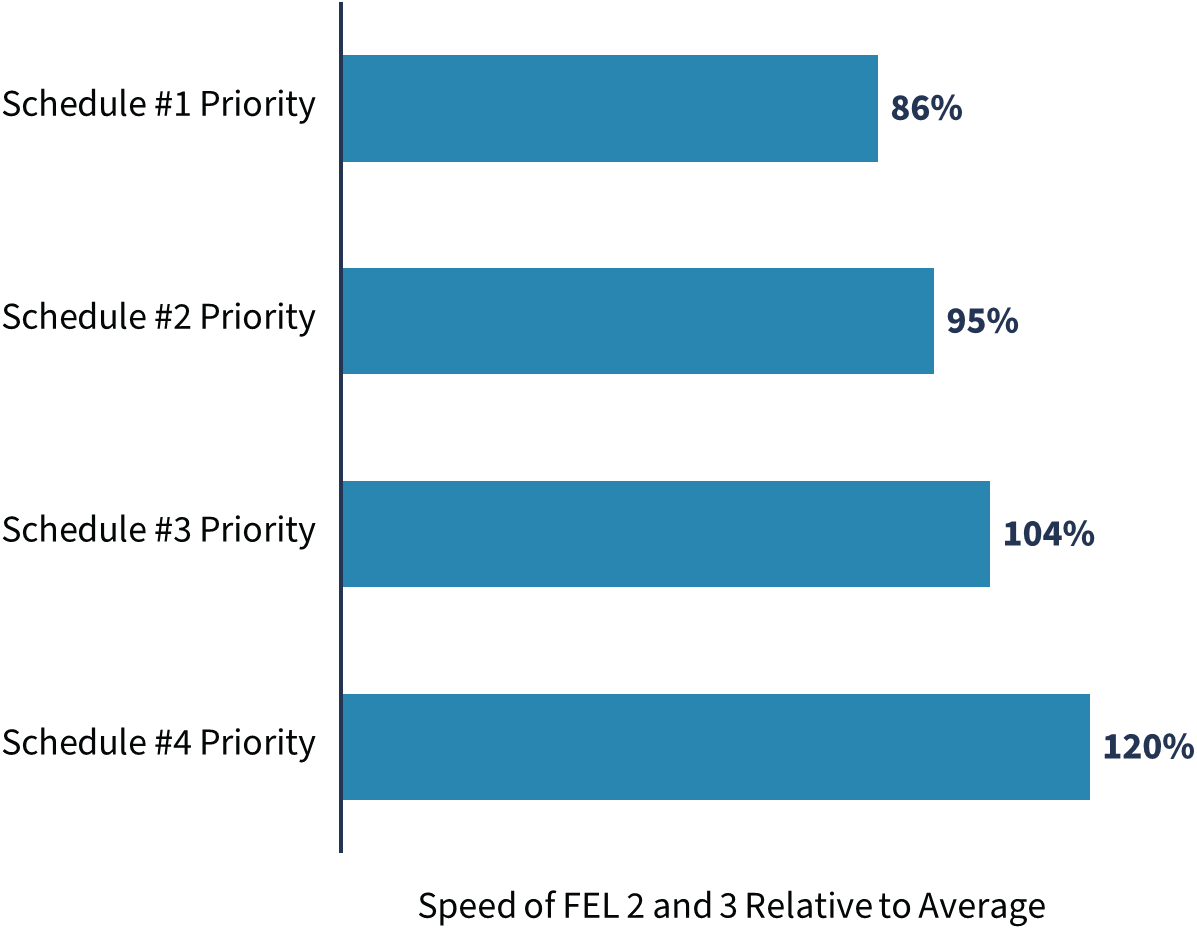
FIGURE 3.2 Front‐end time responds to schedule priority.
Most of those who write about contracting strategy tend to emphasize the payment scheme over everything else—is it lump‐sum or some form of reimbursable? When one says, “It is an EPC contract,” many project folks assume that means EPC lump‐sum. When I say EPC, I mean the particular contractor did engineering, procurement, and construction management and construction. After I understood whether the project is EPC, I would want to know whether the EPC contractor also undertook FEED as part of stage 3. The compensation scheme would be my next concern, not my first. For reasons that will become more obvious as we work through outcomes, I tend to think that structure is more important than compensation in a number of ways. By structure, I mean how many phases of the work are given to a particular contractor, not how they are paid.
We now define the six most commonly practiced contracting strategies for industrial projects. The first three are the EPC strategies. They involve a single contractor leading the execution of a project from the start of execution (or before if the same contractor performed FEL‐3) through to the end of the project. That EPC contractor may be responsible for the entire project or may be one of a number of contractors working on the project, each executing their particular scope assignments. The second three contract strategies are the split forms. The split forms transition from a contractor who performs engineering and procurement (EP) to a different contractor or set of contractors who manage and perform construction. That EP contractor usually performs FEL‐3 (FEED) as well.6
The Primary EPC Options
The three primary EPC options—EPC lump‐sum, EPC reimbursable, and EPCM—are defined and described in the following sections. Together they constitute 55 percent of our sample and probably make up a larger percentage of industrial project contracting approaches generally.7
Traditional Engineer‐Procure‐Construct‐Lump‐Sum (EPC‐LS) aka Design Build
The traditional and most common form of EPC‐LS entails hiring an engineering contractor to execute front‐end engineering design that carries the engineering through the development of piping and instrumentation diagrams that are ready for detailed design to start. Of course, all plot plans and equipment arrangements are complete, and the electrical single‐lines are complete. In a thorough FEED, all of the engineering for the “outside battery limits” (i.e., outside the main processing areas) is brought to the same level of detail as the inside battery limits portion. The FEED contractor generally performs under a reimbursable contract, although lump‐sum payment schemes for FEED are not unknown.8 When the FEED work is complete, it is combined with the project planning work to form the technical basis for an invitation to bid (ITB) that is sent to a set of prequalified EPC contractors who have already agreed that they are interested in bidding on the project scope. It is customary not to invite the FEED contractor to bid for fear that doing so would discourage other bidders who may believe that the FEED contractor has an insider's advantage.
The owner's issuance of the ITB is generally followed by rounds of questions and requests for clarifications from potential bidders. The size and complexity of the project and the quality of the FEED package drive the number of question rounds required.9 The contractors who elect to bid submit their bids, which are then evaluated by the owner team. Owners often use a two‐step process in which the technical submissions are opened, evaluated, and ranked first, and then the commercial (price) bids are opened. The owner selects a winner and a second‐place contractor and then negotiates those terms and conditions to which the winner took exception, as well as other elements of the technical submission or commercial bid. This process can take anywhere from a few months for a simple project to as many as 18 months for a megaproject. On large projects, the scope is often divided into packages that are subject to separate EPC‐LS competitions. We call this EPC‐LS multi‐prime.10
Projects employed traditional EP‐LS as their primary contracting strategy in 19 percent of the projects in our sample. More than half of the EPC‐LS projects were in the Middle East or Asia, where two‐thirds and one‐third of our samples, respectively, were EPC‐LS. It is a less common form elsewhere in the world, but the form is used for some industrial projects in every geography in our sample. Australia and Canada are the only locations where EPC‐LS is uncommon, although still employed occasionally. The fact that EPC‐LS is so uncommon in Canada and Australia is instructive. Both are large, thinly populated countries with more industrial projects than their size would suggest. Neither country welcomes imported labor. As a result, both countries are easily over‐heated construction markets. That makes EPC‐LS a disadvantaged form because EPC‐LS in a hot market environment draws a substantial risk premium from lump‐sum bidders.
EPC‐LS contracts are what I call the perfectly cost‐incentivized contract. One hundred percent of all savings on the project, no matter how they are generated, accrue to the EPC contractor rather than the owner. All of any overspend, unless it is generated by owner changes or force majeure, also accrue to the contractor. Every owner knows this, but they often behave as though it is not true. We will discuss this in Chapter 8.
EPC Reimbursable (EPC‐R)
This form is actually almost always FEED EPC‐R where the FEED contactor continues on into execution and does all of the work on some form of reimbursable compensation. The most common compensation scheme is payment for hours plus overheads and fringes for engineering and construction and procurement at cost with a small procurement fee. Generally, profit is in the form of a fixed fee, and the fee is sometimes adjusted upward or down by various incentive schemes. On occasion, some parts of construction may be contracted to disciplinary subcontractors. For example, it is not uncommon for site preparation and other civil work to be done by a sub. But the basic form remains. Typically, the EPC contractor will execute construction with directly hired labor, and the EPC will undertake all aspects of construction management down to and including the gang foreperson.
The EPC‐R form is less popular today than it was 20 years ago. I suspect that the EPC contractors have actually driven the change as they have come to prefer EPCM, which imposes fewer construction management burdens on them. EPC‐R comprises less than 7 percent of our sample, and almost half of those projects are located in the United States and Canada. The remainder are scattered lightly around the word. And EPC‐R is not even particularly popular in the United States—only 9 percent of industrial projects use the form. But it is very unpopular elsewhere.
Engineer‐Procure‐Construction Management (EPCM)
EPCM is now the world's most common form of contracting for industrial projects. It has become dominant in Western Europe as in‐house engineering and procurement have waned over the past two decades. It is the preferred form in much of South America and completely dominates industrial contracting in on‐shore Australia. It is marginally the most popular form in the United States, which tends to be more eclectic in contracting than other regions. Perhaps most surprising, EPCM has become the “go‐to” form in much of Asia, whereas EPC‐LS used to be the norm just 20 years ago.
Like EPC‐R, EPCM avoids any transition of contractor responsibilities from the start of FEED all the way through to the completion of facilities. If the FEED contractor is not selected to continue on into detailed engineering, it is all but certain that the reason is that the owner and the contractor are not getting along. Unlike EPC‐R, construction is executed by a different contractor or contractors but under the supervision of the EPCM. Most common is the use of disciplinary construction contractors rather than a general contractor for construction. The great majority of EPCM contracts are reimbursable for the EPCM's activities.11 The compensation scheme for constructors may be lump‐sum, time and materials or reimbursable hours, or unit rates.
Split Form Contracting (aka Design‐Bid‐Build)
Split form contracting entails the contractual and organizational separation of construction activities from engineering and procurement with the use of different firms. The only construction activities of the F‐EP firm are to answer questions about its design; they have no role whatsoever in construction management. In split forms, the procurement activities of the EP firm are generally confined to major equipment and engineered materials. Nonengineered materials are typically procured by the constructor(s). Like EPC‐R and EPCM, split forms are almost always feed‐engineer‐procure contracts. It is rare to “change horses” at the FEED to execution point in split forms. Split forms share that advantage with F‐EPC‐R and F‐EPCM.
Split forms come in four varieties in terms of compensation, only the first three of which are well enough populated to justify discussion.12
- Reimbursable FEP followed by lump‐sum construction (Re/LS)
- Reimbursable FEP followed by reimbursable construction (Re/Re)
- Lump‐sum EP following by lump‐sum construction (LS/LS)
The outcomes of these three forms are sufficiently different that they merit some individual treatment. The last form (LS/LS) is usually preceded by reimbursable FEED, but sometimes the FEED is also lump‐sum. In either case, the contractor that will ultimately do execution EP performs FEED. Also included in these groups are instances in which the owner did FEED and detailed engineering in‐house. In some of these cases, the owner also did construction management. Strictly speaking, that should be classified as EPCM. However, the projects do not behave like EPCMs but like split forms. The reasons for this are discussed at some length in Chapter 4.
Contracting Strategies and Project Results
Contracting strategy is not the most important factor driving project outcomes. The contracting strategy is clearly less important than a strong rationale for the project, a strong and functionally representative owner team, and thorough project preparation. Also, there is no contracting strategy that does not result in some great projects and some miserable ones. But it is not usually the contracting strategy that determined that result. Nonetheless, contracting strategy is important for some project results and most especially for the cost competitiveness of a project.
Part of the decision process for selecting a contracting strategy is how the strategy fits with the priorities of the project. The conventional wisdom is that one should not select EPC‐LS if schedule is very important; one should opt for EPC‐R or EPCM instead. The conventional wisdom says that one should avoid EPC‐LS for projects that involve new technology and again opt for EPC‐R or EPCM forms.
When we actually look at the data, it appears that project characteristics play a minor role at best in the selection of contract strategies. When schedule is the top priority for the project, the use of EPC‐LS drops from 19 percent to 17 percent. The lack of EPC‐LS sensitivity to project characteristics is expected because EPC‐LS is the mandated form in a number of countries and therefore cannot be sensitive to project characteristics. There is, however, a significant change in the use of EPCM when schedule is top priority—from 28 percent of the time to 34, but the added EPCMs come mainly from Re/LS, not from EPC‐LS.
When we introduce any level of new technology in projects—even simple things such as new integrations of fully commercial technology—the use of EPC‐LS declines very substantially, from 20 percent in the case of purely off‐the‐shelf technology to 11 percent when anything new is being done. We can see this change in the data because almost none of our new technology projects were executed in mandatory EPC‐LS countries. The beneficiary of the drop in lump‐sums was EPCM, which makes up 36 percent of projects with any degree of new technology. While the movement away from EPC‐LS is altogether understandable, the move to EPCM may be less so. EPCMs with new technology perform markedly worse than some split forms in every outcome.
Contract Type and Safety Performance
For project managers, owner and contractor alike, the greatest burden that most feel is their responsibility is that everyone who works on the project will return home safely every evening. Safety is driven by the quality of the safety program operating on the project and a high degree of collaboration on safety between the owner and the contractors. Unless both owner and contractor “walk the talk,” safety suffers. When safety incidents occur, the owner must be willing to inconvenience the project to make the point that safety matters.
When looking at the relationship between contracting approach and safety, it appears that EPC‐LS is the safest form of contracting with respect to recordable injuries and DART cases, but is strangely 50 percent more prone to fatalities. When looking at very large numbers of field construction hours, the relationships among recordables, DARTs, and fatalities are quite regular. This is because if projects experience lots of recordables, DARTs and eventually fatalities will result. This is why many companies with strong safety programs often focus their attention on first‐aid cases—the level below recordables—as the precursors to recordables and beyond. Therefore, to find a large group of projects with fewer recordables and DARTs but many more fatalities would seem to be an aberration.
Unfortunately, it is not. Rather, it reflects the strength and enforcement of the reporting requirements. Figure 3.3 shows the reported accident rates for our three safety statistics when dividing the world into strong reporting regions—Western Europe, the United States, and Canada—and weak reporting regions—Asia, the Middle East, Russia, and Central Asia.13
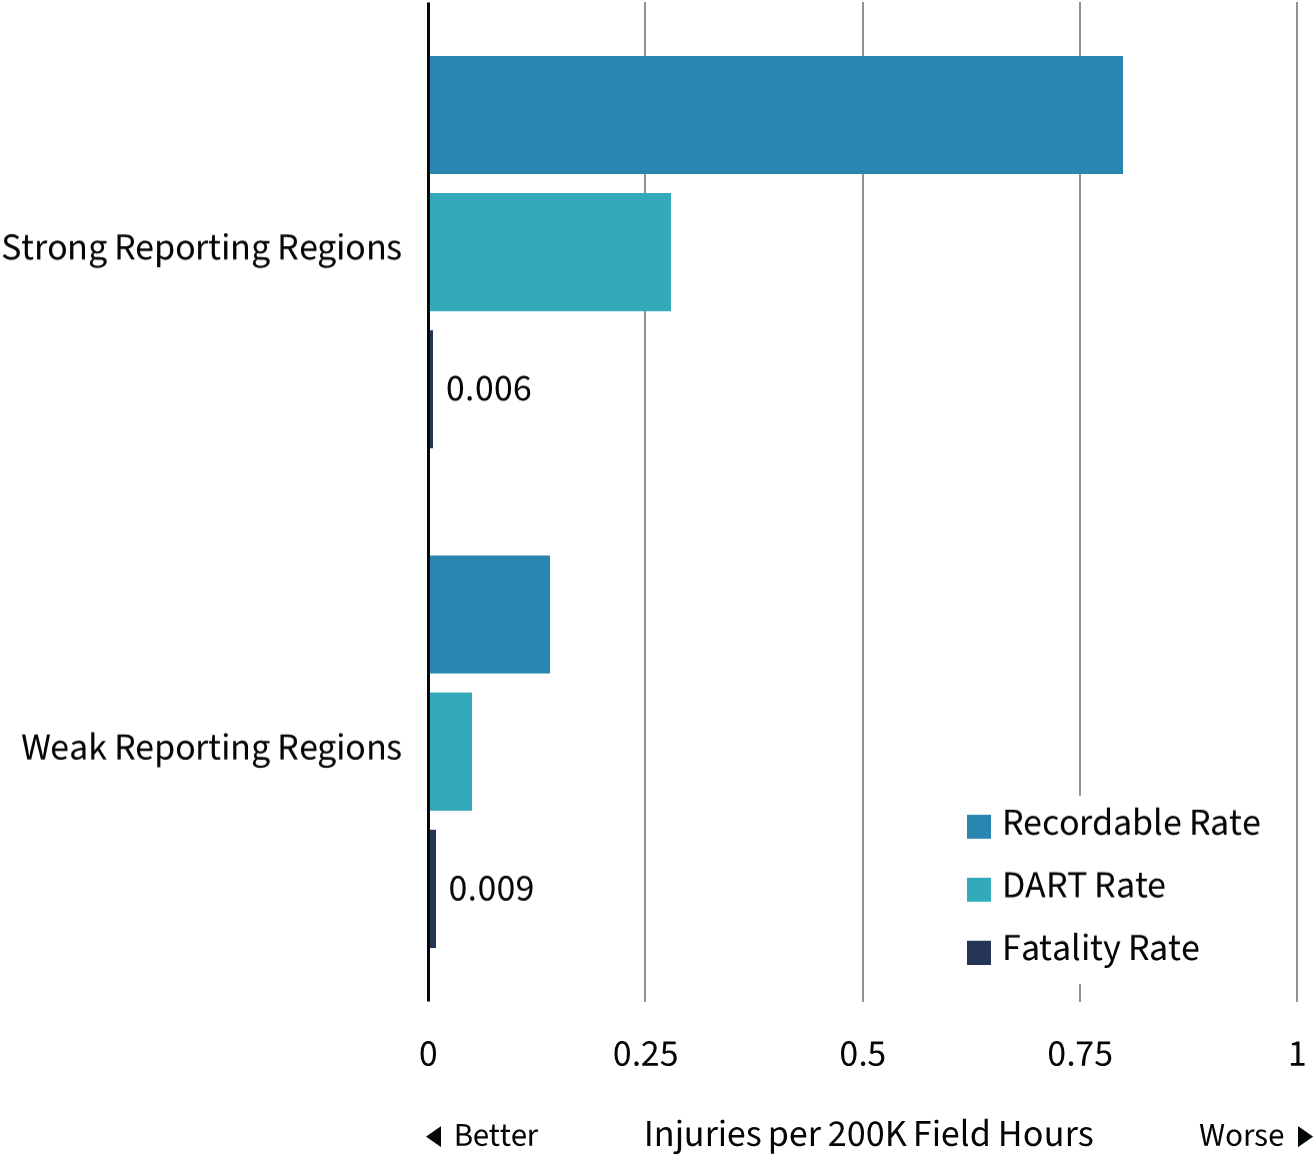
FIGURE 3.3 Reporting rates distort safety results.
Remarkably, it appears that the strong reporting regions, which also are regions of higher average craft skill level and productivity, are many times more dangerous than the weak reporting regions. Obviously, that is nonsense. EPC‐LS appears safer because it is much more common in the weak reporting regions. The matter of the 50 percent higher fatality rate is explained by the fact that fatalities are the one type of accident that is very hard to hide.
Construction safety is quite different in the various industrial sectors represented in our database. The pattern of safety shown in Figure 3.4 from our data corresponds to what IPA has seen in overall safety performance of the industrial sectors for many years: mining, pharmaceuticals, and consumer products experience many more safety incidents per 200,000 hours worked than petroleum refining or chemicals.14 The higher rates in the mining industry perhaps reflect inherently less safe working conditions. Pharma and consumer products, however, have no such excuse. Pharma and consumer products firms tend to have less corporate focus on capital projects than their counterparts in chemicals and petroleum, which are much more capital‐intensive sectors. Those weaker project organizations play out as less able to mount and implement effective safety programs.
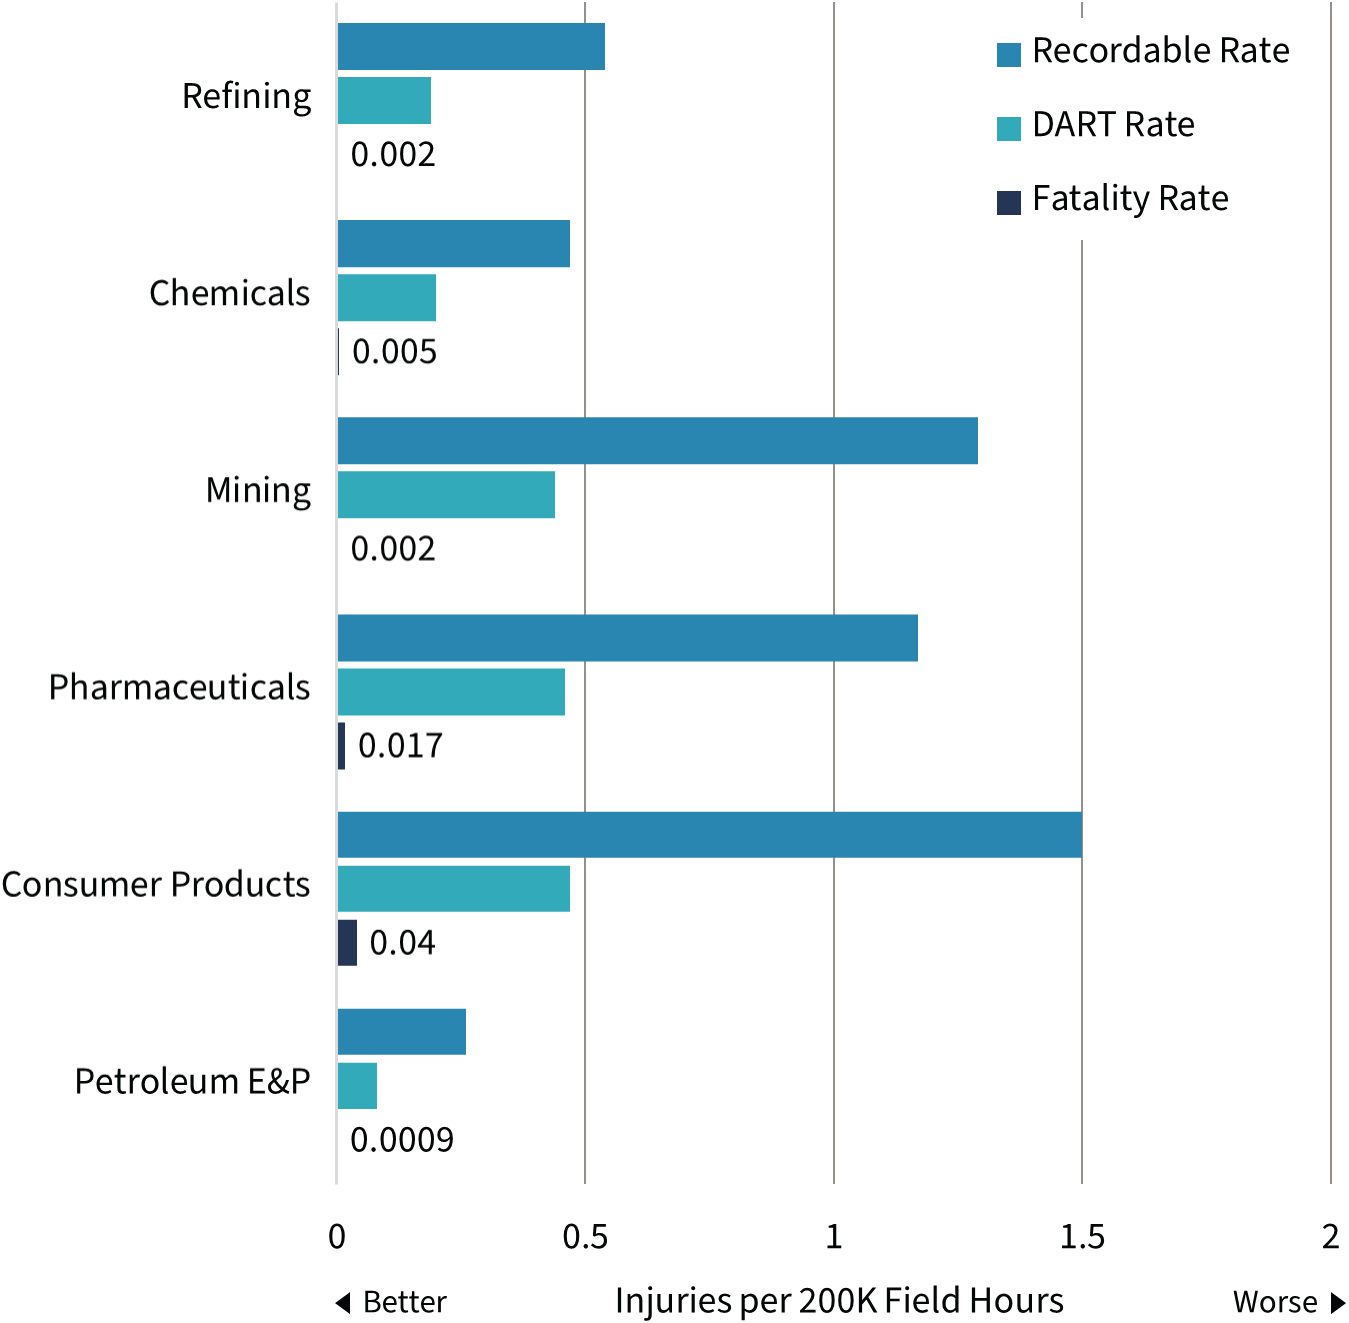
FIGURE 3.4 The industrial sector drives safety outcomes.
The upshot is that when we control for industrial sector and regional reporting standards, there is no relationship between contracting approach and the safety of the workers constructing the facilities. The only surprise is that EPC‐LS is not clearly less safe than other forms, because owner involvement in execution may be less in the EPC‐LS projects.
Cost Competitiveness and Cost Predictability
Most industrial projects (76 percent of our sample here) make commodity products, that is, products that are successful in the marketplace mostly or completely on the basis of price rather than unique characteristics. In other words, these products have to compete with more or less identical products made by others. Consequently, in commodities the most important outcome of a capital project is cost, subject only to good operability. Of the controllable factors that drive returns on investment, cost is far more important than schedule in commodity products.15 In smaller projects that can be executed quickly (e.g., in 18 months or less), schedule may be important in grabbing a customer or catching an upcycle in prices. But in larger projects, market timing is a fool's game because our ability to accurately forecast ups and downs in market prices in all but the shortest time period is very limited.
In a commodity company, the beneficiaries of low cost are the shareholders and the corporate cadre that directly represents them. But that enthusiasm for low capital cost is not necessarily shared by others in the organization. Operations, for example, may prefer a facility that is easy and convenient to operate over a lower‐cost facility that would produce better returns but less easy operation.
But the most important group in commodity companies that often lacks interest in low capital cost are the businesspeople actually sponsoring the project. For many businesspeople, the most important aspect of the project process is securing the money needed for their project and then seeing to it that the project does not overrun. In other words, they prefer predictability to competitiveness. The evidence for this is quite compelling.
Good cost predictability is a highly prized project outcome. When a project manager and business sponsor deliver a project at or below the promised cost, both look smart even if the project cost more than it should have. Conversely, project managers will often be viewed negatively if a project overruns, even a small amount, even if the project is actually highly cost effective. This is because cost overruns are easily measured and highly visible. In many project systems, overruns are not even adjusted for things outside the project team's control, such as the emergence of escalation during execution or currency fluctuation.
In a study conducted by my colleague, Paul Barshop, he demonstrated that the best single predictor of business sponsor satisfaction with a project was a cost underrun.16 Table 3.1 summarizes his key findings here. The projects are divided into five groups based on the competitiveness of the projects' authorization estimate. Each group is a column in the table. The most competitive group is the first column that promised capital costs of less the 85 cents on the average dollar. These projects finished with an average overrun of about 4 percent but remained the most competitive group at completion. The last column contains the projects with the most noncompetitive estimates at FID—all in excess of 115 percent of industry average for the scope being built.
TABLE 3.1 For the Businesses, Success Is Determined by Underruns, Not Competitiveness
| Cost Index for Authorization Estimate | |||||
|---|---|---|---|---|---|
| Less Than 0.85 | 0.85 to 0.95 | 0.95 to 1.05 | 1.05 to 1.15 | Greater Than 1.15 | |
| ◀◀ More Competitive | ______________________ | Less Competitive ▶▶ | |||
| Did the project meet all business objectives?* | 67% | 63% | 68% | 63% | 78% Pr<0.04 |
| Safety recordable rate | 0.86 | 0.79 | 0.80 | 0.94 | 0.91 |
| Operability index** | 1.01 | 1.02 | 1.01 | 1.02 | 1.03 |
| Execution schedule | 1.02 | 1.00 | 1.09 | 1.02 | 1.07 |
| Cost deviation | 3.7% | 2.7% | 2.1% | 1.9% | −3.1% Pr<0.01 |
* Question posed to business sponsor within six months post‐startup. Percentages are the frequency the business sponsor answered “yes.”
** Operability Index allows direct comparison of operability performance across project and industry types. Lower index values are worse performance, and higher index values are better performance.
Across the groups, there is no difference in safety, operability of facilities, or execution schedule.17 But the final column's projects were highly noncompetitive; their median cost index at authorization was 1.28 and at completion was 1.25. But those projects, because they were so substantially overestimated, underran by 3 percent and were celebrated as the most successful group of projects by the business sponsors. They were no safer; they were no faster; they did not operate better. The only positive attribute of those very expensive projects is that they underran their authorization estimates—at the expense of the shareholders.
The fact that many business sponsors of projects do not care about cost effectiveness poses real problems for contracting strategy. A preference for cost predictability above all else pushes the contracting decision‐maker toward EPC‐LS contracting with terms and conditions that are onerous for the contractor. But in many markets that sort of strategy will produce astronomically high costs or no bids at all. In the cases where EPC‐LS is not available, EPCM appears to be the beneficiary. EPCM is more predictable than EPC‐R but is so because the estimates are inflated. The results in Table 3.1 manifest a basic problem in a great many industrial project delivery systems: a lack of effective governance.
Figure 3.5 shows the cost competitiveness and cost growth results for each of the primary contract strategies used in industrial projects. The first three strategies are the “EPC approaches”: EPC‐LS, EPC‐R, and EPCM. The EPC‐LS projects end up just at the average for the 1,148 projects in our sample in terms of cost competitiveness and with cost growth of less than 1 percent. What is noteworthy, however, is that there is quite a lot of variance in both cost effectiveness and cost deviation. The variation in cost effectiveness is not at all surprising; when project markets are hot, EPC‐LS pays a premium of about 10 percent; when markets cool off, the premium disappears, and when markets are down, the contractors make less than no money, and the projects are inexpensive. The variation in cost growth for EPC‐LS is generated by changes on the plus side and by overestimated contingencies in the estimates on the low side. The average contingency in EPC‐LS owner estimates was about 8 percent. The amount typically required was about 5 percent, leaving a median underrun of about 3 percent of the owner's FID estimate. Of course, the contractors included contingency in their bids, but that amount is almost never visible.

FIGURE 3.5 Cost competitiveness and cost growth by contract approach.
The most expensive contract form is EPC‐R. Owners pay an average premium of 13 percent (Pr.|t|<.0001) more than overall industry average for those projects. More telling, the premium paid for EPC‐R compared to the split form contracts is 21 percent (Pr.|t|<.0001), and controlling for the completeness of front‐end loading does not change that result at all. EPC‐R also carries the highest real18 cost growth of any contractual form.
The EPCM form carries a 6 percent cost penalty relative to the sample average (Pr.|t|<.0001) and a penalty of over 12 percent relative to all projects excluding EPC‐R (Pr.|t|<.0001). Controlling for FEL does not move the result. To some readers, 6 percent may seem like a smallish price to pay. However, for a typical project, spending 6 percent more will decrease the return on investment almost 1 percent. Spread that across the portfolio, and it is the difference between a successful and unsuccessful industrial commodity company. EPCM projects averaged 5 percent in cost growth with a lot of variation.
Looking now to the three split form approaches, there are two surprises. First, all three forms are significantly (Pr.|t|<.0001) less costly than all other mainline contract forms. Second, all three forms produce remarkably similar results—less than 2 percent in cost performance and cost deviation. The Re/LS form and the LS/LS form do have less variation in cost competitiveness and cost deviation than other contractual approaches. The Re/Re form is more variable in both cost competitiveness and deviation except when construction was done with unit rate construction contracts rather than simple reimbursable or time and material forms. When unit rates were used, the cost performance is 89 percent of industry average, and the cost growth is negative 5 percent with a standard error of 15 percent and 11 percent, respectively. Unit rate construction contracts effectively shift labor productivity risks from the owner to the constructor, while other reimbursable forms do not. Unit rate construction is popular in Western Europe and has become popular in much of Southeast Asia. Unit rate construction contracts are unusual in Canada and the United States, which lack a substantial quantity surveyor cadre.
Schedule Competitiveness and Schedule Deviation
Some contractual approaches are faster than others. As Figure 3.6 shows, EPC‐LS, Re/LS, and LS/LS are about 4 to 8 percent slower in execution than EPC‐R and EPCM. Note, however, the Re/Re yields no speed to the EPC‐R and EPCM forms at all. For the EPC‐LS form, the schedule is in the control of the EPC contractor. That contractor will tend to float the schedule to whatever point will generate the lowest cost project but never any slower than that lowest‐cost point. EPC‐LS contractors will never want to be slower than the low‐cost point because they want to complete the project, pick up the 5 to 10 percent retainage that the owner is holding, and move on to the next project.
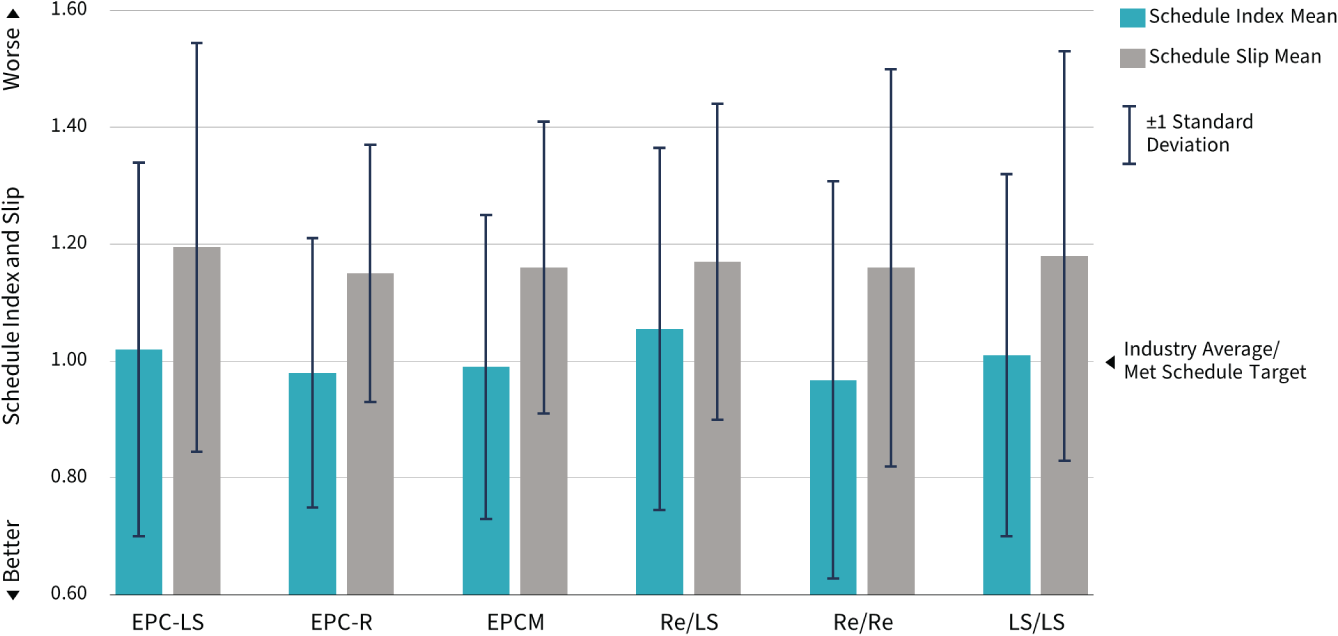
FIGURE 3.6 Schedule competitiveness and slip by contract approach.
For the Re/LS and LS/LS forms, the slower schedule performance is the natural result of choosing the easiest way to manage lump‐sum construction contractors, which is to have them work the job in a sequential fashion. First the civil contractor prepares the site and pours foundations, then the mechanical contractor sets equipment and erects structural steel and installs all the process pipe, and finally the E&I contractor completes the job. Although all of the interfaces with specialty contractors must be managed, the big sources of interference claims and complaints are removed from the process. Note that it is not the EP contractor‐to‐construction contractor(s) transition that slows things down as much as the sequential construction. The Re/Re projects, which have the same issues of transition, are actually a little faster than EPC‐R and EPCM, neither of which has a contractor transition.
Cycle time is summation of front‐end loading starting with the start of scope development, execution, and startup time (i.e., the time needed to achieve steady‐state production). As shown in Figure 3.7, the only real cycle‐time difference is for traditional EPC‐LS contracts. The time added by the bidding process after the end of FEED cannot be made up via time savings anywhere else. It is a well‐known downside of the EPC‐LS strategy.
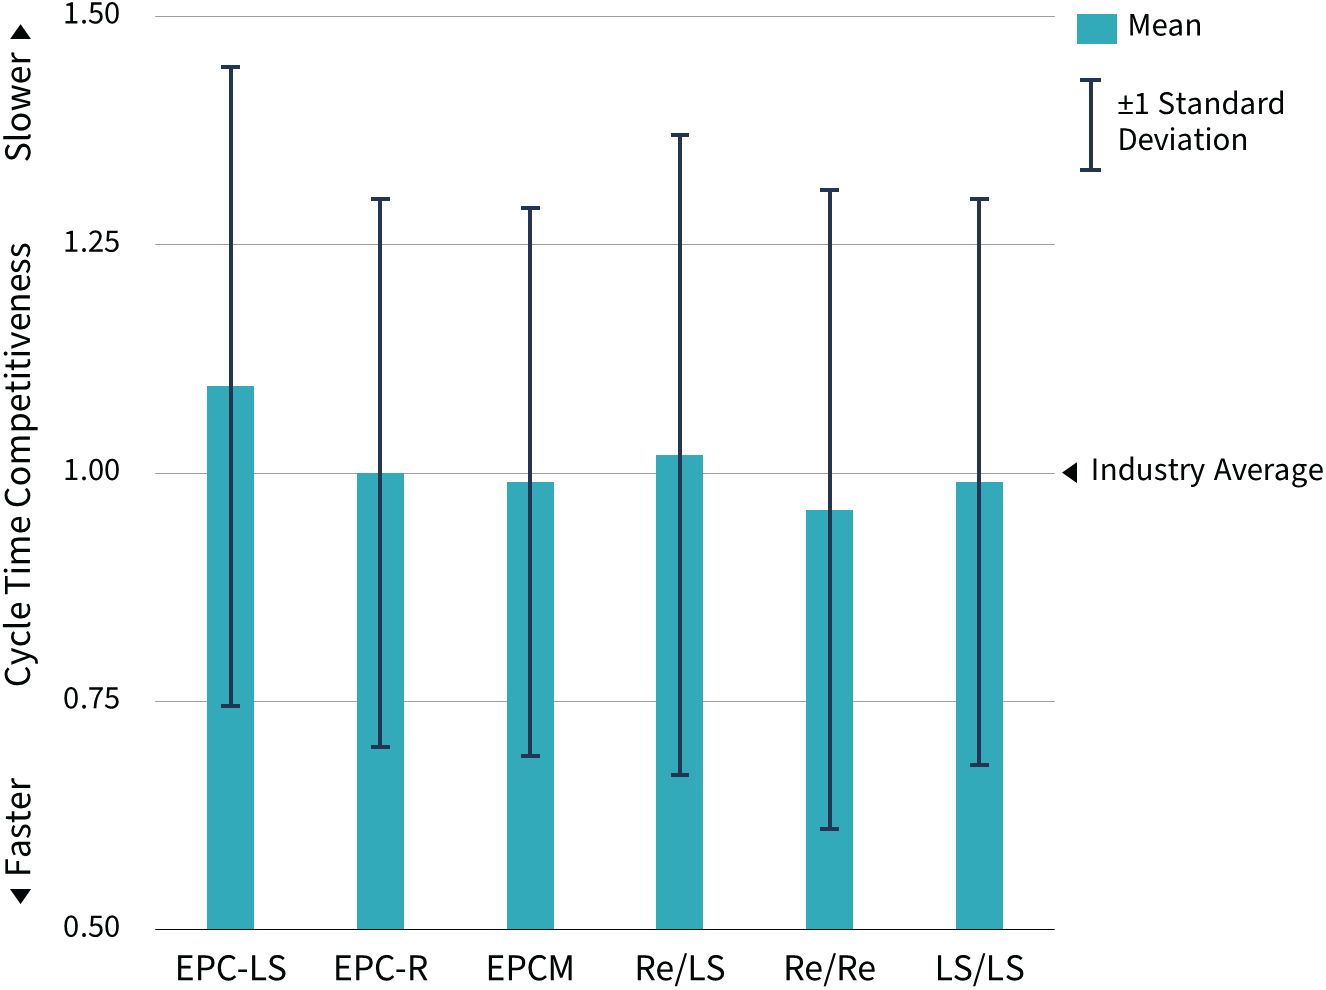
FIGURE 3.7 Cycle‐time competitiveness by contract approach.
When Speed Is King
The results shown in the two previous figures are the averages in terms of schedule for the different primary contracting forms. But how do these contract forms behave when the owner decides that speed is of the essence, which is the case in more than a quarter of major industrial projects? Do we get the speed? What does it cost? As shown in Figure 3.8, every contract form save one is materially faster when the owner deems speed to be critical to success.
The three EPC forms all end up at about 12 percent faster than the industry average when the project is schedule‐driven. But there is a degree of self‐sorting going on here. The frequency of EPC‐LS contracts goes down when projects put speed first, and only when the needed speed is thought possible is the form used. Not only does speed improve for these projects, but the EPC‐LS projects displayed only 11 percent slip versus 20 percent overall for EPC‐LS.
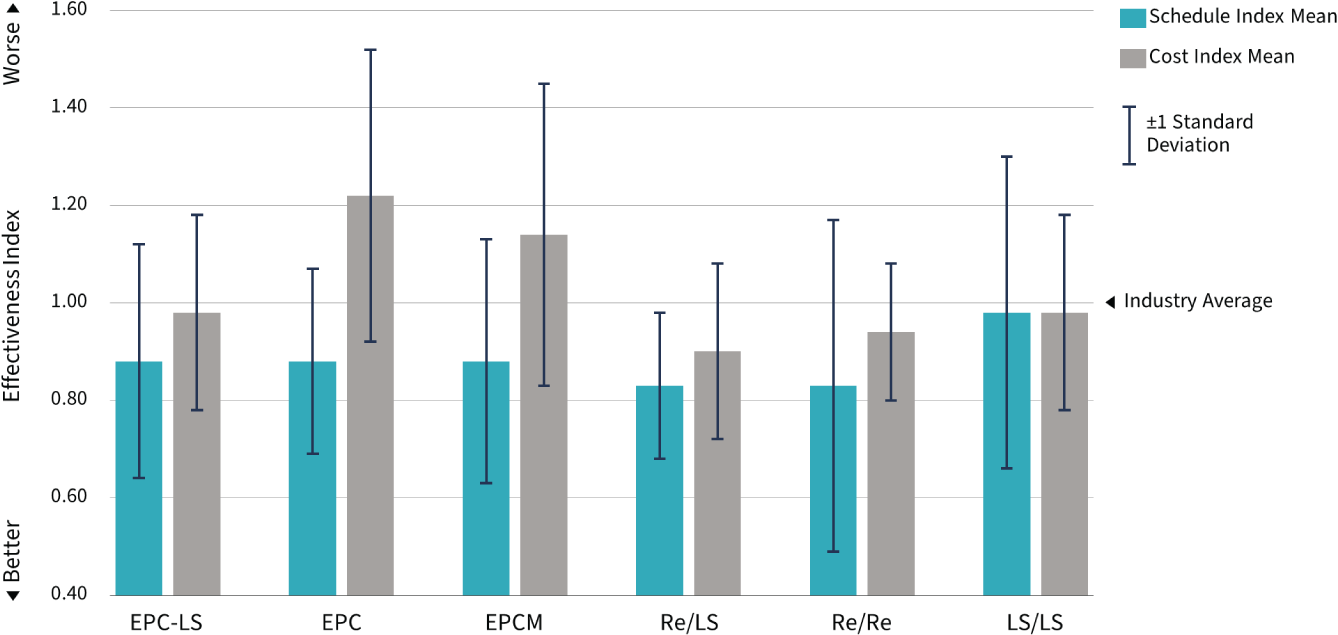
FIGURE 3.8 Speed and cost when schedule‐driven.
Also of note, the cost effectiveness of EPC‐LS did not change when schedule‐driven. When projects are considered by the owner to be schedule‐driven and EPC‐LS is the chosen strategy, the owner includes a hard end date, usually reinforced by liquidated damages for late delivery. When contractors approach the bidding on such projects if they believe the schedule is achievable but not comfortable, they add a cost premium. That cost premium often forces a change of contracting strategy or even abandonment of the project by the owner. If contractors believe they can achieve the schedule easily, they do not add a cost premium because to do so would jeopardize a successful bid.
EPC‐R and EPCM achieved the same schedule performance—about 88 percent of industry average, but their cost performance deteriorated substantially. A 10 percent improvement in schedule costs owners a 10 percent increase in cost for both these contract forms. Both groups also slipped their schedules badly—12 percent for EPC‐R and 17 percent for EPCM. In other words, EPCM projects over‐promised more their ability to produce speedy projects. However, in the EPC‐R and EPCM forms, there is usually no penalty for late delivery of the project.
The big, pleasant surprise in this analysis is the performance of the Re/LS group under time pressure. Those projects went from being rather slow in normal circumstances to being the fastest group when under pressure, averaging 83 percent of industry average execution time. When schedule‐driven, they abandoned the sequential construction strategy.19 In the process, they achieved superb cost results at 90 percent of industry average. As expected, the Re/Re group were very fast while maintaining their cost advantage over the EPC forms.
The split form contracting strategy that did not perform at all well under time pressure were the LS/LS projects. They gained only 3 percent in execution speed while ballooning their slip to 25 percent and adding 5 percent to cost. There are too many observations for the results to be accepted as a fluke. I strongly suspect the problem for this group was the lump‐sum engineering contract. Preparing bid packages for lump‐sum engineering contractors, even using the strategy of bidding unit rates that will be converted to lump‐sum, requires that work be done out of normal order if speed is to be gained. Any engineering contractor working on a lump‐sum compensation scheme would be very reluctant to agree to do their work out of the normal fashion. When reviewing these schedule‐driven LS/LS projects, I found that they did attempt to use incentives for schedule but did not seek to employ liquidated damages. I would venture that attempts to impose LDs would have resulted in no contractor willing to take on the work.
So when speed is deemed essential, EPC‐LS is OK if it is really available and if the bidding cycle is acceptable. Generally, however, EPC‐LS is not available for time‐pressured projects because contractors do not want to take on the risk. EPC‐R and EPCM will get you the speed but with a severe cost penalty. Re/LS and Re/Re appear the best way to go. I would also note that there are some big projects in the schedule‐driven split form group—up to $1.7 billion—and no tendency for costs to degrade with larger sizes. LS/LS will not work to generate speed, period.
Contracting for Regulatory Compliance Projects
About one industrial project in six is done solely or primarily for the purpose of complying with changes in environmental, health, or safety regulations. These are not modest projects; the median cost is more than $100 million. Because these projects generate no direct revenue, logic would suggest that they should be overwhelmingly cost‐driven projects.
Almost none of the compliance projects we have benchmarked over the years have resulted from a sudden or unanticipated change in regulations. Most regulators provide many years of advance notice to industrial firms that changes are coming. Nonetheless, almost 30 percent of compliance projects end up being schedule‐driven in execution because they were postponed until they became urgent. Occasionally, the procrastination results from a hope that the regulator will have a change of heart. In reality, that rarely happens. More often, compliance projects are postponed because they lack a sponsor. From a sponsorship perspective, compliance projects are usually orphans. No one seems to be interested in spending sponsorship time on a project that generates no glory, that is, money. But the fact is these projects are necessary to staying in business and end up costing a lot more money than they should.
Contracting for compliance projects can be tricky and is subject to a good many contracting games. EPC‐LS is rarely employed on compliance projects. There is really no good reason for this. Only about 20 percent of compliance projects are messy brownfield projects, what we call revamps. Revamps naturally discourage EPC‐LS because of the logistical problems associated with working in what is usually an operating plant and because revamps are subject to late surprises. But the great majority of compliance projects are the sorts of projects in which EPC‐LS is feasible. For whatever reason EPC‐LS is avoided even when the project is not schedule‐driven.
The most common contracting form for compliance projects is EPCM. For the schedule‐driven compliance projects, more than half are EPCM or EPC‐R—the least cost‐effective contracting strategies as shown in Figure 3.9.

FIGURE 3.9 Contract strategy performance for compliance projects.
The performance pattern we have seen is maintained for compliance projects; the split options offer dramatically lower cost on what should be entirely cost‐driven projects. But what happens when we wait long enough that the compliance deadline is looming and the project becomes schedule‐driven? As shown in Figure 3.10, the EPC‐LS projects disappear, and the EPC‐R and EPCM projects become obscenely expensive. The split options maintain their cost effectiveness and achieve fast schedules as well.
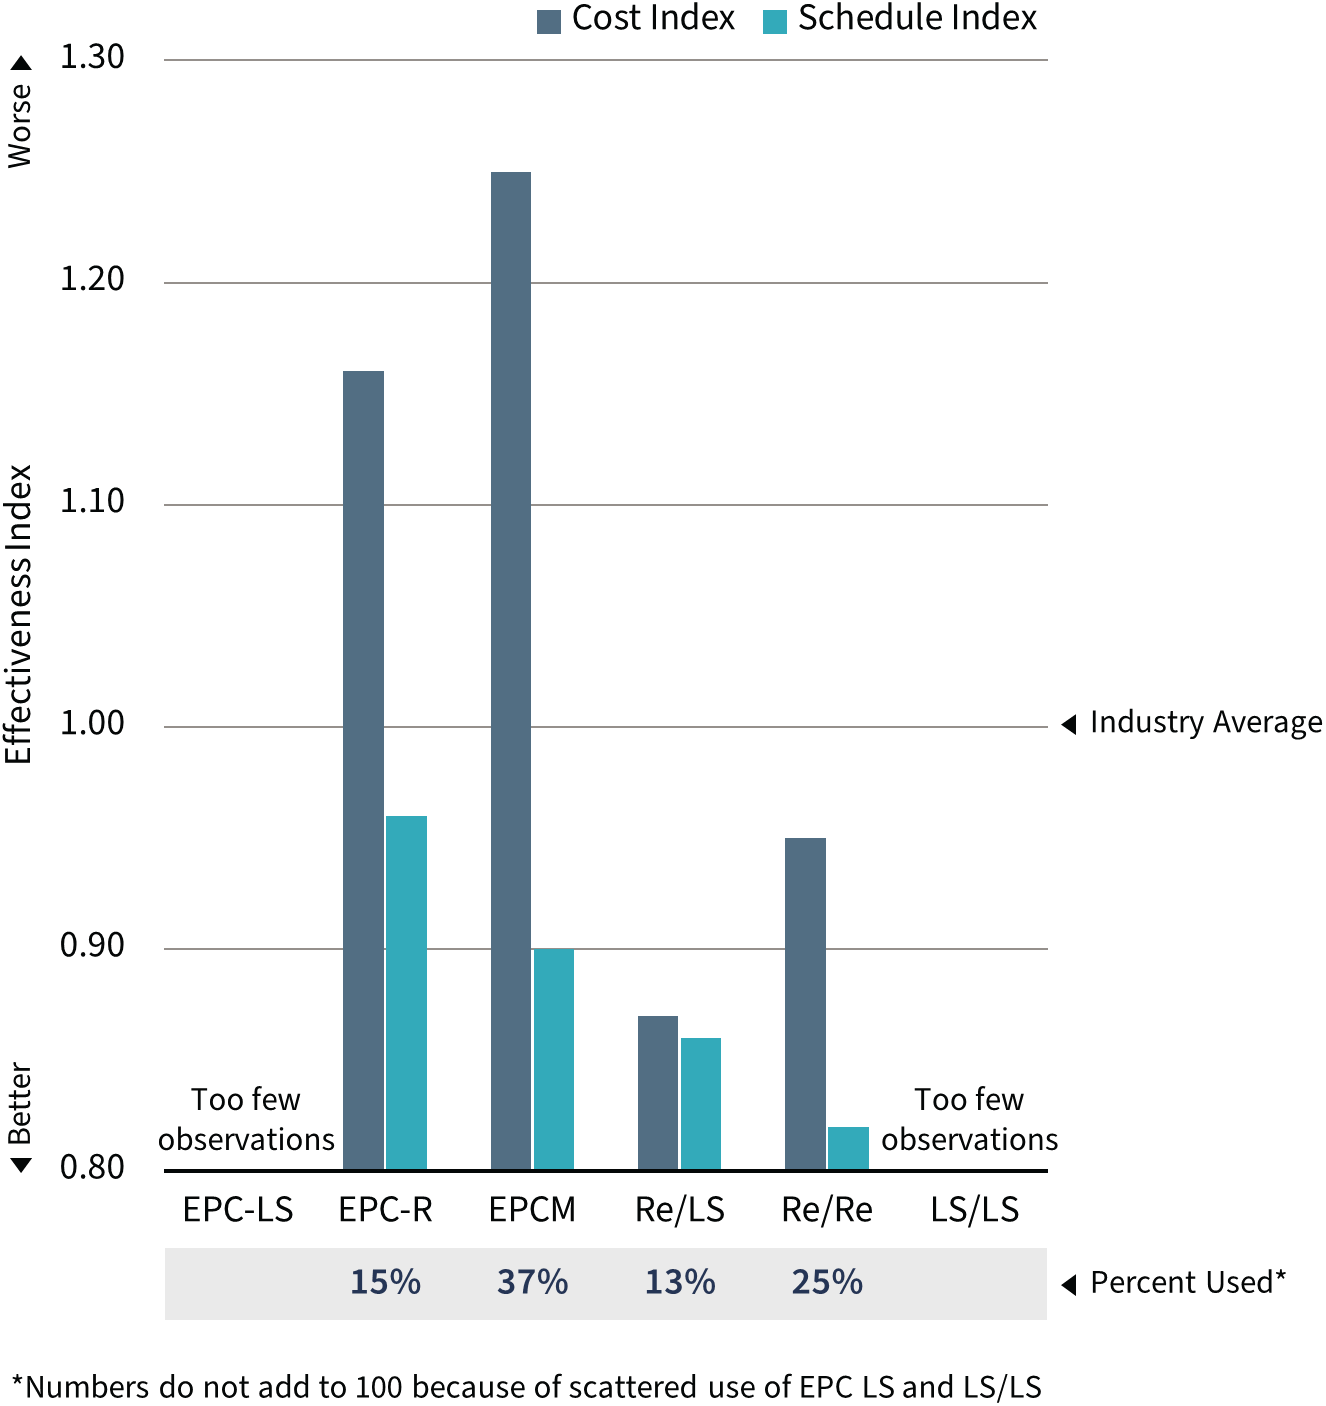
FIGURE 3.10 Contract strategy performance for schedule‐driven compliance projects.
Compliance projects employing EPC‐R and EPCM have been subjected to some of the most ruthless contracting games we have seen in capital projects. The most common game was for the FEED‐EPCM contractor to slow down their FEED work to push the project into schedule‐driven execution where they would have more leverage. We have seen even very sophisticated owners get caught in such schedule games for compliance projects. We have not seen these games work successfully in split form contracting approaches.
Summary
A majority of industrial projects—just over 50 percent—are executed using some form of EPC contract. The reimbursable forms—EPC‐R and EPCM—are also almost always preceded by the same contractor doing the FEED work in final preparation for execution. Only the traditional EPC‐LS approach usually changes contractors at the FEED‐to‐execution point. The split forms account almost 30 percent of industrial projects with the remainder being executed under other forms that will be discussed in Chapters 5 and 6.
What our analysis shows quite starkly is that popularity is not determined by effectiveness. The split options are systematically superior to the EPC options. This is true not only in general but also when we confine ourselves to speed‐driven projects or to regulatory compliance‐driven projects. When speed is required, two of the split form approaches—Re/LS and Re/Re—produce better speed than EPC forms at much lower cost. On compliance projects, which should be cost‐driven, split forms are markedly superior. This poses what is perhaps the contracting question of our time: why are owners so often satisfied to select contracting approaches that routinely deliver inferior performance? That issue is explored in Chapter 4.
Notes
- 1 We follow the definitions and reporting format of the U.S. Occupational Safety and Health Administration. Rates are determined per 200,000 construction field hours. If the reader is more familiar with rates per million hours, simply multiply the result by five.
- 2 In fairness, cost competitiveness is often difficult to measure. It requires a strong database and substantial expertise to generate a correct measure. By contrast, cost growth is relatively easy to measure.
- 3 For example, there are some commodity projects that are timed to a particular customer commitment. Occasionally, a project must be schedule‐driven to meet a regulatory compliance requirement.
- 4 Scope changes are discretionary changes in functionality. For example, if after authorization the business decides to increase or decrease capacity, add or subtract a product, improve or forego storage, etc., those are all scope changes. Design changes, by contrast, are changes required to meet the original objectives of the project and involve no change to intended functionality. The two terms—design changes and scope changes—are often used interchangeably but should not be.
- 5 Execution time is measured from the mobilization of detailed design through to the mechanical completion of facilities, that is, ready in principle to operate.
- 6 For large projects with multiple distinct scopes and different contractors executing those scopes, I classified the project in terms of contracting strategy by the form that accounted for most of the work. This rarely presents a problem because owners generally prefer to use a single contract approach for all the scope packages. The exceptions tend to be small packages on a larger job. For example, if the project is being executed on an EPCM, it might have an EPC‐LS for waste water treatment. I would still classify it as EPCM. The only difficult‐to‐classify cases are EPC‐LS on the main plant, the so‐called “inside battery limits,” with reimbursable forms for the utilities and supporting infrastructure (outside battery limits). I chose to go with the ISBL strategy for classification purposes.
- 7 We have deliberately over‐sampled unusual contracting approaches so as to have a sufficient number for analysis. By doing so, we depress the percentage of the primary approaches.
- 8 Executing FEED under a lump‐sum payment scheme makes sense only when the FEED deliverables can be described completely, which means it is probably a project the owner has done before in a similar configuration. When FEED was lump‐sum, the FEEDs were often incomplete with a good deal of arguing between owner and contractor about what “complete” means.
- 9 In some bidding contests, the number of question rounds is contained in the ITB and is often constrained to one or two. While it is understandable that the owner wants to move things along, it is better practice to allow some flexibility in the number of question rounds. Obtaining clarity and full understanding of the scope by the bidders results in better‐quality bids that are more easily compared.
- 10 In multi‐prime EPC‐LS arrangements on megaprojects, the question arises whether the owner will manage the contractors and their interfaces or if a project managing contractor (PMC) will be hired to take on those roles. The hiring of a PMC is clearly associated with poorer outcomes for megaprojects. See Merrow, Industrial Megaprojects, op. cit. p. 299.
- 11 About 10 percent of EPCMs in our sample were lump‐sum. The differences in outcomes were not substantial enough to justify separating them out as a group. They were marginally less expensive but marginally longer in schedule. They experienced a little less cost growth but more slip in execution schedule than the reimbursable EPCMs. On a net basis, there is little difference.
- 12 The final alternative (lump‐sum engineering and procurement followed by reimbursable construction) is too unusual to permit systematic analysis and often was not the originally intended strategy at all.
- 13 A reader can quarrel with my use of the simple per project accidents rates here as potentially misleading. Because safety data have a distinct Poisson distribution, negative binominal regression is a better technique for modeling. However, 99 percent of my readers would find the reporting of those results opaque, and it turns out that the simple injury rates are a reasonably good representation of the pattern regardless of modeling technique. I also controlled for project size when looking at the distribution by industrial sector, and the pattern does not change in any appreciable way.
- 14 Note that I did not include petroleum production projects in this discussion. Too many of the petroleum production projects in our sample were fabricated in Asia, a low‐reporting region. The remaining sample would be too small to be reliable.
- 15 Of course, sales price and sales volumes are far more important to returns than capital cost. However, in commodity products, price and volumes are not controllable by a company.
- 16 Paul H. Barshop, “Using Target Setting to Improve Cost Competitiveness: The Proceedings of the Annual Conference of the Industry Benchmarking Consortium,” 2011, Independent Project Analysis, Inc.
- 17 There were also no differences by the cost categories in terms of key practices such as front‐end loading and team integration.
- 18 Recall that cost deviation has been normalized to remove the effects (plus and minus) of scope changes, foreign currency fluctuation, and project‐specific inflation (escalation). Nominal cost growth is generally higher, and often considerably higher, than real.
- 19 This should not lead those using the Re/LS contracting strategy to abandon their sequential approach on non‐schedule‐driven projects. The sequential approach significantly reduces the strain on construction management by eliminating interfaces, making laydown easier, and reducing logistics problems. Construction management is a scarce and valuable resource these days, and savings on CM skills and resource requirements is important.