
CHAPTER 2
Data, Methods, and Nomenclature
For almost all industrial firms, the process of creating a capital project proceeds in phases, also known as stages. Owners organize the stages to facilitate decision‐making about whether to proceed. These decision points (or gates) are intended to make it easy to withdraw from an unpromising project before a great deal of money is spent. The staged process illustrated in Figure 2.1 is quite typical throughout the industrial world. We dub the stages prior to authorization front‐end loading (FEL). The process starts with the articulation of a business need for a capital project and the development of a tentative business case around that need. If the decision‐makers deem the business requirement compelling, the project passes through the first gate.
FEL‐2 focuses on the development of a project scope that achieves the business requirements in terms of product produced, quantity needed, quality of product, and so forth. Most industrial firms have their own engineering personnel do scope development without the assistance of an engineering contractor. There are exceptions, of course, and one contracting strategy that we will discuss later, functional specification contracting, leaves some or all of the scope definition up to a contractor to perform. When the scope is fully identified, the owner project team can produce a meaningful cost estimate and schedule for the project.
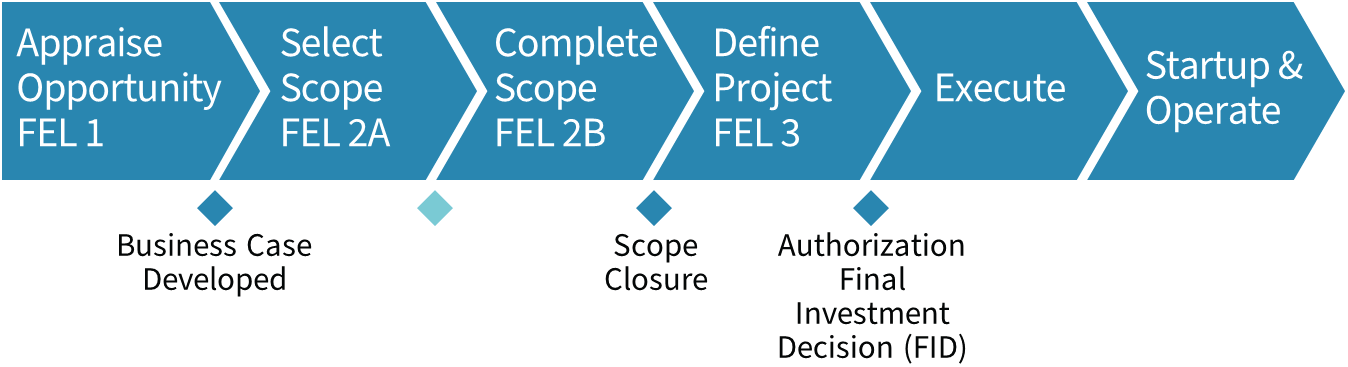
FIGURE 2.1 Standard stage‐gated project development process.
Most companies now have installed a “check gate” in the middle of FEL‐2 to ensure that the basic scope is coming together fast enough that there will still be time to complete the FEL‐2 work before the second gate decision is scheduled.1 If the benefits defined in the business case still look good against the cost and schedule forecasts, the decision‐maker passes the project on to stage 3. The second gate, which corresponds with the closing of the scope, is almost always the real decision point to proceed with the project. The next phase will involve spending a good deal of money that cannot be recovered if the project is abandoned.
In the vast majority of industrial firms, an engineering contractor is hired to execute most of the work in stage 3 with the owner's supervision.2 The stage 3 work consists of progressing the engineering design and planning the execution of the project. That is the so‐called FEED portion of FEL‐3. IPA rates FEED as complete when the heat material balances are closed and all piping and instrumentation diagrams are complete, reviewed, approved, and issued for (detailed) design. FEED is preliminary when P&IDs are not complete, reviewed, approved, and IFD, and is grossly deficient when less than 50 percent of P&IDs are completed or when the heat and material balances have not been closed, which has the effect of potentially undermining the P&ID work. The issue of whether FEED and the other elements of FEL‐3 are complete will recur many times in this book. The completeness of FEL substantially governs the risk profile of a project. The risk profile is intimately connected to the contracting strategy.
The fact that an engineering contractor is required to accomplish the stage 3 work makes it vitally important to start the development of the project's contracting strategy early in stage 2 so the stage 3 work can proceed without delay if the project is passed through the second gate. The contracting strategy will often shape the decision about which contractors to consider for stage 3 work. The selection of the stage 3 contractor is important because in most industrial projects, the stage 3 contractor will be awarded at least the engineering and procurement for stage 4, execution. Frequently, the stage 3 contractor will execute the entire project.3
The chronological context for contracting then is that strategy development must occur in stage 2 for most projects and even earlier for functional specification contracting. In most cases, after setting the contracting approach, the owner begins prequalification of the contractors who might be employed to do stage 3 and execution work. We will discuss the prequalification process and its many pitfalls in Chapter 7.
Description of the Database4
Throughout this book I will refer to a database of 1,148 major5 projects that have been completed by industrial firms around the world. This database is the result of the work of IPA project and research analysts as they have evaluated these projects at various stage‐gates during the projects development. Referring to Figure 2.1, IPA routinely evaluates projects for our clients at gates 2 and 3 and then again after plant startup is complete. We also collect operational performance data after 12 to 18 months of operation.
Each evaluation combines the completion of a structured data collection instrument and a face‐to‐face interview with members of the owner project team, often with the lead contractor personnel present. We hold separate interviews with the owner's project business sponsor. Thousands of pieces of information are collected via the structured interview protocol. In addition, the project team provides all of the key documentation for the project including the basis of design documents and the project execution plan. At each interview there is a discussion around the contracting strategy and plans, and the relevant documentation is also obtained. What results from this process is a holistic picture accompanied by detailed data of each project. At each evaluation, we provide a detailed report to the owner on the status, risks, and uncertainties surrounding the project.
The data that support our analysis include projects from more than 100 industrial firms around the world. Table 2.1 summarizes some key characteristics of the database employed here. I excluded small projects normally executed by site organizations because the contracting approaches employed by sites are distinctly different in many cases from the contracting approaches taken for larger projects. I included only about 100 projects with total costs over $1 billion USD (in today's dollar terms). I could have included many more of the larger projects, but I did not want the discussion skewed by megaprojects, which tend to have more challenges than the typical project. However, essentially all conclusions in this book apply equally well to projects of all sizes. The effects of project scale are discussed at a number of points. The median project in our database was authorized in 2010 and the most recent in early 2019. Later authorizations are truncated by my desire to use only completed projects so the links between contracting and outcomes could be fully explored. About 7 percent of the sample employed technology was new in commercial use. The use of new technology does influence contracting decisions as well as add risk with respect to project outcomes.
TABLE 2.1 Contracting Database
| Project Characteristics | |
|---|---|
| Number | 1,148 |
| Average project cost (2022 USD) Range of project costs (2011 USD) | $460 million $15.5 million to $15.8 billion |
| Average execution duration Average cycle time duration | 27 months 46 months |
| Number of owners represented | 109 |
| Mean authorization year | 2Q 2009 |
| Projects with any new technology | 7.5% |
Figure 2.2 shows the location of the projects in our sample. More than 40 percent of the sample comes from North America, but there is good representation from Europe and Asia, including China, Southeast Asia, and the Indian subcontinent. About 7 percent of the sample comes from the Middle East, where EPC lump‐sum remains the most common contracting form. The only substantially underrepresented regions are Russia and Central Asia.
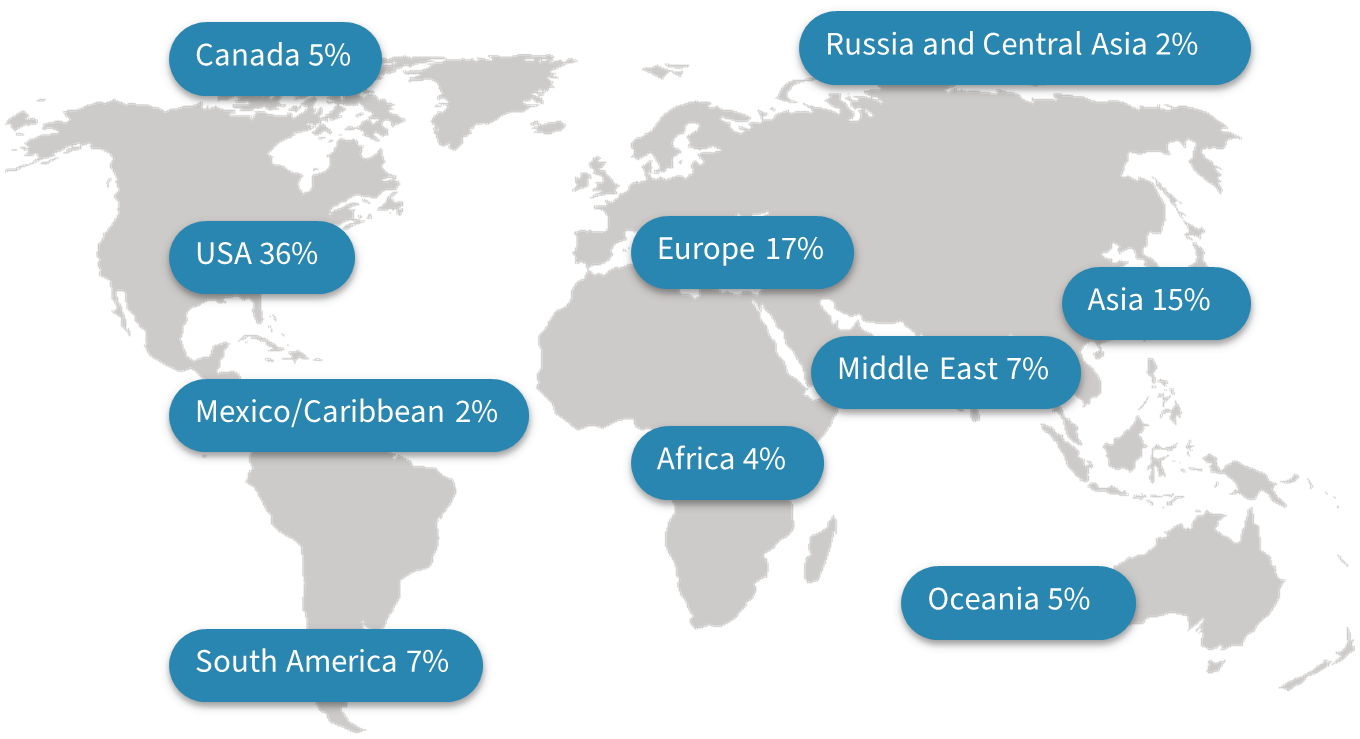
FIGURE 2.2 Project sample geographical distribution.
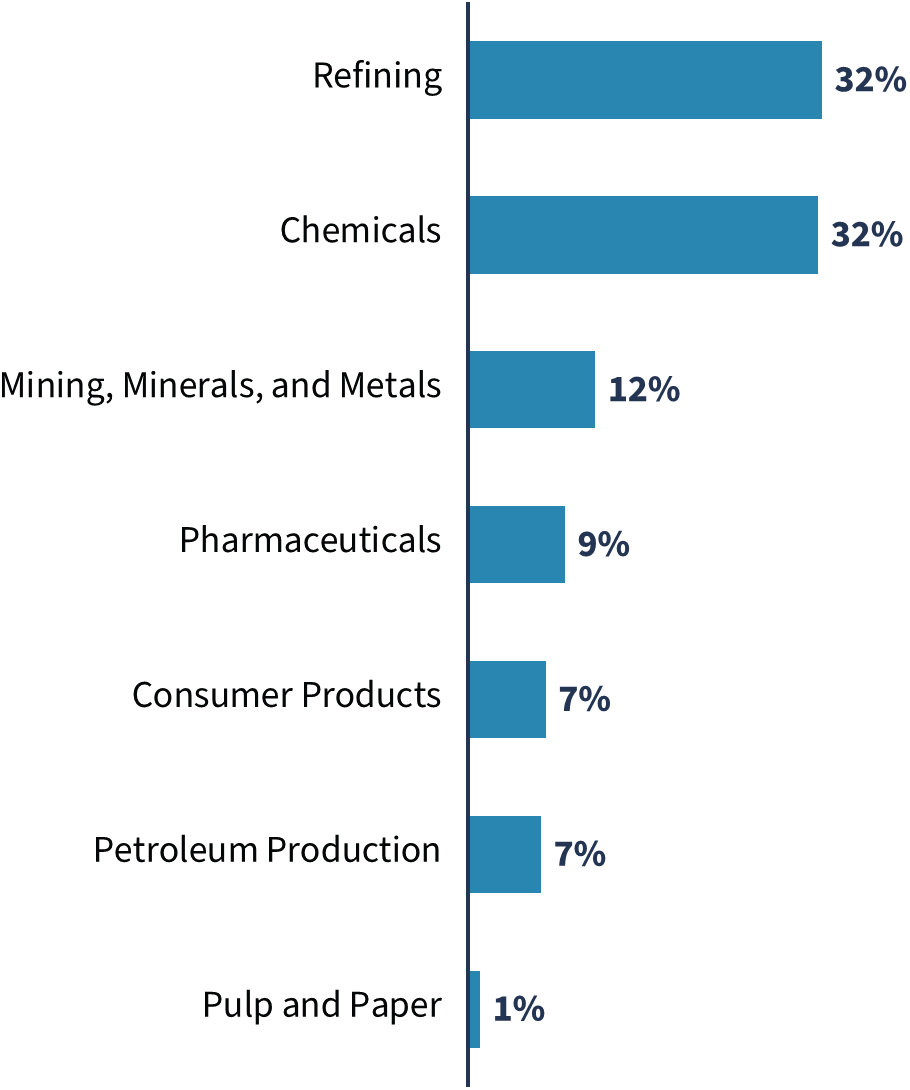
FIGURE 2.3 Project sample industrial sector distribution.
Also, Figure 2.3 shows the breakdown of industrial sectors in the database. Petroleum refining and chemicals each constitute 30 percent of the sample. Within chemicals, about two‐thirds are commodities, and the other third specialties not including pharmaceuticals, which are a separate sector. Mining and metals processing constitute about 12 percent of the sample. The selection of contracting strategies is affected by the industrial sector, and there are some differences in project performance by sector as well. Different contractual strategies behave in much the same way regardless of industrial sector.
I elected to exclude certain sectors because I was concerned they would distort the results. I excluded projects that were subject to rate‐based regulation in the power and pipelines sectors because those projects are subject to what economists call the Averch‐Johnson effect.6 Rate‐based regulation creates a systematic incentive to over‐capitalize facilities, which distorts their cost competitiveness. For that and other reasons, I also excluded nuclear power plants and nuclear materials processing. I also excluded hazardous and nuclear materials waste cleanup projects because governments are usually heavily involved in those projects, and government involvement tends to inflate cost and time.
Project Types
We define types of projects with the typology shown in Figure 2.4.
Greenfield projects are entirely new projects at a site with no existing company facilities. Greenfield projects usually require significant infrastructure investment and are therefore on average larger than other project types. Almost one project in five in our sample is at a greenfield site. Over a quarter of this sample are co‐located projects. A co‐located facility places a new production plant at an existing industrial site. Usually, the site is owned by the owner of the new plant, but that is not necessary to the placement in this category. Co‐located facilities benefit from existing support infrastructure such as access and other transportation, water, and power. An expansion involves the increase of production of an existing product at a site. Expansions are sometimes able to reuse engineering and equipment specifications from the existing production line. The fourth most common type of project in our sample are “revamps.” When most of a project's cost is associated with refurbishing an existing facility, the project is placed in this category. Revamps are widely considered the most difficult projects in the process industries because they must account for the status of the usually old and worn‐out facilities as well as working around operations. Construction for revamp projects is frequently shoehorned into scheduled plant shutdowns. Our final project type are “add‐ons.” Add‐ons build a new processing unit at an existing site that must be integrated into existing operations.
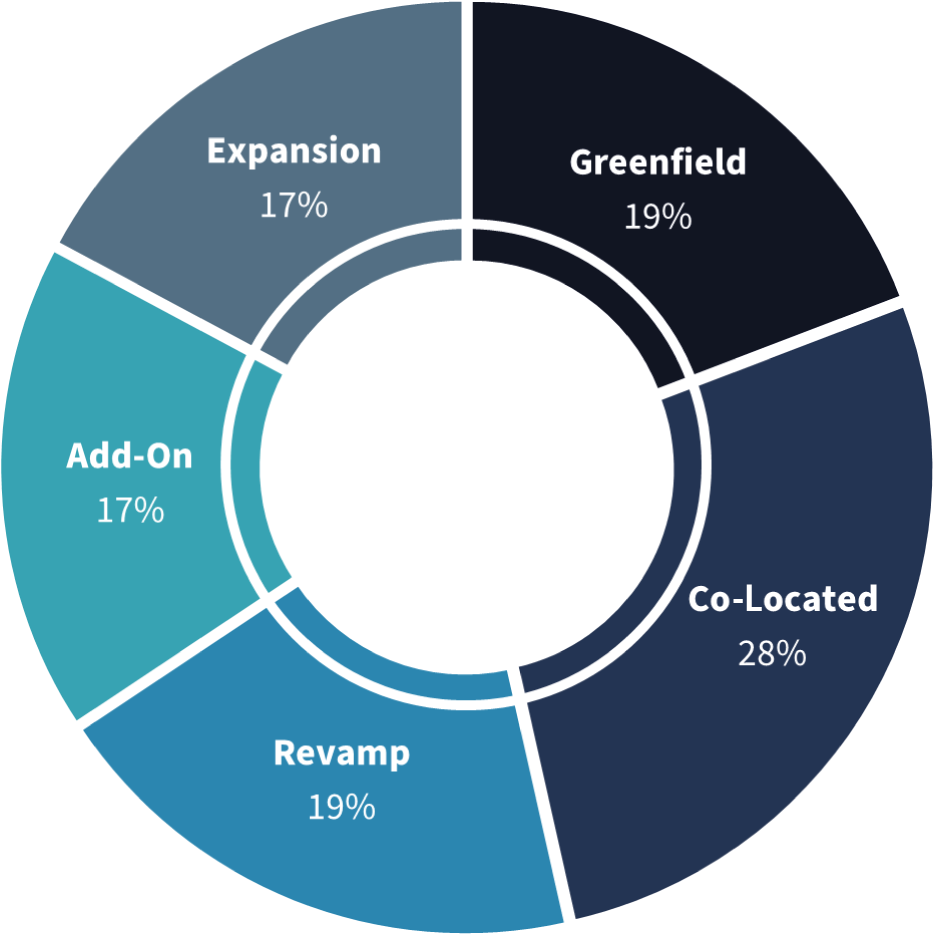
FIGURE 2.4 Project sample project type distribution.
Project type influences contracting choices. For example, project teams generally prefer engineering and construction contractors who are familiar with the site for revamp projects. Greenfield and co‐located projects are more likely to entertain bids from any qualified contractor, often on a global basis. Add‐ons and expansions fall somewhere in between. Project size, rather than project type, tends to govern whether the project seeks a large international contractor rather than a smaller, more regional or even local firm.
The Sample and Potential Sample Biases
I believe that the dataset represents a reasonable cross section of industrial projects executed around the world. The projects represent about $525 billion in capital and span the major industrial sectors outside regulated and government‐sponsored industries, such as infrastructure. There are, however, some known biases. First, the companies that work with IPA on a regular basis, and therefore provide much of the data, are better performers than those that do not. We know this from our experience benchmarking capital projects for companies for the first time. Those initial baselines are poorer than later performance more than 90 percent of the time. Because I control for key owner practices as I explore the relationships between contracting and project outcomes, differences in owner sophistication should not affect any conclusions about contract strategy efficacy. However, the bias in owner sophistication will affect contract strategy selection and any conclusions about the overall health of industrial projects around the world.
Second, we know that certain countries are underrepresented, especially Russia and Central Asia. Again, that could (and probably does) affect statements about the health of projects generally as projects in Russia and Central Asia are known to be problematic.
Third, we know there is a slight bias in the projects that our clients allow us to close out. By contract all of our clients are required to provide data on completed projects. But when the projects are particularly dreadful, they sometimes seek to slip out of that requirement, especially if the project is subject to major claims and litigation. They sometimes succeed. Fortunately, most of our clients are really quite courageous in sharing their disappointments.
The Data Normalization Process
When assessing project outcomes, both cost and schedule require careful normalization to render any comparisons between projects valid. If we compare more than 1,000 projects executed all over the world over a 20‐year period without normalization, the comparisons made and conclusions reached would not only be suspect, but they could well be downright misleading. The same normalization process was used for all 1,148 projects in our sample. That process proceeds in seven steps:
- We remove the cost and schedule effects of abnormal weather, low‐probability/high‐consequence events, and force majeure events. Strange things happen. For example, we have three projects in which a critical piece of major equipment went overboard during ocean transport. We have projects that find themselves in the middle of intense civil conflicts and projects hit by typhoons and tornados. We have project sites shut down by the authorities in the midst of a coronavirus pandemic. Without normalization, these things muddy the analysis without adding any value and insight.
- Any scope additions must be added to the authorization estimate for the purposes of understanding cost deviation. Scope changes must be distinguished fully from design changes. Scope changes alter the functionality of the project. Design changes are changes necessary or thought desirable to achieve the original intended functionality of the project. We never adjust for design changes. Scope additions are often disruptive to the project process; we do not adjust for any of the “ripple effects” of scope changes because those effects resulted from a choice to alter the scope. A good many such changes reflect poor functional integration of the project team during scope development, such as the absence of an active business sponsor or lack of operations involvement in the scope development process. Those are project system flaws, not candidates for normalization.
- We review all of the cost allocations with the client project estimator to ensure they conform to the IPA common work breakdown structure and code of accounts for the type of facility being constructed.
- Any scope deletions are removed from the authorization cost estimate to maintain constant scope between estimated and actual costs. Again, no ripple effects are normalized no matter how large because scope changes are a feature of the project and project system, not an external and uncontrollable influence.
- All future escalation is removed from the FID estimates. We want all effects of market forces to reflect our common indexes rather than be idiosyncratic to the project or the owner company.
- We normalize for location differences. IPA maintains at‐location costs for most countries in the world and many subregions within countries.
- We generally do not adjust equipment costs as we consider most equipment purchased to be world open market (WOM) in all cases except where local purchase is mandated.
- Engineering is generally WOM except in cases where local engineering is required by law and differs from WOM costs.
- Construction labor and construction supervision are adjusted based on the location of the labor and construction management that will be employed for the project.
- Specialty costs (scaffolding, heavy lift, etc.) are adjusted to local norms.
- We then translate all costs using our cost indices to a common point in time. For this book, I chose to use January 2022 as my base. All costs must be brought to a single point in time while correctly converting currencies as spent when multiple currencies are involved unless currency values were fixed by hedging. We adjust the line items by applying price change indices to each of the major elements of cost: equipment, bulk materials such as concrete steel and pipe, engineering, construction labor and construction management, etc. IPA's Data Management Group maintains price indices for all project inputs and location factors for cost and productivity for most locations in the world.
The Knowledge Behind the Data
At the risk of repeating myself, statistics without understanding causation are just numbers. When IPA analysts evaluate a project, we insist that their work is not complete until they understand “the story” of the project. That understanding of the project's story is recorded not only in their reports to the client but in the backup narrative that accompanies every project record when it is finally closed out. The interviews with those who actually developed and executed the project provide the context and nuances that the data collection protocol could never capture by itself. The interviews are guided by the interview protocol that gathers thousands of variables on each project at each engagement, but the knowledge of the project is generated more holistically. Finally, the analysts write a document that captures key learnings and issues from their engagement that is an integral part of the project record for IPA. We regularly have three major engagements with each project: two on the front end and one to close the project after it has completed startup. Finally, a written report to the client concludes each engagement.
In writing this book, I had access to all of the histories of each one of the 1,148 projects in the database. These written histories provide the depth and nuance needed to understand how the contracting strategy chosen for the project played out in practice. The database, rather than being a sterile set of numbers, is actually a deep pool of knowledge about each project. There are discussions of when the construction management organization simply could not keep up with the number of construction interfaces the strategy had created. There are detailed discussions of how late and inaccurate engineering made the constructors look like idiots instead of skilled professionals. There are lots of instances in which the owners believed they had skills in the area of construction management they simply did not possess. All of these background stories provide the potential for insight that numbers alone can never supply.
Statistics and “Statistical Significance”
Much of this book reports on our search for patterns in the relationships among project practices, contracting strategies and approaches, and project outcomes as measured by cost and time. It is well understood that humans are good at seeing patterns and sometimes too good (i.e., seeing patterns where none actually exist).7 The statistical analysis in this book helps to mitigate the problem of seeing patterns where none exist. Where I believe a pattern logically should exist based on my conceptual structure of contracting and projects, the statistics help me feel comfortable with that conclusion or uncomfortable as the case may be.
It is essential to remember that statistics are associational, not causal. When describing a result as “statistically significant,” we are saying that the association probably did not occur randomly, and we use the conventional cutoff of 0.05 (5 percent) to report a result as statistically significant. The use of the value‐laden word significant is unfortunate. Statistically significant does not equate to important. After all, the correlation between grass and the color green during active growing seasons is highly statistically significant while being of very little import to most. It is essential to understand that statistical significance does not prove causation. For example, it is correct that birth rates are higher in places where the density of nesting storks is higher. That relationship is “statistically significant.” But the conclusion “therefore, storks bring babies” is absurd. Storks prefer to nest in rural areas, and birth rates tend to be higher in rural areas. Causation exists only within a conceptual structure and does not derive from the statistics. When we discuss the relationships between contractual approaches and how the principal‐agent problem plays out, that is a conceptual argument that leads us to expect certain outcomes. The statistics then help support or cause us to question that conceptual structure.
As we report on statistical results throughout this book, we will use the following convention to report the results:
Pr.|type of statistic|<.0XX
which should be read: the probability of the stated relationship occurring by chance with repeated tries is less than .0XX based on the particular test employed (e.g., a t‐test, z‐score, a X2 (chi‐square), or whatever).
Often, we will discuss statistical results noting that “factors X and Y have been controlled.” For example, contracting approaches often have very different results when a project is well defined than when it is poorly defined at authorization. For example, a poorly defined lump‐sum project will be subject to endless changes and will usually shift all of the overrun risk that the contract passed to the contractor back onto the owner. Conversely, a well‐defined lump‐sum is much more likely to force the contractor to eat any overrun. What this “controlled for” means in practice is that we have included the control variables in our statistical model while looking for the effect of contracting.8
Summary
Our sample of projects is, we believe, a good cross section of industrial projects. There are projects large and small, simple and complex, with strong representation from six industries—chemicals, petroleum refining, mining, pharmaceuticals, consumer products, and petroleum (oil and gas) production. We also have some representation from pulp and paper. The projects are from around the world with only Russia and Central Asia under‐represented. The projects were developed and executed by more than 100 industrial firms, again of all sizes, descriptions, and home locations. We have a good distribution of types of projects from revamps to greenfields, with all in between. The projects were executed by all of the world's largest industrial contractors and a host of regional and local contractors. So, let's proceed to explore the relationship between contracting strategies and project results.
Notes
- 1 The calendar always plays a role in the front‐end process, as it must and should. If the scope development team cannot arrive at a workable scope pretty quickly, it is quite likely that they never will, in which case the project should be abandoned.
- 2 The exceptions are the few firms that maintain extensive engineering capability in‐house.
- 3 Only one contract strategy routinely changes contractors between stages 3 and 4—EPC lump‐sum.
- 4 IPA has studied contracting by site organizations extensively; perhaps one of my colleagues will choose to write a separate book on the subject.
- 5 The term major here does not mean “very large.” The smallest project in the dataset is about $15 million. In this context, major means a project that is normally executed by a central projects organization rather than a site organization or business unit.
- 6 See Harvey Averch and Leland L. Johnson, “The Behavior of the Firm Under Regulatory Constraint,” The American Economic Review, Vol. 52, No. 5 (Dec., 1962), pp. 1052–1069. See also Sherman, R., Gibson Jr., G. E., Merrow, E., Parrish, K, (2021), “Examining the Impact of Rate‐of‐Return Regulation on Capital Project Planning” (ASCE CO.1943‐7862.0002069), Journal of Construction Engineering and Management, Volume 147, Issue 8. American Society of Civil Engineers (ASCE).
- 7 See, for example, Nate Silver, The Signal and the Noise, London: Penguin Books, Limited, 2012.
- 8 The reader should not interpret this discussion as the use of step‐wise regression. We generally avoid the use of step‐wise and prefer least‐squares, logit, probit, or nonparametric routines such as robust regression or other nonparametric tests as required.