
Chapter 3
Earnings
Time to put our accounting hat on!
Following our analysis of company cash flows, it is time to consider the issue of how a company creates wealth. In this chapter, we are going to study the income statement to show how the various cycles of a company create wealth.
Section 3.1 Additions to wealth and deductions from wealth
What would your spontaneous answer be to the following questions?
- Does purchasing an apartment make you richer or poorer?
- Would your answer change if you were to buy the apartment on credit?
There can be no doubt as to the correct answer. Provided that you pay the market price for the apartment, your wealth is not affected whether or not you buy it on credit. Our ?experience as teachers has shown us that students often confuse cash and wealth.
Cash and wealth are two of the fundamental concepts of corporate finance. It is vital to be able to juggle them around and thus be able to differentiate between them confidently.
Consequently, we advise readers to train their minds by analysing the impact of all transactions in terms of cash flows and wealth impacts.
For instance, when you buy an apartment, you become neither richer nor poorer, but your cash decreases. Arranging a loan makes you no richer or poorer than you were before (you owe the money), but your cash has increased. If a fire destroys your house and it was not insured, you are worse off, but your cash position has not changed, since you have not spent any money.
Raising debt is tantamount to increasing your financial resources and commitments at the same time. As a result, it has no impact on your net worth. Buying an apartment for cash results in a change in your assets (reduction in cash, increase in real estate assets), without any change in net worth. The possible examples are endless. Spending money does not necessarily make you poorer. Likewise, receiving money does not necessarily make you richer.
The job of listing all the items that positively or negatively affect a company's wealth is performed by the income statement,1 which shows all the additions to wealth (revenues) and all the deductions from wealth (charges or expenses or costs). The fundamental aim of all businesses is to increase wealth. Additions to wealth cannot be achieved without some deductions from wealth. In sum, earnings represent the difference between additions to and deductions from wealth.
| Revenues | Gross additions to wealth | ||
| − | Costs | − | gross deductions from wealth |
| = | Earnings | = | net additions to wealth (deductions from) |
Earnings represent the difference between revenues and costs, leading to a change in net worth during a given period. Earnings are positive when wealth is created and negative when wealth is destroyed.
Since the rationale behind the income statement is not the same as for a cash flow statement, some cash flows do not appear on the income statement (those that neither generate nor destroy wealth). Likewise, some revenues and costs are not shown on the cash flow statement (because they have no impact on the company's cash position).
1/ Earnings and the operating cycle
The operating cycle forms the basis of the company's wealth. It consists of both:
- additions to wealth (products and services sold, i.e. products and services whose worth is recognised in the market); and
- deductions from wealth (consumption of raw materials or goods for resale, use of labour, use of external services such as transportation, taxes and other duties).
The very essence of a business is to increase wealth by means of its operating cycle.
| Additions to wealth | Operating revenues | |
| Deductions from wealth | − | Cash operating costs |
| = | Earnings before interest, taxes, depreciation and amortisation (EBITDA) |
Put another way, the result of the operating cycle is the balance of operating revenues and cash operating costs incurred to obtain these revenues. We will refer to it as gross operating profit or EBITDA (earnings before interest, taxes, depreciation and amortisation).
It may be described as gross insofar as it covers just the operating cycle and is calculated before non-cash expenses such as depreciation and amortisation, and before interest and taxes.
2/ Earnings and the investing cycle
(a) Principles
Investing activities do not appear directly on the income statement. In a wealth-oriented approach, an investment represents a use of funds that retains some value.
To invest is to forego liquid funds: an asset is purchased but no wealth is destroyed. As a result, investments never appear directly on the income statement.
That said, the value of investments may change during a financial year:
- it may decrease if they suffer wear and tear or become obsolete;
- it may increase if the market value of certain assets rises. Most of the time, by virtue of the principle of prudence, increases in value are recorded only if realised through the disposal of the asset.2
(b) Accounting for a decrease in the value of fixed assets
The decrease in value of a fixed asset due to its use by the company is accounted for by means of depreciation and amortisation.3
Impairment losses or write-downs on fixed assets recognise the loss in value of an asset not related to its day-to-day use, i.e. the unforeseen diminution in the value of:
- an intangible asset (goodwill, patents, etc.);
- a tangible asset (property, plant and equipment);
- an investment in a subsidiary.
Depreciation and amortisation on fixed assets are so-called “non-cash” costs insofar as they merely reflect arbitrary accounting assessments of the loss in value.
(which are included in operating costs) and provisions.
3/ The distinction between operating costs and fixed assets
Although we are easily able to define investment from a cash flow perspective, we recognise that our approach goes against the grain of the traditional presentation of these matters, especially as far as those familiar with accounting are concerned:
- Whatever is consumed as part of the operating cycle to create something new belongs to the operating cycle. Without wishing to philosophise, we note that the act of creation always entails some form of destruction.
- Whatever is used without being destroyed directly, thus retaining its value, belongs to the investment cycle. This represents an immutable asset or, in accounting terms, a fixed asset (a) “non-current asset” in IFRS terminology).
For instance, to make bread, a baker uses flour, salt and water, all of which form part of the end product. The process also entails labour, which has a value only insofar as it transforms the raw material into the end product. At the same time, the baker also needs a bread oven, which is absolutely essential for the production process, but is not destroyed by it. Though this oven may experience wear and tear, it will be used many times over.
This is the major distinction that can be drawn between operating costs and fixed assets. It may look deceptively straightforward, but in practice is no clearer than the distinction between investment and operating outlays. For instance, does an advertising campaign represent a charge linked solely to one period with no impact on any other? Or does it represent the creation of an asset (e.g. a brand) ?
4/ The company's operating profit
From EBITDA, which is linked to the operating cycle, we deduct non-cash costs, which comprise depreciation and amortisation and impairment losses or write-downs on fixed assets.
This gives us operating income or operating profit or EBIT (earnings before interest and taxes), which reflects the increase in wealth generated by the company's industrial and commercial activities.
Operating profit or EBIT represents the earnings generated by investment and operating cycles for a given period.
The term “operating” contrasts with the term “financial”, reflecting the distinction between the real world and the realms of finance. Indeed, operating income is the product of the company's industrial and commercial activities before its financing operations are taken into account. Operating profit or EBIT may also be called operating income, trading profit or operating result.
5/ Earnings and the financing cycle
(a) Debt capital
Repayments of borrowings do not constitute costs but, as their name suggests, merely repayments.
Just as common sense tells us that securing a loan does not increase wealth, neither does repaying a borrowing represent a charge.
The income statement shows only costs related to borrowings. It never shows the repayments of borrowings, which are deducted from the debt recorded on the balance sheet.
We emphasise this point because our experience tells us that many mistakes are made in this area.
Conversely, we should note that the interest payments made on borrowings lead to a decrease in the wealth of the company and thus represent an expense for the company. As a result, they are shown on the income statement.
The difference between financial income and financial expense is called net financial expense/(income).
The difference between operating profit and net financial expense is called profit before tax and non-recurring items.4
(b) Shareholders' equity
From a cash flow standpoint, shareholders' equity is formed through issuance of shares minus outflows in the form of dividends or share buy-backs. These cash inflows give rise to ownership rights over the company. The income statement measures the creation of wealth by the company; it therefore naturally ends with the net earnings (also called net profit). Whether the net earnings are paid in dividends or not is a simple choice of cash position made by the shareholder.
If we take a step back, we see that net earnings and financial interest are based on the same principle of distributing the wealth created by the company. Likewise, income tax represents earnings paid to the State in spite of the fact that it does not contribute any funds to the company.
6/ Recurrent and non-recurrent items: extraordinary and exceptional items, discontinued operations
We have now considered all the operations of a business that may be allocated to the operating, investing and financing cycles of a company. That said, it is not hard to imagine the difficulties involved in classifying the financial consequences of certain extraordinary events, such as losses incurred as a result of earthquakes, other natural disasters or the expropriation of assets by a government.
They are not expected to occur frequently or regularly and are beyond the control of a company's management – hence, the idea of creating a separate catch-all category for precisely such extraordinary items.
We will see in Chapter 9 that the distinction between non-recurring and recurring items is not an easy one, all the more so as accounting regulatory bodies do little to help us.
Among the many different types of exceptional events, we will briefly focus on asset disposals. Investing forms an integral part of the industrial and commercial activities of businesses. But it would be foolhardy to believe that investment is a one-way process. The best-laid plans may fail, while others may lead down a strategic impasse.
Put another way, disinvesting is also a key part of an entrepreneur's activities. It generates exceptional “asset disposal” inflows on the cash flow statement and capital gains and losses on the income statement, which may appear under exceptional items.
By definition, it is easier to analyse and forecast profit before tax and non-recurrent items than net income or net profit, which is calculated after the impact of non-recurrent items and tax.
7/ Net income
Net income measures the creation or destruction of wealth during the fiscal year. Net income is a wealth indicator, not a cash indicator. It incorporates wealth-destructive items like depreciation, which are non-cash items, and most of the time it does not show increases in value, which are only recorded when they are realised through asset sales.
Section 3.2 Different income statement formats
Two main formats of income statement are frequently used, which differ in the way they present revenues and expenses related to the operating and investment cycles. They may be presented either:
- by function,5 i.e. according to the way revenues and costs are used in the operating and investing cycle. This shows the cost of goods sold, selling and marketing costs, research and development costs and general and administrative costs; or
- by nature,6 i.e. by type of expenditure or revenue which shows the change in inventories of finished goods and in work in progress (closing minus opening inventory), purchases of and changes in inventories of goods for resale and raw materials (closing minus opening inventory), other external costs, personnel expenses, taxes and other duties, depreciation and amortisation.
Thankfully, operating profit works out to be the same, irrespective of the format used!
| Presentation | Brazil | China | France | Germany | India | Italy | Japan | Morocco | Russia | Switzerland | UK | US |
| By nature | 7% | 29% | 23% | 23% | 100% | 70% | 0% | 100% | 52% | 40% | 40% | 0% |
| By function | 77% | 71% | 70% | 73% | 0% | 30% | 77% | 0% | 33% | 60% | 50% | 70% |
| Other | 16% | 0% | 7% | 4% | 0% | 0% | 23% | 0% | 15% | 0% | 10% | 30% |
Source: 2013 annual reports from the top 30 listed non-financial groups in each country
The by-nature presentation predominates to a great extent in Italy, India, Spain and Belgium. In the US, the by-function presentation is used almost to the exclusion of any other form.7
Whereas in the past, France, Germany, Switzerland and the UK tended to use systematically the by-nature or by-function format, the current situation is less clear-cut. Moreover, a new presentation is making some headway; it is mainly a by-function format but depreciation and amortisation are not included in the cost of goods sold, in selling and marketing costs, or research and development costs, but is isolated on a separate line.
The two different income statement formats can be summarised by the following diagram:
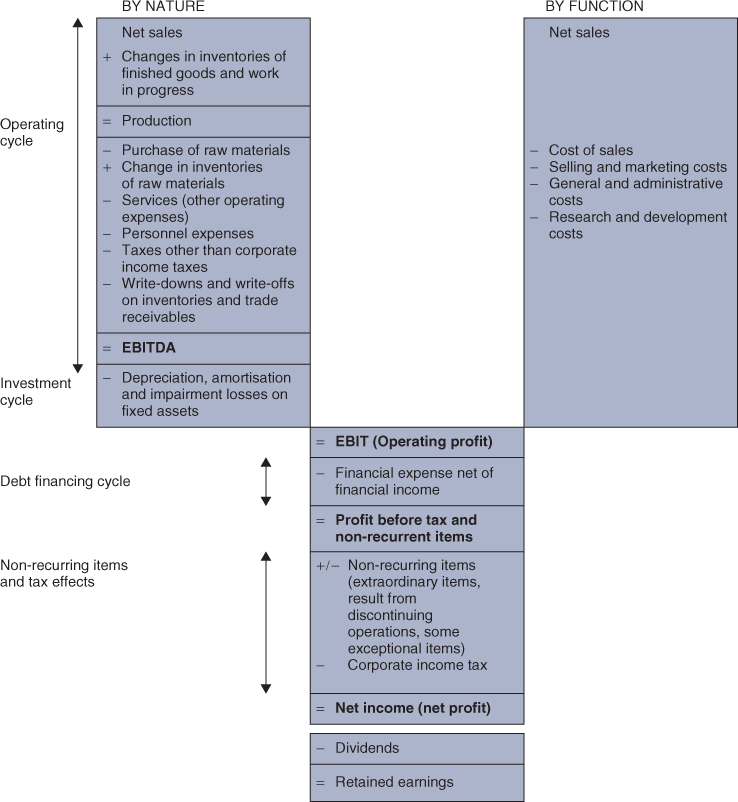
1/ The by-function income statement format
This presentation is based on a management accounting approach, in which costs are allocated to the main corporate functions:
| Function | Corresponding cost |
| Production | Cost of sales |
| Commercial | Selling and marketing costs |
| Research and development | Research and development costs |
| Administration | General and administrative costs |
As a result, personnel expense is allocated to each of these four categories (or three where selling, general and administrative costs are pooled into a single category) depending on whether an individual employee works in production, sales, research or administration. Likewise, depreciation expense for a tangible fixed asset is allocated to production if it relates to production machinery, to selling and marketing costs if it concerns a car used by the sales team, to research and development costs if it relates to laboratory equipment, or to general and administrative costs in the case of the accounting department's computers, for example.
The underlying principle is very simple indeed. This format clearly shows that operating profit is the difference between sales and the cost of sales irrespective of their nature (i.e. production, sales, research and development, administration).
On the other hand, it does not differentiate between the operating and investment processes since depreciation and amortisation is not shown directly on the income statement (it is split up between the four main corporate functions), obliging analysts to track down the information in the cash flow statement or in the notes to the accounts.
2/ The by-nature income statement format
This is the traditional presentation of income statements in many continental European countries, although some groups are dropping it in favour of the by-function format in their consolidated accounts.
The by-nature format is simple to apply, even for small companies, because no allocation of expenses is required. It offers a more detailed breakdown of costs.
Naturally, as in the previous approach, operating profit is still the difference between sales and the cost of sales.
In this format, costs are recognised as they are incurred rather than when the corresponding items are used. Showing on the income statement all purchases made and all invoices sent to customers during the same period would not be comparing like with like.
A business may transfer to inventory some of the purchases made during a given year. The transfer of these purchases to inventory does not destroy any wealth. Instead, it represents the formation of an asset, albeit probably a temporary one, but one that has real value at a given point in time. Secondly, some of the end products produced by the company may not be sold during the year and yet the corresponding costs appear on the income statement.
To compare like with like, it is necessary to:
- eliminate changes in inventories of raw materials and goods for resale from purchases to get raw materials and goods for resale that were used rather than simply purchased;
- add changes in the inventory of finished products and work in progress back to sales. As a result, the income statement shows production rather than just sales.
The by-nature format shows the amount spent on production for the period and not the total expenses under the accruals convention. It has the logical disadvantage that it seems to imply that changes in inventory are a revenue or an expense in their own right, which they are not. They are only an adjustment to purchases to obtain relevant costs.
Exercise 1 will help readers get to grips with the concept of changes in inventories of finished goods and work in progress.
To sum up, there are two different income statement formats:
- the by-nature format which is focused on production in which all the costs incurred during a given period are recorded. This amount then needs to be adjusted (for changes in inventories) so that it may be compared with products sold during the period;
- the by-function format which is built directly in terms of the cost price of goods or services sold.
Either way, it is worth noting that EBITDA depends heavily on the inventory valuation methods used by the business. This emphasises the appeal of the by-nature format, which shows inventory changes on a separate line of the income statement and thus clearly indicates their order of magnitude.
Like operating cash flow, EBITDA is not influenced by the valuation methods applied to tangible and intangible fixed assets or the taxation system.
Summary
The summary of this chapter can be downloaded from www.vernimmen.com.
A distinction needs to be made between cash and wealth. Spending money does not necessarily make you poorer and neither does receiving money necessarily make you any richer. Additions to wealth or deductions from wealth by a company are measured on the income statement. They are the difference between revenues and costs that increase a company's net worth during a given period.
From an accounting standpoint, operating costs reflect what is used up immediately in the operating cycle and somehow forms part of the end product. On the contrary, fixed assets are not destroyed directly during the production process and retain some of their value.
EBITDA (earnings before interest, taxes, depreciation and amortisation) shows the profit generated by the operating cycle (operating revenues − operating costs).
As part of the operating cycle, a business naturally builds up inventories, which are assets. These represent deferred costs, the impact of which needs to be eliminated in the calculation of EBITDA. In the by-nature format, this adjustment is made to operating revenues (by adding back changes in finished goods inventories) and to operating costs (by subtracting changes in inventories of raw materials and goods for resale from purchases). The by-function income statement shows merely sales and the cost of goods sold requiring no adjustment.
Capital expenditures never appear directly on the income statement, but they lead to an increase in the amount of fixed assets held. That said, an accounting assessment of impairment in the value of these investments leads to non-cash expenses, which are shown on the income statement (depreciation, amortisation and impairment losses on fixed assets).
EBIT (Earnings Before Interest and Taxes) shows the profit generated by the operating and investment cycles. In concrete terms, it represents the profit generated by the industrial and commercial activities of a business. It is allocated to:
- financial expense: only costs related to borrowings appear on the income statement, since capital repayments do not represent a destruction of wealth;
- corporate income tax;
- net income that is distributed to shareholders as dividends or transferred to the reserves (as retained earnings).
Questions
1/ A company raises €500m in shareholders' equity for an R&D project. Has it become richer or poorer? By how much? What is your answer if the company spends half of the funds in the first two years, and the project does not produce results? In the third year, the company uses the remaining funds to acquire a competitor that is overvalued by 25%. But thanks to synergies with this new subsidiary, it is able to improve its earnings by €75m. Has it become richer or poorer? By how much?
2/ What are the accounting items corresponding to additions to wealth for shareholders, lenders and the State?
3/ In concrete terms, based on the diagram on page 35, by how much does a company create wealth over a given financial period? Why?
4/ Comment on the following two statements: “This year, we're going to have to go into debt to cover our losses” and “We'll be able to buy out our main competitor, thanks to the profits we made this year”.
5/ In 2014, a company's free cash flow turns negative. Has the company created or destroyed wealth?
6/ Does EBITDA always flow directly into a company's bank account?
7/ Is it correct to say that a company's wealth is increased each year by the amount of EBITDA?
8/ According to the terminology used in Chapter 2, is depreciation a cash outflow or a cost? What is the difference between these two concepts?
9/ Analyse the similarities and the differences between cash and wealth, looking at, for example, investment in real estate and investment in research.
10/ Will repayment of a loan always be recorded on the income statement? Will it always be recorded under a cash item?
11/ Does the inflation-related increase in the nominal value of an asset appear on the income statement?
12/ Why is the increase in inventories of raw materials deducted from purchases in the by-nature income statement format?
13/ Why is change in finished goods inventories recorded under income in the by-nature income statement format?
14/ Should the sale of a fixed asset be classified as part of the “ordinary course of business” of a company? How is it recorded on the income statement? Why under this heading?
15/ Provide several examples illustrating the difference between cash receipts and revenues, cash expenses and costs.
16/ What is a non-cash expense? What is a deferred charge? Describe their similarities and the differences between them.
More questions are waiting for you at www.vernimmen.com.
Exercises
1/ Starjö AB
You are asked by a Swedish company that assembles computers to draw up a by-nature and by-function income statement for year n. You are provided with the following information:
Retail price of a PC: €1500.
Cost of various components:
| Parts | Price | Opening inventory | Closing inventory |
| Case | 50 | 5 | 13 |
| Motherboard | 200 | 8 | 2 |
| Processor | 300 | 4 | 11 |
| Memory | 100 | 6 | 4 |
| Graphic card | 50 | 1 | 13 |
| Hard disk | 150 | 5 | 10 |
| Screen | 200 | 3 | 3 |
| DVD combo | 50 | 7 | 19 |
Over the financial period, the company paid out €60 000 in salaries and social security contributions of 50% of that amount. The company produced 240 PCs. Closing stock of finished products was 27 units and opening stock 14 units.
At the end of the financial period, the manager of the company sells the premises that he had bought for €200 000 three years ago (which was depreciated over 40 years) for €230 000, it now occupies old premises that are fully depreciated, and pays off a €12 000 loan on which the company was paying interest at 5%. What impact do these transactions have on EBITDA, operating profit and net income? Tax is levied at a rate of 35%.
Over the course of the financial period, by how much did the company/the lenders/the company manager (who owns 50% of the shares) get richer/poorer?
2/ Ellingham plc
Draw up the income statement for 2014 in both the by-nature and by-function formats. Depreciation and amortisation come to €6m.
3/ Mumbai Oaks
Consider an Indian business that sells oak barrels to vineyards. At the start of the year, its inventory of finished products was zero. It sold 800 of the 900 barrels it had produced, leaving the closing inventory at 100 barrels. Each barrel sells for INR 10 000. To produce one barrel, the company spends INR 5000 on oak purchases and incurs INR 2000 in labour costs. In addition, the sales force generates costs of INR 450 000 per year and the fully outsourced administrative department incurs costs of INR 400 000 p.a. Annual depreciation expense related to the production facilities comes to INR 300 000. The opening inventory of raw materials was INR 400 000 and the closing inventory INR 500 000. In sum, the business spent INR 4 600 000 on raw materials.
Produce the by-nature income statement.
Assuming that depreciation breaks down into INR 200 000 for the production machinery, INR 70 000 for the sales facilities and INR 30 000 for the administrative facilities, produce the by-function income statement. Are you surprised that both formats give the same EBIT? Why? What do you think about Mumbai Oaks's EBIT margin?
4/ Singapore Kite Surf Magazine
You want to launch the first kitesurfing monthly magazine in Singapore. The economics are the following:
- for each issue you need to pay some friends for the articles ($2000 paid each month including social insurance charges);
- the magazine will be sold only by subscription, you know the universe of buyers and you believe you can sell 1500 subscriptions (no additional sales are expected in the short term);
- fabrication and delivery costs are $2 per magazine;
- you believe you can sell the yearly subscription at $50;
- you should benefit from income tax exemption for the first two years of operations.
You launch your project in September. You close your accounts in December. What will your income statement and cash flow statement be for your first two financial years?
How can you finance your project?
Answers
Questions
1/ Neither. Zero, poorer by €250m. Richer by €25m: 75 – 250 × [25%/(1 + 25%) ]
2/ Net income, financial expenses, corporate income tax.
3/ EBIT (Operating profit) + non-recurring items – corporate income tax. The wealth created is the wealth to be divided up between lenders (financial expenses), the State (corporate income tax) and shareholders (the balance).
4/ Confusion between additions to and deductions from wealth (which is an accounting issue) and cash: in the former, new borrowings do not add wealth to cover the losses; in the latter, profit is not the means used to finance an investment as it does not translate 100% in cash.
5/ There is nothing that tells us whether wealth has been destroyed or created as we do not know what net income for 2014 is.
6/ No, because income and costs may not necessarily correspond to immediate cash receipts or expenses.
7/ No, because a company takes on costs that are deductible from EBITDA to form net income – depreciation, financial costs, etc.
8/ It is a non-cash charge, not a cash expense, i.e. a cost that is recorded, but which does not have to be cashed out.
9/ From a cash standpoint, an investment in real estate is a cash expense which will only generate income on the day it is sold. From a wealth standpoint, real estate is an attractive asset. For investments in R&D, returns must be quicker from a cash standpoint. In terms of wealth, however, the disposal value of R&D is nil.
10/ No, only financial interest is recorded in the income statement. Yes, because debts are repaid in cash.
11/ No, because of the prudence principle.
12/ In order to obtain a figure for purchases consumed in the business in the current year.
13/ In order to counterbalance costs recorded in the income statement which should not affect this year's net income as they are related to unsold products.
14/ No, except if the company is in the business of regularly selling fixed assets, like a car rental company, for example. Capital gains or losses on the sale of a fixed asset will be recorded as exceptional gains/losses (if this category exists in the accounting system).
15/ Sales (revenues) and customer payments (cash receipts). Depreciation and amortisation (costs without cash expenses). Purchase of a machine (cash expense but not a charge).
16/ A non-cash expense is a charge which does not reflect a specific expense, but an accounting valuation of how much wealth has been destroyed. A deferred charge is one that is carried over to the next financial period. Common point: both are based on an accounting decision, resulting in a dilemma for the financial manager: have they been measured properly?
Exercises
A detailed Excel version of the solutions is available at www.vernimmen.com.
1/ Starjö AB
| Production sold | 340 500 | Sales | 340 500 |
| Change in finished goods and in-progress inventory | 19 175 | ||
| Purchases of raw materials and goods for resale | 267 050 | ||
| Change in raw materials and goods for resale | 3050 | ||
| Personnel costs, including payroll taxes | 90 000 | ||
| Other purchases and external costs, including lease payments | 0 | ||
| EBITDA | 5675 | ||
| Depreciation and amortisation | 5000 | Cost of goods sold | 339 825 |
| EBIT | 675 | ||
| Net interest and other financial costs | 600 | ||
| Non-recurring items | 45 000 | ||
| Tax | 15 776 | ||
| Net earnings | 29 299 |
Sale of premises: capital gain of €45 000 shown as a non-recurring item gain.
Rental of premises: extra €12 000 in operating costs (recorded under “Other purchases and external costs”), and disappearance of depreciation and amortisation the following year.
Repayment of the loan: disappearance of €600 in interest expenses the following financial year.
Over the course of the financial year, and after booking these transactions, the company became richer by €29 299 (after tax), the creditors by €600 and the company manager by €14 649.
2/ Ellingham plc: see Chapter 5.
3/ Mumbai Oaks
By-nature income statement:
| Net sales | 800 × INR 10 000 = 8 000 000 | |
| + Closing inventory of finished products − Opening inventory and work in progress |
100 × (5000 + 7000) = 1 700 000 − 0 |
+ Changes in inventories of finished goods and work in progress |
| = Production for the year | 8 700 000 | |
| − Purchases of raw materials and goods for resale − Opening inventory of raw materials and goods for resale + Closing inventory of raw materials and goods for resale |
− 4 600 000 − 400 000 + 500 000 |
= Raw materials and goods for resale consumed |
| = Gross profit on raw materials and goods for resale used | 4 200 000 | |
| − Personnel expenses − Services (other operating expenses) − Depreciation and amortisation |
900 × INR 2000 + INR 450 000 = − 2 250 000 − 400 000 − 300 000 |
|
| = EBIT (operating profit) | 1 250 000 | |
| By-function income statement: | ||
| Sales (products) Cost of sales Selling and marketing costs General and administrative costs |
800 units × 10 000 = INR 8 000 000 200 000 + 800 units × 7000 = INR 5 800 000 70 000 + 450 000 = INR 520 000 30 000 + 400 000 = INR 430 000 |
|
| EBIT (operating profit) | INR 1 250 000 |
This corresponds exactly to the gross margin per unit of INR 3000 multiplied by the 800 units sold minus fixed costs of INR 450 000 (sales force), INR 400 000 (administration) and INR 300 000 (depreciation).
As by-nature and by-function formats differ only by presentation and not substance, it is quite logical that the different formats do not lead to a difference in reported EBIT!
Achieving an EBIT of INR 1 250 000 out of a turnover of INR 8 000 000 is a very nice margin (15.6%). Most industrial groups do not achieve this kind of margin. This may be due to the fact that in most small companies, owners prefer to be paid a low wage and receive higher dividends which are generally taxed at a lower rate than ordinary salaries.
4/ Singapore Kite Surf Magazine
Income statement
| FY1 | FY2 | |
| Sales | 50 × 1500/3 = 25 000 | 50 × 1500 = 75 000 |
| Personnel cost | 4 × 2000 = 8000 | 12 × 2000 = 24 000 |
| Fabrication and distribution | 1500 × 2 × 4 = 12 000 | 1500 × 2 × 12 = 36 000 |
| Net income | 5000 | 15 000 |
| Cash flow statement | ||
| FY1 | FY2 | |
| Operating cash inflow | 50 × 1500 = 75 000 | 50 × 1500 = 75 000 |
| Operating cash outflow | 4 × 2000 + 1500 × 2 × 4 = 20 000 | 12 × 2000 + 1500 × 2 × 12 = 60 000 |
| Cash flow from operations | 55 000 | 15 000 |
If you can convince your clients to pay their subscription before they get the first issue, they will basically finance the project!
Bibliography
For the basics of income statements:
- T. Ittelson, Financial Statements: A Step-by-Step Guide to Understanding and Creating Financial Reports, 2nd edn, Career Pr Inc, 2009.
For a thorough explanation of the structure of the income statement:
- C.R. Baker, Y. Ding, H. Stolowy, The statement of intermediate balance: a tool for international financial statement analysis based on income statement “by nature”, an application to the airline industry, Advances in International Accounting, 18, 2005.
- H. Stolowy, M. Lebas, Y. Ding, Financial Accounting and Reporting: A Global Perspective, 4th edn, Cengage, 2013.
On the relevancy of accounting measures from the income statement:
- L.D. Brown, K. Sivakumar, Comparing the value relevance of two operating income measures, Review of Accounting Studies, 8(4), 561– 572, December 2003.
- J.-F. Casta, S. Lin, O. Ramond, Value relevance of summary accounting income measures, Working Paper, Florida University and Université Paris-Dauphine, February 2007.