
Chapter 8
How to perform a financial analysis
Opening up the toolbox
Before embarking on an examination of a company's accounts, readers should take the time to:
- carry out a strategic and economic assessment, paying particular attention to the characteristics of the sector in which the company operates, the quality of its positions and how well its production model, distribution network and ownership structure fit with its business strategy;
- carefully read and critically analyse the auditors' report and the accounting rules and principles adopted by the company when preparing its accounts. These documents describe how the company's economic and financial situation is translated by means of a code (i.e. accounting) into tables of figures (accounts).
Since the aim of financial analysis is to portray a company's economic reality by going beyond just the figures, it is vital to think about what this reality is and how well it is reflected by the figures before embarking on an analysis of the accounts. Otherwise, the resulting analysis may be sterile, overly descriptive and contain very little insight. It would not identify problems until they have shown up in the numbers, i.e. after they have occurred and when it is too late for investors to sell their shares or reduce their credit exposure.
Once this preliminary task has been completed, readers can embark on the standard course of financial analysis that we suggest and use more sophisticated tools, such as credit scoring and ratings.
But first and foremost, we need to deal with the issue of what financial analysis actually is.
Section 8.1 What is financial analysis?
1/ What is financial analysis for?
Financial analysis is a tool used by existing and potential shareholders of a company, as well as lenders or rating agencies. For shareholders, financial analysis assesses whether the company is able to create value. It usually involves an analysis of the value of the share and ends with the formulation of a buy or a sell recommendation on the share. For lenders, financial analysis assesses the solvency and liquidity of a company, i.e. its ability to honour its commitments and repay its debts on time.
We should emphasise, however, that there are not two different sets of processes depending on whether an assessment is being carried out for shareholders or lenders. Even though the purposes are different, the techniques used are the same for the very simple reason that a value-creating company will be solvent and a value-destroying company will, sooner or later, face solvency problems. Both lenders and shareholders look very carefully at a company's cash flow statement because it shows the company's ability to repay debts to lenders and to generate free cash flows, the key value driver for shareholders.
2/ Financial analysis is more of a practice than a theory
The purpose of financial analysis, which primarily involves dealing with economic and accounting data, is to provide insight into the reality of a company's situation on the basis of figures. Naturally, knowledge of an economic sector and a company and, more simply, some common sense may easily replace some financial analysis techniques. Very precise conclusions may be made without sophisticated analytical techniques.
Financial analysis should be regarded as a rigorous approach to the issues faced by a business that helps rationalise the study of economic and accounting data.
The financial analyst is heavily dependent on accounting figures which do not systematically give an appropriate view of the economic and financial reality of a company. Consequently, from time to time, he has to adjust some elements of the published accounts to make them more relevant and easier to interpret.
3/ It represents a resolutely global vision of the company
It is worth noting that although financial analysis carried out internally within a company and externally by an outside observer is based on different information, the logic behind it is the same in both cases. Financial analysis is intended to provide a global assessment of the company's current and future position.
Whether carrying out an internal or external analysis, an analyst should seek to study the company primarily from the standpoint of an outsider looking to achieve a comprehensive assessment of abstract data, such as the company's strategy and its results. Fundamentally, financial analysis is a method that helps to describe the company in broad terms on the basis of a few key points.
From a practical standpoint, the analyst has to match the policies adopted by the company and its real situation. Therefore, analysts' effectiveness is not measured by their use of sophisticated techniques but by their ability to uncover evidence of the inaccuracy of the accounting data or of serious problems being concealed. As an example, a company's earnings power may be maintained artificially through a revaluation or through asset disposals, while the company is experiencing serious cash flow problems. In such circumstances, competent analysts will cast doubt on the company's earnings power and track down the root cause of the deterioration in profitability.
We frequently see that external analysts are able to piece together the global economic model of a company and place it in the context of its main competitors. By analysing a company's economic model over the medium term, analysts are able to detect chronic weaknesses and separate them from temporary glitches. For instance, an isolated incident may be attributable to a precise and non-recurring factor, whereas a string of incidents caused by different factors will prompt an external analyst to look for more fundamental problems likely to affect the company as a whole.
Naturally, it is impossible to appreciate the finer points of financial analysis without grasping the fact that a set of accounts represents a compromise between different concerns. Let's consider, for instance, a company that is highly profitable because it has a very efficient operating structure, but also posts a non-recurrent profit. We see a slight deterioration in its operating ratios. In our view, it is important not to make hasty judgements. The company probably attempted to adjust the size of the exceptional gain by being very strict in the way that it accounts for operating revenues and costs.
Section 8.2 Economic analysis of companies
An economic analysis of a company does not require cutting-edge expertise in industrial economics or encyclopedic knowledge of economic sectors. Instead, it entails straightforward reasoning and a good deal of common sense, with an emphasis on:
- analysing the company's market and its position within its market;
- studying its production model;
- analysing its distribution networks;
- and, lastly, identifying what motivates the company's key people.
1/ Analysis of the company's market
Understanding the company's market generally leads analysts to reach conclusions that are important for the analysis of the company as a whole.
(a) What is a market?
First of all, a market is not an economic sector as statistics institutes, central banks or professional associations would define it. Markets and economic sectors are two completely separate concepts.
What is the market for pay-TV operators such as BSkyB, Premier, Telepiù or Canal+? It is the entertainment market, not just the TV market. Competition comes from cinema multiplexes, DVDs and live sporting events rather than from ITV, RTL TV, Rai Uno or TF1, which mainly sell advertising slots to advertisers seeking to target the legendary housewife below 50 years of age.
So what is a market? A market is defined by consistent behaviour, e.g. a product satisfying similar needs, purchased through a similar distribution network by the same customers.
A market is not the same as an economic sector. Rather, it is a niche or space in which a business has some industrial, commercial or service-oriented expertise. It is the arena in which it competes.
Once a market has been defined, it can then be segmented using geographical (i.e. local, regional, national, worldwide) and sociological (luxury, mid-range, entry-level products) variables. This is also an obvious tactic adopted by companies seeking to gain protection from their rivals. If such a tactic succeeds, a company will create its own market in which it reigns supreme. Apple, with its iPad, has created a product that is neither a PDA nor a computer but a unique product. But before readers get carried away and rush off to create their very own markets arenas, it should be remembered that a market always comes under threat sooner or later, think about the BlackBerry and smartphones.
Segmenting markets is never a problem for analysts, but it is vital to get the segmentation right! To say that a manufacturer of running shoes has a 30% share of the German running shoe market may be correct from a statistical standpoint but is totally irrelevant from an economic standpoint, because this is a worldwide market with global brands backed by marketing campaigns featuring international champions. Conversely, a 40% share of the northern Swiss cement market is a meaningful number, because cement is a heavy product with a low unit value that cannot be stored for long and is not usually transported more than 150– 200 km from the cement plants.
(b) Market growth
Once a financial analyst has studied and defined a market, his natural reflex is then to attempt to assess the growth opportunities and identify the risk factors. The simplest form of growth is organic volume growth, i.e. selling more and more products.
That said, it is worth noting that volume growth is not always as easy as it may sound in developed countries given weak demographic growth (e.g. between −0.5% and +1% p.a. in Europe). Booming markets do exist (flatscreen TV sets), but others are rapidly contracting (nuclear power stations, daily newspapers) or are cyclical (transportation, paper production).
At the end of the day, in mature countries, the most important type of growth is value growth. Let's imagine that we sell a product satisfying a basic need, such as bread. Demand does not grow much and, if anything, appears to be declining. So we attempt to move upmarket by means of either marketing or packaging, or by innovating. As a result, we decide to switch from selling bread to providing a whole range of speciality products, such as baguettes, rye bread and farmhouse loaves, and we start charging € 1.10 or even € 1.30, rather than € 0.90 per item. The risk of pursuing this strategy is that our rivals may react by focusing on a narrow range of straightforward, unembellished products that sell for less than ours, e.g. a small shop that bakes pre-prepared dough in its ovens or the in-store bakeries at food superstores.
Once we have analysed the type of growth, we need to attempt to predict its duration, and this is no easy task. The famous 17th century letter writer Mme de Sévigné once forecast that coffee was just a fad and would not last for more than a week. At the other end of the spectrum, it is not uncommon to hear entrepreneurs claiming that their products will revolutionise consumers' lifestyles and even outlast the wheel!
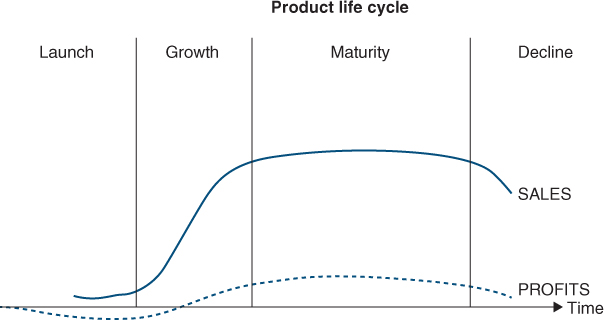
To tackle the question of market growth, we need to look at the product lifecycle.
Growth drivers in a developed economy are often highly complex. They may include:
- technological advances, new products (e.g. TV on mobile phones);
- changes in the economic situation (e.g. expansion of air travel with the rise in living standards);
- changes in consumer lifestyles (e.g. eating out);
- changing fashions (e.g. snowboards, catamarans);
- demographic trends (e.g. popularity of cruises owing to the ageing of the population);
- environmental considerations (e.g. electric cars);
- delayed uptake of a product (e.g. mobile banking in Africa where the retail banking network was limited).
In its early days, the market evolves rapidly, as products are still poorly geared to consumers' needs. During the growth phase, the technological risk has disappeared, the market has become established and expands rapidly, being fairly insensitive to fluctuations in the economy at large. As the market reaches maturity, sales become sensitive to ups and downs in general economic conditions. And as the market ages and goes into decline, price competition increases, and certain market participants fall by the wayside. Those that remain may be able to post very attractive margins, and no more investment is required.
Lastly, readers should note that an expanding sector is not necessarily an attractive sector from a financial standpoint. Where future growth has been over-estimated, supply exceeds demand, even when growth is strong, and all market participants lose money (e.g. the solar panel industry). For instance, after a false start in the 1980s (when the leading player Atari went bankrupt), the video games sector has experienced growth rates of well over 20%, but returns on capital employed of most companies in this sector are, at best, poor. Conversely, tobacco, which is one of the most mature markets in existence, generates a very high level of return on capital employed for the last few remaining companies operating in the sector.
(c) Market risk
Market risk varies according to whether the product in question is original equipment or a replacement item. A product sold as original equipment will seem more compelling in the eyes of consumers who do not already possess it. And it is the role of advertising to make sure this is how they feel. Conversely, should consumers already own a product, they will always be tempted to delay replacing it until their conditions improve and thus will spend their limited funds on another new product. Needs come first! Put another way, replacement products are much more sensitive to general economic conditions than original equipment. For instance, sales in the European truck industry beat all existing records in 2007 when the economy was in excellent shape, but sales slumped to new lows in 2009 when the recession kicked in. Sales picked up again in 2010–2011 only to fall again in 2012.
With this in mind, it is vital for an analyst to establish whether a company's products are acquired as original equipment or as part of a replacement cycle because this directly affects the company's sensitivity to general economic conditions.
All too often we have heard analysts claim that a particular sector, such as the food industry, does not carry any risk (because we will always need to eat!). These analysts either cannot see the risks or they disregard them. Granted, we will always need to eat and drink, but not necessarily in the same way. For instance, eating out is on the increase, soda consumption is declining and consumption of fresh fruit juice is growing fast.
Risk also depends on the nature of barriers to entry to the company's market and whether or not alternative products exist. Nowadays barriers to entry tend to weaken constantly owing to:
- a powerful worldwide trend towards deregulation (there are fewer and fewer monopolies, e.g. in railways and postal services);
- technological advances (and in particular the Internet);
- a strong trend towards internationalisation.
All these factors have increased the number of potential competitors and made the barriers to entry erected by existing players far less sturdy.
For instance, the five record industry majors – Sony, Bertelsmann, Universal, Warner and EMI – had achieved worldwide domination of their market, with a combined market share of 80%. Nevertheless, they have seen their grip loosened by the development of the Internet and artists' ability to sell their products directly to consumers through music downloads – not to mention the impact of piracy!
(d) Market share
The position held by a company in its market is reflected by its market share, which indicates the share of business in the market (in volume or value terms) achieved by the company.
A company with substantial market share has the advantage of:
- some degree of loyalty among its customers, who regularly make purchases from the company. As a result, the company reduces the volatility of its business;
- a strong bargaining position vis-à-vis its customers and suppliers. Mass retailers are a perfect example of this;
- an attractive position which means that any small producer wishing to put itself up for sale, any inventor of a new product or new technique or any talented new graduate will usually come to see this market leader first, because a company with a large market share is a force to be reckoned with in its market.
That said, just because market share is quantifiable does not mean that the numbers are always relevant. For instance, market share is meaningless in the construction and public works market (and indeed is never calculated). Customers in this sector do not renew their purchases on a regular basis (town halls, swimming pools and roads have a long useful life). Even if they do, contracts are awarded through a bidding process, meaning that there is no special link between customers and suppliers. Likewise, building up market share by slashing prices without being able to hold onto the market share accumulated after prices are raised again is pointless. This inability demonstrates the second limit on the importance of market share: the acquisition of market share must create value, otherwise it serves no purpose.
Lastly, market share is not the same as size. For instance, a large share of a small market is far more valuable than middling sales in a vast market.
(e) The competition
If the market is expanding, it is better to have smaller rivals than several large ones with the financial and marketing clout to cream off all the market's expansion. Where possible, it is best not to try to compete against the likes of Google. Conversely, if the market has reached maturity, it is better for the few remaining companies which have specialised in particular niches to be faced with large rivals that will not take the risk of attacking them because the potential gains would be too small. Conversely, a stable market with a large number of small rivals frequently degenerates into a price war that drives some players out of business.
But since a company cannot choose its rivals, it is important to understand what drives them. Some rivals may be pursuing power or scale-related targets (e.g. biggest turnover in the industry) that are frequently far from profitability targets. Consequently, it is very hard for groups pursuing profitability targets to grow in such conditions. So how can a company achieve profitability when its main rivals, e.g. farming cooperatives in the canned vegetables sector, are not profit-driven? It is very hard indeed because it will struggle to develop since it will generate weak profits and thus have few resources at its disposal.
(f) How does competition work?
Roughly speaking, competition is driven either by prices or by products:
- Where competition is price-driven, pricing is the main–if not the only–factor that clinches a purchase. Consequently, costs need to be kept under tight control so that products are manufactured as cheaply as possible, product lines need to be streamlined to maximise economies of scale and the production process needs to be automated as far as possible. Market share is a key success factor since higher sales volumes help keep down unit costs (see Boston Consulting Group's famous experience curve which shows that unit costs fall by 20% when total production volumes double in size). This is where engineers and financial controllers are most at home! It applies to markets such as petrol, milk, phone calls, and so on.
- Where competition is product-driven, customers make purchases based on after-sales service, quality, image, etc., which are not necessarily price-related. Therefore, companies attempt to set themselves apart from their rivals and pay close attention to their sales and customer loyalty techniques. This is where the marketing specialists are in demand! Think about Nespresso's quality of product and service, Harrods's atmosphere or, of course, Apple.
The real world is never quite as simple, and competition is rarely only price- or product-driven but is usually dominated by one or the other or may even be a combination of both, e.g. vitamin-enhanced milk, caller-display services for phone calls, bio wine.
2/ Production
(a) Value chain
A value chain comprises all the companies involved in the manufacturing process, from the raw materials to the end product. Depending on the exact circumstances, a value chain may encompass the processing of raw materials, R&D, secondary processing, trading activities, a third or fourth processing process, further trading and lastly the end distributor. Increasingly in our service-oriented society, grey matter is the raw material, and processing is replaced by a series of services involving some degree of added value, with distribution retaining its role.
The point of analysing a value chain is to understand the role played by the market participants, as well as their respective strengths and weaknesses. Naturally, in times of crisis, all participants in the value chain come under pressure. But some of them will suffer more than others, and some may even disappear altogether because they are structurally in a weak position within the value chain. Analysts need to determine where the structural weaknesses lie. They must be able to look beyond good performance when times are good because it may conceal such weaknesses. Analysts' ultimate goal is to identify where not to invest or not to lend within the value chain.
When studying a value chain, analysts need to identify weaknesses where a particular category of player has no or very little room for manoeuvre (scope for developing new lines of business for selling operating assets with value independent of their current use, etc.).
(b) Production models
In a service-dominated economy, the production models used by an industrial company are rarely analysed, even though we believe this is a very worthwhile exercise.
The first step is to establish whether the company assumes responsibility for or subcontracts the production function, whether production takes place locally or whether it has been transferred to low-labour-cost countries and whether the labour force is made up of permanent or temporary staff, etc. This step allows the analyst to measure the flexibility of the income statement in the event of a recession or strong growth in the market.
In doing so, the analyst can detect any inconsistency between the product and the industrial organisation adopted to produce it. As indicated in the following chart, there are four different types of industrial organisations:
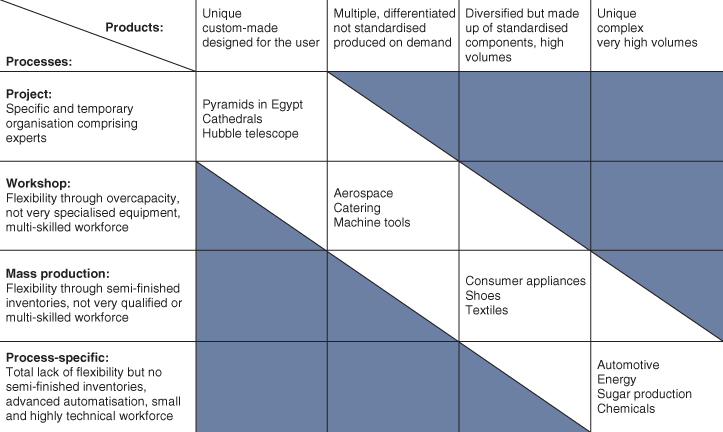
Source: Adapted from J.C. Tarondeau
The project-type organisation falls outside the scope of financial analysis. Although it exists, its economic impact is very modest indeed.
The workshop model may be adopted by craftsmen, in the luxury goods sector or for research purposes, but as soon as a product starts to develop, the workshop model should be discarded as soon as possible.
Mass production is suitable for products with a low unit cost, but gives rise to very high working capital owing to the inventories of semi-finished goods that provide its flexibility. With this type of organisation, barriers to entry are low because as soon as a process designer develops an innovative method, it can be sold to all the market players. This type of production is frequently relocated to emerging markets.
Process-specific production is a type of industrial organisation that took shape in the late 1970s and revolutionised production methods. It has led to a major decline in working capital because inventories of semi-finished goods have almost disappeared. It is a continuous production process from the raw material to the end product, which requires the suppliers, subcontractors and producers to be located close to each other and to work on a just-in-time basis. This type of production is hard to relocate to countries with low labour costs owing to its complexity (fine-tuning), and it does not provide any flexibility given the elimination of the inventories of semi-finished goods. A strike affecting a supplier or subcontractor may bring the entire group to a standstill.

The natural tendency for all industries is to evolve gradually, mirroring trends in the motor industry during the 20th century.
But readers should not allow themselves to get carried away with the details of these industrial processes. Instead, they should examine the pros and cons of each process and consider how well the company's business strategy fits with its selected production model. Workshops will never be able to deliver the same volumes as mass production!
(c) Capital expenditure
A company should not invest too early in the production process. When a new product is launched on the market, there is an initial phase during which the product must show that it is well suited to consumers' needs. Then the product will evolve, more minor new features will be built in and its sales will increase.
From then on, the priority is to lower costs; all attention and attempts at innovation will then gradually shift from the product to the production model.
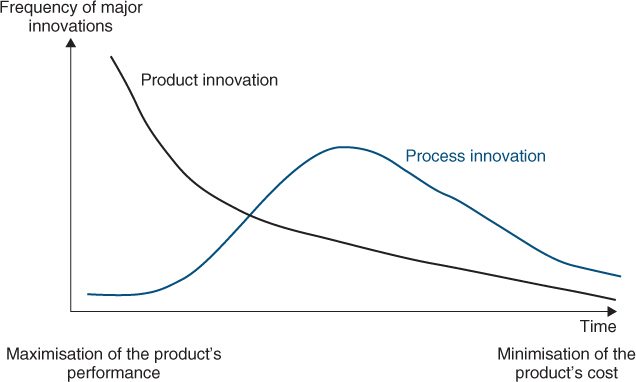
Source: Utterback and Abernathy (1975)
Investing too early in the production process is a mistake for two reasons. Firstly, money should not be invested in production facilities that are not yet stable and might even have to be abandoned. Secondly, it is preferable to use the same funds to anchor the product more firmly in its market through technical innovation and marketing campaigns. Consequently, it may be wiser to outsource the production process and not incur production-related risks on top of the product risk. Conversely, once the production process has stabilised, it is in the company's best interests to invest in securing a tighter grip over the production process and unlocking productivity gains that will lead to lower costs.
More and more, companies are looking to outsource their manufacturing or service operations, thereby reducing their core expertise to project design and management. Roughly speaking, companies in the past were geared mainly to production and had a vertical organisation structure because value was concentrated in the production function. Nowadays, in a large number of sectors (telecoms equipment, computer production, etc.), value lies primarily in the research, innovation and marketing functions.
Companies therefore have to be able to organise and coordinate production carried out externally. This outsourcing trend has given rise to companies such as Foxconn, Solectron, and Flextronics, whose sole expertise is industrial manufacturing and who are able to secure low costs and prices by leveraging economies of scale because they produce items on behalf of several competing groups.
3/ Distribution systems
A distribution system usually plays three roles:
- logistics: displaying, delivering and storing products;
- advice and services: providing details about and promoting the product, providing after-sales service and circulating information between the producer and consumers, and vice versa;
- financing: making firm purchases of the product, i.e. assuming the risk of poor sales.
These three roles are vital, and where the distribution system does not fulfil them or does so only partially, the producer will find itself in a very difficult position and will struggle to expand.
Let's consider the example of the retail furniture sector. It does not perform the financing role because it does not carry any inventory aside from a few demonstration items. The logistics side merely entails displaying items, and advice is limited, to say the least. As a result, the role of furniture producers is merely that of piece-workers who are unable to build their own brand (a) proof of their weakness), the only well-known brands being private-label brands such as IKEA.
It is easy to say that producers and distributors have diverging interests, but this is not true. Their overriding goal is the same, i.e. that consumers buy the product. Inevitably, producers and distributors squabble over their respective share of the selling price, but that is a secondary issue. A producer will never be efficient if the distribution network is inefficient.
The risk of a distribution network is whether it performs its role properly and whether it restricts the flow of information between the producer and consumers.
So what type of distribution system should a company choose? Naturally, this is a key decision for companies. The closer they can get to their end customers, possibly even handling the distribution role themselves, the faster and more accurately they will find out what their customers want (pricing, product ranges, innovation, etc.). And the earlier they become aware of fluctuations in trading conditions, the sooner they will be able to adjust their output. But such choice requires special human skills, investment in logistics and sales facilities and substantial working capital.
This approach makes more sense where the key factor motivating customer purchases is not pricing but the product's image, after-sales service and quality, which must be tightly controlled by the company itself rather than an external player. For instance, in recent years Burberry has initiated a strategy to buy back the franchises and licences on its trademark it had set up in certain countries.
Being far from end customers carries with it the opposite pros and cons. The requisite investment is minimal, but the company is less aware of its customers' preferences, and the risks associated with cyclical ups and downs are amplified. If end customers slow down their purchases, it may take some time before the end retailer becomes aware of the trend and reduces its purchases from the wholesaler. The wholesaler will, in turn, suffer from an inertia effect before scaling down its purchases from the producer, who will not therefore have been made aware of the slowdown until several weeks or even months after it started. And when conditions pick up again, it is not unusual for distributors to run out of stock even though the producer still has vast inventories.
Where price competition predominates, it is better for the producer to focus its investment on production facilities to lower its costs, rather than to spread it thinly across a distribution network that requires different expertise from the production side. In this regard, the Internet can be a cost-effective means of distribution.
4/ The company and its people
All too often, we have heard it said that a company's human resources are what really count. In certain cases, this is used to justify all kinds of strange decisions. There may be some truth to it in smaller companies, which do not have strategic positions and survive thanks to the personal qualities and charisma of their managers. Such a situation represents a major source of uncertainty for lenders and shareholders. To say that the men and women employed by a company are important may well be true, but management will still have to establish strategic positions and build up economic rents1 that give some value to the company aside from its founder or manager.
(a) Shareholders
From a purely financial standpoint, the most important men and women of a company are its shareholders. They appoint its executives and determine its strategy. It is important to know who they are and what their aims are, as we will see in Chapter 41. There are two types of shareholder, namely inside and outside shareholders.
Inside shareholders are shareholders who also perform a role within the company, usually with management responsibilities. This fosters strong attachment to the company and sometimes leads to the pursuit of scale-, power- and prestige-related objectives that may have very little to do with financial targets. Outside shareholders do not work within the company and behave in a purely financial manner.
What sets inside shareholders apart is that they assume substantial personal risks because both their assets and income are dependent on the same source, i.e. the company. Consequently, inside shareholders usually pay closer attention than a manager who is not a shareholder and whose wealth is only partly tied up in the company. Nonetheless, the danger is that inside shareholders may not take the right decisions, e.g. to shut down a unit, dispose of a business or discontinue an unsuccessful diversification venture, owing to emotional ties or out of obstinacy. The Kirch Group would probably have fared better during the early 2000s had the group's founder not clung on to his position as CEO well into retirement age and had groomed a successor.
Outside shareholders have a natural advantage. Because their behaviour is guided purely by financial criteria, they will serve as a very useful touchstone for the group's strategy and financial policy. That said, if the company runs into problems, they may act very passively and show a lack of resolve that will not help managers very much.
Analysts should watch out for conflicts among shareholders that may paralyse the normal life of the company. As an example, disputes among the founding family members almost ruined Gucci.
(b) Managers
It is important to understand the managers' objectives and attitude vis-à-vis shareholders. The reader needs to bear in mind that the widespread development of share-option-based incentive systems in particular has aligned the managers' financial interests with those of shareholders. We will examine this topic in greater depth in Chapter 26.
We would advise readers to be very cautious where incentive systems have been extended to include the majority of a company's employees. Firstly, stock options cannot yet be used to buy food or pay rents and so salaries must remain the main source of income for unskilled employees. Secondly, should a company's position start to deteriorate, its top talent will be fairly quick to jump ship after having exercised their stock options before they become worthless. Those that remain on board may fail to grasp what is happening until it is too late, thereby losing precious time. This is what happened to so-called new economy companies, which distributed stock options as a standard form of remuneration. It is an ideal system when everything is going well, but highly dangerous in the event of a crisis because it exacerbates the company's difficulties.
(c) Corporate culture
Corporate culture is probably very difficult for an outside observer to assess. Nonetheless, it represents a key factor, particularly when a company embarks on acquisitions or diversification ventures. A monolithic and highly centralised company with specific expertise in a limited number of products will struggle to diversify its businesses because it will probably seek to apply the same methods to its target, thereby disrupting the ?latter's impetus.
For instance, Daimler of Germany acquired US car producer Chrysler, but the deal never really worked because Daimler's structured and hierarchical culture was far removed from the young and innovative culture prevailing in Chrysler at the time.
Section 8.3 An assessment of a company's accounting policy
We cannot overemphasise the importance of analysing the auditors' report and considering the accounting principles adopted before embarking on a financial analysis of a group's accounts based on the guide that we will present in Section 8.4.
If a company's accounting principles are in line with practices, readers will be able to study the accounts with a fairly high level of assurance about their relevance, i.e. their ability to provide a decent reflection of the company's economic reality.
Conversely, if readers detect anomalies or accounting practices that depart from the norm, there is little need to examine the accounts because they provide a distorted picture of the company's economic reality. In such circumstances, we can only advise the lender not to lend or to dispose of its loans as soon as possible and the shareholder not to buy shares or to sell any already held as soon as possible. A company that adopts accounting principles that deviate from the usual standards does not do so by chance. In all likelihood the company will be seeking to window-dress a fairly grim reality.
Section 8.4 Standard financial analysis plan
Experience has taught us that novices are often disconcerted when faced with the task of carrying out their first financial analysis because they do not know where to start and what to aim for. They risk producing a collection of mainly descriptive comments without connecting them or verifying their internal consistency, i.e. without establishing any causal links.
A financial analysis is an investigation that must be carried out in a logical order. It comprises parts that are interlinked and should not therefore be carried out in isolation. Financial analysts are detectives, constantly on the lookout for clues, seeking to establish a logical sequence, as well as looking for any disruptive factor that may be a prelude to problems in the future. The questions they most often need to ask are “Is this logical? Is this consistent with what I have already found? If so, why? If not, why not?”
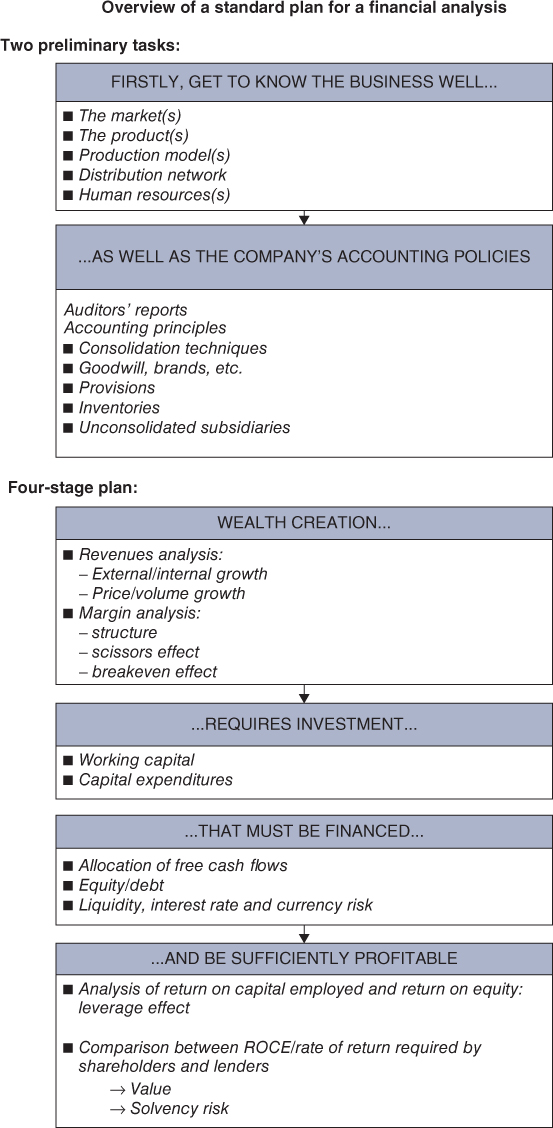
We suggest that readers remember the following sentence, which can be used as the basis for all types of financial analysis:
Wealth creation requires investment that must be financed and provide sufficient return.
Let us analyse this sentence in more depth. A company will be able to remain viable and ultimately survive only if it manages to find customers ready to buy its goods or services in the long term at a price that enables it to post a sufficient operating profit. This forms the base for everything else. Consequently, it is important to look first at the structure of the company's earnings. But the company needs to make capital expenditures to start operations: acquiring equipment, buildings, patents, subsidiaries, etc. (which are fixed assets) and setting aside amounts to cover working capital. Fixed assets and working capital jointly form its capital employed. Naturally, these outlays will have to be financed either through equity or bank loans and other borrowings.
Once these three factors (margins, capital employed and financing) have been examined, the company's profitability, i.e. its efficiency, can be calculated, in terms of either its return on capital employed (ROCE) or its return on equity (ROE). This marks the end of the analyst's task and provides the answers to the original questions, i.e. Is the company able to honour the commitments it has made to its creditors? Is it able to create value for its shareholders?
Consequently, we have to study the company's:
- wealth creation, by focusing on:
- trends in the company's sales, including an analysis of both prices and volumes. This is a key variable that sets the backdrop for a financial analysis. An expanding company does not face the same problems as a company in decline, in a recession, pursuing a recovery plan or experiencing exponential growth;
- the impact of business trends, the strength of the cycle and its implications in terms of volumes and prices (gap vs. those seen at the top or bottom of the cycle);
- trends in margins and particularly the EBITDA and EBIT margins;
- an examination of the scissors effect (see Chapter 9) and the operating leverage (see Chapter 10), without which the analysis is not very robust from a conceptual standpoint.
- capital employed policy, i.e. capital expenditure and working capital (see Chapter 11);
- financing policy: This involves examining how the company has financed capital expenditure and working capital either by means of debt, equity or internally generated cash flow. The best way of doing so is to look at the cash flow statement for a dynamic analysis and the balance sheet for a snapshot of the situation at the company's year end (see Chapter 12).
- profitability by:
- analysing its return on capital employed (ROCE) and return on equity (ROE), leverage effect and associated risk (see Chapter 13);
- comparing actual profitability with the required rate of return (on capital employed or by shareholders) to determine whether the company is creating value and whether the company is solvent (see Chapter 14).
In the following chapters we use the case of the Indesit group as an example of how to carry out a financial analysis.
Indesit is one of the world's largest manufacturers of household appliances. It operates 18 facilities and sells washing machines, ovens, dishwashers, etc. under the brand names Indesit, Hotpoint and Scholtès. It employs 16 000 people.
Net sales in 2013 were € 2.7bn in four main lines of products: cooking, cooling, washing and services. It generates 58% of its sales in Western Europe and 37% in Eastern Europe.
Annual reports of Indesit from 2004 to 2013 are available on the website www.vernimmen.com.
Let's now see the various different techniques that can be used in financial analysis.
Section 8.5 The various techniques of financial analysis
1/ Trend analysis or the study of the same company over several periods
Financial analysis always takes into account trends over several years because its role is to look at the past in order to assess the present situation and to forecast the future. It may also be applied to projected financial statements prepared by the company. The only way of teasing out trends is to look at performance over several years (usually at least three where the information is available).
Analysts need to bring to light any possible deterioration so that they can seize on any warning signals pointing to major problems facing the company. All too often we have seen lazy analysts look at the key profit indicators without bothering to take a step back and analyse trends. Nonetheless, this approach has two important drawbacks:
- trend analysis only makes sense when the data are roughly comparable from one year to the next. This is not the case if the company's business activities, business model (e.g. massive use of outsourcing) or scope of consolidation change partially or entirely, not to mention any changes in the accounting rules used to translate its economic reality;
- accounting information is always published with a delay. Broadly speaking, the accounts for a financial year are published between one and four months after the year end, and they may no longer bear any relation to the company's present situation. In this respect, external analysts stand at a disadvantage to their internal counterparts who are able to obtain data much more rapidly if the company has an efficient information system.
2/ Comparative analysis or comparing similar companies
Comparative analysis consists of evaluating a company's key profit indicators and ratios so that they can be compared with the typical (median or average) indicators and ratios of companies operating in the same sector of activity. The basic idea is that one should not get up to any more nonsense than one's neighbours, particularly when it comes to a company's balance sheet. Why is that? Simply because during a recession most of the lame ducks will be eliminated and only healthy companies will be left standing. A company is not viable or unviable in absolute terms. It is merely more or less viable than others.
The comparative method is often used by financial analysts to compare the financial performance of companies operating in the same sector, by certain companies to set customer payment periods, by banks to assess the abnormal nature of certain payment periods and of certain inventory turnover rates, and by those examining a company's financial structure. It may be used systematically by drawing on the research published by organisations (such as central banks, Datastream, Standard & Poor's or Moody's, etc.) that compile the financial information supplied by a large number of companies. They publish the main financial characteristics, in a standardised format, of companies operating in different sectors of activity, as well as the norm (median or average) for each indicator or ratio in each sector. This is the realm of benchmarking.
This approach has two drawbacks:
- The concept of sector is a vague one and depends on the level of detail applied. This approach analyses a company based on rival firms, so to be of any value, the information compiled from the various companies in the sector must be consistent, and the sample must be sufficiently representative.
- There may be cases of mass delusion, leading to all the stocks in a particular sector being temporarily overvalued. Financial investors should then withdraw from the sector.
3/ Normative analysis and financial rules of thumb
Normative analysis represents an extension of comparative analysis. It is based on a comparison of certain company ratios or indicators with rules or standards derived from a vast sample of companies.
For instance, there are norms specific to certain industries:
- in the hotel sector, the bed-per-night cost must be at least 1/1000 of the cost of building the room, or the sales generated after three years should be at least one-third of the investment cost;
- the level of work in progress relative to the company's shareholders' equity in the construction sector;
- the level of sales generated per square metre in supermarkets, etc.
There are also some financial rules of thumb applicable to all companies regardless of the sector in which they operate and relating to their balance sheet structure:
- fixed assets should be financed by stable sources of funds;
- net debt should be no greater than around three times EBITDA;
Readers should be careful not to set too much store by these norms, which are often not very robust from a conceptual standpoint because they are determined from statistical studies. These ratios are hard to interpret, except perhaps where capital structure is concerned. After all, profitable companies can afford to do what they want, and some may indeed appear to be acting rather whimsically, but profitability is what really matters. Likewise, we will illustrate in Section IV of this book that there is no such thing as an ideal capital structure.
Section 8.6 Ratings
Credit ratings are the result of a continuous assessment of a borrower's solvency by a specialised agency (mainly Standard & Poor's, Moody's and Fitch), by banks for internal purposes to ensure that they meet prudential ratios, and by credit insurers (e.g. Euler Hermes, Atradius). As we shall see in Chapter 20, this assessment leads to the award of a rating reflecting an opinion about the risk of a borrowing. The financial risk derives both from:
- the borrower's ability to honour the stipulated payments; and
- the specific characteristics of the borrowing, notably its guarantees and legal characteristics.
The rating is awarded at the end of a fairly lengthy process. Rating agencies assess the company's strategic risks by analysing its market position within the sector (market share, industrial efficiency, size, quality of management, etc.) and by conducting a financial analysis.
The main aspects considered include trends in the operating margin, trends and sustainability of return on capital employed, analysis of capital structure (and notably coverage of financial expense by operating profit and coverage of net debt by cash generated by operations or cash flow). We will deal with these ratios in more depth in Chapters 9 to 14.
Let us now deal with what may be described as “automated” financial analysis techniques, which we will not return to again.
Section 8.7 Scoring techniques
1/ The principles of credit scoring
Credit scoring is an analytical technique intended to carry out a pre-emptive check-up of a company.
The basic idea is to prepare ratios from companies' accounts that are leading indicators (i.e. two or three years ahead) of potential difficulties. Once the ratios have been established, they merely have to be calculated for a given company and cross-checked against the values obtained for companies that are known to have run into problems or have failed. Comparisons are not made ratio by ratio, but globally. The ratios are combined in a function known as the Z-score that yields a score for each company. The equation for calculating Z-scores is as follows:
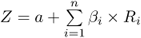
where a is a constant, Ri the ratios, βi the relative weighting applied to ratio Ri and n the number of ratios used.
Depending on whether a given company's Z-score is close to or a long way off normative values based on a set of companies that ran into trouble, the company in question is said to have a certain probability of experiencing trouble or remaining healthy over the following two- or three-year period. Originally developed in the US during the late 1960s by Edward Altman, the family of Z-scores has been highly popular, the latest version of the Z″ equation being:

where X1 is working capital/total assets; X2 is retained earnings/total assets; X3 is operating profit/total assets; X4 is shareholders' equity/net debt.
If Z″ is less than 1.1, the probability of corporate failure is high, and if Z″ is higher than 2.6, the probability of corporate failure is low, the grey area being values of between 1.1 and 2.6. The Z″-score has not yet been replaced by the Zeta score, which introduces into the equation the criteria of earnings stability, debt servicing and balance sheet liquidity.
2/ Benefits and drawbacks of scoring techniques
Scoring techniques represent an enhancement of traditional ratio analysis, which is based on the isolated use of certain ratios. With scoring techniques, the problem of the relative importance to be attached to each ratio has been solved because each is weighted according to its ability to pick out the “bad” companies from the “good” ones.
That said, scoring techniques still have a number of drawbacks.
Some weaknesses derive from the statistical underpinnings of the scoring equation. The sample needs to be sufficiently large, the database accurate and consistent and the period considered sufficiently long to reveal trends in the behaviour of companies and to measure its impact.
The scoring equation has to be based on historical data from the fairly recent past and thus needs to be updated over time. Can the same equation be used several years later when the economic and financial environment in which companies operate may have changed considerably? It is thus vital for scoring equations to be kept up to date.
The design of scoring equations is heavily influenced by their designers' top priority, i.e. to measure the risk of failure for small and medium-sized enterprises. They are not well suited for any other purpose (e.g. predicting in advance which companies will be highly profitable) or for measuring the risk of failure for large groups. Scoring equations should thus be used only for companies where the business activities and size are on a par with those in the original sample.
Scoring techniques, which are a straightforward and rapid way of synthesising figures, have considerable appeal. Their development may even have perverse self-fulfilling effects. Prior awareness of the risk of failure (which scoring techniques aim to provide) may lead some of the companies' business partners to adopt behaviour that hastens their demise. Suppliers may refuse to provide credit, banks may call in their loans, customers may be harder to come by because they are worried about not receiving delivery of the goods they buy or not being able to rely on after-sales service.
Section 8.8 Expert systems
Expert systems are comprised of software developed to carry out financial analysis using a knowledge base consisting of rules of financial analysis, enriched with the result of each analysis performed. The goal of expert systems is to develop lines of reasoning akin to those used by human analysts. This is the realm of artificial intelligence.
Expert systems are expected to analyse data and to produce recommendations without the input of any scoring equation.
The goal is to develop a tool providing early warnings of corporate failures, which can be used by, for instance, financial institutions.
Summary
The summary of this chapter can be downloaded from www.vernimmen.com.
The aim of financial analysis is to explain how a company can create value in the medium term (shareholders' viewpoint) or to determine whether it is solvent (lenders' standpoint). Either way, the techniques applied in financial analysis are the same.
First of all, financial analysis involves a detailed examination of the company's economics, i.e. the market in which it operates, its position within this market and the suitability of its production, distribution and human resources management systems to its strategy. Next, it entails a detailed analysis of the company's accounting principles to ensure that they reflect rather than distort the company's economic reality. Otherwise, there is no need to study the accounts, since they are not worth bothering with, and the company should be avoided like the plague as far as shareholders, lenders and employees are concerned.
A standard financial analysis can be broken down into four stages:
- Wealth creation (sales trends, margin analysis) …
- … requires investments in capital employed (fixed assets, working capital) …
- … that must be financed (by internal financing, shareholders' equity or bank loans and borrowings) …
- … and provide sufficient returns (return on capital employed, return on equity, leverage effect).
Only then can the analyst come to a conclusion about the solvency of the company and its ability to create value.
Analysts may use trend analysis, which uses past trends to assess the present and predict the future; comparative analysis, which uses comparisons with similar companies operating in the same sector as a point of reference; and normative analysis, which is based on financial rules of thumb.
Ratings represent an evaluation of a borrower's ability to repay its borrowings. Ratings are produced through a comprehensive financial analysis of groups, part of whose debt is traded on a market.
Scoring techniques are underpinned by a statistical analysis of the accounts of companies, which are compared with accounts of companies that have experienced problems, including bankruptcy in some cases. This automated process yields a probability of corporate failure. Scoring is primarily used for small and medium-sized companies.
Questions
1/ Do shareholders and lenders carry out financial analysis in the same way?
2/ What are the two prerequisites for financial analysis?
3/ Is a market an economic sector? Why?
4/ Why is there less risk on an original equipment market than on a replacement products market?
5/ When a new product is launched, should the company invest in the production process or in the product itself? Why?
6/ What is a standard financial analysis plan?
7/ What standard ratios are applicable to all companies?
8/ When is it possible to compare the EBIT margin of two companies?
9/ What criticism can be directed at scoring techniques?
10/ Why does the financial expense/EBITDA ratio play such a fundamental role in scoring techniques?
11/ What are the strengths of a trend analysis?
12/ Why start a financial analysis with a study of wealth creation?
13/ Is financial analysis always doomed to be too late to be useful?
14/ What is your view of the Italian proverb traduttore, traditore (to translate is to betray) ?
15/ Why will vertical integration be dismissed as being of little value after an analysis of the value chain?
16/ What assumptions are made in a comparative financial analysis, especially on an international scale?
17/ At the end of the day, what is the objective of the financial analyst?
More questions are waiting for you at www.vernimmen.com.
Exercises
1/ Carry out an analysis of the frozen chicken value chain and decide which participants in the value chain are in a structurally weak position. The main participants in the chicken value chain are as follows:
- Research: genetic selection of the best laying hens.
- Breeding of laying hens: a laying hen lays eggs for 18 months non-stop, after which it is sold to the pet food industry.
- Hatcheries: the eggs are placed in incubators stacked in batteries for an 18-day incubation period followed by a three-day hatching period, and kept at the appropriate temperature and level of humidity.
- Rearing: chickens are reared for around 40 days, until they reach a weight of 1.8kg. This function provides additional income for a couple who, thanks to computerised equipment, only need to spend two to three hours/day attending to the chickens.
- Feed: produced by animal feed groups, which develop subtle blends of wheat, maize and soya or rapeseed proteins.
- Slaughterhouses: 20 000 chickens are anaesthetised, decapitated, processed and frozen per hour, then exported mainly to the Middle East.
2/ Guizzardi is one of the main Italian producers of synthetic raincoats. It sells two product ranges – the fashion and the classic raincoat – through supermarkets. Most of the Guizzardi workforce is paid the minimum wage.
Key figures (€m) :
| N | N+1 | N+2 | |
| Sales | 256 | 326 | 422 |
| Raw materials used | 78 | 104 | 143 |
| Personnel cost | 102 | 139 | 190 |
| Operating income | 41 | 52 | 59 |
| Net income | 23 | 27 | 30 |
| Shareholders' equity | 119 | 129 | 152 |
| Net bank borrowings | 42 | 125 | 150 |
- (a) What is your view on the financial health of Guizzardi?
- (b) Would you be of the same opinion if you had carried out an analysis beforehand of the company's value chain and simulated the impact of a crisis in N+3 (11% increase in labour costs due to the introduction of a shorter working week with no reduction in wages, 40% rise in cost of raw materials due to the drop in the value of the euro against the dollar and the N+3 hike in the price of oil), with a 17% drop in the price of cotton in N+3.
3/ The table below appears on page 2 of the annual report of the Norne group.
Key financials (unaudited, in millions of $, excluding earnings per share and dividends) :
| 1996 | 1997 | 1998 | 1999 | 2000 | |
| Sales | 13 289 | 20 273 | 31 260 | 40 112 | 100 789 |
| Net income: | |||||
| Recurring net income | 493 | 515 | 698 | 957 | 1266 |
| Items impacting comparability | 91 | −410 | 5 | −64 | −287 |
| Total | 584 | 105 | 703 | 893 | 979 |
| Diluted earnings per share: | |||||
| Recurring net income | 0.91 | 0.87 | 1.00 | 1.18 | 1.47 |
| Items impacting comparability | 0.17 | −0.71 | 0.01 | −0.08 | −0.35 |
| Total | 1.08 | 0.16 | 1.01 | 1.10 | 1.12 |
| Dividend per share | 0.43 | 0.46 | 0.48 | 0.50 | 0.50 |
| Total assets | 16 137 | 22 552 | 29 350 | 33 381 | 65 503 |
| Cash from operating activities (excluding change in working capital) | 742 | 276 | 1873 | 2228 | 3010 |
| Capital expenditure | 1483 | 2092 | 3564 | 3085 | 3314 |
| Share price at 31 Dec | 22 | 21 | 29 | 44 | 83 |
State your views.
Answers
Questions
1/ Yes, because a company that creates value (for shareholders) will be solvent (for lenders).
2/ An understanding of the company's economics (market, competitive position, production and distribution system, staff ) and the accounting principles used.
3/ No, a market is defined by consistent behaviour of customers who buy products in order to meet similar needs.
4/ The replacement products market is far more sensitive to general economic conditions, because when consumers already own a product, they can postpone replacing it until the economy picks up.
5/ When a product is launched, it is better to invest in the product and the marketing thereof than in the production facilities or a process that could change in the future.
6/ Wealth creation requires investments that must be financed and be sufficiently profitable.
7/ None.
8/ When the companies operate in the same sector.
9/ To be effective, the sample must be sufficiently large and scores need to be updated regularly. Priority is to measure the risk of failure, which may have perverse self-fulfilling effects.
10/ Because it reveals both high levels of debt (substantial financial expense) and low returns (low EBITDA).
11/ It helps in understanding the company's strategy.
12/ Because this is the very reason why the company exists.
13/ In theory, yes, if the analyst merely studies the company's financial statements. In practice, no, if the analyst has factored in the “economics” of the company.
14/ This saying demonstrates why it is important to take a close look at the accounting principles used by the company.
15/ Because in a value chain, there are positions of structural weakness, where it is better to let others invest, even if it means handling them through supply contracts.
16/ Comparable accounting principles.
17/ Analyse the past to understand the present and forecast the future.
Exercises
A detailed Excel version of the solutions is available at www.vernimmen.com.
1/ Position of structural weakness:
- (a) Breeding of laying hens: in times of crisis, all of the hens (which are unable to stop laying) have to be slaughtered and sold at a knock-down price to pet food manufacturers. The breeder thus loses his asset and his source of income.
- (b) The hatchery and chicken rearing: no special skills or technology required.
Position of strength:
- (a) Research and animal feed: many opportunities outside the chicken segment.
- (b) The slaughterhouse: control over the whole of the chain upstream, through supply contracts and sales to the finished product.
2/ (a) Very good financial health, with a 20% return on equity in N+2 and 12% ROCE with sales growing briskly. (b) Guizzardi is in a position of structural weakness which is hidden by the good performance of the very volatile fashion range. It has no control over 92% of its costs (labour, oil, dollar). Its customers – supermarkets – would be reluctant to increase sales prices given that the competition (manufacturers of cotton raincoats) is not facing the same problems (drop in the price of cotton, rise in the price of oil). It is too small a business to expect any help from its suppliers (the big petrochemical groups).
3/ Why have these figures not been audited? Are the negative items impacting comparability really non-recurring (three out of five years) Should the presentation of the results not be improved? Why talk about cash flow from operating activities excluding changes in working capital? Change in working capital is a natural constituent of cash flow from operating activities. The share is very highly valued (adjusted P/E of 56 (74 non-adjusted) ). All of the above should set alarm bells ringing. These are, in fact, the financial statements for Enron, which went bankrupt with a big bang in 2001.
Bibliography
For more about the economic analysis of companies:
- S. Chopra, P. Meindl, Supply Chain Management, 5th edn, Pearson, 2012.
- P. Kotler, P.K. Keller, Marketing Management, 14th edn, Prentice Hall, 2011.
- P. Marsh, The New Industrial Revolution, Yale University Press, 2012.
- B. Moingeon, G. Soenen, Corporate and Organisational Identities, Routledge, 2003.
- M. Porter, Competitive Strategy: Techniques for Analyzing Industries and Competitors, Free Press, 1998.
- W. Stevenson, Operations Management, 11th edn, McGraw-Hill/Irwin, 2011.
- J.C. Tarondeau, Stratégie Industrielle, 2nd edn, Vuibert, 1998.
- J. Utterback, W.J. Abernathy, A dynamic model of process and product innovations, Omega, 3(6), 1975.
- J. Woodward, Industrial Organization: Theory and Practice, 2nd edn, Oxford University Press, 1980.
For more about company accounting practices:
- AIMR, Financial Reporting in the 1990s and Beyond, Association for Investment Management and Research, 1993.
- AIMR, Finding Reality in Reported Earnings, Association for Investment Management and Research, 1997.
- AIMR, Closing the Gap between Financial Reporting and Reality, Association for Investment Management and Research, 2003.
- C. Mulford, E. Comiskey, The Financial Number Game: Detecting Creative Accounting Practices, John Wiley & Sons Inc., 2005.
- T. O'Glove, Quality of Earnings, Free Press, 1998.
- H. Schilit, Financial Shenanigans: How to Detect Accounting Gimmicks and Fraud in Financial Reports, 3rd edn, McGraw-Hill, 2010.
For more on automated financial analysis:
- E. Altman, Financial ratios, discriminant analysis and the prediction of corporate bankruptcy, Journal of Finance, 23(4), 589–609, 1968.
- E. Altman, Bankruptcy, Credit Risk and High Yield Junk Bonds, Blackwell, 2002.
- Standard and Poor's, Corporate Ratings Criteria, <www.corporatecriteria.standardpoors.com>.