
CHAPTER 6
THE ROLE OF REAL-TIME ANALYTICS IN ROLLING YOUR STRATEGY
In much the same way that filing cabinets soon overflow with paper, so too does digital data overrun available storage. In both cases, the overflow doesn’t happen overnight, although it often seems that way. The growth of data in any form happens gradually over time until one day someone recognizes the mess and then wonders what to do with it all. This is how big data came to be. Company files and databases began as manageable sizes and then grew at ever-increasing rates. However, it wasn’t until recently that companies purposely sought to grow data, further compounding the problem.
Of course, data analysis was taking place all along. Companies had all the ingredients to analyze data—from database administrators (DBAs), math wizards, code writers, and statisticians to functional algorithms. Everything was whizzing along more or less without any problems, although certainly with limitations, until eventually the sheer volume of data got too big to shoehorn into existing setups. Or, the data itself grew so big that shoehorning it in existing data center storage (even with the plummeting price in hard drives over the last few years) became just too expensive for most budgets to bear.
In an effort to cope, companies and other organizations tried running analysis on select data samples, rather than on entire data sets. While this tactic worked on occasion, depending on the data set and analysis, just about everyone agreed it usually wasn’t good enough. So when arrays of big data tools arrived, those charged with data analysis tasks welcomed them as ways to cheaply analyze vast amounts of data. Efforts to improve big data tools in terms of costs, efficiencies, speed, and ease of use are now nearly continuous and will both ease the workload in data analysis and spur new uses of data.
One of the most widely hailed advances of our time is real-time analytics. The very idea that on-the-fly analysis of large data sets is even possible is tremendously exciting! For the first time, companies can see exactly what is happening in the here and now and respond accordingly in real-time. But like all tech applications, real-time analytics isn’t a panacea. Figure 6.1 shows real-time analytics coupled with real-time collaboration for maximum decision-making agility.
Figure 6.1 An example of real-time analytics used with real-time collaboration.
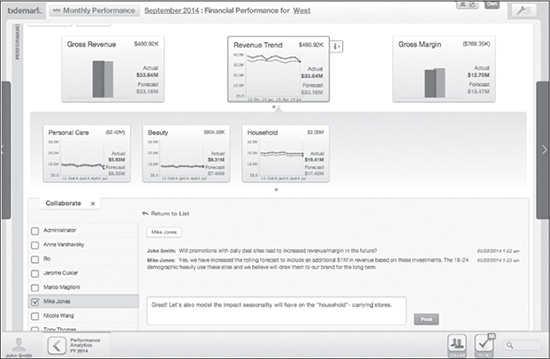
Source: Tidemark Systems, Inc. Used with permission.
Granted, real-time analytics have an important role in the new data economy and in data-driven decision making, but there are also times when a company should refrain from using them. The answer to when they should be used is an individual case-by-case call made by every company based on its specific overall strategy, market, and customers. Let’s take a look then at the advantages and shortcomings in real-time analytics in order to determine where they might best fit into any particular big data strategy.
EXAMINING REAL-TIME DELUSIONS AND TIME CAPSULES
The problem with anything real-time is that, often in less time than it takes to blink, it becomes a moment in the past. Indeed, the moment you finished reading that last sentence it became a past event. Yet you’re still reading this book which means you’re reading it in real-time and if we could log your facial expressions while you read it we could do a real-time analysis of your reactions. However, this book was written some time ago so for all involved in its publication, it represents one or more past events and the data within it cannot be technically considered as real-time, yet the reading of it can. Confused yet? That’s okay. Time is relative and hard to pin down and harder still to frame with definitive meaning in terms of “real-time” data analysis.
Chief among the many concerns in any real-time analysis is the speed in which the data is collected and whether the data itself is current enough to be considered truly real-time. With direct streaming of social media, for example, the speed and immediacy is readily evident. Not so with other data. In all likelihood some amount of time will have to be spent, no matter how nominal, to determine the immediacy of the data and to prepare it for querying, especially if it is unstructured data. The more the clock ticks while all that is happening, the less real-time analysis is possible.
In addition to the speed and immediacy of incoming data, one must consider reaction time on the other end of things as well. If, for example, marketing can do a real-time analysis on customer reactions to a marketing campaign but cannot act on the analysis for days, weeks, or perhaps even months, then they are in effect reacting to a past event and not to a real-time analysis.
In short, it’s only real-time if the entire process happens nearly instantaneously. Now that’s a daunting thought, isn’t it?
The point here is that you must be selective in determining what information you need in real-time and how fast your company can react to it before you go to the effort and expense of analyzing it in real-time. In other words, sometimes the slower and cheaper past-time analytics work just as well and are far more practical, given what reactions are to be based on the analysis.
Nevertheless, there are many instances where real-time analytics are preferred to past-time analytics. Take, for example, fuel costs for an airline. Knowing fluctuations in fuel costs in real-time is extremely helpful in immediately adjusting ticket prices, plane utilization, and routes accordingly to ensure profitably. Such real-time information allows airlines to route planes to refuel in places where fuel is cheaper—provided of course that more fuel isn’t used getting to and from those fueling destinations. Real-time analytics can determine all of that in seconds.
The same holds true for a mobile app or a GPS system that provides users with fuel costs at gas stations close by to the driver’s current location. Real-time information in such cases is essential. But there are many other scenarios where real-time analytics are not only desired but vital.
Now, you’ve surely noticed that real-time readings must be fairly continuous in order to update information regularly enough to be considered in real-time. And that is indeed the case. Real-time readings and analysis must be rolling, that is one after another in a continuous stream of updates, in order for the information to remain in real-time status. But even when they are rolling, they may really be near-time rather than real-time per se.
Near-time means almost real-time. Sticking with the airline example, an airline may discover that is just as efficient and more cost effective to analyze data every 15 minutes, every 30 minutes, or once an hour. Anything close to but other than directly looking at what is happening right now is considered near-time. In many cases, companies are actually using near-time, believing it to be real-time. However, these often amount to the same thing in practical terms.
It is prudent to consider just how timely or “real-time” you need any given information to be. If you use real-time analysis too freely, you’re burning up resources needlessly. Conversely, if you skip using them where truly needed, you are hobbling the enterprise and putting it at a potentially huge competitive disadvantage. Find the timing sweet spot for any given information collection and analysis and adjust your tactics and strategies accordingly.
Finally, take a look at your processes to ensure they are flexible enough to immediately respond to true real-time analysis. It is almost never the case that existing processes were built with enough flexibility to readily respond in real-time. Too often many companies try to fit the analysis to the process rather than adapt the process to fit the analysis. So ask yourself, if I have this information in real-time, can I react to it quick enough for it to matter? If not, change the process as needed to achieve true agility.
Whatever you choose to do with real-time analytics, make sure your motivation is not to relieve real or perceived pressures to hurry things along.
“What CTO today wants to stand up in front of a crowd and proclaim ‘we use past-time analytics’ or ‘we work in an eventually-we’ll-analyze-our-data’ approach? Oh, the crickets we would hear,” says Elise Neel, vice president, Data and Insights at PlaceIQ, a mobile data analytics company. “Real-time seems to be the catch-all answer to most analytic systems, but few organizations capitalize on the capability effectively.”
USING STATIC VERSUS ROLLING STRATEGIES
Real-time analysis is not the only thing that can roll. Strategies can too. Problems quickly surface when the current strategy is static and stale but the information coming in is fluid and changing. It’s more effective to have a rolling or “living” strategy that can itself be quickly adapted according to incoming information.
In the past, business strategies were static step-by-step master plans that largely reflected the opinion of the ranking executive, which was only sometimes supported by past-time analytics. If and when static strategies were changed, it was only in response to information learned after the fact. Implementation of the changes was typically slow and arduous. In other words, agility was essentially just an idea. Only small companies (or small divisions given relative autonomy within larger companies) truly had the capability to turn on a dime. They used their agility to great advantage when competing against much larger and better funded companies that changed direction with the speed and grace of a lumbering oil tanker.
By contrast, modern big data tools, such as real-time and in-memory analytics, make it possible for any organization of any size to become truly agile. However, actually doing it often requires a significant change in mindset and culture. It can be unsettling for many people to work in an environment wherein everything is fluid and nothing concrete. But fluidity is key to reshaping a company into a massively successful enterprise.
So which comes first—the data that drives change or a company culture that permits change in response to data analysis? In most cases the two are interwoven and happen in staggered steps.
A WORD ABOUT CHANGE MANAGEMENT IN MOVING TO A ROLLING STRATEGY
Usually someone within the company has to take the initiative to demonstrate how big data can be used for real company benefit. Typically they have to make a case for a process change or a new initiative to seize a data-driven advantage. At some point, top executives take interest and begin to look for confirmation and evidence that this whole big data thing is more than the latest buzzword-laden trend and is indeed an actual, useable, and trustworthy business tool. Most executives will be highly skeptical although some will embrace it fairly quickly; it all depends on how open to change any given executive is. Once there is top-level adoption, data-driven decision making becomes an accepted part of the business strategy and trickles into the culture.
Generally speaking it is an agonizingly slow and tedious process to move a larger organization forward to a more sophisticated use of data, not to mention moving it from a static business strategy approach to a rolling, data-driven one. Even if the top executive orders the transition, there will likely be resistance to the change throughout the organization. People take comfort in established routines and some won’t take kindly to their disruption. See Chapter 2 on how to formulate a winning big data strategy and for more details on how and where such resistance is likely to lurk.
Your big data strategy needs to include steps to increase acceptance and adoption of data-driven decision making throughout the organization to offset this resistance to change and speed transformation. But those steps must also be flexible and subject to frequent revisions as you encounter less or more resistance along the way. In other words, you’ll be using a rolling rather than a static strategy to achieve these ends too.
YOUR CHOICES IN ANALYTICS
As mentioned, real-time analytics have their place in your overall data strategy. A very important place, to be sure, but they are not right for every business problem. Further, while we touched on the fundamental differences between descriptive, predictive, and prescriptive analytics in Chapter 5, this is a good time to explain that the last two can be in real-time or not. Descriptive analytics are almost always in past-time.
Not all analytics software of any given type is created equal, nor do they all work in the same way. If you are in charge of evaluating and selecting analytics products, be sure that you understand precisely how they work and what their limitations are before you buy. Be particularly wary of the label “real-time,” as some analytics are run in-memory or during streaming and some are not and there are notable time and other differences between them.
The traditional way is to query data residing on physical storage disks. There’s nothing especially wrong with this method other than there are some limitations in scope and flexibility and it is too slow for real-time analysis. By contrast, in-memory analytics query data in the server’s random access memory (RAM) for faster processing, providing it is a 64-bit and not a 32-bit architecture. There are other advantages to using in-memory analytics as well, such as a reduction in IT involvement. Even so, some movement of the data is required to get it from the source to RAM.
By contrast, streaming analytics are real-time analytics conducted on streaming data. They completely circumvent the need to move information between storage and in-memory thereby speeding algorithms, to as much as 100 times faster some users and vendors claim, beyond in-memory speeds. Streaming analytics also handle bigger data loads than in-memory analytics. Most batch processing systems are either already offering or steadily working towards providing this capability in response to the growing demand for real-time analytics for massive quantities of data. This category of analytics continuously monitors data streams and often automates actions, but not always.
Figure 6.2 shows Google’s BigQuery web page for developers, which is found online at https://developers.google.com/bigquery/.
Figure 6.2 Google’s BigQuery web page for developers explains how to use this streaming analytics tool. Notice that Google provides data sets and points to other data sets available on the web for product testing or developer use.
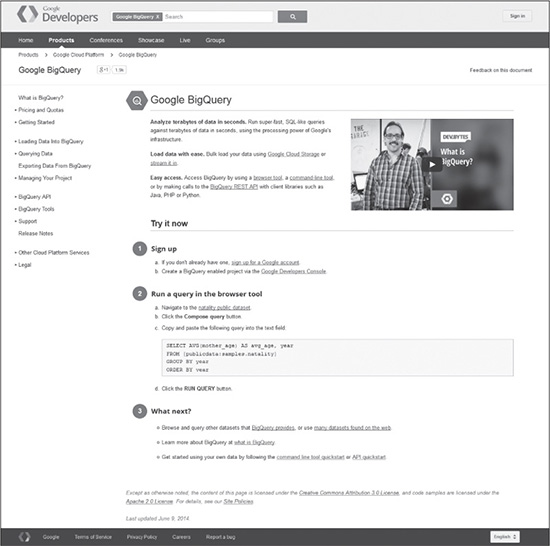
Source: Google, Inc.
As this book is written to address business strategies and use cases, deeper technical issues are left for another day (or perhaps another book). However, Figure 6.3 is an attempt to provide you with at least a glimpse of the many advantages to streaming analytics. It shows a post on Massive Online Analysis (MOA), an open source data mining tool, concerning using the R language despite the tool being written in Java. It is not the language challenges that are of concern here. Notice instead the three advantages in streaming analytics listed at the top of Figure 6.3.
Figure 6.3 A post on Massive Online Analysis (MOA) showing three advantages in using streaming analytics.
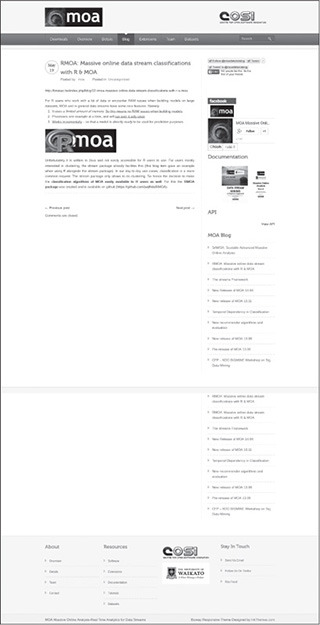
Source: MOA and Center for Open Software Innovation. Screenshot taken from http://moa.cms.waikato.ac.nz/2014/05/19/rmoa-massive-online-data-stream-classifications-with-r-moa/.
You’ll need to fully understand just how real-time you need the analytics product to deliver, and how well it actually does that, before you commit.
USING DATA FROM HUMAN EXPERTS’ BRAINS TO SPEED ANALYTICS
As mentioned previously, a simpler model, although still not simplistic, works better with fast and frequent analytics than a more complex model. But that is not to say that once the algorithm is written, it is done. Models and algorithms must be frequently updated and adapted to account for new factors. Inputs should never be set in place and forgotten.
For many readers this advice may seem too esoteric as you will not be doing the modeling or writing algorithms yourself. If that’s the case, just remember that creative and strong business minds can and should contribute to the general model building even if they don’t have the math and technical skills to write the formula. Not only is your expertise important to the model-building process, it can actually be an input in the algorithm. Don’t let the technical side of things make you discount the value of the data in your own head. And that’s what it is—data. Specifically, it is unstructured data in a silo. Take it out of your head, the silo, and add it to the algorithm as an input or at least use it to help shape the model.
As an example of how adding human input to the algorithm greatly enhances the outcome, consider how the U.S. military is doing that as reported by Colin Wood in a January 6, 2014 article in Emergency Management:
Collecting, correlating, and making sense of big data into a single, cohesive image is called creating a common operating picture (COP). Another problem with creating a useful COP, [Dr. Eric Little, vice president and chief scientist for a company making big data software for the military called Modus Operandi] pointed out, is that oftentimes the most valuable information isn’t found anywhere in military intelligence files—it’s in the expert’s head. The expert’s experience, knowledge and intuition often play a key role in how data is filtered and interpreted to create a COP.
“With big data tools, however, it’s possible to put the expert’s knowledge into the software so everyone can use it,” Little said.
The Marine Corps, for instance, is now testing Modus Operandi’s BLADE technology for use in the field. The product generates a semantic wiki from the COP that is built from the original data inputs. If, for instance, a soldier discovers some information about a person of interest who happened to have been involved in a bombing, he can update the COP with that new piece of information. Additionally, the wiki pages for that person and that bombing event would both be updated, as would any other relevant pages. Other soldiers in the field also would have access to that new information in near-real time. There’s no waiting for reports to come in and connecting dots to figure things out—it’s all in the system and can be found in the wiki pages.
A semantic wiki is just one output that can be generated from a COP. Once the data has been built into an underlying graph structure, that data can be traversed with complex queries to find different kinds of patterns and output different types of visualizations. For instance, a user interested in spatial data could submit a query that generates a map from the underlying common graph. A user primarily interested in dates could generate a timeline, and so on.
“This allows the war fighters much better situational awareness,” Little said, “and it gives them a much broader understanding of things that could be related to the specific items that they’re looking at in their data that they otherwise might not have found or seen.”
Other experts in other industries can contribute knowledge to be added to algorithms in this same way and in other ways too. Think about it for a moment. When you collect and use data from email, social media, and other unstructured sources, you are actually adding human input to your algorithms, are you not? Adding human expert knowledge and observations is a matter of deliberately doing so in a digital form that can then be used in algorithms as needed.
WHEN REAL-TIME IS TOO LATE, THEN WHAT?
Even real-time analytics can reveal past events or decisions already made, so you may discover that damage is already done or opportunity is already lost. For example, you may find yourself staring at a large number of social media posts bashing your product or your CEO’s political remarks. Or, you may find that a competing product is now all the rage and too far ahead in market share for your company to make a comeback or any serious headway. Maybe you’ll find that a startup has produced a wildly popular product similar to the one you were planning to introduce six months from now or that completely disrupts your industry. In other words, the analysis you do in real-time may result in bad news that is difficult to influence or change to any significant degree.
Such news may be discouraging, but it is also helpful. It is better to know what is happening now than to proceed blindly on your course, only to discover this same bad news down the road when it will have cost the company considerably more in expenditures, lost profits, customer backlash, or public ridicule.
With real-time analytics you can pivot mid-stride. If you find one product is a lost cause, you can shift your focus to another that is not. If you’re facing a PR crisis, you can immediately address it before the negative impressions set into unyielding concrete. If you see a disruptor emerge, you can change your strategy or product development path accordingly. Whatever you find in real-time analysis, you can find a way to cope with it and even profit from it despite the obstacles because you are now aware of the situation.
So, yes, there is a time when real-time analytics produce results that are too late in the sense that something—good or bad—has transpired and it either hit you or you totally missed it. However, the analysis may not be too late for you to still find a way out or a way in, as the case may be. The important thing to remember is that knowledge at the right time and with the means to take advantage of it truly is power and you are powerless without it. This is why real-time analytics, properly applied, can be so crucial to your overall business strategy and why they should be a big part of your big data strategy.
SUMMARY
In this chapter you learned that real-time analytics deliver many great business advantages but they are not the best choice for every business case. You learned about the different types of real-time analytics and that not every product branded as “real-time” actually is. Although speed is of utmost importance in real-time analytics, you learned that one of the best ways to hasten your results is to add data currently trapped in experts’ heads as an input in your algorithms. You saw an example of how to do that in how the U.S. military is doing it and learned other ways to add human expert data too. Last but not least, you learned that even real-time analytics can deliver results to you too late—and what to do when that happens.