CHAPTER 2
HOW TO FORMULATE A WINNING BIG DATA STRATEGY
Strategy is everything. Without it, data, big or otherwise, is essentially useless. A bad strategy is worse than useless because it can be highly damaging to the organization. A bad strategy can divert resources, waste time, and demoralize employees. This would seem to be self-evident but in practice, strategy development is not quite so straightforward. There are numerous reasons why a strategy is MIA from the beginning, falls apart mid-project, or is destroyed in a head-on collision with another conflicting business strategy. Fortunately, there are ways to prevent these problems when designing strategies that keep your projects and your company on course.
However, it’s important to understand the dynamics in play first so you know what needs to be addressed in the strategy, beyond a technical “To Do” list.
THE HEAD EATS THE TAIL
The question of what to do with data tends to turn back on itself. Typically IT waits for the CEO or other C-level executives and business heads to tell them what needs to be done while the CEO waits for his minions, in IT and other departments, to produce cunning information he can use to make or tweak his vision. Meanwhile department heads and their underlings find their reports delayed in various IT and system queues, or their selections limited to a narrow list of self-service reports, quietly and fervently wishing someone at the top would get a clue about what needs to be done at their level. In other words, everyone is waiting on everyone else to make the first move and all are frustrated. The default is business gets done in the usual way, meaning everyone is dutifully trudging along doing the exact same things in the exact same ways. And that is why so much data sits fallow in data warehouses. No one is using it. No one is entirely sure what data is there. Few can imagine what to do with it beyond what is already being done at the moment.
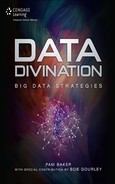
The typical CEO continues to depend on data fed to the same fields he’s accustomed to looking at on his trusty and familiar spreadsheet (see Figure 2.1). IT continues the daily struggle of trying to store and integrate data, learning and deploying new big data tools plus other technology and online initiatives, and managing a growing number of service and support tickets. Department heads consult the same reports they always have, often populated with too little data and which commonly arrive too long after the fact to accurately reflect current conditions. Staffers scratch their heads in confusion over the fruitlessness or inefficiency of the entire process.
It’s not that anyone in this scenario is deliberately thinking that improving things is not their job; rather they are usually unsure what needs to change or how to go about making these changes. They are also not thinking about how these changes would affect others in the organization or the organization at large; rather they are focused on how their desired changes will affect their own domain within the business.
People are simply unaccustomed to thinking in terms of using big data to decide the way forward and to predict business impact. Some are even afraid of using big data, should it become a driver to such an extent that it results in a loss of power or worse, a loss of job security.
But for the most part, it simply hasn’t occurred to many people that data analysis can address and even resolve most of their problems. That’s why few think to turn to it first.
Those who do think data-driven decision making is a logical and worthy approach often do not have the authority, data literacy, or the resources, skills, and tools to put it fully in action. The end result is that almost no one knows what to do differently and therefore the status quo is maintained.
Figure 2.1 A common, traditional spreadsheet used by executives.
Source: Pam Baker.
In other words, the head eats the tail and everyone in the organization is trapped in this circular reasoning. But as you shall see in a moment, the way to end this circle is not with a linear strategy but with a non-linear one and yes, sometimes even with another circle, albeit one of a far different nature.
HOW TO END THE “WHO’S ON FIRST” CONUNDRUM
That is not to say that using data is a foreign experience to everyone. Virtually all people already use data to some extent in their daily work. What is different now, however, is not that there is more data, that is, big data, but that there are more ways to use that data than most people are accustomed to.
Unfortunately, the difference gets muddied in conversations about big data, leading to muddied efforts as well.
Changing Perspectives of Big Data
When we focus on the word “big,” our minds most often translate that to mean “more of the same.” For example, a big person is just one person no matter how big or tall, and not a big collection of several different people. Big means more and not a diverse and growing collection of connections in the minds of most people. As a consequence, when most people hear the term “big data,” they tend to think of more of the same data.
That mental translation of the term happens commonly in everyday conversations about big data. Perhaps you will hear someone say something like, “big data is so big we have trouble storing and retrieving it” or “big data is too big for normal computing methods.” It’s not that these statements are untrue, for they are indeed often correct. It is that the average human mind conjures the image of more of the same data clogging the system, and not diverse and disparate data sets tumbling in from every direction.
How humans professionally and personally relate to the word “data” also adds weighty perceptions to the mental baggage carried into big data conversations, bringing to mind the old fable of the Blind Men and The Elephant, where each man, based on their limited perception, concluded that an elephant was far different from what it actually is when all the parts are recognized and assembled properly. Big data allows us to see the elephant; not merely a trunk, leg, or tail in isolation.
In such conversations, each participant is automatically relating what they perceive to what they do. Their reference points are their job, their personal behavior, and their past experiences. These filter their interpretation and perception of how data can be used.
User Perception Versus the Data-Harvesting Reality
For example, a Facebook user will typically think in terms of what they personally post when they hear Facebook is gathering data on them. Most people have trouble immediately comprehending that Facebook can track far more than merely what they have posted. Is this ignorance of how data is collected? Yes, in many cases it is. But even when such ignorance is not present, the average person will immediately first think of what they shared or used intentionally on Facebook and not necessarily what they did on their computer overall while Facebook was accessed or their smartphone’s Facebook app was running in the background. Why? Because their personal experience on Facebook is their reference point.
The reality of Facebook’s work in data harvesting far exceeds that of simply recording and analyzing posts users put on their Facebook wall. Here is just one example of how Facebook gathers data on both non-users and users, tracking them across websites, none of which are Facebook owned, as reported in a November 16, 2011 article in USA Today:
Facebook officials are now acknowledging that the social media giant has been able to create a running log of the web pages that each of its 800 million or so members has visited during the previous 90 days. Facebook also keeps close track of where millions more non-members of the social network go on the Web, after they visit a Facebook web page for any reason.
To do this, the company relies on tracking cookie technologies similar to the controversial systems used by Google, Adobe, Microsoft, Yahoo!, and others in the online advertising industry, says Arturo Bejar, Facebook’s engineering director.
Of course the information Facebook gathers from actual user activity on their website is staggering too. Bernard Marr explains some of it in his February 18, 2014 SmartDataCollective post this way:
We as the users of Facebook happily feed their big data beast. We send 10 billion Facebook messages per day, click the Like button 4.5 billion times and upload 350 million new pictures each and every day. Overall, there are 17 billion location-tagged posts and a staggering 250 billion photos on Facebook.
All this information means, Facebook knows what we look like, who our friends are, what our views are on most things, when our birthday is, whether we are in a relationship or not, the location we are at, what we like and dislike, and much more. This is an awful lot of information (and power) in the hands of one commercial company.
Facebook has also invested in image processing and “face recognition” capabilities that basically allow Facebook to track you, because it knows what you and your friends look like from the photos you have shared. It can now search the Internet and all other Facebook profiles to find pictures of you and your friends.
Face recognition allows Facebook to make “tag suggestions” for people on photos you have uploaded but it is mind boggling what else they could do with technology like that. Just imagine how Facebook could use computer algorithms to track your body shape. They could analyze your latest beach shots you have shared and compare them with older ones to detect that you have put on some weight. It could then sell this information to a slimming club in your area, which could place an ad on your Facebook page. Scary?
There is more: a recent study shows that it is possible to accurately predict a range of highly sensitive personal attributes simply by analyzing the “Likes” you have clicked on Facebook. The work conducted by researchers at Cambridge University and Microsoft Research shows how the patterns of Facebook “Likes” can very accurately predict your sexual orientation, satisfaction with life, intelligence, emotional stability, religion, alcohol use and drug use, relationship status, age, gender, race and political views among many others. Interestingly, those “revealing” likes can have little or nothing to do with the actual attributes they help to predict and often a single “Like” is enough to generate an accurate prediction.”
The Reality of Facebook’s Predictive Analytics
As if this data wasn’t enough intimate information about users, Facebook also studies a user’s posting patterns and moods to predict a future romantic relationship. I reported on this activity in a February 19, 2014 FierceBigData post:
“During the 100 days before the relationship starts, we observe a slow but steady increase in the number of timeline posts shared between the future couple,” writes Facebook data scientist Carlos Diuk in his “The Formation of Love” post. “When the relationship starts (day 0), posts begin to decrease. We observe a peak of 1.67 posts per day 12 days before the relationship begins, and a lowest point of 1.53 posts per day 85 days into the relationship. Presumably, couples decide to spend more time together, courtship is off and online interactions give way to more interactions in the physical world.”
In other words, Facebook knows when you are about to become a couple, perhaps before you know, and certainly long before you announce your new couplehood on your own Facebook posts. Further, Facebook determines that the physical part of your relationship begins when your online activity decreases. Facebook tactfully calls this phase “courtship” in the posts but we all know that courtship actually occurred during the exchanges Facebook initially tracked to predict the coupling.
What is the business value in tracking the innocently love struck and the illicitly entangled? Possibly so flower retailers, chocolatiers, condom and lubricant retailers and essentially any company that can make a buck off of love can place well-timed ads.
Further, Facebook uses posting patterns and moods to detect a romantic breakup before it happens. In a February 15, 2014 post on Facebook titled “When Love Goes Awry,” Adrien Friggeri, Facebook data scientist, said:
To conclude this week of celebrating love and looking at how couples blossom on Facebook, we felt it was important not to forget that unfortunately sometimes relationships go south and people take different paths in life. In this context, we were interested in understanding the extent to which Facebook provides a platform for support from loved ones after a breakup.
To that end, we studied a group of people who were on the receiving end of a separation, i.e. who had been in a relationship for at least four weeks with someone who then switched their relationship status to Single.
For every person in this group, we tracked a combination of the number of messages they sent and received, the number of posts from others on their timeline and the number of comments from others on their own content, during a period starting a month before the separation to a month after.
We observed a steady regime around the baseline before the day the relationship status changes, followed by a discontinuity on that day with a +225% increase of the average volume of interactions which then gradually stabilize over the course of a week to levels higher to those observed pre-breakup.
This means that Facebook now has the means to accurately predict romantic breakups, often long before the poor, dumped soul may suspect anything is wrong. Rest assured that Facebook is likely using similar analysis to predict other intimate details about its users beyond mere romantic relationships.
Facebook’s Data Harvesting Goes Even Further
Facebook officials say they are even going further in data collection but they will do so in an increasingly secretive mode. On April 18, 2014, Dan Gillmor reported in his post in The Guardian:
Facebook may be getting the message that people don’t trust it, which shouldn’t be surprising given the company’s long record of bending its rules to give users less privacy. CEO Mark Zuckerberg told The New York Times’ Farhad Manjoo that many upcoming products and services wouldn’t even use the name Facebook, as the company pushes further and further into its users’ lives. The report concluded:
If the new plan succeeds, then, one day large swaths of Facebook may not look like Facebook—and may not even bear the name Facebook. It will be everywhere, but you may not know it.
If Facebook does indeed proceed down that route, users will be even less likely to be able to correctly identify what data the social media giant is collecting about them and how it is being used. Meanwhile Facebook’s big data projects, whatever they may be, will become increasingly accurate, thus enabling the firm to substantially increase revenues and accelerate innovation.
Using Facebook to Open Minds on the Possibilities and Potential of Big Data
Because the average Facebook user has no direct knowledge or experience with Facebook’s data collection activities and data usage practices, they often fail to see the harm such can cause. Instead, the average user tends to perceive Facebook’s use of data as relatively harmless and little more than an annoyance. They mistakenly believe that as long as they don’t post anything on their wall of a personal or detailed nature that no harm can come of it.
Facebook is not the only corporate giant engaging in wide scale data harvesting. These days almost all corporations do so to some degree. Some of these efforts are benign and others not so much. Worse still, none of us know how this data will be used in the future nor to whom it is being sold and for what purpose it is being bought.
While the average person is fully attuned to the potential danger in the government collecting large amounts of data on them, they are blinded to the dangers in the private sector doing so.
It is this limited perception based on personal experience alone that can cloud discussions of the potential in big data within an organization. While many business heads are personally using Facebook and other social media, they may not be aware of how Facebook uses their and other users’ data and thus have difficulty imagining how their own organization could do so. Therefore, Facebook serves both as an excellent example of what is possible with big data from the business side, and as a warning of the dangers to privacy on the individual side. In any case, Facebook is an excellent case study to use in broadening the thinking of business leaders in your organization.
Professional Perceptions Versus Data Realities
The same holds true with perceptions stemming from professional reference points. For example, a marketing person will think in terms of customer and prospect data and metrics that they are somewhat familiar with or already use extensively. They will not necessarily extend the thought to what else they might learn from big data analysis, particularly when gleaned from sources they have never used or heard of. Marketers almost universally cheer the concept of gathering and using more data. Unfortunately many of them are unsure what to do with that data once it is gathered.
Further, professionals in all disciplines tend to think of data only as it pertains to their specific job or current tasks.
Members of the C-suite will typically act similarly. They tend to think in terms of the data they use now and rarely what other types of data and analysis they might use, at least not in any specific detail. Even CIOs, presumably skilled in taking the broader data picture, may think in terms of the specific data and related reports they regularly deliver to departments and to the CEO, and not necessarily about the data in storage that no one has accessed or requested in ages.
Because data analysis is performed piecemeal in this way, analysis becomes fragmented and siloed, even if the data itself isn’t, and the organization overall typically fails to realize full benefit. It isn’t that data democratization is a problem, for such is actually a strong advantage in nearly every case. The problem is that no one in the typical organization is asking the larger questions, those that exist outside their normal tasks, beyond their job scope or perhaps entirely outside of it. Innovation comes from looking at things differently rather than using new tools to perform the same tasks for the same reasons and in the same way. For innovation and extraordinary competitive advantage to be realized, this mold must be either augmented or broken.
From Perception to Cognitive Bias
Relying on your personal or professional reference point is a totally human thing to do. It is a useful way to organize your thoughts and actions most of the time. However, it is a clear example of “cognitive biases,” a term which coincidentally grew out of studies examining humans’ innate inability to correctly recognize and rationally factor decisions in situations involving huge numbers or statistical probabilities counter from commonly expected results. This leads to actions counter-productive to innovation in general and to data use in particular.
In other words, in order to consider information from a perspective not related to one’s own cognitive biases or reference points, most people need to see a clear example or for someone to show them what can be done before they can begin to imagine what else can be done with data.
Finding the Big Data Diviners
This is why it’s important for someone or some team to take the lead on exploring new data uses rather than merely hope such will spontaneously and organically appear within the organization. It is also important to understand these dynamics to better communicate the details and worthiness of big data projects and thereby increase executive buy-in, user adoption, overall collaboration, and widespread innovation.
Fortunately there are a few people in every organization who possess sufficient intellectual curiosity, analytical and critical thinking skills, and a fearlessness of change who can power true innovation via data use. The big surprise is that they are generally peppered throughout the organization and almost never conveniently grouped entirely in IT or as business analysts. Occasionally one of those people happens to hold a seat in the C-suite or at the boardroom table, but that is relatively rare given their great distance from the troops on the ground and the sanctum of the datacenter and data warehouse.
Characteristics of a Big Data Diviner
Remember your data diviners will be peppered throughout your organization and often where you least expect them to be. Look for these characteristics to help you find them:
![]() Insatiable curiosity. A tendency to explore information even when not directly required to do so.
Insatiable curiosity. A tendency to explore information even when not directly required to do so.
![]() A love for knowledge. These individuals are constantly learning on their own and on the job. But they may not be enrolled in training classes or formalized education. Whether they are enrolled in a class or not, they are absorbing new information around them constantly and they do so naturally and eagerly.
A love for knowledge. These individuals are constantly learning on their own and on the job. But they may not be enrolled in training classes or formalized education. Whether they are enrolled in a class or not, they are absorbing new information around them constantly and they do so naturally and eagerly.
![]() Easily make connections between seemingly disparate information. It has been said that the nature of genius is to “connect the dots” between sets of information. You’re looking for this kind of genius. Like big data tools, data diviners naturally and easily see connections between information points that others either don’t recognize at all or are far slower in recognizing.
Easily make connections between seemingly disparate information. It has been said that the nature of genius is to “connect the dots” between sets of information. You’re looking for this kind of genius. Like big data tools, data diviners naturally and easily see connections between information points that others either don’t recognize at all or are far slower in recognizing.
![]() Intuitive intelligence. This relates to the ability to make connections between disparate information but goes beyond that to include the ability to put such newly “connected information” to work. In other words, they don’t just see the connections and divine a new thought from them, but also can intuitively sense an appropriate action based on that information.
Intuitive intelligence. This relates to the ability to make connections between disparate information but goes beyond that to include the ability to put such newly “connected information” to work. In other words, they don’t just see the connections and divine a new thought from them, but also can intuitively sense an appropriate action based on that information.
![]() Ease with change and new technologies. Because this group loves to learn, they’re quick to accept change based on new information. In other words they are quick to discard old ideas in favor of new ones as information and logic dictates. They are also quick to adopt new technologies at work. They may not possess a technical understanding of it, and they may flounder in learning how to use it, but they’re usually eager to take the new tech for a spin and see what it can do.
Ease with change and new technologies. Because this group loves to learn, they’re quick to accept change based on new information. In other words they are quick to discard old ideas in favor of new ones as information and logic dictates. They are also quick to adopt new technologies at work. They may not possess a technical understanding of it, and they may flounder in learning how to use it, but they’re usually eager to take the new tech for a spin and see what it can do.
![]() Good critical thinking skills. They are highly logical in their approach to work and life. These people are natural thinkers and logical, effective planners.
Good critical thinking skills. They are highly logical in their approach to work and life. These people are natural thinkers and logical, effective planners.
![]() Easily understand patterns. Whether they purposefully do so or not, data diviners naturally see patterns everywhere: in how people act and think, the flow of work, the nature of office politics, the information in any chart they see, and pretty much in everything they observe.
Easily understand patterns. Whether they purposefully do so or not, data diviners naturally see patterns everywhere: in how people act and think, the flow of work, the nature of office politics, the information in any chart they see, and pretty much in everything they observe.
![]() Science lovers. This group tends to be interested in science to some degree because of the logic and patterns they find there and because of their love for learning. They may not be in science professions, but they have an affinity for science all the same.
Science lovers. This group tends to be interested in science to some degree because of the logic and patterns they find there and because of their love for learning. They may not be in science professions, but they have an affinity for science all the same.
![]() Typically good at math. Typically this group has strong math skills, or least they have stronger math skills than the average person. But not always. Some may be truly awful at statistics and higher maths but possess such high pattern recognition and critical thinking skills that they can divine data easily with the help of software that does the math for them.
Typically good at math. Typically this group has strong math skills, or least they have stronger math skills than the average person. But not always. Some may be truly awful at statistics and higher maths but possess such high pattern recognition and critical thinking skills that they can divine data easily with the help of software that does the math for them.
![]() Natural problem solvers. These are the “fixers” in your ranks. When data diviners see a problem they’re usually the first to suggest a solution or even to just fix it outright.
Natural problem solvers. These are the “fixers” in your ranks. When data diviners see a problem they’re usually the first to suggest a solution or even to just fix it outright.
![]() Easily bored with repetitive work. They may be doing repetitive work, after all jobs are still relatively hard to come by so they may have taken whatever job they could find, but they’re not happy there. This group much prefers mental exercise to accompany their work.
Easily bored with repetitive work. They may be doing repetitive work, after all jobs are still relatively hard to come by so they may have taken whatever job they could find, but they’re not happy there. This group much prefers mental exercise to accompany their work.
![]() Purpose driven. This group is not at all interested in busy work. They want to know the purpose behind their work and they want to work purposely. It is this innate search for purpose that enables them to find faster and better ways to accomplish the same thing. They don’t work harder; they work smarter.
Purpose driven. This group is not at all interested in busy work. They want to know the purpose behind their work and they want to work purposely. It is this innate search for purpose that enables them to find faster and better ways to accomplish the same thing. They don’t work harder; they work smarter.
![]() Values production over time clocking. These are clock haters. They don’t want their work time tracked because they tend to find such activity annoying and useless. Instead they value actual production. In other words, it doesn’t matter to this group if a task takes five minutes or five weeks, what matters is producing a worthy result. They want to be judged by results and not by how much time they took or didn’t take in getting them. But don’t worry, they tend to be hard workers who will stay at the task for whatever time is necessary to complete it. But if they accomplish it early, don’t expect them to fill the rest of the time on the clock doing busy work. They’ll want another challenging task to do. They are highly focused on efficient production and this is what makes them exceptionally good at innovating.
Values production over time clocking. These are clock haters. They don’t want their work time tracked because they tend to find such activity annoying and useless. Instead they value actual production. In other words, it doesn’t matter to this group if a task takes five minutes or five weeks, what matters is producing a worthy result. They want to be judged by results and not by how much time they took or didn’t take in getting them. But don’t worry, they tend to be hard workers who will stay at the task for whatever time is necessary to complete it. But if they accomplish it early, don’t expect them to fill the rest of the time on the clock doing busy work. They’ll want another challenging task to do. They are highly focused on efficient production and this is what makes them exceptionally good at innovating.
![]() Highly focused. This group is not easily distracted from a task. They tend to be highly focused and detailed in their work. While any human can make a mistake, this group makes far fewer than others, simply because they are so conscious of detail.
Highly focused. This group is not easily distracted from a task. They tend to be highly focused and detailed in their work. While any human can make a mistake, this group makes far fewer than others, simply because they are so conscious of detail.
![]() Often teach peers. Because this group learns well and easily, they are the first among their peers to learn and master new things. Usually they are also quick to teach their peers or at least answer their questions. Usually a data diviner is the person others in their work group turn to for help in understanding a task or process.
Often teach peers. Because this group learns well and easily, they are the first among their peers to learn and master new things. Usually they are also quick to teach their peers or at least answer their questions. Usually a data diviner is the person others in their work group turn to for help in understanding a task or process.
These people, the data diviners, whomever they are and wherever they are, need to be identified and their skills put into play, not necessarily on the data science teams, although they are very helpful there too, but in any position where they can have a direct impact on how data is used in the organization. At the very least, they should be encouraged to share their thoughts and to show their peers the very real gains to be had in data analysis beyond the norm.
It’s only when people with these tendencies are actively seeking new ways to use data that the company will see the full promise of big data come to fruition.
Until such people can be identified and their skills leveraged, the beginning big data play almost always rests on IT and/or the data science teams. Certainly the average team can work on the low-hanging fruit in data analysis if only by enhancing existing reports and processes. But for there to be any ground-breaking realizations of big data benefits and any truly imaginative innovations, those teams need members who are cross-disciplined and extremely knowledgeable of the business.
In other words, you need people on your data science teams who can bridge the gaps between disciplines and find the intersections. This is where creative thinking in terms of honing the company’s competitive edge begins and thus where innovative ideas are found.
However, it is a mistake to limit your data efforts to only data science teams. Granted, they are the foundation on which the company can pivot to a better position but they are not, nor should they ever be, the company’s only innovative engine. Start here but move quickly to recruit talented data diviners to the ongoing effort.
Start at a single point, such as with your data science team, but move quickly and steadily toward a large and fluid collaboration throughout the organization.
NEXT STEP: EMBRACING IGNORANCE
Understand that you and your team will always be saddled with a degree of ignorance. It is not possible to foresee everything or to know every question that needs to be asked. Learn to be comfortable with that ignorance and a near constant degree of uncertainty. After all, if you knew everything already, there would be no need to analyze the data in the first place.
Further, if you are aware of and acknowledge the ignorance, you can more easily identify what needs to be known. Use ignorance; consider it your friendly conspirator in big data explorations. It is when you are sure of the answer beforehand that you are more likely to fail because it then becomes more likely that you’ll inadvertently introduce confirmation biases, manipulate the outcome, or overlook additional data.
Build your project strategy as tightly as you can in order to keep it on course but also allow some “ignorance flexibility” to enable the capture and leverage of knowledge heretofore unknown that you may find along the way.
WHERE TO START
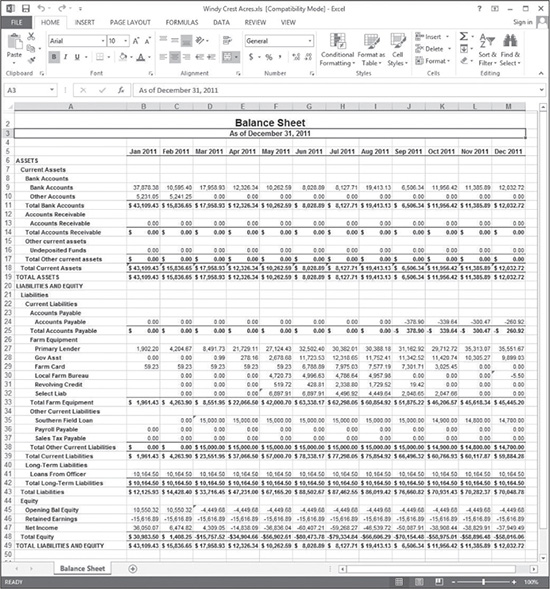
You should develop an overall big data strategy as well as more pointed project-specific strategies. The overall data strategy should be focused on continuously discovering ways to improve the business through refinement, innovation, and solid returns, both in the short and long terms. Project-specific strategies should lead to a specific measurable and actionable end for that effort. This should be immediately followed with ideas about what can be done from there, which in turn should ultimately lead to satisfying the goals in the overall big data strategy and reshaping it as necessary too.
Figure 2.2 illustrates how big data projects form from your overall big data strategy, but each project also has its own strategy. As these projects come to fruition, your company grows and changes to become more competitive and profitable. When this happens, new ideas and needs form which then should return to shape, inform or instruct your overall big data strategy and to dictate new big data projects.
Figure 2.2 Big data projects form from your overall big data strategy, but each project also has its own strategy.
Source: Pam Baker. Illustration by John Duffey.
Begin at the End
The key to developing a winning big data strategy is to focus on actionable insights rather than on simply delivering information. This in not to say that knowledge isn’t useful in its own right but merely an acknowledgment that even the best fishing expeditions are not satisfying unless you also bring home a basketful of fish at the end of the day. In other words, you must produce actionable insights for there to be measurable gain, that is, an appreciable return on investment (ROI). However, it is smart to also “fish” for new knowledge that may not result in an immediate payload, as that new knowledge will often point you to opportunities and avoidable pitfalls that you may not have otherwise discovered.
For projects designed to deliver actionable insights, you begin at the end by identifying what you need to know, and that which you can actually act upon, in order to solve a specific business problem or to reach a specific goal. From there you work backward to formulate the questions you need to ask of data in order to arrive at the needed insights.
If your defined goal is too broad, such as “increase sales,” then you can’t easily determine what information you’ll need to look for within your data, nor will you be able to pinpoint a specific action to bring about the desired outcome. By contrast, if your defined goal is more specific, such as “to increase purchases of Product X by 10% in the ‘best customers’ group” then you will know what you need to look for inside your internal and externally imported data in order to develop a winning strategy.
For example, some of the things you would likely need to know in the “to increase purchases of Product X by 10% in your ‘best customers’ group” scenario are the following:
![]() A list of your top customers in general
A list of your top customers in general
![]() A list of your top customers who bought Product X in the past
A list of your top customers who bought Product X in the past
![]() A list of your top customers who bought products similar to Product X in the past
A list of your top customers who bought products similar to Product X in the past
![]() A list of top customers who have not purchased Product X but have bought similar or related products
A list of top customers who have not purchased Product X but have bought similar or related products
![]() A determination of common characteristics and triggers among top buyers of product X and similar products that you can then use to identify other top customers in general who share the same characteristics and high response rate to the same triggers
A determination of common characteristics and triggers among top buyers of product X and similar products that you can then use to identify other top customers in general who share the same characteristics and high response rate to the same triggers
![]() An understanding of how Product X compares with competing products on the market and with current trends overall; determine how that information affects “salability” of Product X
An understanding of how Product X compares with competing products on the market and with current trends overall; determine how that information affects “salability” of Product X
![]() An understanding of which price points moved Product X best in the past; which moved products similar to Product X best in the past
An understanding of which price points moved Product X best in the past; which moved products similar to Product X best in the past
![]() Knowledge of which price points moved Product X well in the past and also delivered the best margin
Knowledge of which price points moved Product X well in the past and also delivered the best margin
![]() An understanding of which price points slowed Product X sales; find out whether those price points were the sole problem or whether there were other circumstances present that also affected Product X sales in the same time period
An understanding of which price points slowed Product X sales; find out whether those price points were the sole problem or whether there were other circumstances present that also affected Product X sales in the same time period
![]() A determination of what seasons, weather, and other external factors affected an uptick or downturn in Product X sales
A determination of what seasons, weather, and other external factors affected an uptick or downturn in Product X sales
![]() Insight into which sales people and stores are currently moving the most Product X and what they have in common (pricing, ad campaigns, in-store merchandising or window displays, weather conditions, sales contests, and so on)
Insight into which sales people and stores are currently moving the most Product X and what they have in common (pricing, ad campaigns, in-store merchandising or window displays, weather conditions, sales contests, and so on)
![]() Metrics on what website positioning has moved the most Product X in the past
Metrics on what website positioning has moved the most Product X in the past
![]() Comparatives of all A/B and multivariate testing regarding or impacting Product X sales online
Comparatives of all A/B and multivariate testing regarding or impacting Product X sales online
![]() A performance comparative of past ad and marketing campaigns aimed at moving Product X
A performance comparative of past ad and marketing campaigns aimed at moving Product X
![]() A study of loyalty programs that affected past sales of Product X and similar products to evaluate how well such worked in the past and to determine if a new loyalty tie-in is needed to move more of Product X now
A study of loyalty programs that affected past sales of Product X and similar products to evaluate how well such worked in the past and to determine if a new loyalty tie-in is needed to move more of Product X now
![]() Analysis of what your competitors are doing to move Product X and similar products (pricing, ad/marketing campaigns, merchandising displays online and off, and so on)
Analysis of what your competitors are doing to move Product X and similar products (pricing, ad/marketing campaigns, merchandising displays online and off, and so on)
Using analytics to explore new ideas and discover and address issues and opportunities is done much the same way. Start with a “what if” or “why is this so” or “could this be” question and work your way back to identify what questions you need to ask of data. Even if the answer is not actionable in some of these cases, the knowledge gleaned will likely be useful in other actionable situations.
Once you know what questions you need to answer, you can effectively mine data. When you find the answers to those and other related questions, you can combine them for a concise view that will then reveal an action. Evaluate the action in terms of logistics and cost as well as in terms of public relations, customer relations, and regulatory compliance. Take action accordingly.
When Action Turns into Inaction
Ideally your company will be willing, able, and prepared to take action as soon as you have the insights necessary to do so. Unfortunately this is sometimes not the case.
Industry analyst Joshua Greenbaum, who is also an IEEE Computer Society member and principal at Enterprise Applications Consulting, said in an interview following his presentation at the 2013 Rock Stars of Big Data event that the “number of companies that walk away from taking action after they have the insights from big data is unbelievable.”
He cited as one example a manufacturer that used big data to discover counterfeiters who were stealing millions of dollars from the company by producing look-alike products complete in every detail, including packaging and the company logo. After the counterfeiters were busted via big data analysis, one would think the company would immediately act to protect future revenues. But that’s not what happened, says Greenbaum. “They shrugged and walked away because they had no budget with which to act.”
If you would like to hear Greenbaum’s full presentation, you can find it on YouTube. The video is titled “Joshua Greenbaum: Imagineering Big Data—How to Bring Rock Star Analysis to Your Company.” But rest assured that many industry observers have noted the all-too-common phenomenon of companies walking away from the answers found in data analysis.
This begs the question of why companies bother going to the expense and effort of analyzing big or small data if they have no plans to then act upon the findings? This is a frequent occurrence across industries. Why? Frequently, companies find they don’t have the resources or the leadership commitment to follow through. Other times, says Greenbaum, “the company culture gets in the way.”
In other words, if the analysis is counterintuitive to decision makers, if the action indicated is costly or threatens to disrupt other activities already budgeted and prioritized, and/or if the implementers perceive the action to be threatening to their job security or department, the recommended action is not taken and the big data project fails to produce a return on investment (ROI). This then, not surprisingly, tends to lead to a huge drop in morale among data science team members and users who were eagerly looking forward to having a solution.
Therefore it is prudent to consider at the beginning of strategy development both the availability of the means to take action on the results and the likelihood that action will be taken. There simply is no point in searching for a solution to a problem that the powers-that-be don’t want solved or can’t afford to act upon.
However, quite frequently you will not know in advance how the end results will be received or whether they will be acted on. Many big data efforts will thus be a bit of a gamble. To offset this risk, mix data projects so that you are running some you know will be seen to fruition with some you are unsure will ever see the light of day. In this way, you can steadily show a return on investment while also pushing forward into new territory.
Otherwise, consider big data analysis largely a “what if” game on a huge scale. However, time can be lost and efforts scattered if you simply begin by exploring all the “what ifs” you and your team can think up.
IDENTIFYING TARGETS AND AIMING YOUR SIGHTS
It is smarter to begin by looking at the reports and processes the company already uses.
In regard to reports, begin by noting the questions posed and the report requests made to IT and reporting systems. Also look at what reports are generated and what information they contain. Then ask the data science team to discern from this information what specific insights are being sought and why, and then figure out how those insights can be delivered more effectively and efficiently through big data analysis.
In regard to processes, follow a similar line of inquiry. Why does the process exist, that is, what ultimately is it designed to achieve? Look for inefficiencies in those processes that can be eliminated by a smarter use of data analytics. Sometimes you’ll even discover that a process is no longer needed and should be replaced or eliminated outright.
This is where the “what if” game begins. This is where the team asks “what if we did it this way?” or “what other analysis can we add to help?” until an optimum answer is found. From there, mapping out a data project right down to the user interface and dashboard is relatively straightforward.
It’s when you get past this low hanging fruit that the what-if game gets truly challenging. At that point you’ll need creative, analytical thinkers who are unusually knowledgeable about the business and who are capable of intellectually exploring what lies beyond anything the company has ever analyzed or done before. The failure rate will increase at this stage since a good bit of this exercise is experimental or trial-and-error. Make sure your strategy accounts for this in terms of budget, ROI calculations, and the time and effort needed for multiple iterations.
Covering All the Bases
Beyond the previously mentioned considerations in strategy development, use this checklist to ensure your strategy is covering all the bases before you call it done:
![]() Is your strategy in line with the CEO’s vision and the company’s stated objectives? If not, are you confident you can sell your strategy to the C-suite? If not, your project is likely doomed to failure no matter how good your overall strategy is.
Is your strategy in line with the CEO’s vision and the company’s stated objectives? If not, are you confident you can sell your strategy to the C-suite? If not, your project is likely doomed to failure no matter how good your overall strategy is.
![]() Is your data project ethical? If you are unsure, check the ethics rules from reputable organizations and associations, including those in your specific industry or market. Some examples are the American Statistical Association (ASA); The National Science Foundation (NSF) supported Council for Big Data, Ethics, and Society; and the Data Science Association.
Is your data project ethical? If you are unsure, check the ethics rules from reputable organizations and associations, including those in your specific industry or market. Some examples are the American Statistical Association (ASA); The National Science Foundation (NSF) supported Council for Big Data, Ethics, and Society; and the Data Science Association.
![]() What is the potential backlash from customers, society, or regulators? Make sure you understand those risks and ensure they are within an acceptable range before you finalize your strategy. And discuss your project in detail in advance with legal counsel. Otherwise, you will end up recommending or implementing actions that could prove costly to the company.
What is the potential backlash from customers, society, or regulators? Make sure you understand those risks and ensure they are within an acceptable range before you finalize your strategy. And discuss your project in detail in advance with legal counsel. Otherwise, you will end up recommending or implementing actions that could prove costly to the company.
![]() Do you need data from third-party sources? If so, identify the sources in your strategy and make sure you know what costs and restraints exist before proceeding.
Do you need data from third-party sources? If so, identify the sources in your strategy and make sure you know what costs and restraints exist before proceeding.
![]() Will the results move the company forward in some way? If not, label the project as experimental and feed it into the project stream in such a way that it neither slows the company’s advance nor unduly reflects negatively in ROI calculations.
Will the results move the company forward in some way? If not, label the project as experimental and feed it into the project stream in such a way that it neither slows the company’s advance nor unduly reflects negatively in ROI calculations.
![]() What buy-ins do you need for this project to succeed? Solicit support from top management and users early and reinforce that support as often as needed going forward. Make part of your strategy a detailed plan to develop, nurture, and maintain all necessary buy-ins.
What buy-ins do you need for this project to succeed? Solicit support from top management and users early and reinforce that support as often as needed going forward. Make part of your strategy a detailed plan to develop, nurture, and maintain all necessary buy-ins.
![]() Is your strategy free of human cognitive bias? In other words, is your team, or any member on it, seeking a specific outcome or approaching the project with an agenda other than finding an accurate answer to the question? If so, your strategy is compromised at the outset and the analysis will be highly questionable if not outright wrong.
Is your strategy free of human cognitive bias? In other words, is your team, or any member on it, seeking a specific outcome or approaching the project with an agenda other than finding an accurate answer to the question? If so, your strategy is compromised at the outset and the analysis will be highly questionable if not outright wrong.
![]() Are your projects balanced between short-term, mid-term, and long-term returns? It’s common for companies to focus on short-term ROI and thus ignore the long-term. Such tunnel vision is inadvisable as it can hurt the company over time. Make sure your overall strategy includes long-term projects and thinking too.
Are your projects balanced between short-term, mid-term, and long-term returns? It’s common for companies to focus on short-term ROI and thus ignore the long-term. Such tunnel vision is inadvisable as it can hurt the company over time. Make sure your overall strategy includes long-term projects and thinking too.
These guidelines will put you well on the way to devising a winning strategy.
HOW TO GET BEST PRACTICES AND OLD MINDSETS OUT OF YOUR WAY
Because big data is relatively new, at least in terms of tools and the things those tools now make possible, everyone is busy trying to figure out how to best leverage and manage data. A goodly number of industry experts try to shed light by sharing use cases and what those success stories have in common. Inevitably, this list of commonalities becomes a set of oft-repeated “best practices.”
While the concept of best practices works well in mature technologies and industries, it can actually be counter-productive in newer ones such as big data. Ironically in the case of big data that is because too little data is used to determine what practices are indeed the best. Most companies are experimenting today with big data and almost all of those are going for the simplest of projects in order to learn enough to take on more complex projects. Of those, many fail for a variety of reasons, some of which have nothing to do with their big data practices.
By all means note what successful companies are doing and how they are doing it, but remember always that the practices that will be successful for your company do not necessarily come canned and will always be measured in terms of business outcome. Take a hard look at what others are doing with big data and learn from it. Just don’t blindly follow in those footsteps. Instead, apply what you learned only to the extent that it helps you arrive at your goals. That may mean skipping or adding steps or even leaving that path altogether.
Established mindsets, however, tend to be a heavily ingrained problem and one much harder to overcome than a lack of skills or project uncertainties. People—be they on your data science team, in the C-suite or end-users—are rarely inclined to leave their current brain rut or abandon lessons learned through previous experience. Some of those mindsets will need to change, however, if your company is to move to a data-driven model rather than a human intuitive model. Be prepared, for that task is not an easy one.
Addressing People’s Fears of Big Data
Human stubbornness is, of course, part of the problem but so are negative personal experiences and perceptions. For example, in some companies the culture has been poisoned by punitive use of technology. In others, staffers perceive new technologies to be punitive even if they aren’t. Whether purposefully punitive or not, employees may fear big data tools will be used to punish them or eliminate their jobs, particularly after witnessing or experiencing job losses through automation or outsourcing, time tracking tools applied to their work, and other technologies perceived to punish or replace workers.
When the personal experience or perception is one of punitive technology use, resistance to data-driven decision making is naturally high. Be aware of these mindset scenarios: stubbornness, intellectual and job pride, fear of job loss or punishment, fear of change, turf protection, budget protection, and fear of loss of control, among others. Build into your strategy the steps you need to take to acknowledge and then change negative or resistant mindsets from the outset.
Usually that begins by demonstrating early on how data analysis actually can make each person’s job easier—particularly in decision making. Without making a big deal of it, stress that data-driven decisions also offer a degree of cover. When one makes a decision based on quantifiable data that can be clearly pointed to, win or lose, it is easier to justify.
Ending the Fear of the Unknown
Take for example, a national or district restaurant manager. It is his or her job to continuously increase sales for the company. The data he or she traditionally considers in this effort is generally dated and limited information. It is essentially a snapshot of occurrences in the past with little to no indication of context. Even if more current or real-time information is flowing in through various systems such is often incomplete, siloed rather than integrated, and also often out-of-context.
Yet it is all the information the national or district manager has to go on because he or she cannot physically be in all store locations all the time to personally observe each situation. Therefore the manager travels throughout the territory he is responsible for, and holds many meetings with managers beneath him in the hierarchy, trying to augment the data he has on hand.
Even so, he really has no idea what is happening in every store. In the end, he’ll make an educated and possibly instinctive guess as to what actions should be taken to increase sales in each store and over the entire territory. That guess may or may not prove to be correct but he won’t know which until much later.
By contrast, with big data the national or district manager will be able to see in near real-time or real-time, everything that is happening at each restaurant in the territory, including external factors such as weather, local events, and road construction that may be negatively or positively affecting sales for the duration.
But he can also see which servers are the best sellers and whether they are on duty, how food inventory is holding up to demand or wasting away for lack of it, which marketing campaigns are working where and which are not, and react to all of that and more in real-time to adjust each restaurant’s performance immediately. Now he can do his job better and with less stress. It’s less stress because now he can see what needs to be done rather than blindly guess at it. He can rapidly correct course as needed rather than suffer the consequences afterwards.
The national or district restaurant manager need not fear big data because big data cannot do his job for him; it cannot take action, only suggest it. But if he embraces big data, he can outperform on the job and thus actually protect his job because his performance remains high. Should something negative happen anyway, he can justify his actions based on the data analysis.
Tempering Assurances for Change Is About to Come
Explain to fearful workers that data analysis is not an automated process that replaces jobs but an enhancing element to help workers get the work done. Be careful with such claims because obviously if there is a department or group of people solely dedicated to producing the same reports month after month, big data tools could eliminate their jobs or necessitate transfers. For the most part, data analysis does not replace people; it enhances their performance. At least it isn’t replacing people yet.
However, big data analysis will ultimately lead to job losses through a wide assortment of automations and process refinements stemming from the analysis. Further, there will be less and less human involvement in decision-making once all is said and done.
Andrew McAfee, principal research scientist at the Center for Digital Business in the MIT Sloan School of Management and author of Enterprise 2.0, succinctly made this point in his December 9, 2013 blog post in Harvard Business Review.
The practical conclusion is that we should turn many of our decisions, predictions, diagnoses, and judgments—both the trivial and the consequential—over to the algorithms. There’s just no controversy any more about whether doing so will give us better results.
When presented with this evidence, a contemporary expert’s typical response is something like “I know how important data and analysis are. That’s why I take them into account when I’m making my decisions.” This sounds right, but it’s actually just about 180 degrees wrong. Here again, the research is clear: When experts apply their judgment to the output of a data-driven algorithm or mathematical model (in other words, when they second-guess it), they generally do worse than the algorithm alone would. As sociologist Chris Snijders puts it, “What you usually see is [that] the judgment of the aided experts is somewhere in between the model and the unaided expert. So the experts get better if you give them the model. But still the model by itself performs better.”
Things get a lot better when we flip this sequence around and have the expert provide input to the model, instead of vice versa. When experts’ subjective opinions are quantified and added to an algorithm, its quality usually goes up. So pathologists’ estimates of how advanced a cancer is could be included as an input to the image-analysis software, the forecasts of legal scholars about how the Supremes will vote on an upcoming case will improve the model’s predictive ability, and so on. As Ian Ayres puts it in his great book Super-crunchers, “Instead of having the statistics as a servant to expert choice, the expert becomes a servant of the statistical machine.”
Humans should take heart at that last bit of the quote as it is proving to be a smart move to incorporate expert opinions in algorithms at least for now.
The Feared Machine’s Reign Is not Certain; Mankind Still Has a Role
However, there is solid reason to doubt that we’ll soon see a day when machines will completely replace human reasoning and work. While well-designed algorithms perform nearly flawlessly, they are relatively rare today. One need only look at the ill-fitting ads regularly served by the likes of Facebook and Google, two of today’s top algorithm builders, to see how far from hoped-for targets such algorithms can stray.
One can safely assume that algorithms will improve over time and machines will begin developing algorithms as often or more often as people do. But until machines come enabled with imagination and the ability to absorb and use context creatively, it is unlikely they will take over completely—at least not in a world dominated by humans.
However, it is a mistake not to acknowledge ongoing advancements in artificial intelligence (AI), much of which is big data driven. AI machines will indeed supplant most human workers one day but that day is not today.
Do not mislead people about the role of big data analysis in the workplace but do not feed fears of a data dominated world either because such fears may never be realized. And if they do come to be, it is likely they will materialize in a far less scary form. As McAfee pointed out in his post, adding human expert input to the algorithm dramatically improves the outcome. Human roles are more likely to adapt than to be eliminated in a data-driven world.
Reaching the Stubborn Few
As to reaching the more stubborn and negative people in the organization, that’s a bit trickier to overcome. Identify them early if they are in key positions and dedicate part of your strategy to addressing this obstacle. The goal should be to find ways to convince them to positively view adoption of the results and to take action if they are in a position to do so. But in cases where individuals can’t be educated or swayed, you’ll need to find other ways around their resistance. The point is that the “human” factor, particularly in changing negative or resistant mindsets, must be a part of your overall strategy.
Eventually data-driven decision making will become as routine as email and negative mindsets will become less common. Until then, you must prepare to win hearts and minds or you may find your projects sabotaged from within.
ANSWER THE QUESTIONS NO ONE HAS ASKED
Other things to consider in your strategy development are the questions no one thought to ask. If you’re waiting on other people in the organization to tell you what they need, you may be in for a long and fruitless wait. Generally speaking, people don’t realize what is possible in the realm of data analysis and therefore don’t know what to request.
And, if in response to the resulting sound of crickets, all you’re doing with big data is rethinking and reworking existing processes and reports, you are missing the greater benefits to be had. It’s perfectly fine to start out reworking existing projects, as they provide solid learning exercises and build on established results and parameters, not to mention they are the fastest route to solid ROI. However, you will need to move past those pretty quickly if your business is to have and retain a competitive edge.
One of the easiest ways to build in this forward movement is to add the “and then” questions to your “what if” questions in every project strategy.
For example, follow a big data analysis on financials by asking a question such as “what if finance could drill down to small data and drag selected data sets into a grouping in any way they want to create a new analysis on demand using just that data subset”? Certainly that would be a brilliant mix of standard reporting and self-serve analysis through the simplicity of visualization. Kudos should be given all around. But why stop there?
Keep Asking What Is Possible
Part of the strategy should be to follow that moment of clarity brought on by a “what if” question with another question: “and then what is possible?”
By creating a culture where data teams naturally follow a successful answer to the “what if” question with an “and then what is possible?” question, people will begin viewing each project not as an end in itself, but as a step along a continuum. It is easier to see next steps, particularly innovative steps, if you ask what you can do next once you are able to do “this.”
Another way to find an answer to questions that no one has asked but clearly should is to combine results from earlier projects and wonder aloud what can be done from there. Some combinations will lead to a dead end. Others will lead to innovations either through their direct use or by sparking related Eureka moments. But this too is not an end unto itself; it is the beginning of yet another purpose-driven data exploration.
Look for End Goals
Yet another way is to observe how people work in specific jobs. What data do they use? How do they use it? What do they do with the results? Further, are those results shared with anyone else in any other job and, if so, why do they need it and what do they do with it? In other words, observation can enable you to detect, follow, and analyze the information trail within the business in order to see what knowledge is sought and why.
But most importantly, you should wonder about why any of the people involved in the business do any of the tasks they do. If you ask them, they’ll probably just explain that the task is part of their job or that they do a specific task or set of tasks in order to arrive at point C, or D, or E. But that often is not the real, or at least not the entire answer to why they do what they do. Further, there may no longer be a need to arrive at point C, D, or E. In other words, that route may have worked in previous years but a new route to a different end may work better now.
For example, let’s consider someone in the organization who is charged with managing fleet fuel costs. The manager may spend a goodly portion of their day gathering fuel costs from different fueling outlets, watching the energy market, and forecasting future fuel cost estimates. The data science team could improve that existing process by providing that manager with a stream of data from one or more reliable third parties, such as from the U.S. Energy Information Administration (EIA). In this way, the manager uses more of her day making management decisions rather than in gathering the information.
But improving efficiencies in that process may not be enough to positively deliver the end goal—which is to manage and ultimately decrease fuel costs. Big data analytics could reveal that changing the vehicles’ routes to leverage lower prices available from other fueling stations not previously considered, or adding alternative fuels, will lower fleet fuel costs. Further the analytics may reveal that switching to self-driving vehicles will reduce overall operational costs and maintain even vehicle speeds (as opposed to a human driver who may change speeds unnecessarily, especially if tired) to further reduce fuel costs.
In the first scenario, the existing process is made more efficient but it remains essentially the same. In the second, the process is changed in order to better achieve a well-defined end goal—in this case managing and lowering fuel costs.
This is why digging to discover the actual reason behind actions and processes is imperative and why weighing the efficiency and usefulness of that reason and action is equally important.
Mull it over. Figure out what ultimately it is they are trying so hard to know and do. If you can discover the answer to that, you can form the question they don’t know to ask, and then you can deliver an answer that is relevant to the work at hand.
CROSS-POLLINATE THE INTERPRETATIVE TEAM
As previously discussed, it is important for members of the data science team to be multi-disciplined. They need to understand the business and at least one discipline other than data science. The reason for this is clear. Tools are useful only in the hands of master craftsmen with a clearly-defined purpose. That “clearly-defined purpose” can only come from understanding what the business needs built, repaired, or adapted.
For example, a data science team member who is well-versed in financials and data tools will prove invaluable in providing financial data insights. This logic follows with other disciplines and other department projects. Is it too much to ask for a single member of the team to possess such a mix of skill sets? Not really, but they can be difficult (and expensive) to find.
Start by looking in your ranks for skilled IT professionals who have served time servicing a specific department. Those people should have a strong understanding of the business and how that department in particular works. They will have at least some data skills because that is a goodly part of what IT does—delivers data in a variety of reports.
However, they may not have all of the necessary big data skills and you may need to supplement the team with individuals who possess a working knowledge of advanced data science, data mining, data sourcing, and new big data tools. Or, you may elect to train these workers on using big data tools instead. In any case, it is typically easier and faster to train people how to use the tools than it is to train a skilled big data scientist on the nuances of your business as a whole and any given department or division in particular.
Keep in mind that not all big analysis, as Greenbaum calls it, requires the use of big data proper. It’s not like data analysis is an entirely new, never-before-heard-of business tactic. It’s only that the new tools are better, cheaper, and faster than the traditional ones. Therefore, you may be able to build a productive team from your existing IT ranks that can function just fine until you can train them further and/or find and hire supplemental talent specifically trained in big data.
Add Business Analysts and Key End Users to the Team
But that is only part of the solution. You’ll also need multi-disciplined or cross-pollinated data and business analysts. It’s one thing for data science teams to feed insights to a given department or a member of the C-suite. It’s another thing entirely to interpret the results correctly and form appropriate action plans.
For this reason, part of the strategy must include building rapport and collaboration between business and data analysts, as well as other key end users, who are not already a part of the data science team. In this way, the entire organization becomes one giant big data engine where innovative ideas can flow in any direction. Big data use becomes ubiquitous and a renewable energy that forever powers the organization.
To that end, increasing data literacy throughout the company, or at the very least among key personnel, either through training existing employees or through acquiring new ones who already possess this skill, is imperative. That part of the company’s overall big data strategy should be shared with human resources so they can begin to act on it now.
Add a Chief Data Officer to Gather and Manage the Data
Mario Faria, an affable and brilliant guy originally hailing from Brazil, bills himself as the world’s very first chief data officer (CDO), and perhaps he is. He certainly holds that title at ServiceSource. He’s also a big data advisor to the Bill & Melinda Gates Foundation. Whether or not he is the very first CDO, he is certainly a passionate supporter of the concept and the practice.
“A CDO does not own the data, he or she is the caretaker of the data and, importantly, an agent of change in helping to establish a data driven culture inside the organization,” he said. “From here they are accountable for data strategy, bringing a data management view on how a company can make money using its data assets. The importance of this role is coming to light and will be a part of the discussions among C-level and the board of directors.”
Indeed, it’s a brilliant idea packing a ton of potential benefits and many companies are taking advantage of it now. In other words, the addition of a CDO to executive ranks is no longer an anomaly.
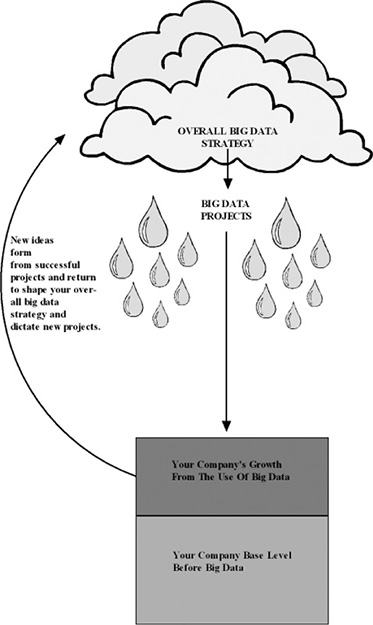
Mark Raskino, vice president and Gartner Fellow in the Executive Leadership and Innovation group of Gartner Research, reported in November 2013 that the number of chief data officers doubled over the number in 2012 to a total of 100 (see Figure 2.3). Interestingly over 25% of them were women, almost twice the number of female CIOs. The majority of CDOs (65%) were based in the United States, but they were also found in over a dozen countries.
Figure 2.3 Depiction of Gartner Research findings on the growth of Chief Data Officers and gender breakdown in 2013.
Source: Gartner Research. Bar graph drawn by Pam Baker. Illustration by John Duffey.
Traditionally data has been kept and managed by IT as one of its many daily duties. But that was back in the day when data was only generated and used in-house and it rarely if ever took center stage in company affairs.
Today we are in a data economy and data-driven decision making is the goal at nearly every level of business. Data has officially come out of the warehouse closet and now sits center stage like a prima donna with all eyes upon it. In short, data is a major tangible asset now.
Critically, the data needed to complete the transition from information to knowledge is no longer housed entirely on-premises as it once was. It’s not even always solely within the company’s ownership or control. A good chunk of such data may typically be in the cloud or in the possession of other entities.
Someone needs to be in charge of managing this new asset across many fronts, not only in terms of housekeeping and cataloging, as was once the primary focus, but also in regard to actively developing and implementing strategies, standards, policies, and governance.
Make no mistake, a chief data officer is not simply a caretaker but also a strategic thinker, a champion of projects, and ideally a master of all things data related.
It makes sense to have a chief data officer or someone charged with CDO duties in place. There needs to be a point person ultimately responsible and accountable for the company’s data currency in this new data economy. After all, none of us would treat any other form of valuable asset with any less diligence or without actively seeking to maximize its return, so why would we treat this new currency any differently?
However you choose to manage data, do not take the task lightly. Make sure someone in the organization stays on top if it constantly.
START SMALL AND BUILD UP AND OUT
While you should think big in developing your overall big data strategy, it is wise to begin implementation with small, well-defined projects. This enables the team to rapidly turn projects to meet ROI expectations and to learn as they go. The value of the on-the-job training cannot be overstated.
One of the many striking comments Foster Provost made at an October 2013 press luncheon at Strata/Hadoop World in NYC was that there is “no consensus on what data scientists should know.” Provost is a professor of information systems and NEC faculty fellow at New York University’s Stern School of Business as well as coauthor of the book Data Science for Business. He said he was often asked what skills companies should look for in data scientists but there’s no firm answer to that question.
Hence the need for your data science teams to learn on the job. Yes, they need some hard and soft data science skills from the outset but don’t expect those to be complete or adequately refined. At least not yet.
It will take time for universities and others to be able to accurately define needed skills for this group and to refine their teachings accordingly. It will also take considerable time for enough data scientists to gain the experience necessary to hit peak performance. Meanwhile, there’s work to be done.
Make gaining experience part of your strategy. Start with small, purpose-driven projects that can double as training exercises and move to larger projects when the team is more experienced with the tools and the concepts.
PROTOTYPES AND ITERATIONS STRATEGIES
Because big data is relatively new and few end users understand it, it’s important to present work in stages so they can focus on one element at a time. In this way, you will increase adoption and collaboration and you will find what changes need to be made early on.
Sapana Patel, senior director of BI and Software Development at Spirit Airlines, demonstrated how her company achieved this during her presentation at the 2013 Big Data Summit in Arizona. Patel explained that her team shared prototypes in stages so users could evaluate design and ease of use before they worried about the actual data. In this way the team could finalize the design of reports and dashboards before they plugged the data in. Such an approach saves time and effort, decreases complaints, and increases adoption. Once the final rollout happens, none of the end users were surprised by how it looked and worked or by the data it contained.
There should be few if any surprises in successive iterations either. Collaborate with users on the front-end, get feedback early, and roll out what was expected by all. Changes in each iteration should be handled the same way. Make these steps part of your project strategy so that they are never overlooked or bypassed.
A WORD ABOUT ADDING PREDICTIVE ANALYTICS TO YOUR DATA STRATEGY
Predictive analytics is something everyone talks about but few actually use. Everyone would like a crystal ball to peer into and see the future but most have their hands full dealing with the here and now. That’s unfortunate because predictive analytics can be key to plotting the company’s future and its just-in-time innovations.
It is imperative to include predictive analytics in your overall big data strategy. For some, it will be easiest to accomplish that by following projects based on real-time or traditional analysis with projects centered on predictive analytics addressing the same questions in a future timeframe. This tactic helps pace the addition of predictive analytics and focuses its use on known areas of need.
At some point in your overall big data strategy there should be definite plans to broaden the use of predictive analytics. As with other potential long journeys though, taking initial small steps is better than delaying starting. After all, there will never be a time when data science teams are not busy. Plan its use now or it will never happen.
DEMOCRATIZE DATA BUT EXPECT FEW TO USE IT (FOR NOW)
There is much talk in the industry about democratizing data and analytics so that anyone in the business can tap into them however and whenever they need to. In theory, under such a scheme everyone will use the data, at least everyone who is duly authorized will, and the company will move smoothly and rapidly forward as a result. In practice, it is highly unlikely that more than a few people will actually regularly use such data.
“People will buy analytics and workbenches and expect everyone to use them to write their own reports,” explained John Lucker, principal at Deloitte Consulting. “But an audit of licenses in actual use typically reveals a fairly big ratio of unused licenses which is costly in itself but also means the company is not getting use out of the data.”
At this moment in time, data literacy rates are incredibly low in the average organization. This is true even among the millennial generation who grew up in a highly technical world. This situation exists because people are more likely to be experienced in using technology, particularly consumer technology, than they are in understanding how it works. While the average person can readily use analytical results, they typically have no idea how those results came to be or what else they can be used for nor do they necessarily have the desire to find out.
For example, people are generally familiar with checking the analytical results provided by a service like Expedia and making a decision based on that information. This is a data-driven decision although they may not recognize it as such. However, they do not necessarily understand how Expedia or a related service works or what else they could do with the information. They generally accept the analytical results as accurate and use them for the intended purposes only. The same holds true with data and analytics that people use at work. The average person only uses them to perform a previously set task without considering what else the information could be used for or whether the information is even accurate.
If this is the case, why should any company democratize data? Simple. It is the quickest way to find and identify those employees who do have an affinity for data and analytical thinking. Those employees will use the data and often in very creative and unexpected ways. Make sure part of your overall strategy is to take note of who is using the data and how, and that it includes a plan to leverage this previously hidden talent pool.
YOUR STRATEGY IS A LIVING DOCUMENT; NOURISH IT ACCORDINGLY
While no plan works if it isn’t executed accordingly, rigidity in adhering to the plan can also be self defeating. Treat your overall big data and project strategies as living documents that will adapt and grow in response to changes, new discoveries, and, yes, additional data. This is not the same thing as scope or mission creep. You need to keep projects planned and focused but within parameters that allow flexibility so that you can leverage elements, processes, and new knowledge as you discover them.
Further, it is important to consciously plan to routinely revisit and rework your big data strategy on a regular basis. As time passes, new knowledge is discovered and skills improve. Make sure your strategy is refined regularly to reflect and leverage those advancements.
SUMMARY
In this chapter you learned how confusion leads to inertia in using big data for decision-making throughout the organization and how to overcome that. You learned how to formulate both an overall big data strategy and successful project-specific strategies, as well as show to build more projects off of successfully completed ones. The reasons that strategies fail, ROI is not delivered, and actionable insights are not acted on, became clear and tactics to resolve or overcome these issues were revealed. The human factor, and all the issues contained within, was explained and tactics were explored to successfully address these too. Further, you learned several ways to build a successful team, including finding and recruiting “data diviners” scattered throughout your organization. In short, you now know how to strategize and drive big data efforts in your company.