5
Market Basket Analysis Solution Definition
Chapter 2 identified the elements of Market Basket Analysis, which included the Itemset, Objects, and Affinity. In that discussion, these elements were presented as definitions, concepts, and examples. The information included in that discussion is key to creating a working and value-adding Market Basket Analysis application. For that reason, if you skipped past the first chapters of this book to go directly to the solution design, please go back and read Chapter 2. The information provided in Chapter 2 will not be repeated here in Chapter 5; the information in Chapter 2 will be assumed to be a shared common understanding of the elements of Market Basket Analysis. So, if you have not read Chapter 2, please stop here and read Chapter 2 before continuing with Chapter 5. Also, you will eventually need the information in Chapter 3 and Chapter 4 as you build a working Market Basket Analysis application. So, please keep a bookmark in those chapters. Later on when you start to ponder such questions as “What is my goal? What am I trying to achieve?” and “Why do the results of my analysis not come out quite right?” that’s when you’re ready for Chapters 3 and 4. If, however, you did read all the prior chapters, get ready to have some fun with Market Basket Analysis.
Market Basket Scope Statement
The Market Basket Scope Statement, shown in Figure 5.1, is the guiding question that will help an analyst stay focused on the pursuit of actionable information. The odd bits of data, information, conclusions, and conundrums discovered during Market Basket Analysis will tempt any analyst inherently curious enough to engage in Market Basket Analysis to veer away from the goal and ROI of Market Basket Analysis. So, rather than wander off in investigation of curious distractions, we start with the Market Basket Scope Statement.
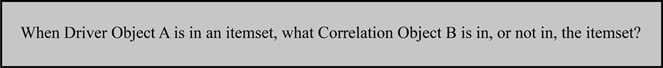
FIGURE 5.1
Market Basket Scope Statement.
This scope statement is intentionally simple. The simplicity of this scope statement will allow an analyst an extreme amount of latitude, only so long as an analyst is answering the question in the scope statement. But, whenever an analyst allows curiosity to divert the focus of the analysis from the scope statement to “I wonder...?” and “What if...?” questions, the analysis will lose its ability to deliver actionable information and its ROI.
The scope statement directly references the three elements of Market Basket Analysis. So, the first task is to define those three elements in the context of a single analysis. As you perform iterations of analysis to discover layers of patterns in the enterprise, you will begin by first defining the three elements in the context of that analysis. So, keep in mind that the definition of an Itemset at 9:00 a.m. may not be the definition of an Itemset at 3:00 p.m. As you cycle through iterations of analysis and layers of patterns, these definitions may change from one iteration to the next.
Definition of the Itemset
Your enterprise probably already has a transaction that is the lowest-level, most granular unit of business activity. If you’re not sure what that transaction would happen to be for your enterprise, you will probably find it at the point when money changes hands, either literally or as an agreement to pay money on credit or terms. For most businesses, the moment when money changes hands is the transaction that defines the business. Your enterprise might happen to cut wood, spread stain with a brush, drive nails with a hammer, and rotate screws with a screwdriver, but you can tell your enterprise sells furniture when someone buys your product with the intent to use your product as a dining room table. Having identified a transaction of your enterprise, the Itemset is defined as the agreement on which that transaction is based. For example:
In a restaurant, that unit of business activity is the meal documented on a check. A customer says, “Waiter, check please,” and the waiter hands the customer a check. That check is the lowest-level, most granular transaction in the enterprise. Let the checks be the Itemset.
In a retail store, that unit of business activity is the sales transaction documented on a receipt. The customer presents products for purchase. The cashier records the products in a cash register. Once all the products have been entered into the cash register, the cash register prints a receipt. The cashier presents the receipt to the customer, who then pays for the products listed on the receipt for the price listed on the receipt. That receipt is the lowest-level, most granular transaction in the enterprise. Let the receipts be the Itemset.
In a contract service company, that unit of work is the work order. A customer requests services to be performed. The contract service company and the customer negotiate the services and price, which are documented in a work order. That work order is the lowest-level, most granular transaction in the enterprise. Let the work orders be the Itemset.
It’s that simple. For your first attempt at Market Basket Analysis (or maybe your first attempt at this Market Basket Analysis solution design) there is no need to make it more complex than necessary. The lowest-level transaction in the enterprise has the advantages of being ubiquitously understood in the enterprise, well defined within the enterprise, and usually well documented. That being the case, the lowest-level transaction is the most intuitive Itemset and the most tangible Itemset, and therefore, the most obvious initial definition of an Itemset.
Alternatively, your enterprise might have numerous points of interaction with customers wherein your enterprise exchanges something for money. A single shop might, for a price, sell hard goods, which have a physical form that can be touched. That same shop might sell, for another price, a warranty on the hard goods. Again that shop might sell, for yet another price, service and maintenance on the hard goods it sells. All these moments wherein the enterprise exchanges money for something are the transactions of the enterprise. All those transactions can be defined as the Itemset; or, each kind of transaction can be its own Itemset definition separate from the others. If the options presented by your enterprise seem confusing, then opt for simplicity by choosing only one kind of transaction...at least for your first attempt at Market Basket Analysis. Later on, as you become more knowledgeable of the data of your enterprise and Market Basket Analysis, you will have a better understanding of the feasibility of combining types of transactions. Depending on your enterprise and the data of your enterprise, combining transactions may work wonderfully and provide amazing insights...or fail miserably. But, for the first analysis iteration, simple is best.
Definition of the Driver Object
Having defined an enterprise transaction as the Itemset, the next definition is the Driver Object. The Driver Object is the first half of the scope statement: “When Driver Object A is in an Itemset...” The Driver Object is the thing that is the focal point of the analysis. To be able to study the effects of various objects as they occur in an Itemset the analysis must be able to uniquely identify each and every one of those various objects as they occur in the Itemset. For example:
In a restaurant, the check presented to the customer is the Itemset. The Driver Object would then be a menu item listed on that check. All the menu items, therefore, must be uniquely and consistently identifiable. Omelets must always be identified as omelets, never as any other menu item, and no other menu item can be misidentified as an omelet. If that is true for all menu items, then the Driver Object can be defined as the menu items listed on the check that was presented to the customer.
In a retail store, the receipt presented to the customer is the Itemset. The Driver Object would then be the products listed on that receipt. All the products, therefore, must be uniquely and consistently identifiable. The 64-inch red wool blanket by Ashcroft Mills must always be identified as the 64-inch red wool blanket by Ashcroft Mills, and never confused with the 102-inch red wool blanket by Ashcroft Mills or the 64-inch red wool blanket by Wellington, or any other product offered by the enterprise. If that is true for all products offered by the enterprise, then the Driver Object can be identified as the products listed on the receipt that was presented to the customer.
In a contract service company, the work order is the Itemset. The Driver Object would then be the services and work listed on that work order. All the services therefore must be uniquely and consistently identifiable. The two-day audit must always be identifiable as the two-day audit, and never confused with the office consultation. If that is true for all the services offered by the enterprise, then the Driver Object can be identified as the services listed on the work order that was signed by the customer.
In each of these Itemsets, the Driver Object is a uniquely and consistently identifiable object within the enterprise.
Definition of the Correlation Object
The Correlation Object is in the same class of entity as the Driver Object and completes the scope statement “...what Correlation Object B is in, or not in, the Itemset?” The Correlation Object definition should mirror the Driver Object definition. If the Driver Object is the menu items in a restaurant, then the Correlation Object is also the menu items in a restaurant. Likewise, the Correlation Object can be the same products, services, and so on, that are defined to be the Driver Object. The reason is very simple. You’re going to use the Driver Object and Correlation Object interchangeably. For example:
When French silk pie is in an Itemset, what is the affinity for filet mignon?
When filet mignon is in an Itemset, what is the affinity for French silk pie?
When a dessert is in an Itemset, what is the affinity for a steak?
When a steak is in an Itemset, what is the affinity for a dessert?
Like the example in Chapter 1 of a flashlight, you’re trying to view the interactions within your enterprise from multiple vantage points. Each time you ask a question you are looking at your enterprise from the perspective of that question. The interchangeable Driver and Correlation Objects allow the analyst to consider each affinity from two vantage points:
Does Object A somehow lead to Object B? Object A is the Driver Object while Object B is the Correlation Object.
Does Object B somehow lead to Object A? Object B is the Driver Object while Object A is the Correlation Object.
Chapter 2 warned of the dangers of perceiving Market Basket Analysis as a study in the cause-and-effect relationship within the enterprise. The relevance of this warning is shown here in the definitions of the Driver and Correlation Objects. The relationship between a Driver Object and Correlation Object may have the look and feel of cause and effect. Regardless, you must continue telling yourself it is not a study in cause and effect. Ordering the filet mignon does not somehow cause you to order the French silk pie. The reverse of that is also not true. The cause may be something so mundane as they are listed on facing pages of the menu. If that’s the case, then the affinity between filet mignon and French silk pie may stop when a new version of the menu separates them by three pages. If that were to happen, Market Basket Reporting would show that something changed the affinity between filet mignon and French silk pie.
The definition of the Correlation Object, therefore, has already been achieved by the definition of the Driver Object. Because they are interchangeable, both are defined as the same object. The definition of the Driver and Correlation Objects, therefore, can be simplified to the definition of the Objects (both Driver and Correlation) in the Itemset. If you think of the two objects as one object definition, the two objects (Driver and Correlation) will truly be interchangeable.
Key Definitions
At this point the Itemset has been defined. The Driver Object and Correlation Object have been defined. Thus far, all these definitions have been business definitions within the source systems that hold these objects. To facilitate the analysis of the Itemsets and Objects they must have keys compatible with the Market Basket Analysis application. Chapter 6 will discuss the definition of keys in greater detail as that discussion includes the relational platform in which the analysis is performed. For the purpose of defining the Market Basket Solution, the definition of keys can be discussed here in a broad generic form.
Itemset Key Definition
The Itemset is the unit of work, the unit of business activity. To discuss what Objects are in, or not in, an Itemset the Itemset must have the identity properties that allow each Itemset to be uniquely and consistently identified such that each Itemset will always be distinct from, and never confused with, all other Itemsets. In other words, each Itemset must have a key unique to itself. The source system that is the system of record for the Itemset transactions may, or may not, have within itself a feasible key that can uniquely identify each and every Itemset. If that source system has a key that maintains the identity properties of the Itemset and performs well in the relational platform of the analysis, then that source system transaction key may be defined as the Itemset key. If the source system does not have a key that simultaneously maintains the identity properties of the Itemset and performs well in the relational platform of the analysis, then the ETL application (ETL will be discussed in Chapter 7) that presents data to the Market Basket Analysis application will generate a key that does maintain the identity properties of the Itemset and performs well in the relational platform of the analysis.
For the examples listed later in this chapter, the Itemset key will be defined as an integer data type. This should not be interpreted to mean that an Itemset key must be an integer data type. Instead, this use of integers simply means that integers make acceptable sample data.
Object Key Definition
The Driver Object and Correlation Object are interchangeable. Both objects should therefore share the same key structure. The Market Basket Analysis application receives its data from a data warehouse. Assuming the data warehouse already has a defined key structure for the objects in the Itemset, the Market Basket Analysis application should be able to leverage those keys already in the data warehouse.
If the data warehouse does not have a defined key structure for the objects in the Itemset, then the Market Basket Analysis application will not be able to identify occurrences of the individual objects in an Itemset. If that is the case, then the data warehouse is not able to support a Market Basket Analysis application. The entity definitions and key structures of the data warehouse must be remediated before the Market Basket Analysis application can leverage data from the data warehouse.
If the data warehouse does have a defined key structure for the objects, but that key structure does not perform well in a relational platform, then you may need to define a surrogate key structure that does perform well in a relational platform. While defining a key structure that does perform well in a relational platform, you might consider backfilling the new key structure you created for the Market Basket Analysis application back into the data warehouse. If that key structure did not perform well in the relational platform of the Market Basket Analysis application, it is probably not performing well in the relational platform of the data warehouse. Replacing a suboptimal key structure with an optimized key structure may singlehandedly improve the performance of the data warehouse. Then, you might consider backfilling optimized key structures throughout the data warehouse.
In general, the preferred method is to leverage the key structures of the data warehouse as the objects are used in the Market Basket Analysis application. There should be no reason to make this difficult. Let Product 0010 continue to be Product 0010, and let Service 1234 continue to be Service 1234. You’ve spent years learning these keys and key structures. Members of your staff probably speak in terms of key values, rather than ten-word descriptions, because the key values are so much more precise and semantically efficient. Bringing that data into a Market Basket Analysis application should not cause you to dispose of those keys and key structures. Let the object keys in the Market Basket Analysis application be what they are in the data warehouse, unless there is an overwhelming and compelling reason against the use of those object keys.
Attribute Definitions
The Itemset and Objects also have attributes. These attributes qualify and clarify the enterprise transaction represented by each row of Market Basket Analysis data. Those attributes, however, do not yet incorporate into the Market Basket Analysis data. The object definitions of the Itemset and Objects and the key definitions of the Itemset and Objects will be used specifically to build a narrow and lean Market Basket Table. The Market Basket Table must be narrow and lean because the Market Basket Analysis application will use the Market Basket Table to do the heavy lifting. The keys of the Itemset and Objects will later be used to incorporate the attributes. But, for the moment, the Market Basket Analysis application would be significantly suboptimized by including the attributes of the Itemset and Objects.
Itemset Metric Definitions
The Itemset is an enterprise transaction. An enterprise transaction includes metrics that measure the activity in that transaction. Typical transaction metrics include quantity (e.g., how many occurrences of an object occurred in the Itemset) and dollars (e.g., the dollar value of the objects in the Itemset). These metrics may mean the quantity and purchase price of the menu items listed on a restaurant check, or the quantity and sales price of the products listed on a sales receipt or work order.
These Market Basket Analysis metrics should be the same metrics used to measure activity in your enterprise. The feedback delivered by the Market Basket Analysis may be somewhat useless if the metrics incorporated in the Market Basket Analysis application are not the metrics used by, and understood by, those who already measure the activity of the enterprise. If, for example, the enterprise measures transaction activity in terms of sales quantity and sales dollars, then analysis of those same transactions should include the same sales quantity and sales dollars metrics. Otherwise, the data delivered by the Market Basket Analysis application will seem to be less actionable. To deliver the maximum possible ROI, the Market Basket Analysis should be able to report its findings and conclusions in terms of the metrics used, and understood by, the enterprise. To analyze and report using those metrics, they should be included in the data incorporated in the Market Basket Analysis application.
Market Basket Table
Now that the Market Basket objects, keys, and attributes have been defined, all the elements necessary to create the Market Basket Table are ready. The first column in the Market Basket Table is the Itemset_Key. The Itemset_Key uniquely identifies a single transaction. All rows directly associated with a transaction have the Itemset_Key value that uniquely identifies that transaction. If a transaction has one object (e.g., only one menu item, only one product, only one service), then only one row in the Market Basket Table will have the Itemset_Key value for that transaction. If, however, a transaction has two thousand objects, then two thousand rows in the Market Basket Table will have the same Itemset_Key value for that transaction.
The second column holds the Object_Key. The Object_Key uniquely identifies each individual object. If a single object (e.g., small french fries, chair, or 16 oz. can of beans) occurs in a single transaction three times, those three occurrences within a single transaction will be summarized to one row of data, marked by the Itemset_Key that uniquely identifies the transaction and the Object_Key that uniquely identifies the object. For every Itemset wherein that object occurs, in each Itemset that object will be identified by the same Object_Key value. So, the object small french fries is identified by the same Object_Key every time it occurs. Likewise, every object is identified by the same Object_Key every time it occurs.
The remaining columns hold the metric measurements of the transaction that is the Itemset. In Table 5.1, the metric measurement columns are Quantity and Dollars. These columns should be defined to fit the transaction of your enterprise. Your enterprise transaction may include a different set of transaction metrics. If so, then rather than Quantity and Dollars the Market Basket Table should include columns that reflect the transaction metric measurements of your enterprise transaction.
TABLE 5.1
Market Basket Table
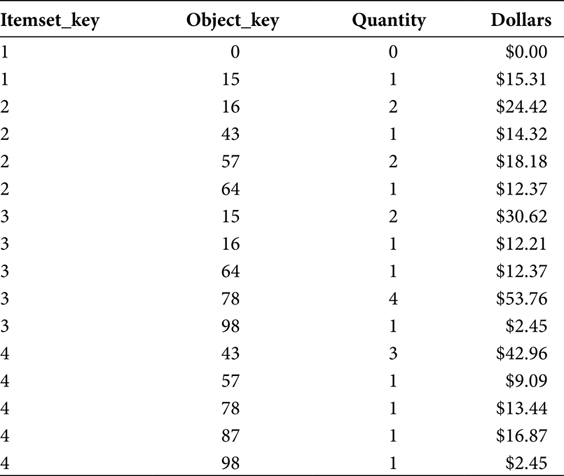
Chapter 6 will discuss the physical structure of the Market Basket Table. Chapter 7 will discuss the ETL application that will populate the Market Basket Table, including the curious-looking first row for Itemset_Key = 1 wherein all the other values are set to zero. Details of this row will be provided in Chapter 7. For the purposes of this discussion, we can assume the Market Basket Table has been created and populated.
Market Basket Query
Once a batch of Itemsets has been loaded into the Market Basket Table, the data is ready to be queried into a usable form. The SQL that will perform this query is in Figure 5.2. The indexing of the Market Basket Table, explained in Chapter 6, makes the Market Basket Query feasible. The batch cycles of the Market Basket Query, explained in Chapter 7, control the execution of the Market Basket Query. The Market Basket Query selects data from only the Market Basket Table in a recursive join that juxtaposes all the objects within a single Itemset.
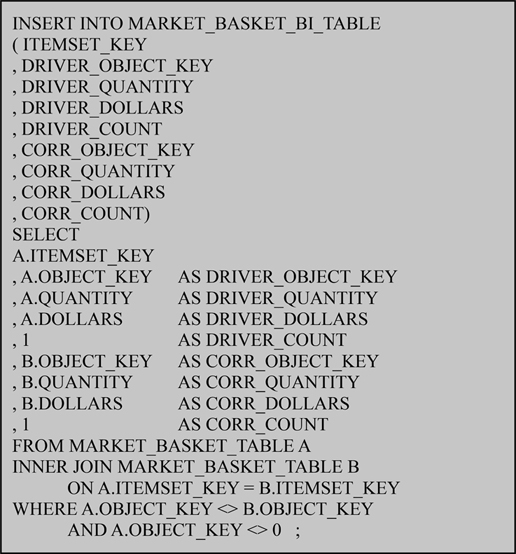
FIGURE 5.2
Market Basket Query.
The Market Basket Query provides all the elements of Market Basket Analysis—Itemset, Driver Object, and Correlation Object. The Market Basket Query is used to populate the table that will be used for analysis. The good news about that development is that the recursive Market Basket Query, which performs the heavy lifting in Market Basket Analysis, is performed only once for each Itemset and under controlled and optimized conditions. However, before we discuss the output from the Market Basket Query, we need to understand the underlying logic that provides the elements of Market Basket Analysis.
Itemset
The Itemset_Key value that was included in the Market Basket Table is preserved, as shown in Figure 5.3, without modification in the Market Basket Query.
The Itemset_Key is the linchpin around which all this Market Basket Solution Design revolves. The Itemset_Key must be identical for all rows representing a transaction. The Itemset_Key must be unique to each and every transaction such that each and every Itemset has its own unique Itemset_Key. If two transactions share the same Itemset_Key, they will be perceived to be the same transaction by the Market Basket Analysis. If rows within a single transaction do not have the same Itemset_Key, they will be perceived to belong to separate transactions by the Market Basket Analysis. So, the success or failure of the Market Basket Solution Design rests first on the integrity of the Itemset_Key.
Driver Object
The Driver Object is represented by the columns that begin with DRIVER_, as shown in Figure 5.4.

FIGURE 5.3
Itemset.
The DRIVER_OBJECT_KEY identifies the object that performs the function of a Driver Object. In the context of the Market Basket Scope Statement, the DRIVER_OBJECT_KEY refers to “When Driver Object A is in an Itemset.” An object can be both the Driver and Correlation Object. When an object is represented by the DRIVER_OBJECT_KEY, that object is the Driver Object.
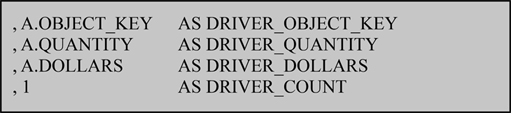
FIGURE 5.4
Driver Object.
The DRIVER_QUANTITY and DRIVER_DOLLARS are metric measurements for the transaction captured in the Itemset row. The metric measurements in Figure 5.2 and Figure 5.4 are representative examples. For any given Market Basket Analysis, the metric measurements could be any that are applicable to the transactions being studied. The metric measurements must be additive. They will be created by a summing operation. They will be used within a summing operation. If a required metric is not additive, such as a Yes/No or numeric, but nonadditive, code value, then that measurement should be presented as a count of the occurrences of the possible values of that metric. For example, a Yes/No metric would be represented by a count of the occurrences of Yes and a count of the occurrences of No.
The DRIVER_COUNT will be used to count the number of occurrences of the DRIVER_OBJECT_KEY. Rather than ask the Market Basket Query to sum and count records, the DRIVER_COUNT field provides the number 1 in each row, which allows the Market Basket Query to only sum the numeric, additive value of the DRIVER_COUNT, which is 1. By summing the DRIVER_COUNT, the Market Basket Query is counting occurrences of the DRIVER_OBJECT_KEY.
Correlation Object
The Correlation Object is represented by the columns that begin with CORR_, as shown in Figure 5.5.
The CORR_OBJECT_KEY identifies the object that performs the function of a Correlation Object. In the context of the Market Basket Scope Statement, the CORR_OBJECT_KEY refers to “what Correlation Object B is in, or not in, the Itemset?” An object can be both the Driver and Correlation Object. When an object is represented by the CORR_OBJECT_KEY, that object is the Correlation Object.
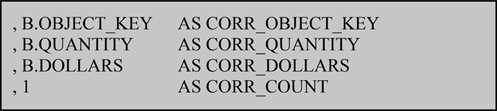
FIGURE 5.5
Correlation Object.
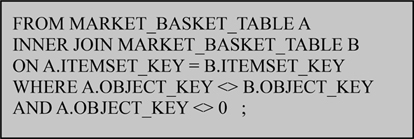
FIGURE 5.6
Recursive join.
The CORR_QUANTITY and CORR_DOLLARS metric measurements have the same purpose and properties as the DRIVER_QUANTITY and DRIVER_DOLLARS metric measurements. Within an Itemset the quantity and dollar values are the same when an object is the Driver Object and when that same object is the Correlation Object. The CORR_COUNT will be used to count the number of occurrences of the CORR_OBJECT_KEY.
Recursive Join
The Driver and Correlation Objects are juxtaposed by the recursive join, shown in Figure 5.6, which is where the real heavy lifting of the Market Basket Query occurs.
The Market Basket Table is referenced twice. This SQL method loads the Market Basket Table into memory twice. The aliases A and B allow the relational SQL engine to give each of the copies of the Market Basket Table an identity unique from each other. The first copy of the Market Basket Table is named A, and the second Market Basket Table is named B. Those two tables, because they are copies of the same Market Basket Table, are identical to each other.
The join clause “A.OBJECT_KEY <> B.OBJECT_KEY” prevents an Object_Key from being both Driver Object and Correlation Object. If an Object_Key were allowed to be both Driver Object and Correlation Object, that would present results that would be rather circular in logic: Object A is in an Itemset when Object A is in the Itemset. So, rather than allow the results of the Market Basket Analysis to be circular, the join clause “A.OBJECT_KEY <> B.OBJECT_KEY” prevents an Object_Key from being both Driver Object and Correlation Object.
Chapter 6 will explain how a database design will optimize the recursive join in Figure 5.6. Chapter 7 will explain the use of the recursive join in the flow of data through the Market Basket ETL. A common misperception of Market Basket Analysis is that this recursive join will be performed against the whole body of data every time a Market Basket Analysis query is executed. In this Market Basket Solution Definition, the recursive join is performed on an Itemset only once. The result set is stored in another table. Also, the recursive join is performed against only a subset of the data. Because the recursive join considers each Itemset only within the context of that Itemset, the recursive join is not enhanced by including many Itemsets. For a given Itemset, the result set is the same regardless of the number of Itemsets involved in a single iteration of the recursive join.
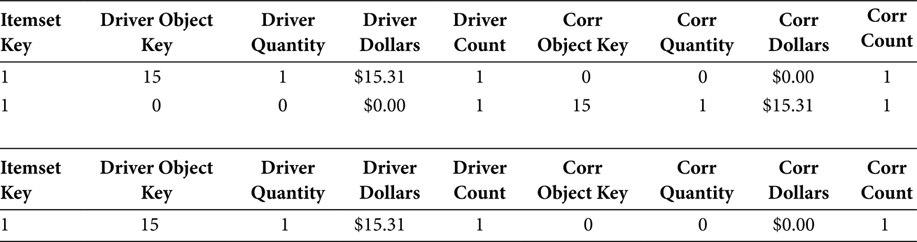
Single Object Itemset
The join clause “A.OBJECT_KEY <> 0” resolves the special case of an Itemset with only one object, shown in Table 5.2.
The Driver Object in Itemset 1 has no Correlation Object. This is a case wherein nothing is something. The analysis must be able to see when nothing occurred. Specifically, the analysis must be able to see when a Driver Object has no Correlation Object. This matching of something to nothing is achieved by creating a “nothing” object, which will be the Correlation Object when none exists. In this example, the key of the nothing object is zero. In the recursive join that juxtaposes all objects as both Driver and Correlation Objects, the nothing object can become a Driver Object. To let a nothing object be a Driver Object would, of course, be complete nonsense. To prevent the nonsense of a nothing Driver Object, the join clause “A.OBJECT_KEY <> 0” explicitly excludes all such nothing Driver Objects. The result is shown in Table 5.2. The two rows in the top of Table 5.2 include the row with a nothing Driver Object (i.e., Drive_Object_Key = 0) and the row with a nothing Correlation Object (i.e., Correlation_Object_Key = 0). By eliminating the row with a nothing Driver Object (i.e., Driver_Object_Key = 0), only the row with a nothing Correlation Object (i.e., Correlation_Object_Key = 0) is included in the result set from the Market Basket Query. That one row with a nothing Correlation Object (i.e., Correlation_Object_Key = 0) is shown in the bottom of Table 5.2.
TABLE 5.2
Single Object Itemsets
Market Basket Bi Table
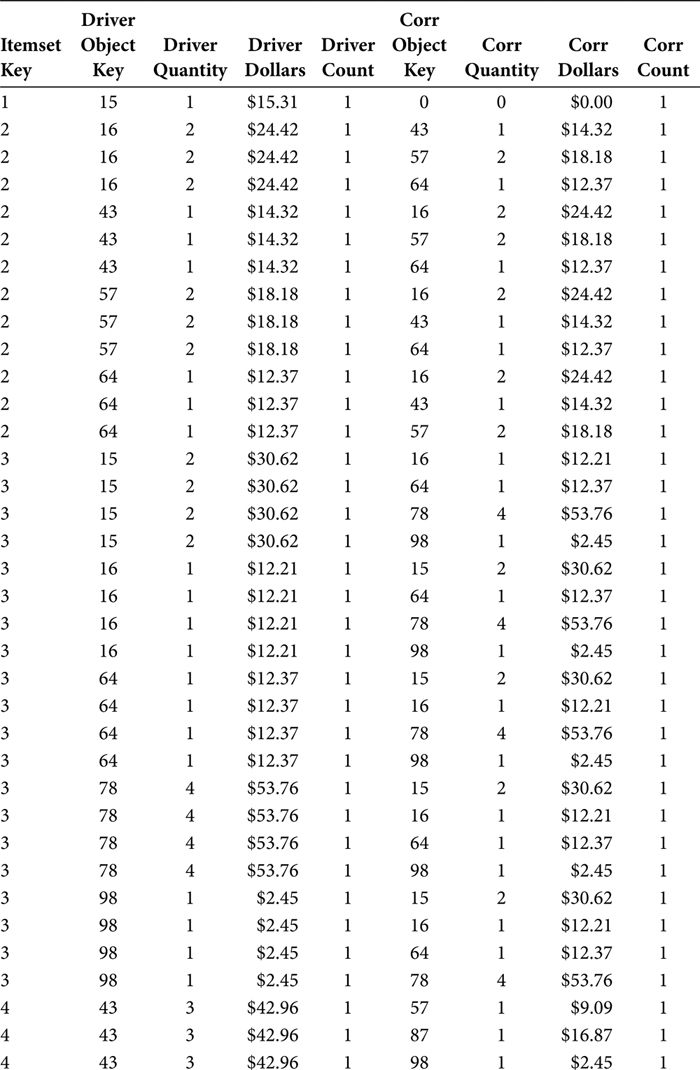
The Market Basket Query populates the Market Basket BI Table. Once the data is in the Market Basket BI Table, the data in the Market Basket Table is no longer needed. The recursive SQL is only used as an ETL application from the Market Basket Table to the Market Basket BI Table. This means the recursive SQL that converts the data from a vertical form (all objects in an Itemset vertically arranged in multiple rows) to a juxtaposed form (all objects in an Itemset arranged as Driver and Correlation Objects) need run only once for each Itemset. Chapter 7 provides details on the use of the Market Basket Query as a batch ETL application. For the purposes of the solution design, the Market Basket Query can be assumed to have populated the Market Basket BI Table. The data from Table 5.1, converted to a juxtaposed form, will look like the data in Table 5.3.
Once the Market Basket data is loaded into the Market Basket BI Table, the recursive nature of Market Basket Analysis has been realized into the juxtaposition of objects in an Itemset. Within a single Itemset, each object will occur as a Driver Object once for every other object in the Itemset as all the other objects take their turn as the Correlation Object; in addition, each object will occur as a Correlation Object once for every other object in the Itemset as all the other objects take their turn as the Driver Object. This is the juxtaposition of objects as Driver Object and Correlation Object. This juxtaposition also causes an explosion of data as each object within an Itemset occurs in 2*(n − 1) rows, where n equals the number of unique objects in an Itemset. An object will occur n − 1 times as the Driver Object, and n − 1 times as the Correlation Object.
An Itemset will never change. A transaction that has completed will never happen again. Another transaction may occur such that the second transaction is identical in every possible way to the first transaction. However, that second transaction is still the second transaction and not the first transaction. For that reason, once an Itemset has been added to a Market Basket BI Table, that Itemset will never change. So, that Itemset can remain in the Market Basket BI Table indefinitely. In that way, a Market Basket BI Table becomes a datamart with a very long life. The retention period, therefore, becomes a relevant requirement for a Market Basket Analysis application as the Market Basket BI Table grows and ages. The requirement would be specific to each individual Market Basket Analysis effort, but eventually the Itemsets in a Market Basket BI Table will lose their relevance.
TABLE 5.3
Market Basket BI Table
Market Basket Analysis BI View
The Market Basket Analysis BI View presents each Driver Object juxtaposed against each Correlation Object in a cumulative form. The Itemset_Key is not present because the result set of the Market Basket Analysis BI View considers the behaviors of Driver Objects and Correlation Objects across the Itemsets in the Market Basket BI Table.
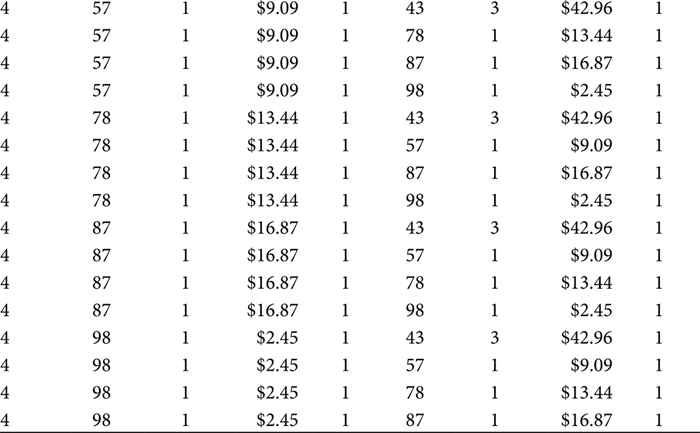
The SQL of the Market Basket BI View, shown in Figure 5.7, has three main sections. The three sections are marked by the horizontal lines in Figure 5.7.
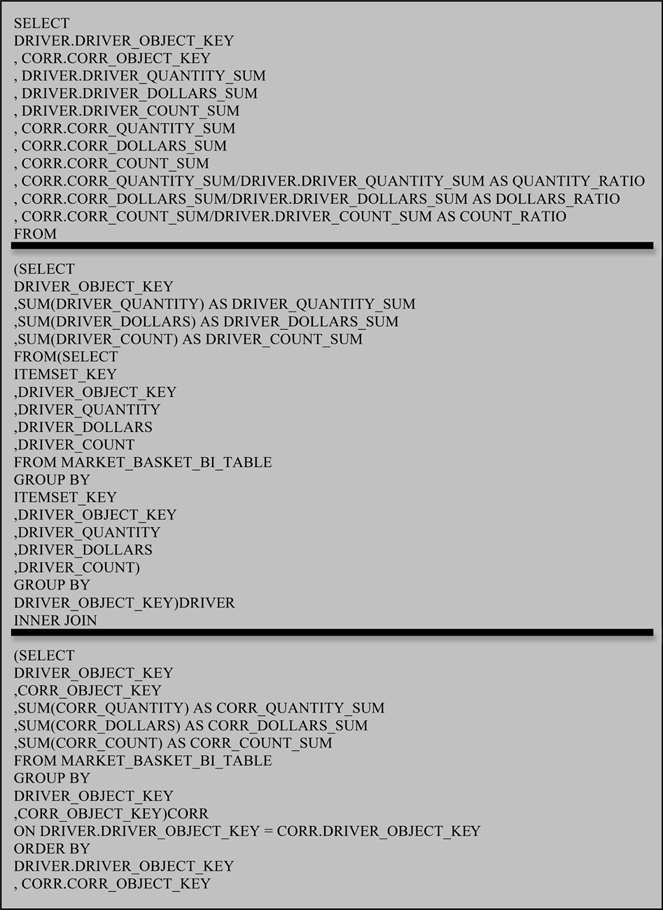
FIGURE 5.7
Market Basket Analysis BI View.
The first section of the Market Basket BI View presents the Market Basket Analysis keys and metrics. The keys should always be present in the Market Basket Analysis BI View. Without the keys, analysts using the view will not be able to know the objects presented by the view. The metrics, however, can be customized to suit the needs of a specific data warehouse. The metrics provided in Figure 5.7 are fairly representative of a common set of metrics. They can be modified to meet the source data available in a data warehouse, or requirements of a Market Basket Analysis application. The metrics of a Market Basket Analysis BI View will be either additive or relative in nature. The relative metrics are built using the additive metrics. When modifying the metrics of the Market Basket Analysis BI View, metrics must be handled according to their additive or relative properties. Otherwise, the results of the Market Basket Analysis will be incorrect.
The second section of the Market Basket BI View isolates the Driver Object and its metrics. The Market Basket Analysis BI View operates against the Market Basket BI Table, which is an exploded representation of each Itemset so that the Market Basket BI Table can juxtapose every occurrence of the Driver Object against every occurrence of the Correlation Object. To reverse the exploded representation of the Itemset, the Market Basket Analysis BI View retrieves the Driver Object in a sub-select that includes a GROUP BY clause. Because an individual object that can be the Driver Object can be the Driver Object in multiple Itemsets, the ITEMSET_KEY is included in that GROUP BY statement. The result is that the juxtaposed, and therefore repeated, statements of the Driver Object are reduced to one statement of the Driver Object, which allows the metrics of the Driver Object to represent only one iteration of the Driver Object in an Itemset rather than n − 1 iterations of the Driver Object.
The third section of the Market Basket Analysis BI View joins the Correlation Object to the Driver Object. This is where the Driver Object finally gets to drive. The join between the Driver Object and the Correlation Object in the third section of the Market Basket Analysis BI View places the Correlation Object into the context of the Driver Object. This also multiplies again the number of rows containing the Driver Object to n − 1 number of rows (where n = the total number of objects in an Itemset). However, this join occurs without the recursive join of the Market Basket Query in Figure 5.2.
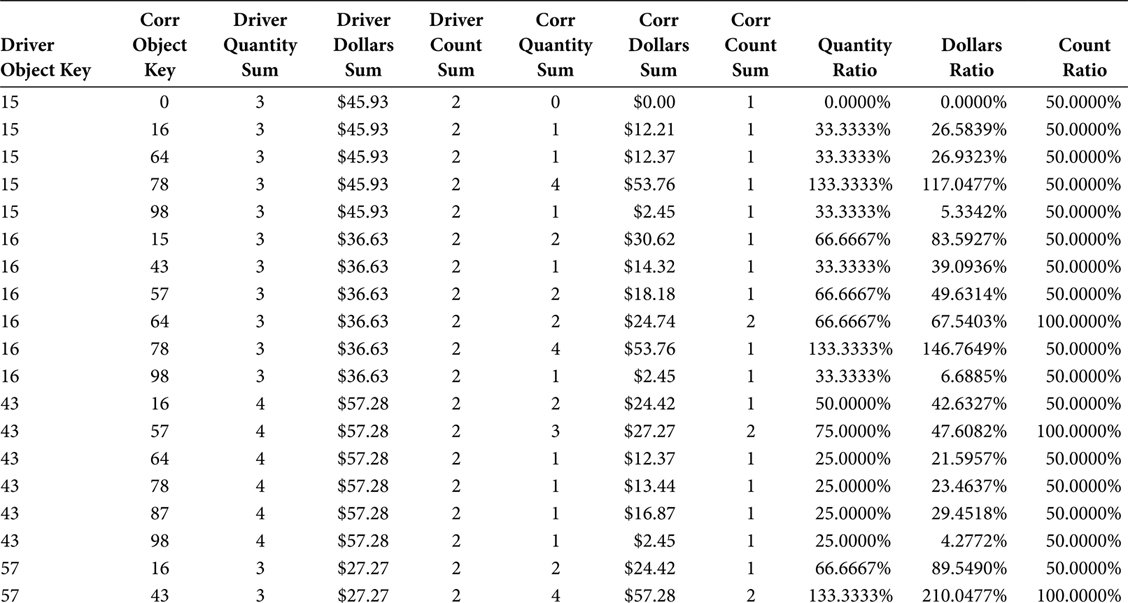
The result set of the Market Basket Analysis BI View using the sample data in this chapter is presented in Table 5.4.
TABLE 5.4
Driver Object and Correlation Object Result Set
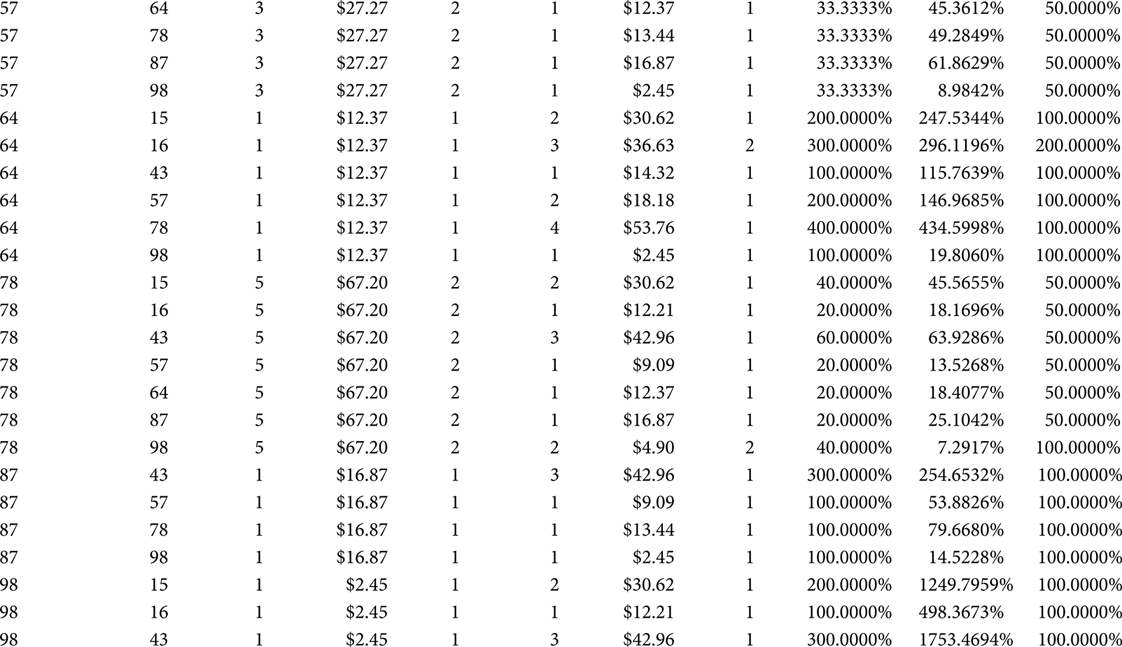

The Market Basket BI View metrics are general in nature, but specific to the SQL in Figure 5.7 and the result set in Table 5.4. These data definitions are intended to present the concepts of the Market Basket Analysis BI View that you might use in your Market Basket Analysis application. For any given Market Basket Analysis application, the keys and metrics will probably be slightly different from the keys and metrics defined below. The important aspect of these definitions is the understanding of their concepts, how they are created, and how they are used. Once those concepts and principles are understood, they can be applied to any other Market Basket Analysis application.
DRIVER_OBJECT_KEY
DRIVER_OBJECT_KEY in the Market Basket BI View performs the same function it performed in the preceding Market Basket Table and Market Basket BI Table. The context is still the first half of the Market Basket Scope Statement. The DRIVER_OBJECT_KEY identifies the Driver Object for each individual row. That Driver Object provides the context of each individual row, so that the keys and metrics in that row can be understood to answer the question of the Market Basket Scope Statement in Figure 5.1.
CORR_OBJECT_KEY
CORR_OBJECT_KEY in the Market Basket BI View performs the same function as performed in the preceding Market Basket Table and Market Basket BI Table. The context is still the second half of the Market Basket Scope Statement. The CORR_OBJECT_KEY identifies the Correlation Object for each individual row. That Correlation Object provides the answer, within the context of the Driver Object, to the question of the Market Basket Scope Statement in Figure 5.1.
DRIVER_QUANTITY_SUM
DRIVER_QUANTITY_SUM is an additive metric that presents the total number of Driver Objects in an Itemset. This value is calculated by summing the Quantity values from the Market Basket Table. The Market Basket Analysis BI View, however, operates against the Market Basket BI Table, which is an exploded representation of each Itemset so that the Market Basket BI Table can juxtapose every occurrence of the Driver Object against every occurrence of the Correlation Object. To reverse the exploded representation of the Itemset, the Market Basket Analysis BI View retrieves the Driver Object in a sub-select that includes a GROUP BY clause. As a result, the DRIVER_QUANTITY_SUM for a given Driver Object is the total number of the Driver Objects in the Itemset.
DRIVER_DOLLARS_SUM
DRIVER_DOLLARS_SUM is an additive metric that presents the total monetary value of the Driver Objects in an Itemset. This value is calculated by summing the Dollar values from the Market Basket Table. The Market Basket Analysis BI View, however, operates against the Market Basket BI Table, which is an exploded representation of each Itemset so that the Market Basket BI Table can juxtapose every occurrence of the Driver Object against every occurrence of the Correlation Object. To reverse the exploded representation of the Itemset, the Market Basket Analysis BI View retrieves the Driver Object in a sub-select that includes a GROUP BY clause. As a result, the DRIVER_DOLLARS_SUM for a given Driver Object is the total monetary measure of the Driver Objects in the Itemset.
For any given data warehouse, dollars may not be a relevant measure of the Itemset. Frequently a monetary measure of the Itemset is included. A Market Basket Analysis effort may or may not include such a monetary measurement in the form of dollars or any other monetary denomination.
DRIVER_COUNT_SUM
DRIVER_COUNT_SUM is an additive metric that counts the number of Itemsets represented by a row of data returned by the Market Basket Analysis BI View. The “1 AS DRIVER_COUNT” statement in the Market Basket Query allows the Market Basket Analysis BI View to count the number of Itemsets by summing the DRIVER_COUNT. DRIVER_COUNT is included in the sub-select GROUP BY that reduces the exploded juxtaposed Driver Object from n − 1 rows to just one row. Once reduced to just one row, the sum of the DRIVER_COUNT values is also a count of the Itemsets.
CORR_QUANTITY_SUM
CORR_QUANTITY_SUM is an additive metric that presents the total number of Correlation Objects in an Itemset. This value is calculated by summing the Quantity values from the Market Basket BI Table. That summing operation occurs for the GROUP BY key of DRIVER_OBJECT_KEY and CORR_OBJECT_KEY. That compound key causes the sum of quantity of Correlation Objects to be calculated within the context of the Driver Object. That is to say, the CORR_QUANTITY_SUM for a given Correlation Object is the total number of the Correlation Objects in an Itemset and in the context of a Driver Object.
CORR_DOLLARS_SUM
CORR_DOLLARS_SUM is an additive metric that presents the total monetary measurement of Correlation Objects in an Itemset. This value is calculated by summing the Dollar values from the Market Basket BI Table. That summing operation occurs for the GROUP BY key of DRIVER_OBJECT_KEY and CORR_OBJECT_KEY. That compound key causes the sum of dollars of Correlation Objects to be calculated within the context of the Driver Object. That is to say, the CORR_DOLLARS_SUM for a given Correlation Object is the total monetary measurement of the Correlation Objects in an Itemset and in the context of a Driver Object.
For any given data warehouse, dollars may not be a relevant measure of the Itemset. Frequently a monetary measure of the Itemset is included. A Market Basket Analysis effort may or may not include such a monetary measurement in the form of dollars or any other monetary denomination.
CORR_COUNT_SUM
CORR_COUNT_SUM is an additive metric that counts the number of Itemsets represented by a row of data returned by the Market Basket Analysis BI View. The “1 AS CORR_COUNT” statement in the Market Basket Query allows the Market Basket Analysis BI View to count the number of Itemsets by summing the CORR_COUNT. As a result, the sum of the CORR_COUNT values is also a count of the Itemsets.
QUANTITY_RATIO
QUANTITY_RATIO is a nonadditive relative metric measurement of the penetration of the CORR_QUANTITY_SUM value relative to the DRIVER_QUANTITY_SUM value. This provides an indication of the number of Correlation Objects that occurred in an Itemset within the context of a Driver Object.
Although QUANTITY_RATIO is nonadditive, it can be recalculated by applying the CORR_QUANTITY_SUM/DRIVER_QUANTITY_SUM calculation.
DOLLARS_RATIO
DOLLARS_RATIO is a nonadditive relative metric measurement of the penetration of the CORR_DOLLARS_SUM value relative to the DRIVER_DOLLARS_SUM value. This provides an indication of the monetary value of Correlation Objects that occurred in an Itemset within the context of a Driver Object.
Although DOLLARS_RATIO is nonadditive, it can be recalculated by applying the CORR_DOLLARS_SUM/DRIVER_DOLLARS_SUM calculation.
COUNT_RATIO
COUNT_RATIO is a nonadditive relative metric measurement of the penetration of the CORR_COUNT_SUM value relative to the DRIVER_COUNT_SUM value. This provides an indication of the occurrences of Correlation Objects that occurred in an Itemset within the context of a Driver Object.
Although COUNT_RATIO is nonadditive, it can be recalculated by applying the CORR_COUNT_SUM/DRIVER_COUNT_SUM calculation.
Additional Group by Data Elements
In the SQL and data definitions provided above, the Itemset is identified by the ITEMSET_KEY. Noticeably absent is any reference to normal operations of a data warehouse, such as date, time, location, operator, agent, and so on. These references can all be included in the Market Basket Analysis application. The ITEMSET_KEY as used in the data in Table 5.4 is without any such references. The ITEMSET_KEY can, however, include any such references.
By adding Date, Time, and Location (as an example) to the ITEMSET_KEY, which will cause the ITEMSET_KEY to be a compound key, the data in the Market Basket Analysis application can be stratified by Date, Time, and Location. The affinity between objects may be subject to numerous conditions. As mentioned earlier, the time of day, the day of the week, the location, and the Four P’s of Marketing may have an effect on the objects and affinities discovered in the Market Basket BI Table. To allow the Market Basket Analysis application to separate “weekday” Itemsets from “weekend” Itemsets, and “promoted” Itemsets from “non-promoted” Itemsets, these and other attributes of the Itemset can be added to the Market Basket BI Table.
These attributes are attributes of the Itemset, not attributes of the objects in the Itemset. Because they are attributes of the Itemset, they need only be represented once in the Market Basket BI Table, as they clarify the Itemset and not the objects in the Itemset. These Itemset attributes allow the analyst to query the affinity between objects in the morning, the affinity between the objects in the evening, and the affinity between objects in Florida versus Georgia versus Alabama.
The Itemset attributes allow an analyst to stratify the Itemsets via the attributes that answer the who, when, where, and how questions. The what question has already been answered, as it is the objects in the Market Basket Table and the Market Basket BI Table. Itemset attributes do not within themselves contribute to the affinity between two objects. Instead, Itemset attributes are used to isolate groups of Itemsets to expose the pattern within that group of Itemsets. For example, by isolating the weekday morning data from the weekend data, the patterns within the weekday morning data are more visible as they are not obscured by the patterns of the weekend data. In that way, Itemset attributes allow the Market Basket Analysis BI View to isolate a group of Itemsets, and therefore the pattern in that group of Itemsets.
Beyond the Market Basket Analysis Bi View
A Market Basket Analysis application could deliver the application as described and be deemed a success with a positive ROI. The Market Basket Analysis team could congratulate each other on their achievement and look forward to future analysis and future actionable information. But, for those willing to go the extra mile, willing to do the extra-credit homework, a Market Basket Analysis application can be expanded in at least two ways—Object Groups and Market Basket Reporting.
Object Groups
An enterprise may have a few groupings of objects such that even though the objects are individual and separate from each other, the group of those objects is perceived as a cohesive unit in the mind of the enterprise. In the context of an automotive repair shop, that group may be the combination of lubrication and oil, which in that industry is referred to as “lube and oil.” If you took your car to an automotive repair shop and asked them to lube your car but not change the oil, they would wonder why someone would make such a strange request. The reverse is also true that a request to change the oil but not lubricate the car would be considered strange. So, while a “lube and oil” is made of lubricant that is not oil, and oil that is not lubricant, they are spoken in one breath and perceived to always occur in tandem.
For an enterprise with such a grouping of objects as “lube and oil,” that group of objects can be incorporated as a single object. When analyzing the affinity between objects in the transactions of the enterprise, it is simultaneously redundant and confusing to include two objects that move in tandem only because they move in tandem. Instead, let them be one object. This will remove the redundancy and the 100% affinity, which could only serve to skew the affinity between the group of objects and other objects not in that group.
Market Basket Reporting in Batch
Finally, going all the way back to the example in Chapter 1 of the chair in the corner, the Market Basket BI SQL can be scheduled in batch to monitor the affinity between objects within the enterprise. During the analysis phase of the Market Basket Analysis application, you should expect to have found some object affinities that indicate the health of the enterprise. These would be Key Performance Indicators (KPIs). If you know that as long as Object A and Object B continue to have an affinity of approximately 75%, which indicates the enterprise is performing well, then you would want to monitor the affinity between Object A and Object B on a frequent and recurring basis. You would also want to automate that monitoring process so that it occurs even when you get busy and forget to run the query. You would then want that automated monitoring process to post an alert when the affinity between Object A and Object B falls below a threshold value, and possibly if that affinity rises above another threshold value. In that way, the Market Basket Analysis application can deliver a mechanism for monitoring the health of the enterprise by way of monitoring the interrelationships of the objects within the enterprise.
This is Market Basket Reporting via a batch schedule. The KPIs included in the Market Basket Reporting process should only be those KPIs that will require action when they send an alert. In other words, you don’t want to monitor KPIs without an associated action. The goal of Market Basket Analysis is ROI via actionable information. Market Basket Reporting KPIs with an associated action are a clear and well-defined delivery of actionable information and, therefore, ROI.