
Chapter 20. Reporting
For the business application developer, reports are a fact of life. You may want to spend your time developing cool user interfaces or figuring out the core algorithms used in Generally Accepted Accounting Principles. But instead, you invest many boring hours each week turning out report after report. And these reports take a significant toll on the programming community. In America alone, the Centers for Disease Control and Prevention estimates nearly 850 report-related deaths each year—and that’s doesn’t even count those who read the reports. I once had a customer who printed off 20 copies of a 600-page report every month for his top-level managers. Clearly stupefied by the amount of tree pulp just to generate this report, the staff was unable to come up with a more interesting name than “the monthly report.”
So if you are a business programmer, reports are in your future. But while your forebears had to deal with languages like RPG III, you get to use .NET. Hey, reports won’t be so bad after all. And even without resorting to third-party reporting tools, Visual Studio and .NET include several report-focused features and tools you can use right out of the box.
This chapter discusses some of those reporting resources, and delves a little deeper into the reporting controls used in the Library Project.
Report Options in .NET
Reporting involves displaying and printing basic or summarized data to the user for specific business purposes. Visual Basic 2005 Professional Edition includes five primary methods of accomplishing this goal. Other editions add to or reduce this set of choices, and you can always enhance this list using third-party tools.
PrintDocument-Based Printing
As we learned in the previous chapter, the .NET Framework includes a full object-based printing system that uses GDI+ commands to draw text and graphics on each printed page. Because you can put anything you want on each page, you could develop your own custom reports using this method. The responsibility for positioning each label and calculated field on the page, and determining when to move to a new page, will rest entirely on your shoulders. Still, the GDI+ commands are straightforward, and developing some basic reports using this method would not be overwhelming.
If you want to take this route for your reports, I refer you back to Chapter 19, “Printing,” and the basic printing concepts presented in that chapter.
HTML/Web Pages
Besides being a significant timewaster, the Internet (and its HTML-based page description language) is a great medium for data-report communication. The table-formatting tags in HTML (such as <td>) let you organize tabular output without much effort. Sure, it’s a chore stringing all of those baby-sized text strings together to build the page, but there are ways around that, too.
Back in Chapter 13, “XML,” I discussed XSLT (XSL Transformations), a way to take XML-based data, and reshape it into any form you want—including great works of art by Michelangelo, or nicely crafted HTML. However you obtain the HTML, you have a choice of display methods as well. The most direct method involves storing the generated HTML in a disk file, and starting the user’s default browser to display it using a command such as:
Process.Start("c: empMyReport.htm")
If you want the report to have a more “integrated” look in your application, you can display the HTML content in a web browser control. We did this in the project code for Chapter 16, “Generics,” when we displayed the details of a library item as HTML.
Reporting Services and Controls
Visual Studio includes a set of classes in the Microsoft.Reporting namespace that are specifically designed to report data. The key class in this namespace is the ReportViewer control/class. Actually, it’s two controls: one for Windows Forms, and one for Web Forms. These controls are based, in part, on the technology found in Microsoft SQL Server Reporting Services, although you can use the controls without SQL Server.
The Library Project will use the WinForms.ReportViewer control for its built-in reports. We’ll spend most of this chapter discussing the control and its use in Windows Forms applications. (I won’t be discussing the Web Forms version of the control here, although its use closely parallels that of the Windows Forms version.)
Crystal Reports
If you have at least the Professional Edition of Visual Studio 2005, you received a complementary copy of Crystal Reports. The included version is a functional subset of Crystal Reports version XI, Developer Edition. If you are new to Visual Basic, then you have missed out on the previous versions of Crystal Reports that have been included with the language since its earliest releases. Because of this long-time relationship with Visual Basic, Crystal Reports has become one of the most widely used reporting packages on the market.
Crystal Reports is a third-party product, currently owned by a company called Business Objects. The product has changed ownership hands several times over the past 15 years, but Business Objects seems to be taking care of it for now. (I won’t be discussing Crystal Reports in this book.)
Integration with Microsoft Office
Visual Basic has been the primary macro language of the Microsoft Office suite of applications since the untimely death of WordBasic. But I’m talking about pre-.NET Visual Basic; Microsoft Office does not yet include direct support for .NET integration. But that doesn’t mean you can’t interact with the Office products indirectly. How you interact with Office depends on whether the Office document or the Visual Basic application is the primary focus for the user.
If the goal is to have the user open an Office document (such as a Word or Excel file) and have that document interact with managed code, use the new Visual Studio Tools for the Microsoft Office System (abbreviated as VSTO, or “visto”). VSTO installs a small component that shuttles data and events between your Visual Basic code and the unmanaged COM world of Office. Visual Studio includes templates for building VSTO projects right in the development environment.
If the user will access Office features only indirectly through your Visual Basic application (for instance, if you want your program to initiate a Microsoft Word mail merge), use the Microsoft Office Primary Interop Assemblies (PIA) supplied by Microsoft. Like VSTO, these libraries marshal data between your managed code and the unmanaged Office COM libraries, but with the focus on your code instead of the Office document.
I won’t be talking about Microsoft Office integration in this book. Use the Visual Studio MSDN documentation, and look in the index for “Visual Studio Tools for Office” if you need additional development information on these resources.
Using Reporting Controls in .NET
Let’s spend the remainder of this chapter discussing the standard reporting tools provided in Visual Studio. As mentioned earlier, there are two ReportViewer classes included in Visual Studio: one for desktop development and one for web development. I’ll only be talking about the desktop variation in this chapter. The designer used to develop these reports does not differentiate between the report target (desktop or browser). There are some differences in deployment, but I’ll have to leave the web deployment to a future best-selling programming book, or to your own research.
The ReportViewer control integrates directly with Microsoft SQL Server Reporting Services, displaying whole pages generated by that server-based system. Because we’re assuming that you are using SQL Server Express for your development (which does not include Reporting Services), I’ll focus instead on the control’s “local” mode presentation. This lets you display any data from any source you choose on each report display page, including SQL Server.
And Now, the Bad News
The ReportViewer control is not the easiest control in the world to use, but it’s even harder to use when it doesn’t even come with your copy of Visual Studio. If you are using Visual Basic 2005 Express Edition, you will not find the ReportViewer in your toolbox. Microsoft does make it available as a separate download (look in the download area of http://msdn.microsoft.com, the MSDN web site, for “Microsoft Report Viewer Redistributable 2005”), but that will only get you halfway. I’ll be discussing a visual reporting designer later that is also not in the Express Edition. Although you can still manually create the XML content that is normally generated by the visual designer, that’s no fun at all.
If you are using the Express Edition, you can still use the project code in this book. You just won’t be able to visually design new reports. But you can run the prewritten reports that I already included, because they are just XML content.
If, after all of that, you are still an Express Edition user, please download and install the Microsoft Report Viewer Redistributable 2005 file from Microsoft’s web site.
In the vein of “those who can, do; those who can’t, teach,” let me walk you through the steps needed to visually design a simple report using the ReportViewer class. We’ll create a report that lists the records in the Library Project’s Activity table, a table that will have data in it even if you haven’t used the Library program yet. This works best if you follow along in front of your computer, because reading about report design is a lot like reading about brain surgery: It’s more interesting if you actually do it. Start by creating a new Windows Forms application.
Add the Data Source
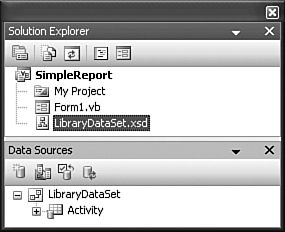
Add a data source to the project that refers to the Activity database table. We already did this back in Chapter 10, “ADO.NET,” in the “Creating a Data Source” section. Select the Data ![]() Add New Data Source menu command, and use the Data Source Configuration Wizard to locate your Library database. When you reach the list of database objects, check the box next to the Activity table, and click the Finish button. You should now have a data source named LibraryDataSet. Figure 20-1 shows the elements added to the Solution Explorer and the Data Sources panel by this action.
Add New Data Source menu command, and use the Data Source Configuration Wizard to locate your Library database. When you reach the list of database objects, check the box next to the Activity table, and click the Finish button. You should now have a data source named LibraryDataSet. Figure 20-1 shows the elements added to the Solution Explorer and the Data Sources panel by this action.
Figure 20-1. The LibraryDataSet as a data source, and as an XML “.xsd” file
Add a Report Design Surface
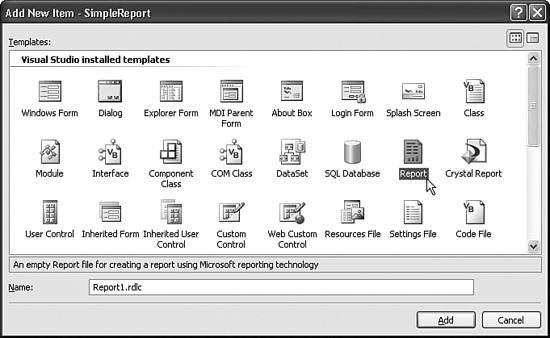
Use the Project ![]() Add New Item menu command to add a new Report item. Figure 20-2 shows the item report in the Add New Item dialog. Make sure that you choose “Report” and not “Crystal Report” from the list.
Add New Item menu command to add a new Report item. Figure 20-2 shows the item report in the Add New Item dialog. Make sure that you choose “Report” and not “Crystal Report” from the list.
Figure 20-2. Adding a new report to the project
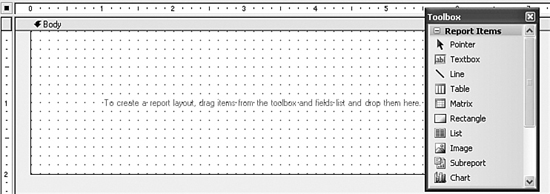
Click the Add button to insert the report into the project. A new Report1.rdlc file appears in your project, and its designer opens automatically. “RDLC” is short for “Report Definition Language - Client,” and files of this type contain XML content that describes the layout of a locally designed report. Figure 20-3 shows the designer for the added Report1.rdlc file, plus the controls in the toolbar that you can add to the report surface. I will refer to reports created through this designer as “RDLC reports” throughout the rest of this chapter.
Figure 20-3. The report designer and related toolbar
Design the Report Surface
If you’ve written reports in Microsoft Access or in some other common reporting tool, then you are probably familiar with “banded” reports. These reports have separate “bands,” or stripes, that represent a portion of the printed page. Bands include page headers and footers, report headers and footers, the record detail section, and group headers and footers used to visually and logically group the detail entries. As the report runs, an imaginary horizontal page-wide line runs from the top to the bottom of the page. As the line hits each band, the report processes the fields in that band until there are no more records to process.
RDLC reports are a little bit different from those banded reports. There are only three bands: page header, page footer, and everything else (a band called “Body”). Instead of adding bands for records and groups, you add fields to data regions. These special controls process the records linked to the report according to the shape of the data region. There are four data region controls in the toolbox.
- Table. This region presents an unlimited number of data rows, but with a predefined set of data columns. It’s designed for tabular presentation of data records, with each column generally displaying a single source or calculated data field. Each row of the table represents a source data record.
- Matrix. This control is similar to the Table region, but it allows for a flexible number of data columns, not just rows.
- List. The List region provides a free-form display section for each incoming record. You can add any number of fields or display controls to the record section.
- Chart. Charts use the collected data of the report to present line, bar, and pie charts to the user.
Records from data sets are always tied to a data region. If your report includes data from multiple distinct data sources, each data source will link to exactly one report region, and all regions appear in the Body band. We’ll use a List data region for this sample report. Go ahead and add the List control to the Body band on the report surface. You can now add other items to either the band surface itself, or to the List control surface. Items added to the List control are reprocessed for each record in the incoming data source. These items can be either controls from the Toolbox, or database fields displayed in the Data Sources panel. Using the Activity table in the Data Sources panel, drag the FullName field to the List control surface. Figure 20-4 shows the display just after performing this drag operation.
Figure 20-4. A List control with a field from the data set
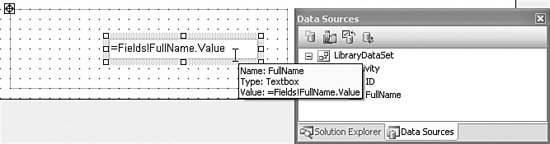
When we dragged the field from the data source to the List control, Visual Studio established a link between them. The list1 control’s DataSetName field now refers to “LibraryDataSet_Activity,” the name of the data source. It also added a TextBox control to the list’s surface, and added an expression (=Fields!FullName.Value) that displays the contents of that field from the database for each processed record.
I’m going to resize the List control, the text box, and the Body band itself so that the FullName text box field is pretty much all there is in the report (see Figure 20-5).
Figure 20-5. A resized version of the report
![]()
The report is ready to use. As we designed the report surface, Visual Studio was busy generating XML and storing it in the Report1.rdlc file.
Using a Report Control
The RDLC file is only an XML definition of a report; it doesn’t have any ability to display itself. To view the report, we must add a report control to a form or web page that knows how to properly merge the XML design content with the data from the specified data source. Return to Form1, and add a ReportViewer control to its surface from the Toolbox (it’s in the Data section of the Toolbox on my system).
The added control includes a small “smart tags” button in its upper-right corner. Clicking this button displays the ReportViewer Tasks fly-out window, which appears in Figure 20-6.
Figure 20-6. The ReportViewer control on the form surface
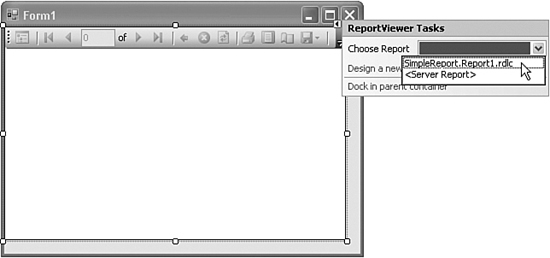
The ReportViewer control presents a form-based experience for displaying reports. Most of the control is a blank area where the report appears. It also includes a toolbar used to navigate through the pages of the report. The user can also initiate an export or a print-out of the report through these controls. If you don’t need the toolbar or one of its controls, use the various Show...properties of the ReportViewer control to hide the unneeded elements.
The report viewer is generic and report-independent. If you have several RDLC files in your project, you can display any of them (one at a time) through the same report viewer. We have only one report in our project, so let’s connect it (SimpleReport.Report1.rdlc) to the viewer by using the Choose Report task from the report viewer’s smart tag button. Also, click on the Dock in parent container task in the fly-out window to expand the report to the form’s size.
The RDLC report, the data from the data source, and the ReportViewer control are all joined in one glorious report display by the magic of data binding. When you linked the report to the viewer control, three more controls appeared on the form: LibraryDataSet, ActivityBindingSource, and ActivityTableAdapter. LibraryDataSet is a reference to the actual data source we added earlier. The other two controls wrap up that data in a form that can be bound to the report viewer. Although you can’t see it in the designer, the hidden form code connects these controls and the XML report to the viewer.
Yeah, I don’t really get it either. But that’s okay. Visual Studio connected it all up for us.
Run the Report
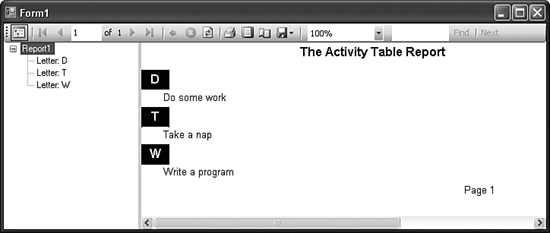
Press F5 and see the results of your efforts. In Figure 20-7, I adjusted the view by clicking on the Page Layout button, and setting the size to 100%.
Figure 20-7. Reporting the essential contents of the Activity table
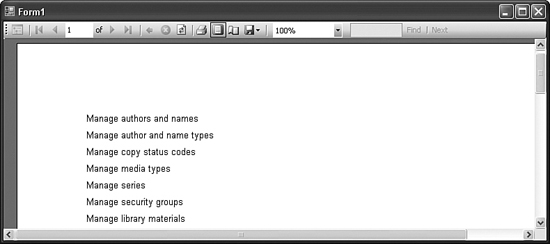
Well, that report is fine as far as Activity table reports go, but we could spruce it up a bit more.
Adding a Page Header and Footer
I think the report needs a meaningful title at the top of each page, plus a page number in the bottom-right corner. Let’s return to the RDLC report designer and add them. Once there, right-click on the background of the report (not the body, which has the grid marks on it), as shown in Figure 20-8.
Figure 20-8. Adding page headers and footers
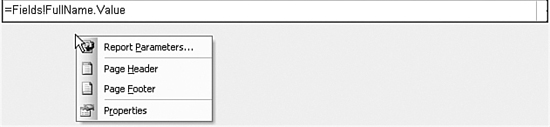
From this menu, select Page Header; then bring up the menu again and select Page Footer. Each new band appears on the report surface.
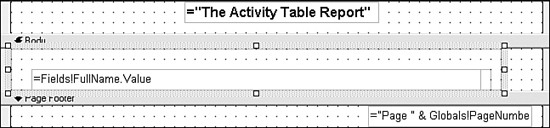
Whether it’s static, unchanging text, or text that’s dynamically generated from the data source, the TextBox control is the control of choice for showing text content. Add a TextBox control from the Toolbox to both the header and footer sections. Click inside the header’s text box, and type the following:
="The Activity Table Report"
You can use the Properties panel to adjust the look of this control, including its display font.
In the footer text box, add this text:
="Page " & Globals!PageNumber
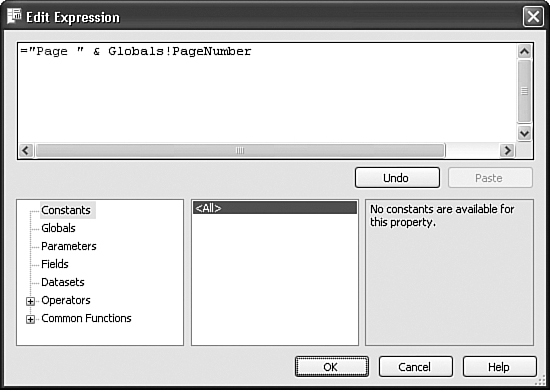
The Globals pseudo-object includes a few members that you can use in the report. How did I know to use Globals!PageNumber? I built the expression visually using the Expression Editor. To access it, right-click on the TextBox control, and select Expression from the shortcut menu. The editor, shown in Figure 20-9, lets you build up an expression using lists of functions and field names. The actual functions just happen to be—hooray—Visual Basic functions.
Figure 20-9. The Expression Editor
Support for Grouping and Sorting
Grouping of data is common in printed reports. To add grouping to our report, we need to embed our existing List control (the detail record) within another List control (the group), and set various properties on the group List control to determine the method of data grouping.
Let’s try it. Add another List control (called list2) to the report body, and give it twice the height as the existing List control (called list1). Then, drag list1 (the detail record) into list2 (the new group), placing it toward the bottom. Your report should look like Figure 20-10.
Figure 20-10. A grouping list added to the report
To configure the group, right-click on it and select Properties from the shortcut menu. The List Properties form appears. On its General tab, click the Edit details group button, which sets the grouping. On the Grouping and Sorting Properties form that appears, enter the following text into the first row of the Group on field.
=Left(Fields!FullName.Value, 1)
This expression tells the list2 control to group its detail results by the first character of the first name field.
On this same form, add the following text to the Document map label field.
="Letter: " & Left(Fields!FullName.Value, 1)
The document map enables a clickable hyperlink list into the different groups of the report. When we run the report a little later, we’ll see this map just to the left of the report display surface.
The records in the Activity table are ordered for the convenience of the programmer (me). But the report user probably wants to see them sorted in some reasonable fashion. Click on the Sorting tab, and add the following text to the Sort on field, in the Expression column.
=Fields!FullName.Value
As expected, this will sort the data by the FullName field. Click the OK buttons all the way out, and return to the report surface.
We still need to add something that will make each group stand out. Add a TextBox control to the list2 grouping control. Put it in the upper-left corner of that parent control, and type the following text into it (or into its Value property).
=Left(Fields!FullName.Value, 1)
I also set its BackgroundColor property to “Black,” its Color property to “White,” and its Font property to “Normal, Arial, 12pt, Bold” just for looks.
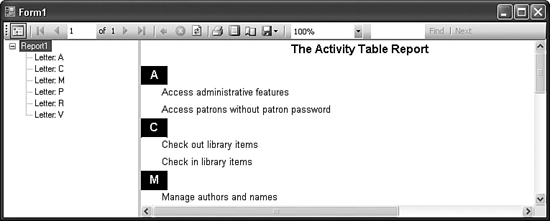
Running the report gives the results in Figure 20-11. Notice the document map along the left-edge of the window, and the grouped single-letter titles before each grouped section.
Figure 20-11. The full report, with grouping and sorting enabled
Enhanced Style Formatting
Probably the coolest feature of RDLC reports is that many of the properties for items placed on the report surface can include conditional expressions. This means that you can conditionally alter, say, the visual properties of a TextBox control based on the value of a field in the current record.
In the project section of this chapter, we’ll write a report that uses due dates for items currently checked out. If the item is past due, I want to show the due date in red. Normally, a TextBox control’s Color property (which controls font color) is “Black.” To have that field respond to overdue items, I will replace “Black” with the following expression.
=IIf(Fields!DueDate.Value < Today, "Red", "Black")
Using Custom Data
Although it is very common to generate reports from databases, you can actually use data from virtually any source. When using the ReportViewer control, any data source that implements the IEnumerable interface is good enough. That includes all collections and arrays. The report isn’t that picky, as long as the data is formatted as it expects. For the report we just made, we can ditch the actual data, and supply our own fake data. This intercepting and substituting data is like something out of a spy thriller. But there are a few rules we must follow to make it work.
- When we dragged the Activity.FullName field from the data source to the report surface, the report (actually, the list1 control) got this funny idea that all data had to come from a data source named “LibraryDataSet_Activity.” Any data source we use in place of the real one must keep this name.
- The fake data source must include the FullName field, because that is what the report fields expect.
Those rules aren’t so bad. So here’s what we need to do: Create a fake data source, intercept the report just before it tries to get the data from the Library database, and insert our own data instead.
For a fake data source, we’ll need a class that includes at least the FullName field.

The exposed fields must be properties, and not just public fields; the report viewer doesn’t recognize standard member fields.
If you look at the source code for Form1, you’ll find that the following code was added to the Form_Load event handler when we linked the report viewer with the RDLC report.
Me.ActivityTableAdapter.Fill(Me.LibraryDataSet.Activity)
Me.ReportViewer1.RefreshReport()
It’s that first line that loads the data from the Library database’s Activity table and links it to the report. We need to replace that line with code that cuts off the real data at the pass.
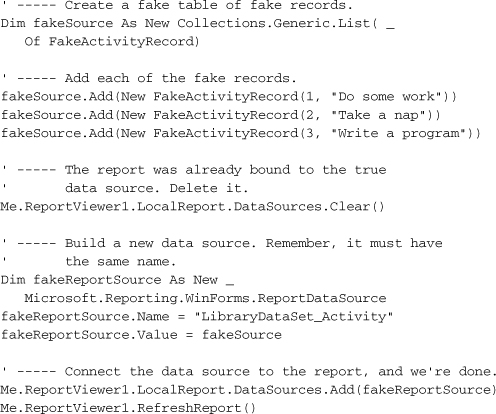
Figure 20-12 shows the report with the fake data on display.
Figure 20-12. This fake data will not self-destruct in five seconds
Supplying Custom Data Sources
Substituting data at the last second is fine and all, but what if you want to design a report that doesn’t depend on a database at all? You can do that, too, by supplying a fully custom data source. RDLC reports require some sort of data source schema at design time; you just can’t supply fully custom data on the fly when running the report. But you can supply a custom schema based on a class in your application.
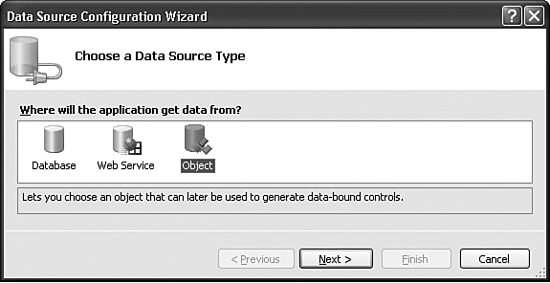
For the class, we’ll stick with the FakeActivityRecord we created in the previous section. Then we will design a data source from this class. Select the Data ![]() Add New Data Source menu command. When the Data Source Configuration Wizard has appeared in the past, you have always selected Database as the source for the data. This time, select Object, as shown in Figure 20-13.
Add New Data Source menu command. When the Data Source Configuration Wizard has appeared in the past, you have always selected Database as the source for the data. This time, select Object, as shown in Figure 20-13.
Figure 20-13. Creating a data source based on a custom object
When you click the Next button, a hierarchy of all the classes in your application appears. Expand the classes, and then locate and select the FakeActivityRecord class. Click the Finish button. FakeActivityRecord now appears as a data source in the Data Sources panel.
Now you can drag-and-drop this data source’s FullName field onto a new RDLC report design surface. Add a new report to your project, and follow the same steps we used previously to design the first report. This time, use the FakeActivityRecord data source instead of the LibraryDataSet source.
To test this new report, I removed the original Form1 from the project and added a brand new Form1. I also added a ReportViewer control to its surface and docked it, but I did not link it to the RDLC report. This keeps things a lot cleaner, as there are no binding source controls and whatnot to worry about. Then I added this code to the form’s Load event handler.
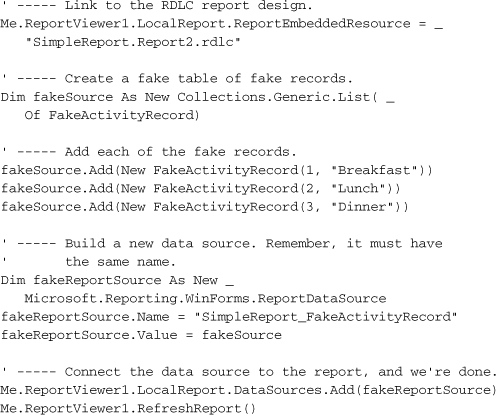
It’s pretty similar to the previous custom code, although the data source name is now “SimpleReport_FakeActivityRecord,” the name this new report expects (which I found out by running the report and reading the error message).
I’ve saved a copy of both custom reports in the installation directory for the book’s source code samples. Look in the subdirectory named SimpleReport.
Summary
Although this chapter included many pretty pictures and a lot of instructions, we scratched only the surface of the features available in the reporting controls included with .NET. I think I bruised my brain when I tried to study up on every available feature, but perhaps your brain is better prepared for the task. Still, if you don’t find it exactly to your liking, you can use one of the other reporting features I listed at the start of the chapter, or even opt for a third-party solution.
Reports are an important part of the business developer’s daily life. Finding the right reporting tool and getting comfortable with its features is not only a good suggestion, it’s a necessity in the world of report-hungry software users.
Project
When we last left the Technical Resource Kit document for the Library Project, it listed five built-in reports:
- Report #1: Items Checked Out Report
- Report #2: Items Overdue Report
- Report #3: Items Missing Report
- Report #4: Fines Owed by Patrons Report
- Report #5: Library Database Statistics Report
We’ll add these five reports to the project in this chapter. Before we write any code, we need to figure out how we’re going to get the data. Because the data will come from the Library database, we just need to craft the SQL statement for each report that will link to the designed report.
The fifth report, “statistics,” will report things such as the number of items, the number of patrons, and other similar statistical values from the Library database. Because this data can’t really come from a single SQL statement, we’ll extract the data from the database and build a custom data source that feeds into the report.
Crafting the SQL Statements
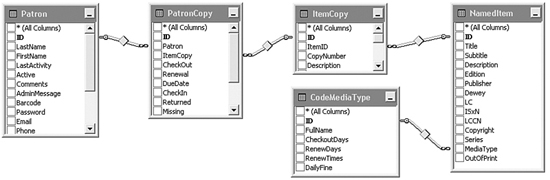
The first report, “items checked out,” lists the patron name and item title for every item currently checked out by the user. It involves the Patron table (to get the patron name), the PatronCopy table (the check-out event), the ItemCopy table (the actual item checked out), and the NamedItem table (where the item title appears). We’ll also include the CodeMediaType table, which tells us if the item is a book, a CD, or some other media type.
Microsoft SQL Server Management Studio Express includes a visual Query Designer that we can use to design the query. Figure 20-14 shows the five needed tables as linked together by the designer.
Figure 20-14. The five tables in the checked-out items query
Whether you use the query designer or build the SQL statement by hand, you eventually come up with something similar to the following, which we’ll use within the Library application.
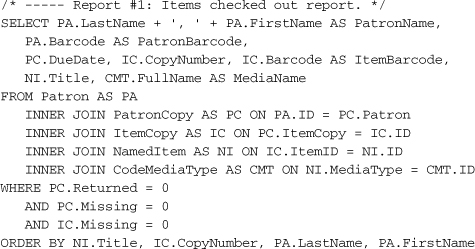
This query links up all of the tables, and then requests every record that has not been returned (PC.Returned = 0). It ignores any item marked as missing (PC.Missing = 0 AND IC.Missing = 0). This query will eventually drive the report. But for now, keep in mind that RDLC reports don’t actually need a real SQL statement or database table for the report schema. We can also build a compatible schema by hand using a class. This turns out to be a lot cleaner, because we won’t have a lot of data-set-related files strewn throughout the project source code. (The LibraryDataSet data source we created in the sample report earlier in this chapter added four source files and nearly 50K of source code to the project, not counting the RDLC report! The class-based data source didn’t add any code other than the class definition itself, and a little bit of XML in the RDLC file.)
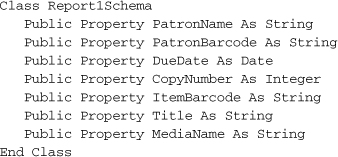
As for the data source schema, we can extrapolate it from the SELECT clause of the SQL query. If we were to design a class with a matching schema, it would look like this (without the property detail code).
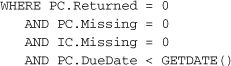
The next two reports are for “overdue items” and “missing items.” For me, the schema for report #1 is exactly what I want to see in these other two reports, so let’s just use the same SQL statement. All we need to do is change the WHERE clause. For the overdue items report, use this WHERE clause.
The missing items report will use this WHERE clause.
![]()
The fourth report displays the amount of fines still owed by patrons, so it will require a different schema. Here’s its SQL statement, which uses some aggregate grouping features.
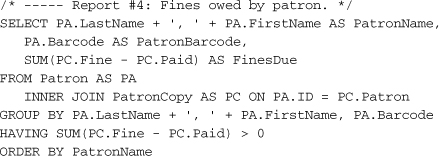
Here’s the schema that goes with report number 4.
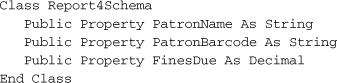
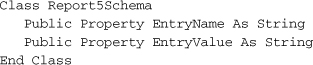
For the final report, we’ll just use a schema with two string values: a statistic name, and its related value. Here’s its schema.
Well, that’s enough preparation. Let’s start coding.
Project Access
Load the “Chapter 20 (Before) Code” project, either through the New Project templates, or by accessing the project directly from the installation directory. To see the code in its final form, load “Chapter 20 (After) Code” instead.
Adding Report Schemas
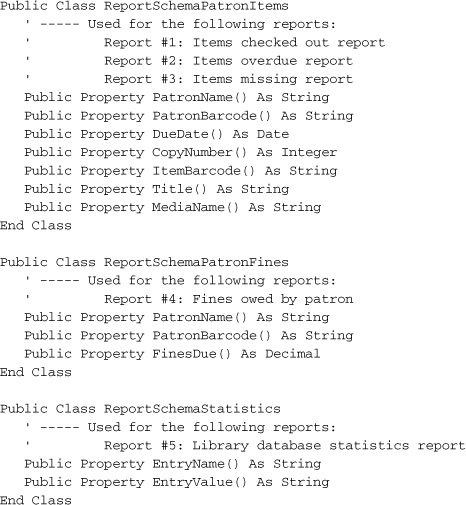
The ReportSchemas.vb file, already added to the project, includes the three schemas used for the five built-in reports. Just to remind us of the members, here are the public property definitions included in each class, minus the Get and Set accessors, and minus the private class members.
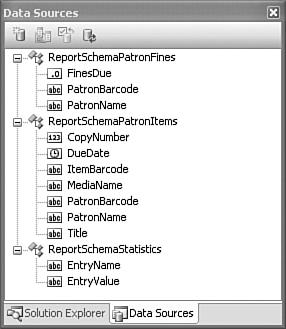
Once the schema classes are in the project, you will need to build the project before those classes can be used in RDLC reports as data sources. In the Library Project, build the project now with the Build ![]() Build Library menu command. All three schemas should then appear as sources in the Data Sources panel (see Figure 20-15). If the Data Sources panel is closed, open it using the Data
Build Library menu command. All three schemas should then appear as sources in the Data Sources panel (see Figure 20-15). If the Data Sources panel is closed, open it using the Data ![]() Show Data Sources menu command.
Show Data Sources menu command.
Figure 20-15. The three data source schemas
Adding Reports
Because we already jointly created an RDLC report earlier in the chapter, I went ahead and added the five built-in reports for you.
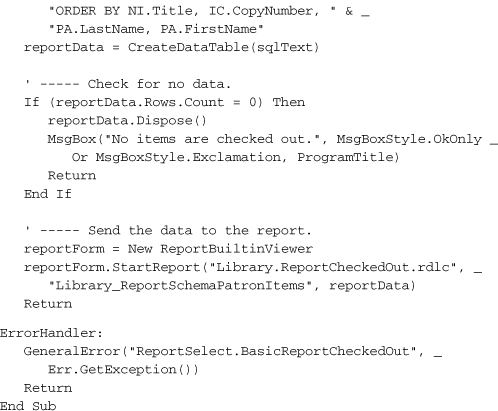
- ReportCheckedOut.rdlc. This file implements report #1, the “items checked out” report. It uses the ReportSchemaPatronItems class schema, and includes three columns in the main data list: patron name/barcode, item name/barcode/details, and due date. For the item name field, I wanted to present additional information when available. The item name, copy number, and media type are required values, but item barcode is optional. Here’s the format I desired.
Item Name (#CopyNumber, MediaType, Barcode)
To get this result, I had to concatenate the various source fields together, and use a conditional function (
IIf) to optionally include the barcode and its comma.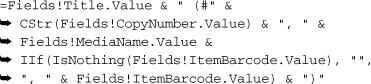
As mentioned earlier, the due date field has an expression in its Color property that turns the text red when the item is overdue.
- ReportOverdue.rdlc. This report shows a list of all overdue items in the system. Because everything will be overdue, I set the due date field to always use red for its font color. Other than that and the title, the report is basically identical to the checked-out items report.
- ReportMissing.rdlc. This report shows a list of all items marked as missing. Even though the schema includes a due date field, I don’t use it in this report. The rest of the report is basically identical to the checked-out items report.
- ReportPatronFines.rdlc. This report lists all patrons that still owe fines, and the amount of the fine due. It uses the ReportSchemaPatronFines class schema. The field that displays the fine has a “C” in its Format property. This formatting code forces the decimal value to display as currency using the culture settings on the local system. This Format property uses the same codes recognized by the String.Format method.
- ReportStatistics.rdlc. Report #5 displays record counts from some of the tables in the Library database. This is the only report that uses the ReportSchemaStatistics class schema. The report itself just displays two strings per record: a name and a value. It depends on the calling code to format those fields properly.
Adding a Report Viewer
It’s time to add a ReportViewer control. Because a single ReportViewer control can display any type of RDLC report, we’ll just add a single form to handle all five built-in reports.
Add a new form named ReportBuiltinViewer.vb to the project. Set its Text property to “Library Report,” and its WindowState property to Maximized. Also, load the project’s icon (Book.ico) into the Icon property. You’ll find a copy of this file in the project installation directory. If you want, you can size the form to some reasonable starting point for a report (I used “680, 400”), but each report will start out maximized when used.
Add a ReportViewer control named ReportContent to the form, and set its Dock property to Fill. Set both the ShowBackButton and ShowDocumentMapButton properties to False.
The code we will add to this form is a variation of code we wrote earlier in this chapter. The code that starts each report will pass to this form the name of the report RDLC file, the name of the data schema used, and the actual data. Because these reports will be modeless (you can keep them open while still using other parts of the Library program), we can’t let the calling code wait around for the user to close the report before we discard the report data. We’ll let the report dispose of the data itself. To do this, we need to keep a reference to that data. Add the following statement to the ReportBuiltinViewer form class.
Insert Snippet
Insert Chapter 20, Snippet Item 1.
Private StoreDataTable As Object
Remember, reports can use a variety of data source formats, including true database connections, arrays, and collections. Reports #1 through #4 will use a System.Data.DataTable instance, while report #5 will pass a generic List collection.
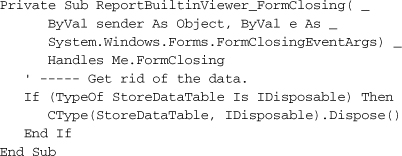
The best time to dispose of the data is when the report is closing. Add the following event handler to the form, which confirms that the data supports the disposal process before calling the Dispose method.
Insert Snippet
Insert Chapter 20, Snippet Item 2.
The code that opens this display form will pass in the essential report values through a public method named StartReport. Add its code now.
Insert Snippet
Insert Chapter 20, Snippet Item 3.
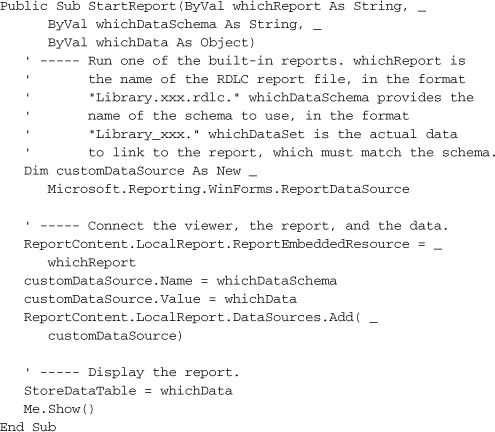
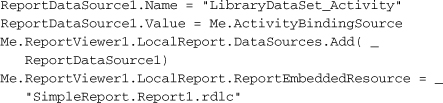
This code tells the viewer which report to use as an embedded resource, and then attaches the data as a custom data source. “Local” in these property names indicates a local (client) report instead of a “server” report that runs within SQL Server.
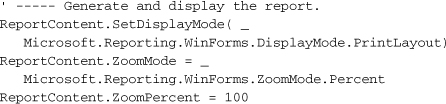
When we were playing with the reports before, we saw that the default display mode was the “fill-the-entire-screen-with-page-content” mode. Personally, I like to see those fake page boundaries. The ReportViewer control doesn’t include a property that lets us change this default view (why not?), but we can still adjust the initial display style through methods on the control. When we added the report viewer to the form, Visual Studio also added the following statement to the form’s Load event handler.
ReportContent.RefreshReport()
Add the following code just before that statement.
Insert Snippet
Insert Chapter 20, Snippet Item 4.
Adding Built-In Reports
I forget how long ago we added the ReportSelect.vb form that drives reporting, but it is already there in the project. In case you forgot what it looked like (I did), Figure 20-16 gives us a refresher.
Figure 20-16. The report selection form
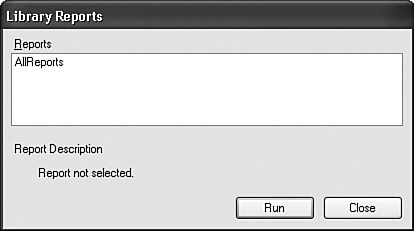
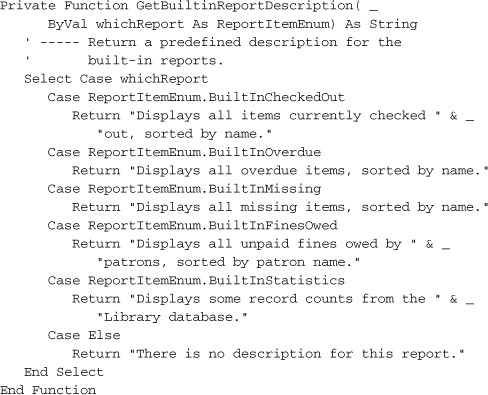
We previously added support for our five built-in reports in this form’s code. In a tribute to the never-ending reality of forgetting to finish all of the code, we need to add some code that we overlooked earlier. If you use an XML report configuration file to populate the report list, and you provide a description for each report in the XML, each entry displays that description in the lower-half of the report selection form. But if you don’t use a configuration file, and just depend on the form to add the five built-in reports by default (which it does), the form won’t display associated descriptions, because we forgot to add them. Add a function to the ReportSelect class that returns a short description for each of the five reports.
Insert Snippet
Insert Chapter 20, Snippet Item 5.
We’ll call this code from two places. The first is in the LoadReportGroup method. This code loads the XML report configuration file. If that file includes one of the built-in reports, but doesn’t supply a description with it, we’ll supply the description ourselves. About halfway through that code, you’ll find these lines.
' ----- So, what type of entry is it?
If (scanNode.Attributes("type").Value = "built-in") Then
About five lines below this is the following statement.
reportEntry.ItemType = CType(CInt( _
reportEntry.ReportPath), ReportItemEnum)
Add the following code just after that statement.
Insert Snippet
Insert Chapter 20, Snippet Item 6.
![]()
The second need for the built-in descriptions appears in the RefreshReportList method. This method makes the call to LoadReportGroup to retrieve the XML configuration. But if after that the report list is still empty, RefreshReportList adds the five default reports, which each require a description. Near the end of the method, within a For...Next loop, you’ll find this closing statement.
' ----- Add the report entry to the list.
AllReports.Items.Add(reportEntry)
Add the following code just before that statement.
Insert Snippet
Insert Chapter 20, Snippet Item 7.
reportEntry.Description = GetBuiltinReportDescription( _
reportEntry.ItemType)
Okay, that’s it for the fix-up code. Now back to writing the actual reports. The code to start each of the five reports already exists in the ReportSelect form’s ActRun_Click event handler. Most of that code includes a Select Case statement that acts as a switchboard for the selected report. Here’s the part that calls the five built-in reports.
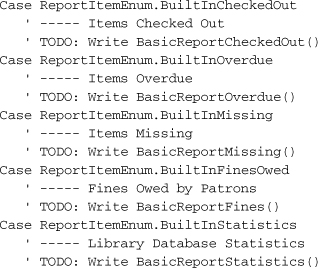
Clearly, this code isn’t accomplishing much. Change each of the TODO lines, removing the ' TODO: Write portion of the statement. So in the line that says:
' TODO: Write BasicReportCheckedOut()
change the code to:
BasicReportCheckedOut()
Do that for each of the five TODO lines, and let me know when you’re done.
Exposing these five method calls means that we have to write those methods, darn it. These methods will retrieve the data for the report, and send that data to the report viewer, along with the name of the RDLC file. They’re actually quite short and simple, considering the beautiful reports you will get out of them. Let’s start by adding the BasicReportCheckedOut method to the ReportSelect class.
Insert Snippet
Insert Chapter 20, Snippet Item 8.
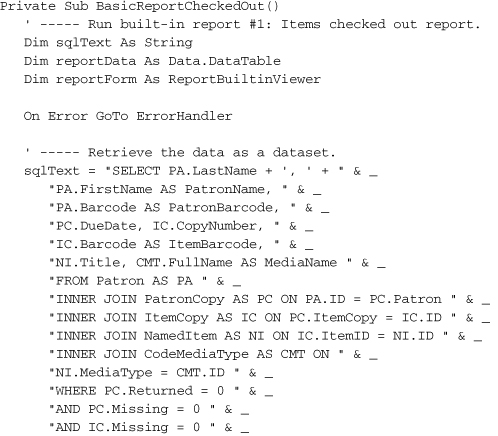
The code retrieves the report-specific records from the database, and makes sure that at least one record was included. (We could have added the SQL statement to the Library database as either a Stored Procedure or a View, and called that instead. For the purposes of this tutorial, it was simpler to store the statement directly in code.) It then calls the report viewer, passing the name of the RDLC file, the schema name (in the format ProjectName_ClassName), and the data table.
Next, add the BasicReportOverdue and BasicReportMissing methods. I won’t show the code here since, except for the name of the RDLC file and the WHERE clause in the SQL statement, they are identical to BasicReportCheckedOut.
Insert Snippet
Insert Chapter 20, Snippet Item 9.
Add in the BasicReportFines method, which handles built-in report #4.
Insert Snippet
Insert Chapter 20, Snippet Item 10.
It’s also quite similar to the BasicReportCheckedOut method, but it uses the SQL statement we designed earlier for patron fine retrieval. It also uses a different schema and report name.
reportForm.StartReport("Library.ReportPatronFines.rdlc", _
"Library_ReportSchemaPatronFines", reportData)
The last method to add to ReportSelect.vb is BasicReportStatistics, which handles built-in report #5. It’s a little different from the other four because it gathers data from six different tables, one at a time. In each case, it retrieves a count of the number of records in a database table. The results are then stored in a generic collection (System.Collections.Generic.List), where each list entry is an instance of ReportSchemaStatistics, the class we used for the fifth report’s data schema. What a coincidence!
Here’s the code for BasicReportStatistics for you to add now to the ReportSelect form class.
Insert Snippet
Insert Chapter 20, Snippet Item 11.
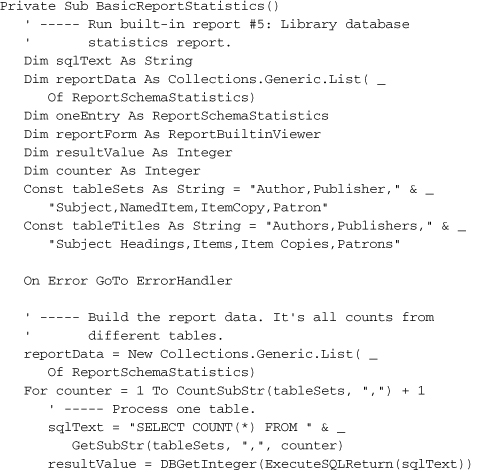
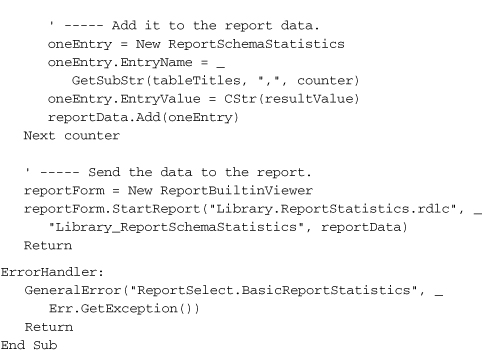
Because we really need to get the same information (COUNT(*)) for each of the six tables involved, I just implemented the code as a loop, and built the SQL statement for each one as I passed through the loop. A friendly table name and the record count are then stored in the generic list, which is eventually sent to the report.
You can now run the application and use the five built-in reports. You must log in as a librarian or administrator, and then access the Print Reports panel on the main form.
Believe it or not, we’re almost finished with the application. The only big thing left to do is to process past-due patron items to see if fines are required. We’ll add this code in the next chapter, and also take a look at licensing.