
Chapter 7. Multiple Tables and Relationships
Up until now, you’ve been working with the simplest kind of database imaginable—it has just one table. In the real world, one table is almost never enough. In your private investigator business, for example, you probably need to keep track of more than just people. You need to record the time you spend working for your customers, the invoices you send them, and the payments you receive.
You can certainly create a separate database for each of these needs. But that’s far from ideal, since you don’t use each kind of information in isolation. You need all these different kinds of information to work in harmony, like a well-rehearsed orchestra. In database terms, what you need is a single, integrated file that keeps all your various lists, files, and records in one place, so you can arrange and rearrange them according to your needs—a relational database.
Relational Databases Explained
Before you dive head first into relational databases, it will be helpful to review some vocabulary. First, a database is a collection of tables, layouts, and other things that forms an organized system. A table holds information about one kind of thing, like people, orders, products, or suppliers. A field holds one attribute of something: the person’s first name, the order date, the color of a product, or the supplier’s address. (An attribute simply means an individual characteristic. For example, a bicycle might have several attributes: Color, Height, Style, and Price. In a database, each of these attributes gets its own field.)
In the previous chapter, you’ve created a database whose tables and fields track various attributes of people. You could repeat the process and build any number of individual databases for organizing your time, creating invoices, and logging payments. But that approach has real problems, like the following:
When you log some billable work, you have to type in the customer information. Then, when you create an invoice, you have to type the customer information all over again in the invoice file. When you receive a payment, you have to type it a third time in the payment file. Since the databases aren’t connected in any way, they can’t share that information with one another.
Suppose you want to see how much you’ve billed a customer over the years. You could use the Invoices database and run a summary report by, say, the customer’s name. But duplicate names, misspellings, and name changes would render the information useless. You could use the People database instead. After all, the total amount billed (or outstanding balance) is, in some sense, an attribute of a customer. But to have that information ready when you need it, you’d have to create a field for it in the People database and retype the invoice information there every time. You know you have all the information somewhere, but because the system isn’t integrated, it can’t help you put all the pieces together.
Even if you could live with these limitations, you’re certain to run into trouble when you try to create the Invoices database. An invoice typically encompasses information about two different entities: the invoice itself, and each line item. There’s simply no good way to track invoices without involving at least two tables. Your solution to all these problems? Hook multiple tables together into one big database.
Note
Database developers use the word entity to mean “one kind of thing.” Person is an entity, and so is Invoice. Remember, though, that one specific thing isn’t an entity—Bill Gates isn’t an entity, and neither is Invoice #24601.
Not only can you put more than one table in a database—and track more than one kind of thing in the process—but you can also tell FileMaker how the data fits together. You can say, for example, that invoice records have attached line item records; or that each payment record is associated with a particular customer record.
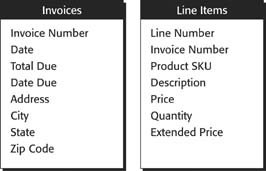
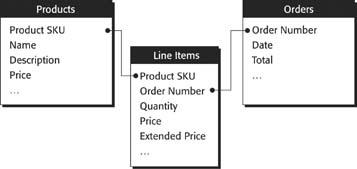
In database parlance, you define relationships among the data. A relationship is a connection from one table to another, along with the rules that define how records in the tables go together. For example, suppose you have two tables—Invoices and Line Items—as shown in Figure 7-1.
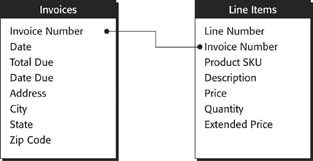
In order to figure out which line items belong to each invoice, you need to understand the relationship between these tables. Notice that the Line Item table has a field called Invoice Number. This field holds (surprise!) the invoice number for each line item. You can also show this relationship with a picture, just like the one in Figure 7-2. By defining this relationship, you’ve created a mechanism to hook together an Invoice record and a Line Item record.
Modeling Your Database
When you set out to design a relational database, you need to do a little upfront planning. You need to decide what entities you’ll be tracking and which ones deserve a table, and how they relate to one another. It’s easier to create the right tables and connections the first time than to go back and change them. You can create your own “blueprint” to follow as you build your database—what the pros call an entity relationship diagram.
Choosing Entities
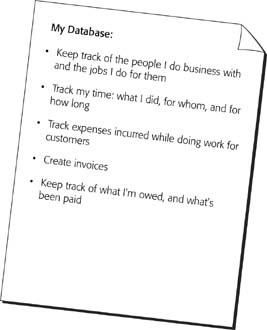
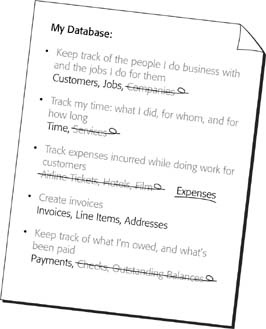
Your first step in designing the database is deciding what tables you need and how they fit together. Since every table holds data about a single entity, you normally start by figuring out all the entities in your system. You probably won’t be able to list them all in one shot. Everybody forgets some that are less obvious, so start with blank paper or a word processor, and list all the things the database will need to do. This list will help you identify entities.
Now’s the time to stretch your mind and think of every possibility. What tasks do you do every day? What do you wish you could do—and what information do you need to do it? What do you want your computer to show you when you sit down first thing in the morning?
When your workflow hits a wall, what piece of information would get you moving again? What questions do people keep asking you—and how could FileMaker answer them for you? The more your initial plan matches your real needs, the more quickly you’ll be up and running. You can see a list like this in Figure 7-3.
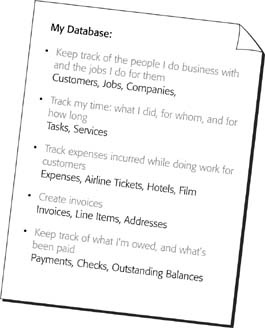
With this list in hand, you can start to figure out what entities your database needs to track. For each item on your list, think of all the things it involves. Figure 7-4 shows a possible list.
Most real-world problems have lots and lots of entities, so the second step is to figure out which ones matter. You’ll use a process of elimination to remove extraneous items from your list. You might eliminate items for any of four major reasons:
They’re already covered. The list in Figure 7-4 includes Checks and Payments. A check is really just a kind of payment, so you don’t need to track them separately in your database. Since a payment is more general than a check, you can eliminate Checks. Then, when you build your Payments table, you might add a field called Type and put Check, Cash, or Credit Card in that field.
They’re too specific. Sometimes you’ll have things in your list that aren’t general enough. This list shows Airline Tickets, Hotels, and Film. But you don’t really need to track the details of each of these items. Instead, you’re just interested in expenses in general—what they were, how much they cost, and what job they were for. To fix this problem, think of a more general word that encompasses all three things—something like Expenses. Add that to the list and remove the more specific versions.
Figure 7-4. You’ve now added some entities to your list. Don’t worry too much about whether the entities you think of are good ones or not—right now you’re just trying to get it all down so you won’t leave anything out. You can start with all the nouns in the list—People, Time, Invoices—and try to think of nouns that cover other aspects of your work.They’re really just attributes of another entity. Do you really need an entity called Outstanding Balances? You do need to know how much each customer still owes you, but do you already have that information somewhere else? A customer has an outstanding balance because one or more invoices are unpaid. So to see who owes you money, you really just want to look at the balance due on any unpaid invoices. Scratch Outstanding Balances off the list. For the same reason, you can also remove Companies—they’re just attributes of a customer. (For more detail, see the boxon Section 7.2.1.)
Note
Just because you’re crossing things off your list doesn’t mean those things aren’t important, or don’t apply to your database. It just means they don’t qualify as entities that need their own table. These things may show up as fields in other tables (like Company) or they may just be one type of a more general entity, like Check. Either way, you can still track these items in your database. See the box on Section 7.2.2.3.
They’re not important enough to track in your database. Suppose your list has an item called Services. These services are the kinds of things you do for your customers: Check into a cheating spouse, find a lost dog, recover a stolen computer, or whatever. You could create a Services table in your database, and put all these kinds of services in it. But what value would it add? Whichever service you’re asked to perform, you have to keep track of how much time you spend and what you do. And what kind of information are you tracking about a service? Probably just its name. So, as an entity, leave out Services. Figure 7-5 shows an example of a well-edited entities list.
Finding Relationships
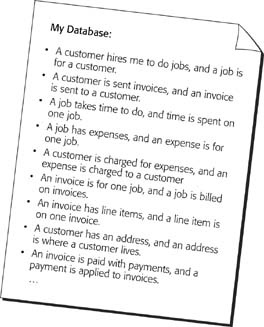
Now that you have a list of entities, you need to figure out how they relate to one another. To get started, just pick two of your entities—Customers and Jobs, for example—and ask yourself how they go together (if you need some guidance, see the box on Section 7.2.3.) You might come up with this answer: A customer hires me to do jobs, and a job is done for a customer. That sentence tells you two important things:
Customers and Jobs are related.
One customer has many jobs, but each job only has one customer.
By comparing different entities in this way, you can figure out how each relates to another, if at all. Your notes as you consider these relationships might look something like Figure 7-7.
You can easily translate most of the items on that list into database relationships. Each tells you about two entities in your list, and how they relate in each direction. You can usually translate these directly into database-ese, as shown in Figure 7-6. That picture is one example of a diagram representing each of these relationships.
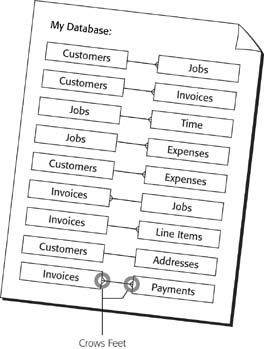
A glance at Figure 7-6 shows you how entities like Payments, Invoices, and Customers relate to one another, but the relationship with the Time entity isn’t so obvious. Is “Time” plural? For that matter, if Time is an entity, then it must be a thing, so what is a time? You’ve just discovered one of the common challenges to good relational design—choosing good names.
You added Time to your list of entities because you spend time working on a job. That’s a little ambiguous, though, so think about what exactly you’ll be putting in the database. You’ll be logging the time you spend working: what you’re doing, when you started, and when you finished. You could call it a work log entry but that’s pretty cumbersome. Because this kind of entity is quite common, database types have made up a name for it—timeslip. A timeslip is sort of like one entry on a timesheet. It says what you were doing for one period of time.
Using this language, your relationship description becomes clearer:
A job has timeslips, and a timeslip is for a job.
Now it’s a lot more obvious: This relationship is one-to-many.
One-to-many relationships
Most of the relationships in your diagram are one-to-many, which is normal. One-to-many relationships outnumber all other types by a large margin in almost any system. See the box “Many for One and One for Many” on Section 7.2.1 for a description of the various types of relationships.
One-to-one relationships
Your list of entities and relationships shows a one-to-one relationship between Customers and Addresses. For the purposes of this database, one Customer can certainly have one Address, and vice versa. But if that’s the case, are they really separate entities? In fact, Address is just an attribute of the Customer entity. That makes it a prime candidate for entity-elimination. Put the address fields in the customer table instead. You might argue that despite the conflict of interest, you could work for two people in the same household and would therefore have to type the same address twice in your Customer table if you didn’t have an Address table. The best answer to an argument like that is: Big deal. This situation won’t arise often enough to justify a more complicated database just to eliminate duplicating one or two addresses. Even without a separate Address table, you can still separately handle all other tasks for these two clients.
On the other hand, if you’re managing a high-school, and it’s important to know which students share a home, and which parents they belong to, then an Addresses (or more likely, Households) entity might make sense.
In this case, the fact that two addresses are one and the same justifies your adding another table. As a general rule, unless you can articulate a good reason for its existence, a one-to-one relationship is just two tables where one would normally suffice. (For some clarification, see the box on Section 7.2.3.1.) You’ll almost always want to combine entities like people and their addresses into one table.
Many-to-many relationships
Many-to-many relationships pose a special challenge. Normally, FileMaker knows which records are related to one another because they have something in common. For example, the Invoice table and the Line Item table both have an Invoice Number field. But you can put only one invoice number in a Line Item record. Luckily, Invoices and Line Items have a one-to-many relationship. If they had a many-to-many relationship, you’d be in trouble.
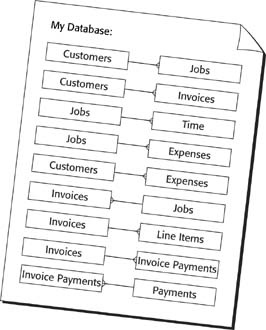
To fix things, you need to chop your many-to-many relationships in half, turning each into two separate one-to-many relationships. You always need to add a new special-purpose entity in the middle. Your database has only one un-handled many-to-many relationship: Invoices and Payments. To split it up, you need to introduce a special entity. Since it doesn’t have a decent name, just call it Invoice Payment (as in “This record represents one invoice payment—one payment on one invoice”). Now, instead of “An invoice is paid with payments, and a payment is applied to invoices,” you can say these two things:
An invoice is paid with invoice payments, and an invoice payment is applied to one invoice.
A payment is divided into invoice payments, and an invoice payment is part of one payment.
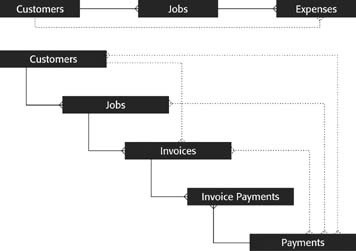
Figure 7-8 shows the updated diagram.
The Entity-Relationship Diagram
Now that you have a list of entities and their relationships, you’re ready to assemble your master plan: the entity relationship (ER) diagram. An ER diagram is a picture that shows all the entities in your database and the relationships between them. Unlike the diagram you’ve already drawn (in Figure 7-8), each entity appears only once in an ER diagram.
It has two purposes: to help you find relationships you missed, or relationships that don’t belong, and to serve as a roadmap for your database. You’ll use it when you actually create this database in FileMaker, and when you go back to make changes later. (Yes, you will get to use FileMaker again…pretty soon.)
Note
The diagram you’re about to create isn’t, in the most technical sense, a real ER diagram. The real kind deals with all kinds of technical details that simply don’t matter in FileMaker. Nevertheless, some wisenheimer may chastise you for calling your beautiful picture an ER diagram.
Creating an ER diagram
When you assemble an entity relationship diagram, you must put all your entities and relationships together in one big picture. Your goal is to have each entity in the picture just once, and all the lines necessary to define the various relationships.
Your ER diagram is crucial to a successful database designing experience. You’ll almost always find ways to improve your database when you put it in a picture. When you set out to actually build the database, the ER diagram guides you through the process. Finally, six years from now, when you need to add more to your database design, the ER diagram will bring you—or your successor—up to speed on how your database fits together.
You can start by making one box for each entity you’ve identified. Try to place the boxes on the page so that there’s some open space in the middle where your lines can roam free. Then start drawing lines to represent each of the relationships you’ve come up with. For a simple database, you can usually get the lines in the picture without much difficulty. But creating a larger diagram without the right tools can be a real pain. If you work on paper, you end up starting half a dozen times before you get a good arrangement. If you use a typical drawing program (the drawing capabilities in Word, for example) then you spend copious hours reconnecting lines and entities, reshaping lines, and hand drawing crow’s feet as you move things around. See the box on Section 7.2.3.1 for some suggestions to solve this problem.
When you’re done, you should have a single, unified diagram with each entity showing up only once, and every relationship indicated by a line.
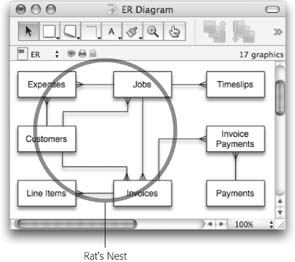
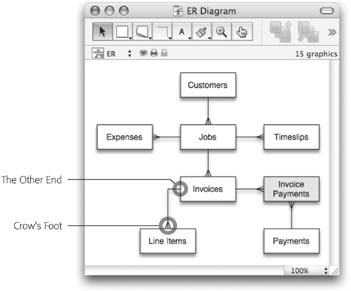
When you’re thinking about relationships with just pairs of tables, you don’t get the big picture. The ER diagram shows you how everything comes together, and when that happens, you often discover tangles of relationships just like those in Figure 7-9. Tangles like these aren’t inherently bad; they’re just usually completely unnecessary. Take the first tangled group—Expenses, Jobs, and Customers. The diagram tells you that customers have jobs, jobs have expenses, and customers have expenses.
But in point of fact, you don’t need all those lines to understand all the relationships, and neither does FileMaker. It turns out that the line between Customers and Expenses is entirely superfluous. Even if it weren’t there, you could still see all the expenses charged to a certain customer. Just find all that customer’s jobs first (by following the line from Customers to Jobs). Once you’ve found those, you can look at the expenses for each job. Since customers only incur expenses by way of jobs, you’ll get exactly what you want. In other words, if two entities are connected by a path along relationship lines—even through other entities—then they’re related as far as FileMaker’s concerned. It can show you the Expenses for a Customer just as easily as it can show the Jobs for that customer. Figure 7-10 illustrates this concept.
When you’re thinking about these implied relationships, pay attention to the crow’s feet. If, when moving from one entity to another along the relationship lines, you ever go through a to-many relationship, then the larger implied relationship is itself to-many. This isn’t just a clever trick; it’s actually intuitive. If a customer has more than one job, and each job has expenses, then clearly a customer can have more than one expense.
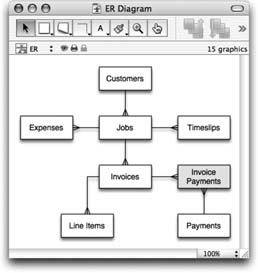
When you make your ER diagram, you should get rid of redundancy in your relationships. In other words, remove lines that show direct relationships when the relationship is already implied by other entities and relationships. In your diagram, you can remove the relationship between Customers and Expenses. You can also axe one between Customers and Invoices because Customers can find their Invoices by way of Jobs. With this revision, the ER diagram now looks like Figure 7-11.
Next, you need to figure out what fields your tables need to make the relationships work. But before you get to that step, take one last chance to look over your ER diagram. Keep these points in mind as you check for errors:
You should have no undivided many-to-many relationships.
If you have any one-to-one relationships, make sure you can justify them (see When to go One-to-One on Section 7.2.3.1 for some ideas).
Make sure you don’t have any unnecessary entities hanging out all by themselves.
Be certain you don’t have any unnecessary lines or rat’s nests.
If you discover an entity that has no relationships, you may not need it in your database at all. Read back on Section 7.1 and see if that item might belong inside one of the other tables. Or if your diagram has two or more groups of related entities and no relationships between the groups, you might’ve forgotten to draw in a relationship, or again, you might have one or more entities that your system doesn’t need. Go back and make sure you’re clear on your one-to-many and many-to-many relationships.
Keys
In a diagram, you can show relationships by simply drawing a line. FileMaker, however, knows what records are related only because they have some data in common. It’s time to look more closely at how that works. Take, for example, the typical Invoice table and its little brother, Line Items. The Invoice table probably contains fields like Due Date, Balance Due, and Terms; all attributes of the invoice itself. Then there’s Invoice Number field. Unlike the other fields, it’s a made-up number. It does one thing—identify an invoice—and does it very well. Without it, you and your customers might have conversations like this: “I need a refund on one of my invoices…you know, the big one…yeah, in February…right, with three items…no, the other one….” As soon as someone mentions an invoice number, though, everybody knows exactly which invoice to look at. More important, FileMaker knows which invoice it is.
The invoice number can do its job as a key field because it has three important characteristics:
It’s unique. No two invoices will ever have the same invoice number.
It’s unchanging. Invoice #24601 is #24601 today and it will be tomorrow, and the next day, and the next day.
It’s consistent. All Invoice records have an Invoice number.
Since it’s a unique number, if you’re talking about invoice #24601, and your customer is talking about invoice #24601, there’s no question that you’re both referring to the same invoice. Since it’s unchanging, you can go back weeks, months, or even years later and find the invoice every time. And since it’s consistent, you’ll never have lonely Invoices hanging out there without an identifying number. In database terms, the invoice number is called a key. A key is a field whose value uniquely, unchangingly, and consistently identifies one record.
As far as FileMaker’s concerned, any field that you use to link one table to another is a key field. Although FileMaker doesn’t differentiate between key types, in the larger world of database theory there are two types of keys: primary and foreign. Understanding how the two types of keys work helps you choose appropriate ones for your databases.
Primary keys
When you tell FileMaker how two tables are related, you need a way to identify each record: You need a key. On the “one” side of a one-to-many relationship, this key field is called a primary key. Invoice Number is the primary key in the Invoices table. Like the Invoice Number in your database, a primary key is most often a made-up number. You can add a new field to your table, and tell FileMaker to make up a unique value for it each time you create a record. This kind of primary key, based on purely made-up data, is called a surrogate key.
Occasionally, your table will have a real value that meets the requirements for a key. For example, if your Product database has a field for your internal Inventory Control Number, you may be able to use that field as the primary key. If you use your Inventory Control Number to relate tables, then it’s a natural key.
You might be tempted to use a birth date or a Social Security number as a natural key. But remember, in order for a natural key to be reliable, it must be unique, unchanging, and consistent. Social Security numbers are supposed to be unique and unchanging—but duplicate numbers and identity theft have put a big dent in that theory. And you can’t even rely on everybody in your database having a Social Security number. While most Americans have one, you’ll have to redesign your database the minute your company wants to do business with a customer who doesn’t live in the US.
In practice, you’ll almost never find a suitable natural key. Natural keys almost always originate from surrogate keys in another database system. For instance, your database might track invoices created—and numbered—by a separate accounting system. If those numbers are unique, unchanging and consistent, you can use them as a natural primary key. (See the box on Section 7.2.4.1 for more perks and perils of natural keys.)
Foreign keys
If the Invoice Number field in the Invoices table is the primary key, what is the Invoice Number field in the Line Items table? It’s not a primary key because it isn’t unique—lots of line items could have the same Invoice Number. In this case, it’s called a foreign key. A foreign key is simply the primary key from another table, and you’ll find it on the “many” side of a one-to-many relationship. A table has only one primary key, but it can have lots of foreign keys (or none at all).
But where do you put these foreign keys? In the Invoices database, how did you decide to put the Invoice Number field in the Line Items table? Why not create a Line Item ID field in the Line Items table, and put it in the Invoices database? Wouldn’t that accomplish the same thing? At first glance, it might seem like both methods would produce an identical relationship. After all, they sure look the same in a picture (Figure 7-12).
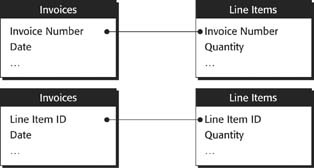
Think about what a primary key means. Each value identifies one, and only one, record in the table. If you build a relationship based on Line Item ID, then each invoice can have only one line item. If it had two, there would be two line items with the same line item ID. When you have a one-to-many relationship, you must put the foreign key in the table on the many side. Luckily, keeping this information straight in your head is a breeze. Since foreign keys belong on the to-many side of a relationship, just remember this rule: When you see a crow’s foot on your ER diagram, you need a foreign key in the table to which it’s attached. (But if you’re getting confused, the box below should clear things up.)
Join Tables
A many-to-many relationship is more complicated than its one-sided brethren. Imagine your database tracks payments from your customers. A customer could easily send a check to cover two invoices. On the other hand, another customer might send a check to cover just part of an invoice, with the promise to send another later. So an invoice can have multiple payments, and a payment can be for multiple invoices: many-to-many.
How do you build a relationship like this? If you put the Payment ID in the Invoices table, then a payment can be applied to more than one invoice (just put the same Payment ID in each invoice record). But an invoice can have only one payment since it has just one Payment ID field. If you put the Invoice Number in the Payments table, you get the same problem in the other direction. You might be tempted to try putting a foreign key field in both tables. In other words, add a Payment ID field to the Invoice table, and an Invoice Number field to the Payments table. Dig a little deeper and you’ll see that this has a whole host of problems:
An invoice now has a field called Payment ID, but that field doesn’t identify the payments for that invoice. To find the payments for an invoice, you have to open the Payments database and use the Invoice Number Field. That’s just plain confusing.
Instead of one bidirectional relationship, you have two unidirectional relationships. The Payment ID in the invoice matches the Payment ID in the Payments table, but this only tells you which invoices belong to each payment. You need the other relationship (based on Invoice ID) to figure out which payments belong to each invoice. If you connect a payment to an invoice by putting the invoice number in the payment record, you also have to put the Payment ID in the invoice record. If you forget, your data is no longer valid.
Luckily, there’s a better way to accomplish a many-to-many relationship. You need something called a join table (see Figure 7-13). A join table doesn’t usually represent a real entity. Instead, each record represents a relationship between two records in the related tables.
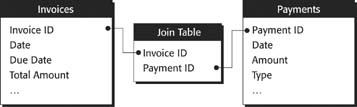
If it helps, think of join tables this way: Invoices and Payments both have a one-to-many relationship to the join table. So one invoice can connect to many join records, each of which connects to one payment. Likewise, one order can connect to many join records, each of which connects to one invoice. So you get many related records in both directions. A join table always contains two foreign keys, one from each table it’s joining. If your database has many-to-many relationships, you may have to create a join table to hold just these two keys, but sometimes your database may already have a real table that can act as a join table. Figure 7-14 shows an example.
Other times, you can use a join table to hold fields that don’t quite belong in any other table. Suppose you wanted to record what portion of a payment was applied to each invoice. For example, if a customer hands you a check for $100 and you have two outstanding invoices for that customer, for $80 and $30, you might want to decide how to allocate the payment. Perhaps you apply $80 to the first invoice and $20 to the second. This dollar amount applied to each invoice can’t be stored in the Invoice table because an invoice might have several payments. It can’t be stored in the Payment table because you have two amounts and only one payment record. The best place for it is right in the join table itself.
At this point, you have a good ER diagram, you’ve eliminated many-to-many relationships by adding join tables, and you understand what foreign keys you’ll need to make it all work. You’re (finally) ready to actually build your database.
Creating a Relational Database
The tedious planning is finally over. Now comes the fun part—actually making the database. And believe it or not, this part will go much more smoothly with your plan in place. You create a relational database in three steps. First, you tell FileMaker what tables you want. Then you define the fields in each table. Finally, you add relationships. Don’t be alarmed if you forget a table or miss a field: You can go back at any time and make changes—even six months from now when your tables are loaded with data.
Relational databases start out like any other. Go to FileMaker and choose File → New Database. Name your new database, pick the folder to save it in, and click Save.
Note
If you see an option to “Create a new file using a template,” choose “Create a new empty file” and click OK. Then you’ll be able to name and save your new database.
Defining the Tables
When you first create a database, FileMaker shows you the Define Database window’s Field tab (you first saw this on Section 3.2). Without your knowledge, it has already created a table for you with the same name as the database itself. FileMaker assumes you just want one table, and it’s ready for you to add fields to that table.
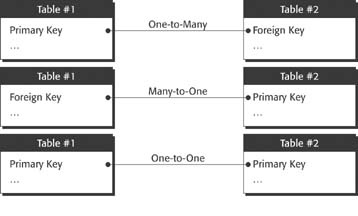
As this picture shows, the position of the primary and foreign keys in a relationship determines its type. In a one-to-many relationship (or its identical counterpart, many-to-one), the foreign key belongs on the many side. Since a primary key guarantees uniqueness, there can be only one record with a particular key value. But a foreign key doesn’t have to have unique values, so you can have as many matching records as you want.
In the rare case that you define a one-to-one relationship, you’ll be matching two primary keys together. In this case, both tables share the same primary key. The uniqueness ensures that you have only one matching record in each table.
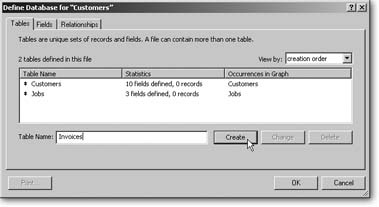
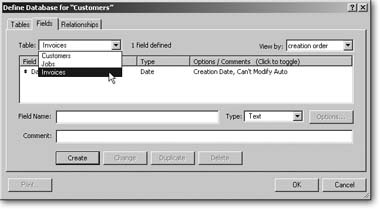
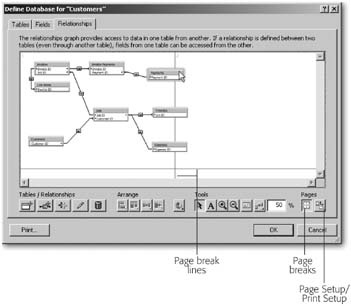
This time, though, you don’t want just one table, so click the Tables tab (you can see it in Figure 7-15). Your first job is to remove the table FileMaker added for you since it doesn’t match one of the entities in your ER diagram. Just select the table in the table list, and then click Delete.
Now that you’ve deleted the starter table, you’re ready to add your own carefully planned tables. Grab the ER diagram and create a table for each entity. The diagram has eight tables in all, so make sure you create all of them.
Warning
Deleting a table is a dangerous operation. Right now there’s no risk because you’re working in a brand-new database. But imagine you come to this window two years from now. If you accidentally delete a table, you lose all the data in it. You’ll also have a lot of work to do putting your relationships and layouts back together. FileMaker warns you before it lets you delete the table, but it’s worth an extra measure of caution.
Defining the Fields
With the tables defined, you’re ready to add fields. Click the Define Database window’s Fields tab (see Figure 7-16). You choose which fields to add to each table the same way you learned to in Chapter 3, with one caveat: key fields. Every table needs a primary key. In this database, you’ll be using surrogate (made-up) keys in each table.
Adding primary keys
To keep things consistent, each primary key field will match the name of the entity, with the word “ID” added to the end. For example, the primary key in the Customers table should be called Customer ID. This technique is so common, in fact, that you can often spot the primary keys in any database by looking for the letters “ID.”
The easiest way to make a surrogate key in FileMaker is to use a serial number. The process is simple:
Click on the Fields tab in the Define Database dialog box, if necessary. Then, from the Table pop-up menu, select Customers.
You’re now ready to add a field to the Customers table. You’ll start with the primary key.
In the Field Name text box, type Customer ID. In the Type pop-up menu, make sure Text is selected.
Key fields can be any type, but text is a good choice because you have the most flexible formatting options.
Figure 7-16. When you have multiple tables defined, they all show up in the Tables popup menu. When you choose a table from the menu, its fields show in the field list. When you add a field, it gets added to the selected table. You can also double-click a table in Tables tab to jump straight to its field definitions.Click Create.
FileMaker adds your new field to the field list. But so far all you have is a normal text field.
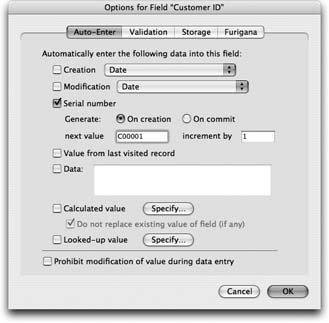
Click Options, and make sure the Auto-Enter tab is selected, as shown in Figure 7-17 .
To be a good primary key, this field needs a unique value on every record. That sounds like a job for a computer:
Turn on the “Serial number” checkbox.
When you tell FileMaker to auto-enter a serial number, it automatically makes up a new unique number every time you create a record. It sets the field to a number one bigger than the last value it created. Since the number always grows, it never repeats.
Make sure the “On creation” radio button is turned on.
When you make a field a serial number, you get to choose when the serial number gets entered. It can happen when you create the record, or when you commit it. In other words, FileMaker can automatically put the serial number in the field for you right away, when you first create the record, and most of the time, that’s exactly what you want. (As you’ll see on Section 8.1, FileMaker lets you set your layout up so that you can create related records automatically while editing a record; you need the serial number for that to work.)
Figure 7-17. Here’s the Field Options window’s Auto-Enter tab, in case you’ve forgotten what it looks like. Pretty slick, huh? In the next few steps, you’ll be setting up those “Serial number” options.Alternatively, you can have FileMaker wait until you finish entering data and actually commit the record. You might choose “on commit” if, for instance, you have a complex, automated database that adds new people to your database from lists you get from other offices. You can have the database add a person record first, and then see if it’s a duplicate before committing the record. That way, you don’t skip serial numbers. (And if you know how to do that, you probably should be the one writing this book.)
In the “next value” text box, type C00001. Make sure the “increment by” box reads “1.”
You’ve just established your starting serial number and told FileMaker how to continue. Your first customer record will have the Customer ID C00001, your second will be C00002, and so on.
Select the “Prohibit modification of value during data entry” option.
Since key fields provide the links between your tables, relationships would break and other database disasters could ensue if key values got changed. When you turn on this option, you prevent that unhappy fate.
Click OK to return to the Define Database window. You’ll get a chance to test that serial number field in a few minutes. First, though, you need to follow those steps again for each table. You can, of course, add any field to any table at any time, but here you’ll create tables, then primary keys, then foreign keys, and finally other fields. It’s not the quickest way, but creating a relational database requires lots of steps, and you don’t want to forget anything, so an organized approach pays off.
When you set your serial number options, use a different letter in the “next value” for each table. For instance, use E00001 as the starting value in the Expenses table, and IP00001 in the Invoice Payment table. That way, whenever you see a serial number, you’ll have a clue table it belongs to. You don’t have to name your serial numbers that way, but it might come in handy. Sometimes you take data out of FileMaker to put it into other programs (like Microsoft Excel, so you can make charts). When you do, you’ll lose your field names and just see lists of data. Although most data is easy to identify (phone numbers look like phone numbers, for example), primary keys can be a mystery. Having a textual primary key like these can eliminate just a touch of mystery, should you ever be in this situation.
Note
Strictly speaking, you don’t need to add an Invoice Payment ID field to the Invoice Payment table. Since you’re making a simple join table, it’s going to have two foreign keys, one for the Payment ID and one for the Invoice ID. A record in this table represents the connection between an Invoice and a Payment, so you can just use these two foreign keys together as the primary key (a composite key, as you remember from the box on Section 7.2.5). You’ll never have one payment on the same invoice twice, so the combination of these two values will be unique. That said, lots of people add surrogate keys to their join tables anyway, and it certainly won’t hurt.
Adding foreign keys
Adding foreign keys requires a little more thought than the primary keys, but not much—you already did the hard part by creating an ER diagram (Section 7.2.4). To decide where the foreign keys go, just look for the crow’s feet. Figure 7-18 offers a refresher.
Since your primary key fields are all Text fields, your foreign key fields should be too—after all, the foreign keys hold primary key values. Following the crow’s feet, you come up with these foreign keys (remember that a foreign key is always just a primary key from another table):
In the Expenses table, add a field called Job ID.
In the Jobs table, add a field called Customer ID.
In the Timeslips table, add a field called Job ID.
In the Line Items table, add a field called Invoice ID.
In the Invoices table, add a field called Job ID.
In the Invoice Payments table, add two fields: Invoice ID and Payment ID.
Go ahead and add the foreign keys now.
Defining the Relationships
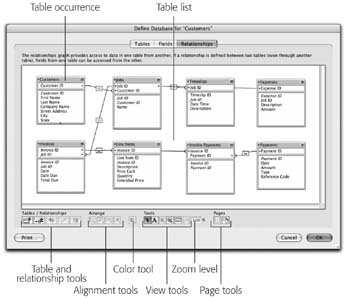
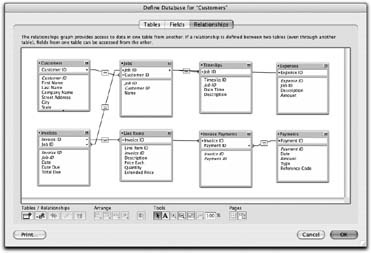
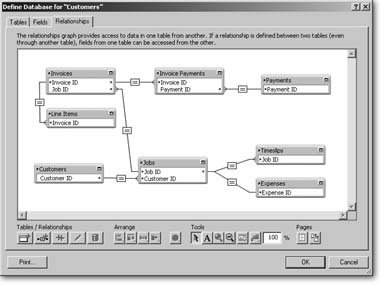
With tables and keys, you have everything you need to define some relationships. In other words, you tell FileMaker how the tables in your database fit together by matching up keys. As usual, FileMaker manages to make a tricky task seem kind of fun. You get to work with a visual, intuitive picture of the relationships between your tables—the Relationship Graph. In the Define Database window, click the Relationships tab, which is reproduced in Figure 7-19.
Your table occurrences (TOs) may not be in precisely the same order as Figure 7-19; they appear in the order you created them. If you want to move them around, just drag them. Or you can drag right through a table occurrence that’s in your way. (Later on, you’ll see how the Relationships Graph’s tools work to help you manage the graph further.) To create relationships, you simply drag in the Define Relationships window.
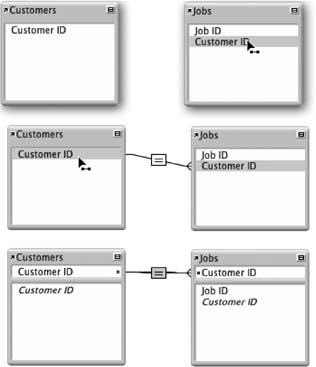
Point to the Customer ID field in the Jobs table occurrence and press your mouse button.
The field name highlights and the mouse arrow changes shape indicating you’re about to join (relate) two tables together.
With the mouse button held down, drag the arrow over the Customer ID field in the Customers table.
As you drag, FileMaker draws a line starting from the first Customer ID field. When your cursor is over the second Customer ID field, it too highlights.
Release the mouse button.
Poof! You have a relationship. The Customers and Jobs table occurrences change in appearance slightly: FileMaker adds a new panel to each box, and shows the key fields in this space. You can see each step, and the end result, in Figure 7-20.
With the technique mastered, you can now define the rest of your relationships. You can refer to your ER diagram at this point, or use this handy cheat sheet:
Drag Expenses::Job ID to Jobs::Job ID.
Drag Invoices::Job ID to Jobs::Job ID.
Drag Line Items::Invoice ID to Invoices::Invoice ID.
Drag Invoice Payments::Invoice ID to Invoice ID.
Drag Invoice Payments::Payment ID to Payments::Payment ID.
Drag Timeslips::Job ID to Jobs::Job ID.
You may not see table occurrences in the Relationships Graph for all the tables you create. Remain calm. You have all the right table occurrences; you just can’t see them all at once. Chances are you just need to scroll the graph to the right. Unfortunately, it can be tricky to drag between two fields if you can’t get them both on the screen at once. (You can do it, mind you. When you approach the edge of the graph while dragging, FileMaker automatically starts scrolling. It’s just a little tedious.)
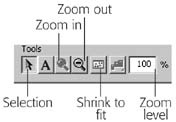
If you have a big enough computer screen, you can simplify things by making the entire window bigger by dragging the bottom-right corner. If you still can’t fit everything in, even when the window is as big as it can get, you can zoom out on the window. Click the Shrink to Fit button (shown here) and FileMaker shrinks everything so it all fits on the graph at once. In this reduced view, you can still drag relationships. When you’re ready to see things full-size again, just type 100 in the Zoom Level box and press tab.
(Don’t press Enter or Return after changing the zoom level or FileMaker will think you meant to click the OK button and make the Define Database window go away. If you do close it accidentally, just choose File → Define Database again.)
You can zoom in on certain parts of the graph with the Zoom In tool. First, click the tool, and then click anywhere in the graph. Use the Zoom Out tool instead if you want to zoom back out again. Unlike the Zoom controls on a database window, these controls don’t let you zoom in past 100%, but you can zoom way out—to 1% if you want. At that level, your tables are reduced to undifferentiated goo in the corner of the graph.
When you’re done zooming, be sure to choose the Selection tool again so you can drag relationships or table occurrences.
When you’re done, you can spot-check your work by counting the lines in the relationship graph. Including the one between Customers and Jobs, you should have seven, and the graph should look like the one in Figure 7-21.
Cleaning up the Relationship Graph
Although this relationship graph is small and easy to understand, chances are it will grow as you power up your database by adding more tables, layouts, and fields. As it grows, your graph can easily get messy and hard to decipher. To make your graph manageable, first get rid of unnecessary information. Right now your graph shows every field in each table occurrence (in fact, it shows some fields twice, and a healthy dose of empty space too). But you don’t need to see every field here—that’s what the Fields tab is for. Figure 7-22 shows how to reclaim the wasted space.
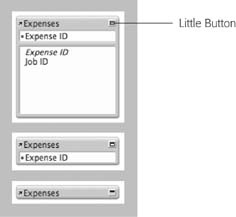
To make your graph more efficient, switch every table occurrence to show only the fields used in relationships (one click should do it). Now a lovely graph is just a few drags away: You can move the table occurrences around so they form a pleasing arrangement that’s easier to understand than the mess you had before. Figure 7-23 shows the result.
Instead of closing up the table occurrences, you can resize them. Hover the mouse over any of a table occurrence’s four edges and the pointer changes to a double-headed arrow. Drag with the arrow to resize.
Tip
If you have a stray table occurrence (named the same as the database itself) on your Relationships Graph, just select it and hit Delete. It’s a useless artifact from the table you deleted when you first defined this file. Since this table occurrence is not part of your ER diagram, you can safely ignore FileMaker’s protestations that deleting it will break things.
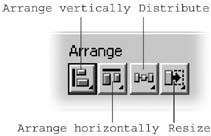
Arrange the graph
The table occurrences in the graph behave a lot like layout objects in Layout mode. You can Shift-click or drag across more than one table occurrence to select them all. You can even press Ctrl+A (⌘-A) to select all the table occurrences. Just click into empty space on the graph to deselect. Once you have some selected, you can use the Arrange tools to line them up. Figure 7-24 shows them close up.
Once you’ve dragged a few table occurrences around on your graph, it can look pretty sloppy. Here’s how to use the tools to inflict some order on the graph:
The Arrange vertically tool lets you choose whether to align the left edges, centers, or right edges of any highlighted table occurrences.
The Arrange horizontally tool lets you align the top edges, centers, or bottom edges of the highlighted table occurrences.
The Distribute tool makes the space between selected table occurrences uniform. You can choose horizontal or vertical distribution.
The Resize tool makes short work of getting those manually resized table occurrences back in parade dress. Select some table occurrences, then click the Resize tool to tell FileMaker whether you want all the highlighted table occurrences resized to the smallest width or height, the largest width or height, or even the smallest or largest width and height.
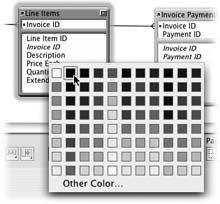
Color your table occurrences
You can also change the color of the selected table occurrences. This won’t affect the database’s behavior at all. It’s just there to help you organize your graph (you could make all the occurrences of the Invoice table blue, or all the join tables green, for example). Just select one or more table occurrences, then use the Color tool as explained in Figure 7-25.
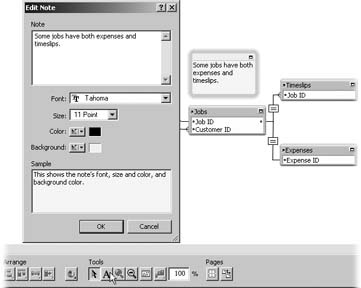
Adding notes
To notate your graph, select the Note tool, then drag on the graph to create the note. The Edit Note dialog box appears. There you type the text of the note and set its font, size, text and background colors. If you want to edit a note, double-click it and the dialog reappears, ready to do your bidding (Figure 7-26).
Printing the graph
Last but not least, FileMaker offers some tools to help you print the graph. Since the graph is a roadmap to your tables, some people like to print it and tape it up beside the computer for quick reference while building layouts. Figure 7-27 shows how to lay out the graph so you can print without surprises.
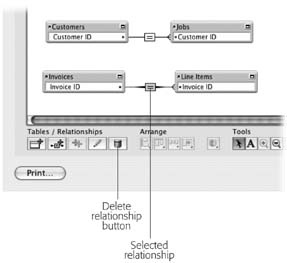
Deleting relationships
If you accidentally connect the wrong fields, or later decide you don’t want a relationship you already created, you can easily delete it. Just click the relationship line itself to select it. Then click the Delete Relationship button or press the Delete key on the keyboard. You can see a selected relationship and the button in Figure 7-28.
Finishing the Field Definitions
Now that your relationships are defined, you can add the rest of the fields to your tables. Since you already know how to define fields, there’s no need to bore you with the gory details. Below is a list of all the fields needed to complete this database.
Tip
To save time, you can find the completed database with all fields defined on the “Missing CD” page at www.missingmanuals.com. If you choose the ready-made option, you can skip ahead to Section 7.3.5.7 and start learning how to use a relational database.
Customers table fields
Create the following fields in the Customers table:
A text field called First Name.
A text field called Last Name.
A text field called Company Name.
A text field called Street Address.
A text field called City.
A text field called State.
A text field called Zip Code.
A text field called Phone Number.
A text field called Email Address.
Jobs table fields
In the Jobs table, you need only one more field: a text field called Name. Of course, you could call this field Job Name, so that at a glance you could tell what table it comes from. But in FileMaker such redundancy is unnecessary. Almost everywhere the program shows field names, it includes the table occurrence name as well—Jobs::Name, for example. The exception, inexplicably, is Layout mode, where related fields look like this—::Name. You can always double-click a field to see where it comes from, but that gets boring after about the 79th time. To spare yourself the tedium, you have permission to change any field names listed here.
Expenses table fields
The Expenses table needs three new fields:
A text field called Expense.
A number field called Amount.
A text field called Company Name.
Timeslips table fields
Timeslips also needs three fields:
A timestamp field called Date Time.
A number field called Duration.
A text field called Work Description.
Note
You might be tempted to call the Date Time field Date and Time instead, but if you try to do it, FileMaker sternly warns you against putting the word “and” in a field name. You can create fields that break the naming rules, but you’ll have to jump through hoops to use them in calculations (Chapter 9). It isn’t usually worth the hassle: pick a safe name instead.
Invoices table fields
The invoices table is easy too; just three new fields:
A date field called Date (as in the date of the invoice).
A date field called Date Due.
A number field called Total Due.
Line items table fields
Add four new fields to the Line Items table:
A text field called Description.
A number field called Price Each.
A number field called Quantity.
A number field called Extended Price.
Payments table fields
The payments table is easy too; just three new fields:
A date field called Date (as in the payment date).
A number field called Amount.
A text field called Type.
A text field called Reference Code (this will hold a check number, direct deposit transaction number, Credit Card transaction ID, or other appropriate value).
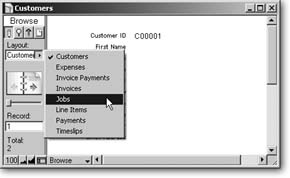
Click OK in the Define Database window, and FileMaker shows you your database. After all that work, the result is wholly uninspiring—it looks exactly like the single-table database you already created. But take a peek at the Layouts pop-up menu (or Figure 7-29). Surprise: FileMaker has made several layouts for you—one for each table occurrence on your relationship graph. At this point, everything you know about using a FileMaker database still applies. The only difference is that each layout is attached to a different table.
Relational Databases
The essence of a relational database is its multiple tables. But every database you’ve worked with up to this point has had just one table. Now you need to learn how multiple tables affect the FileMaker concepts you’re familiar with: Editing records, finding records, and building layouts.
One Table Occurrence, One Found Set
The most important thing to understand when using a multi-table database is that each layout sees the entire database from a different perspective. You’ll want to do a little exploration to see this concept in action. A layout is attached to an occurrence on the graph, and that’s how it sees the world. This means when you’re looking at a record on the Customers layout, you’re seeing a customer. If you switch to table view (View → View as Table), you’ll see a list of customers. You won’t see payments at all. To see those, you need to use the Layout pop-up menu (or choose View → Go to Layout → Payments) to switch to the Payments layout.
Since each table holds different data, the concept of a found set changes a little as well. Whenever you initiate a Find, the layout you’re on determines which table FileMaker searches. Your newfound set is associated with that table occurrence too. Just like when you had only a single table, the found set stays the same until you perform another find, or you tell FileMaker to show you all the records for that table occurrence (Records → Show all records).
For example, if you find the six customers from Texas, then switch to the Expenses layout, you won’t have six records in your found set anymore. Instead you have a separate Expenses found set. Switch back to Customers and you’ll see the six Texans again. FileMaker remembers one found set for each table occurrence. It also remembers the current record for each table occurrence, so if you switch to a different layout, then come back, you’ll still be on the same record that was active when you left that layout.
Of course you can have more than one layout attached to the same table occurrence—Customer List and Customer Detail, for example. The found set and current record are associated with the table occurrence, not the layout, so a find on the Customer List layout will affect the found set on the Customer Detail layout.
Tip
If you want more than one found set or current record in the same table occurrence, you can use multiple windows, just like you learned in Part 1.
If you want to see two kinds of records side by side, you can create a new window (Window → New Window), then switch one of them to a different layout.
Viewing Related Fields
Having each table occurrence completely segregated from the rest on its own layout is a good starting place, because you will probably want separate lists of all your entities, but it’s hardly ideal for a fully functional database. After all, if you wanted to view everything separately you could have created individual databases and saved yourself all the trouble of making an ER diagram.
So think of the layouts FileMaker made for you as starting points. It’s time to put those relationships to work. For starters, you’d like to show the customer name when you view a Job record. But the Job table doesn’t have a customer name field. Instead, you’ll use the fields from the Customer table and let FileMaker find the correct related data using the relationships you defined.
In the Jobs layout, choose View → Layout Mode.
So far everything looks familiar. You’ve certainly seen Layout mode before (Section 4.4.1).
In the status area, use the Field tool and drag a new field onto the layout, somewhere below the existing fields.
As soon as you release the mouse button, FileMaker asks you what field you want.
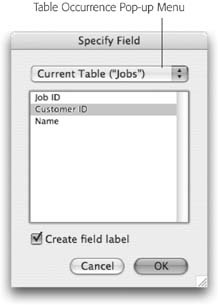
In the Specify Field dialog box, click the Table Occurrence pop-up menu (see Figure 7-30).
Here’s where you venture into unfamiliar waters. This menu lets you pick any table occurrence on your graph.
Figure 7-30. The Specify Field window has always had a Table Occurrence pop-up menu; you’ve just been told to ignore it until now. This menu shows a list of all the table occurrences on the graph. FileMaker is smart enough to know which ones are related from the current layout’s perspective. It breaks the list into two groups: related tables and unrelated tables. Right now you don’t have any unrelated tables because the entire graph is connected in one group.Choose Customers from the pop-up menu, then, from the field list, select the First Name field. Click OK
FileMaker adds the Customers::First Name field to the layout. It just says “::First Name” on the layout, but it does belong to the Customers table occurrence.
Change the field label FileMaker created for the new field to Customer First Name. Then, add the Customers::Last Name field to the layout too.
Change its name, too, so you can remember what these fields are for.
When you’re finished, switch back to Browse mode, saving your layout changes when prompted.
Adding or Editing Data
In Browse mode, the new field doesn’t look all that impressive yet. That’s because you don’t have any data in your database. You’ll really see the magic of relationships once you add some, starting with some customers. Open your database and go to the Customers layout.
If the status area shows there are no records, choose Records → New Record.
FileMaker creates one record for you automatically, but only in the first table you added. Unless you happened to create this table first, you will need a new Customer record.
Name this customer Kesuke Miyagi by filling out the First Name and Last Name fields. Then, create a second customer record with the name Daniel LaRusso.
Notice that FileMaker has already filled in the Customer IDs for you—C00001 and C00002. Time to add a job or two.
Switch to the Jobs layout, and, if necessary, create a new record. In the Name field, enter Paint the Fence.
Now you have one job record, but it isn’t attached to a customer yet, so the Customer First Name field is empty.
Note
If you try clicking in the Customer First Name field right now, you’ll get another surprise: FileMaker won’t let you click in the field. It looks like a field, it smells like a field, but it doesn’t work like a field. You’re seeing the First Name field from the related Customer record, but there is no related customer record. No record, no field: No click.
In the Customer ID field, type C00001, and then press Tab.
Presto! As soon as you leave the Customer ID field, FileMaker goes to work finding the correct Customer so it can show you his name. Like magic.
Editing Related Data
To see how editing works in a relational database, add another Job record. Using the same steps as above, name it “Wax the Car,” and attach it to Customer C00001 as well. It should then show the same customer name. Now try this:
Change the value in the Customer First Name field to Mister.
Now the Wax the Car job is attached to “Mister Miyagi.” But who’s the Paint the Fence job attached to? Kesuke Miyagi or Mister Miyagi?
Switch to the first Job record using the Book icon in the status area.
Drum roll… Paint the Fence is Mister Miyagi’s too.
Switch to the Customers layout and then switch to the first record.
Ta da! The customer record itself also now says Mister Miyagi.
If you don’t think that’s cool, you need your geek level adjusted.
Now you’ve seen a relational database in action. From a Job record, you can view data from the related Customer record. You can even edit that customer data directly from the Job record. The power of a relational database is all about working with related data like this.
Tip
If you want to protect your data so it doesn’t get changed out of context, set the related field’s behavior so that it can’t be entered in Browse mode. Switch to Layout mode and choose Format → Field/Control → Behavior (Section 6.3).
Showing multiple related records
Adding the customer name field to the Job layout makes good sense because a job is attached to exactly one customer (it’s a to-one relationship). But what if you want to go the other way? Suppose you put the Job::Name field on the Customers layout. How would that work since a customer can have more than one job? (In fact, Mister Miyagi has two jobs right now.)
There are two answers to this question. The less interesting answer is that you can go right ahead and put that field on the Customers layout if you want. It will work fine. Since FileMaker can’t show two values in one field, it just shows the first related record—in this case, Paint the Fence. (You can try for yourself if you want.)
The more interesting answer is portals. A portal is a layout object that makes viewing, editing, and even deleting multiple related records possible. The portal shows a list of records from a related table right on the layout. It can show as many rows (records) as you want, and you can even add a scroll bar so you can scroll through lots of related records in a small space. You can also edit related field data right inside the portal. When you add a portal to your layout, you get to decide which records it shows, how they’re sorted, and what the portal looks like. For example, you can add a border to your portal, or change the background color of each row.
(See the box on Section 7.4.4.2 for details on all the options available for portals.) The Customers table has a to-many relationship to Jobs, so it’s a perfect candidate for a portal.
Portals are easy to create. The following steps take you through an example in the Customers database:
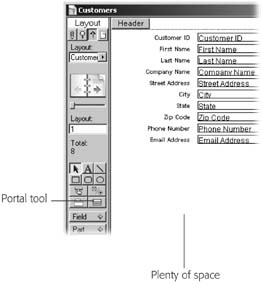
In the Customer layout, switch to Layout mode. Drag the body part a few inches down.
The Customers layout is a full one. You’ll need more room for your portal.
Click the Portal tool in the status area.
You can see what it looks like in Figure 7-31.
Figure 7-31. The Portal tool is the only Layout mode tool you’ve never used. It works like the Shape and Button tools. Select it first, and then drag a rectangle on the layout. FileMaker creates a new portal inside that rectangle. You can also use this picture as a guide to show how much extra space you should make for your portal to live in.Drag a large rectangle in the space below the Customer fields (you can use Figure 7-31 as a guide, but don’t worry too much about the size; you can always resize the portal later).
When you release the mouse, FileMaker displays the Portal Setup dialog box. It’s displayed in Figure 7-32.
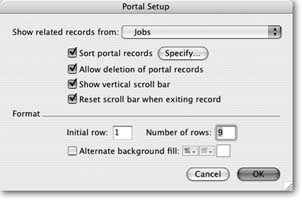
Make sure the “Show related records from” pop-up menu is set to Jobs.
You’re telling FileMaker to show data from the Jobs table occurrence—in this case all the Jobs for the customer.
Turn on the “Sort portal records” checkbox. In the Sort dialog box that appears, add the Name field to the Sort Order list, and then click OK.
When FileMaker shows Job records for a customer, they’ll be sorted alphabetically by job name.
Figure 7-32. In the Portal Setup dialog box, you can choose which table you want to show records from and how those records should be sorted. You can also decide which related records to show and adjust the look of the portal. See the box on Section 7.4.4.2 for details on all these options.Turn on “Allow deletion of portal records.”.
With this option turned on, you can delete records in the Jobs table right from the Customers layout, saving yourself a trip to the Layout pop-up menu.
Turn on “Show vertical scroll bar.”.
A portal has a fixed size on the layout. If you have more records than fit in the allotted space, two things can happen. It can either ignore the additional related records, or you can put a scroll bar on the portal. With a scroll bar, you’ll be able to view all the related jobs, no matter how many exist.
Turn on “Reset scroll bar when exiting record.”
If you’ve scrolled way down in a lengthy list of related records, the first records don’t show up anymore, naturally. By selecting this option, you’re telling the portal to go back to the first record anytime you click out of (or exit) a portal record.
Note
Some people really hate seeing the portal pop back up to show the first record. They want the portal to stay scrolled even if they click out of that related record. To appease these folks, leave the option turned off. But be ready to reassure these malcontents that sometimes FileMaker has no choice but to redraw the data in the portal, and when that happens, the portal pops back to related record number one. That’s just how it is.
Click OK.
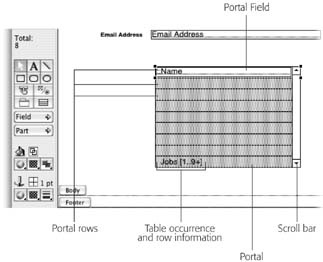
The Add Fields to Portal window take the Portal Setup window’s place. From here, you get to pick which fields from the job table should be displayed in the portal.
From the Available Field list, select the Name field, and then click Move.
FileMaker adds Jobs::Name to the Included fields list. Click OK again.
Your layout now has a portal. It looks just like the one in Figure 7-33.
Editing fields through a portal
Switch to Browse mode to see your portal in action. If you look at Mister Miyagi’s record, you’ll see both his jobs listed in the portal. Like any related field, you can click into either Job Name field and edit the data therein. When you do, the Job record itself is updated.
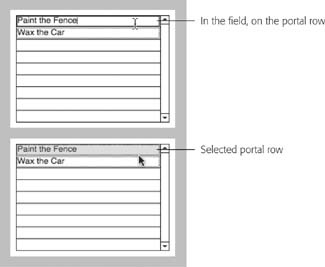
You can also delete records through the portal. Click the Paint the Fence row in the portal. When you do, you’ll either enter the field itself, or select the portal row. Figure 7-34 shows the difference.
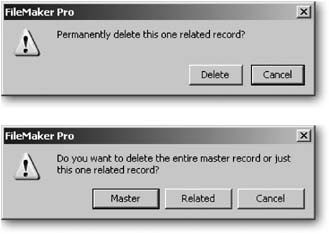
When you’re on a portal row, the Delete Record command takes on new meaning. If you have an entire portal row selected, FileMaker assumes you want to delete the related record—the one you’ve selected—not the record you’re sitting on. If you’re in a field on the portal row when you choose the command, FileMaker instead asks you which record you want to delete: The Master record or the Related record. Figure 7-35 shows each message.
If you’re not on a portal row, the Delete Record command works exactly like it does on a layout that has no portals.
You’ve covered a lot of ground in this chapter. You now have a full-fledged relational database, and a good idea of how it works. But manually typing arcane customer numbers into foreign key fields and bouncing from layout to layout to add a job is probably not your idea of efficiency. In the next chapter you’ll learn how to harness all the power of the FileMaker features you’ve learned so far: Value lists, field formats, buttons, and additional relationship options all combine to make data entry a breeze, even in a complex database with several tables.