
Creating Virtual Cubes
If you’re familiar with a relational database system, you’ve encountered views (or queries, as views are known in Microsoft Access). In a relational database, a view is a mechanism for combining values from multiple tables into what appears to be a single table, or it’s a mechanism for filtering the rows or columns of a table to see only a part of the table. In Analysis Services, a virtual cube provides some of the functions of a relational view.
A virtual cube, however, is much more restrictive than a relational view. In a relational view, you can combine essentially any two tables into a single view, and you can create extremely flexible filters to restrict the rows seen in the view. When you use a virtual cube to restrict the contents of a cube, you’re limited to including or excluding measures and entire dimensions. You cannot include a portion of a dimension. For example, you could not create a virtual cube to display only 1998 values from the Sales cube. Likewise, you could not create a virtual cube to display years and quarters but omit the month level in the Time.Fiscal dimension of the Sales cube. If you include any member of a dimension, you must include all the members of the dimension.
Nonetheless, you can use a virtual cube to effectively remove dimensions or measures from a cube. And you can also use a virtual cube to combine measures from more than one cube.
Remove Dimensions and Measures from a Cube
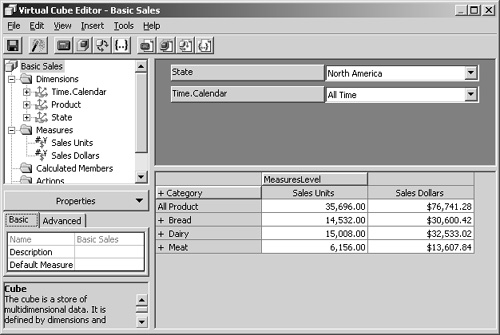
The Sales cube of the Chapter 4 database contains five dimensions, two of which are hierarchies of a single Time dimension. Five dimensions in a browser window can be confusing or intimidating to some people. Or perhaps you don’t want certain people to be able to see sales by employee. The Sales cube also contains six visible measures (plus Count, which is set as not visible). Once again, this many measures might be too confusing or too revealing, so you might create a virtual cube that is a subset of the physical Sales cube:

The Analysis server does need to process a virtual cube—processing creates enough files to identify the cube and indicate how to relate the virtual cube to the original cube—but unless it has to process the source cube, this processing is almost instantaneous.
Combine Measures from Multiple Cubes
The Sales cube contains actual sales information. The Sales Forecast cube contains forecasted values that you added earlier in this chapter. Suppose that you want to compare forecast units with sales units. You can use a virtual cube to compare measures from two cubes:
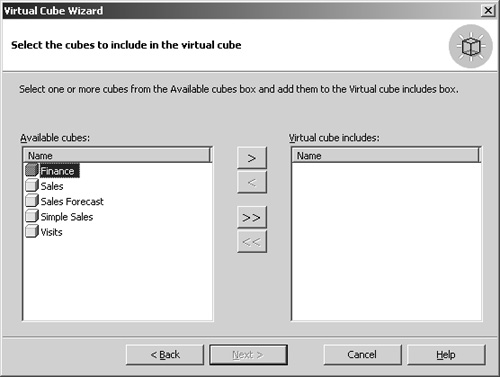
1. | Right-click the Cubes folder, and click New Virtual Cube. Click Next to bypass the welcome screen. In the list of available cubes, double-click both Sales and Sales Forecast. |
2. | Click Next. The Sales cube and the Sales Forecast cube both contain a measure named Sales Units. These are the two measures you want to compare. The virtual cube requires a unique name for each measure. |
3. | In the Available Measures list, double-click Sales Units from the Sales cube. Then double-click Sales Units from the Sales Forecast cube. The wizard gives the name Sales Units 1 to the newly added member. 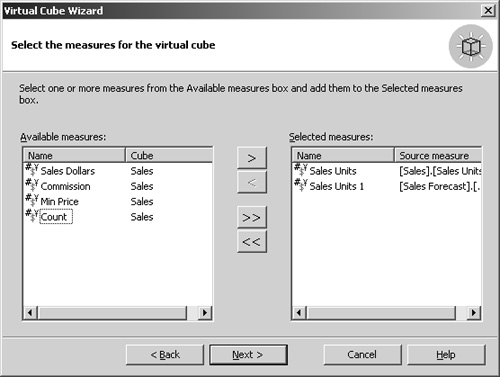
|
4. | Select the Sales Units 1 member name, and press F2. When the name becomes selected, type Forecast Units as the new name for the measure and then click Next. |
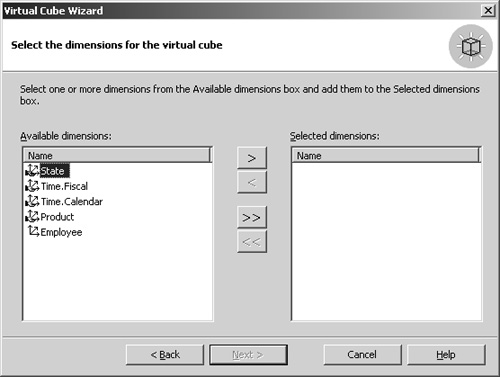
5. | In the Available Dimensions list, double-click Product, Time.Calendar, and Scenario and then click Next. 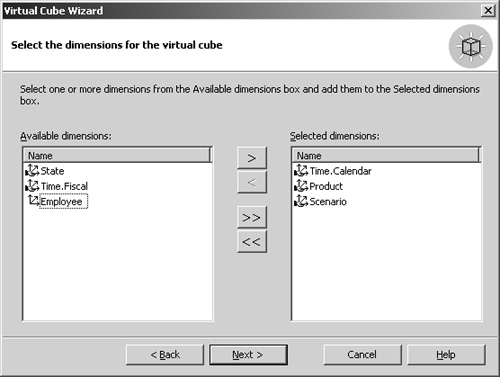
|
6. |
When you use a virtual cube to compare measures from multiple cubes, you must select a measure from each cube you want to include in the virtual cube. The wizard automatically removes any cubes that do not have a measure. It’s technically possible to combine two cubes that do not have a common shared dimension, but none of the cells in the virtual cube will contain a value.
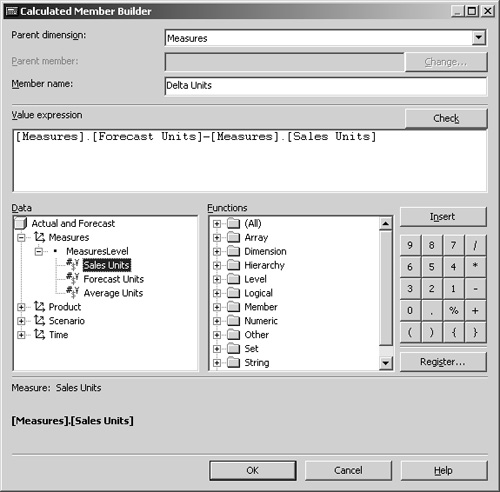
Create Calculated Members in a Virtual Cube
The Actual And Forecast virtual cube contains measures from the Sales cube and the Sales Forecast cube. Both cubes contain the Product dimension and the Time.Calendar dimension. In the Sales Forecast cube, however, the Subcategory and Product levels of the Product dimension were disabled, as was the Month level of the Time.Calendar dimension. In addition, only the Sales Forecast cube includes the Scenario dimension. You can see what happens when you combine cubes with dimensions that don’t match.
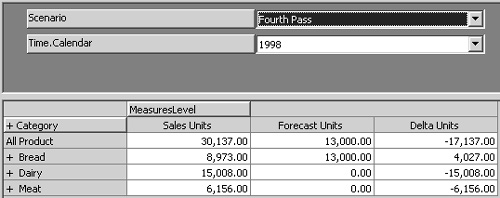
Virtual cubes can effectively remove dimensions or measures from a cube, combine measures from multiple cubes that share at least one common dimension, or both.