Previewing Analysis Manager
Analysis Manager, one of the components of Microsoft SQL Server 2000 Analysis Services, is the tool you use to administer the Analysis server. Analysis Manager is a snap-in application within Microsoft Management Console (MMC), a common framework for hosting administrative tools. If you’ve used the Microsoft SQL Server Enterprise Manager or another MMC application, Analysis Manager should appear familiar. If not, you might find that an MMC application bears some resemblance to Windows Explorer, with a tree view in the left pane and detailed information in the right pane.
Explore the Console Tree
Before creating a database of your own, you can use Analysis Manager to explore the FoodMart 2000 sample database that is installed as part of the Analysis Services sample files.
1. | To start Analysis Manager, click the Microsoft Windows Start button, point to Programs, point to the Microsoft SQL Server group, point to the Analysis Services group, and then click Analysis Manager. (If you did not choose the default installation options, your path to Analysis Manager might be different.)  The tree view in the left pane of the MMC is called the console tree and is the primary means for navigating Analysis Manager. Each level of the tree contains folders, OLAP objects, or both. The Analysis Servers folder displays a list of servers that are available to you. Each server displays the name of the computer running it, since only one server can run on a single computer. The server name acts as a folder for OLAP databases on that server.
 | |
2. | Expand and select the Analysis server you want to browse—most likely the computer where Analysis Manager is running. (To expand the folder, click the plus sign to the left of the icon.) A list of databases appears; FoodMart 2000 is probably the only one you see. In Analysis Services, a database acts as a container for related cubes, dimensions, and other analysis objects. | |
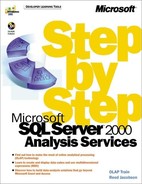
3. | Expand and select the FoodMart 2000 database in the console tree to see the main folders: Data Sources, Cubes, Shared Dimensions, Mining Models, and Database Roles.  A single OLAP database can interact with more than one relational database, and the Data Sources folder stores the list of connected relational databases. Likewise, an OLAP database can contain multiple cubes and dimensions, so each of these objects has its own folder. The Mining Models folder is used for the data mining functionality that is new in SQL Server 2000. The Database Roles folder is used to support client security. Most of the time, you’ll work in the Cubes and Shared Dimensions folders.
| |
4. | Expand and select the Cubes folder to see the six cubes already created in the FoodMart 2000 sample database. As discussed in Chapter 1, “A Data Analysis Foundation,” a cube is the storage location for values that can be included in an analytical report. |
Explore Menu Commands
An MMC snap-in application, such as Analysis Manager, has two levels of menus. The top-level menus—Console, Window, and Help—belong to MMC itself and do not apply to the current snap-in application. The second level of menus is actually a toolbar. This toolbar contains the Action, View, and Tools menus, which are specific to the current MMC snap-in application—in this case, Analysis Manager. The Action menu is context-sensitive—that is, the commands that appear on the menu change depending on the object you select in the left pane—in the console tree. The same commands that appear on the Action menu also appear on a shortcut menu if you right-click an object in the console tree. Using the FoodMart 2000 database as an example, explore the different menu commands available to different objects.
|
The Server Action menu contains a Migrate Repository command, which moves the repository from Microsoft Access to SQL Server, as explained in Chapter 1. |
1. | Click the server object, and then select the Action menu. A list of commands related specifically to the server appears. Press the Escape key to close the menu.
|
2. |


Because different commands are available for different objects, you can’t simply scan through all the menus on the menu bar, hoping to recognize the command you want as you can in most Windows applications. Rather, you must think of the object the command applies to, select that object, and then look for the command on the menu.
Explore the Detail Pane
The right pane in Analysis Manager displays detailed information that changes depending on the object you’ve selected in the console tree. It has up to three tabs—Getting Started, Meta Data, and Data—each of which displays a possible view. The Getting Started tab is available regardless of which object is currently selected; it displays links to the online tutorials and to important Microsoft Web sites. The Meta Data tab is available for every object under the Analysis Servers folder; it displays meta data for the selected object. Meta data means data about data—that is, data that describes the nature of the database, as opposed to the data contained in the database itself. The Data tab is available only when a cube is selected in the console tree; it displays a simple browser for reviewing data in the cube.
Note
The right pane displays the Getting Started, Meta Data, and Data tabs only when HTML mode is enabled. To enable or disable HTML mode, click the View menu on the toolbar and then click HTML.
1. | Click the FoodMart 2000 database object, and select the Meta Data tab at the top of the right pane.  The Meta Data tab displays information about the FoodMart 2000 database. The Meta Data tab is context-sensitive. The information it displays depends on the object you select in the console tree.
 |
2. | |
3. | With the Sales cube selected, click the Data tab at the top of the right pane. The right pane changes to show a simple cube browser displaying the data in the FoodMart 2000 Sales cube.  In addition to using the Data tab on the right pane, you can display the simple browser by selecting a cube and clicking Browse Data from the Action menu.
 |
4. | Collapse the FoodMart 2000 database to avoid distractions as you create your own database and cube. |
