Managing the Pool of Potential Aggregations
The Storage Design Wizard selects aggregations from a pool of potential aggregations. As a default, the pool of potential aggregations includes all levels from all dimensions. Analysis Services includes two techniques for controlling the pool of potential aggregations. One option is to use actual usage patterns to affect the rankings within the pool. Another option is to eliminate dimension levels from the pool entirely.
Preparing for Usage-Based Optimization
The algorithm in the Storage Design Wizard is sophisticated, but it can base its decisions solely upon structural factors such as the number of members in different levels of a dimension or the number of rows in a fact table. The Storage Design Wizard can’t take into consideration the way a particular type of query actually performs. Fortunately, Analysis Services provides a tool for just that.
One of the most powerful features of Analysis Services is usage-based optimization. It allows you to select aggregations based on actual queries submitted to the server—that is, on the usage of real-world users. The Usage-Based Optimization Wizard behaves exactly like the Storage Design Wizard except that it factors into the equation the actual usage patterns.
Populate the Usage Log
Usage patterns come from a query log. The query log is an Access database named Msmdqlog.mdb located in the folder containing the Analysis Services executable files (the same folder that contains the default repository database). By default, the server logs one out of ten queries.
If you want to experiment with usage-based optimization, increase the sampling frequency temporarily to make it easier to add entries to the log. To change the sampling frequency, first change a property of the Analysis server. Then stop and restart the Analysis server service for the change to take effect.


Note
Queries that can be answered by the client cache are never seen by the server and thus are not logged. To clear the client cache, close and restart the client browser application and then reconnect. (When using the sample browser in Analysis Manager, you must close and restart Analysis Manager.)
View Usage Analysis Reports
You don’t need to review usage analysis reports before you apply usage-based optimization. However, reviewing these reports will help you decide whether to adjust the aggregations for a cube.
1. | Right-click the Sales cube, and click Usage Analysis to start the Usage Analysis Wizard. |
2. | |
3. | Look at the available options for setting criteria, and then click Next without setting any criteria.  You can filter the report based on the date a query ran, the number of times a query ran, how long it took, or which user executed it.
 |
4. | |
5. | Click Back twice, select the Query Response Graph report, and click Next twice to see the graph. 
|
6. | Click Finish to close the Usage Analysis Wizard. Note Because the query log is stored in an Access table in a logical format, it can be read by custom applications to analyze usage. However, one column in the log is cryptic: Dataset. It contains a text string, each character of which is the level number of a dimension in the cube. This is the same format used to describe aggregations, as explained in “Inspect aggregations for two dimensions” earlier in this chapter. Unless you change the number of dimensions in a cube, each log entry for a cube will have a Dataset string with the same number of characters. The column uses a string, rather than a number, because a dimension can have over nine levels. 1–9, 0, and A–N represent the 24 possible levels in a dimension. |


Use the Usage-Based Optimization Wizard
Once you’ve accumulated a set of queries in the usage log, you can use the Usage-Based Optimization Wizard to design aggregations. The Usage-Based Optimization Wizard is essentially the Usage Analysis Wizard attached to the front of the Storage Design Wizard. First you select the logged queries that should apply, and then you design aggregations.
1. | Right-click the server and click Properties. Click the Logging tab and then click Clear Log. Click Yes, and then click OK to close the Properties dialog box. |
2. | Right-click the Sales cube in the Chapter 8 database, and click Browse data. Spend some time browsing the data, and then close the Cube Browser window. |
3. | Right-click the Sales cube, and click Usage-Based Optimization. Click Next to leave the welcome screen. |
4. | On the criteria screen, select the Queries That Ran More Than check box and type 0 in the Times box. Click Next to continue to review the filtered queries. 
|
5. | On the Review The Results screen of the wizard, click Next. The wizard automatically proceeds to the screens from the Storage Design Wizard. As with the regular Storage Design Wizard, if aggregations already exist, you can add aggregations or erase aggregations and create new ones. 
|
6. | Click Replace The Existing Aggregations, and then click Next. |
7. | Click the MOLAP storage option, and click Next. |
8. | |
9. | Click Next, click Process Now, click Finish, and then close the Process log window. |
10. | In the console tree, right-click the Server, click Properties, and click the Logging tab. Change the query setting back to 10, and click OK. Click OK to close the message box, and then stop and restart the Analysis server service. |
 This time, using the selected queries from the log, the wizard concludes that a 20 percent performance gain can be achieved with a single aggregation. (Your results might differ.)
Consider the Server Cache
The query you execute most frequently might not be the one that’s most in need of aggregations. Both the PivotTable Service and the Analysis server maintain caches, on the client and on the server, respectively. Suppose that a cube has no aggregations and that you frequently review the Product Category by Month query. The first time the query executes, the Analysis server will need to go to the detail level to dynamically assemble the totals, but then it retains those totals in the server cache. As additional people make queries at the same level of detail, the Analysis server is able to respond instantaneously to the request, simply from the cache. Because the Product Category by Month query is so popular, its values are never removed from the server cache.
When you apply usage-based optimization, you must decide whether you want to optimize for the popular Product Category by Month query. If you frequently perform an administrative task that clears the server cache—such as shutting down the server or reprocessing the cube—you should include queries to the server cache in the optimization pattern. If you rarely perform a task that clears the server cache, you can exclude the server cache from the selection criteria.
Remember, however, that queries answered from the client cache never even make it to the log. Your only choice is regarding the server cache.
Manipulate the Query Log
Suppose that you have accumulated a significant number of entries in the log for a cube. You then change the definition of the cube, which makes the entries in the query log no longer meaningful. Leaving those entries in the log as you perform usage-based optimization could lead to invalid optimization.
The Logging tab of the Server Properties dialog box has a button that will clear all the entries from the log. The server log, however, contains entries for all the cubes in all the databases on the server. If you modify a single cube, you probably don’t want to erase the log for all cubes.
If you no longer need the old log data, right-click the cube, click Usage Analysis, and click Next twice. This displays all the queries in the log for that cube. Click Delete Records at the bottom of the report to clear only the log for that one cube.

If you do want to retain the old query logs, you can extract them from the log database or you can filter for only new log entries when optimizing aggregations. On the Usage Based Optimization Wizard’s criteria screen, select the Queries For The Dates check box, click After in the drop-down list, and select the date the cube structure was last modified in the date box.
Manage Aggregations for a Dimension
The Storage Design Wizard searches the pool of all possible aggregations when deciding which aggregations to create. Usually, the wizard does a good job of deciding which aggregations will have the most positive effect. Sometimes, however, you know something about a dimension that the wizard can’t know. For example, suppose that you’re designing a cube that will have dozens of users. All the users except one need only three dimensions in the cube. That one person needs a fourth dimension, and that fourth dimension is large and complex. All users agree that the fourth dimension shouldn’t slow down the rest of the queries. The user making the special request doesn’t mind having queries that use that dimension run slowly.
This is an example of a situation in which you as the cube designer know information about the cube that is unavailable to the Storage Design Wizard. The unusual status of this dimension might not even be captured properly by query logs. In Analysis Services, you can control how a dimension enters the pool of available aggregations. Normally, all levels of a dimension interact with all dimensions of all other dimensions. You can specify two other aggregation options for a dimension: Top Level Only and Bottom Level Only.
Consider a table that shows all the possible aggregations for the Time State cube—a cube that contains only the Time and State dimensions. With the default setting for both dimensions, the pool of available aggregations for the Storage Design Wizard consists of all 16 possible combinations of levels. If you flag the State dimension as Top Level Only, 12 of the possible combinations are removed from the available pool. The four remaining aggregations—marked Top Only in the grid—correspond precisely to the pool of available aggregations if Time were the only dimension in the cube.
| ALL | Country | Region | State | |
|---|---|---|---|---|
| ALL | Top Only | |||
| Year | Top Only | |||
| Quarter | Top Only | |||
| Month | Top Only |
In other words, flagging the State dimension as Top Level Only effectively removes the penalty for having the dimension exist. As long as a user doesn’t traverse the hierarchy of the State dimension, the value for the State dimension will be the All level, and the All level for that dimension will have aggregations that make responses very fast. That is precisely the example scenario given at the beginning of this section. The fourth dimension—included in the cube only for the benefit of one user—doesn’t penalize any users who don’t use it, but the person who does traverse the hierarchy of the dimension might experience slower than normal response to queries.
In the two-dimensional Time State cube, if you were to flag both dimensions as Top Level Only, you would end up with only one possible aggregation for the cube—the aggregation with a single row that contains the total value for the measures summarized for the entire cube. Flagging all the dimensions of a cube with Top Level Only would completely defeat the purpose of creating aggregations.
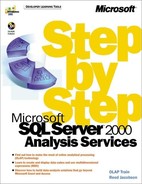
The Bottom Level Only flag has the opposite effect. It prevents any aggregations for a dimension above the lowest level of detail. Consider again the table of possible aggregations for the Time State cube. Flagging the State dimension with Bottom Level Only removes from the pool all but four of the aggregations, the ones marked Bottom Only in the table.
| ALL | Country | Region | State | |
|---|---|---|---|---|
| ALL | Bottom Only | |||
| Year | Bottom Only | |||
| Quarter | Bottom Only | |||
| Month | Bottom Only |
Even though the boxes in the table all appear as the same size, aggregations closer to the upper left corner of the table contain few values and aggregations closer to the lower right corner of the table contain many values. Setting a dimension to Bottom Level Only forces all users to pay a performance penalty for a dimension, even those who never use the dimension. You might set a dimension to Bottom Level Only if users are almost always slicing a cube by the lowest level of that dimension. This option is much less useful than the Top Level Only option. For most cases in which you might want to choose the Bottom Level Only option in a dimension (for example, where the bottom level has only a few more members than the top level), the Storage Design Wizard would automatically select the appropriate aggregations even without flagging the dimension.
In the two-dimensional Time State cube, if you were to flag both dimensions as Bottom Level Only (with MOLAP storage mode), the result would be to create no aggregations at all since the bottom right aggregation of the table is the detail level of the cube.
You can set the Aggregation Usage property for a dimension to Custom which allows you to enable or disable specific levels within the dimension. In most cases, using the Storage Design Wizard or the Usage-Based Optimization Wizard will give much better results than attempting to control aggregation for levels within a dimension manually.
Setting the Aggregation Usage flags for a dimension merely controls how levels from the dimension will enter the available pool for consideration by one of the Storage Design Wizards. Changing the setting has no effect until you run a wizard to design new aggregations for the cube.