
CHAPTER
SIXTY-FIVE
INTEREST-RATE CAPS AND FLOORS
Director
Capital Markets/Market Risk Manager
Bank of America Merrill Lynch, London
RADU S. TUNARU, PH.D.
Professor of Quantitative Finance
University of Kent, Business School
Caps and floors and their twin instrument swaptions have become the main interest rate derivatives in fixed income markets. In this chapter, we discuss these important derivatives, trying to offer some insights without delving into complex mathematical modeling. We start by first describing caps and floors, their hybrid products and their potential applications. Then we consider some simple but still robust pricing considerations based on Black’s formula for caplets and floorlets, the main components of caps and floors. The importance of the forward curve volatility and skew for calibration is pointed out through examples in the last part of the chapter. The market for caps/floors is different from the swaptions market, but since both types of products are related intrinsically to the forward rates and their volatilities, they can be combined to define advanced trading strategies.
CAPS AND FLOORS DEFINED
By design, a cap creates a ceiling on a floating interest rate. If market rates move above the cap rate, the buyer will receive the difference between the strike rate of the cap and the underlying index rate, accrued over the corresponding period. This option can only be exercised on specific settlement dates agreed between the buyer and the seller. For instance, the bank that borrows money on a floating-rate basis can purchase a cap to protect against a rate rise above the strike. Consequently, the borrower’s interest rate costs will never exceed the cap’s strike rate.
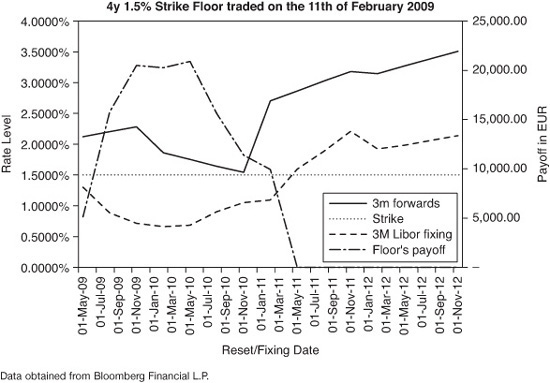
A floor is the opposite of a cap. If market rates move below the floor rate, the buyer receives the difference between the floor’s strike and the underlying rate. It is common for treasurers and asset managers to buy floors as a way of locking in a minimum rate of return on floating-rate assets. The following example illustrates this point. Anticipating that market rates will stay low for a period of time, an asset manager decides to buy a floor at 1.5% against the return on a floating-rate asset linked to three-month EURIBOR. On February 11, 2009, the asset manager contacts a bank and agrees to buy a EUR 10 million notional, four-year maturity, 1.5% strike floor on three-month EURIBOR. Exhibit 65–1 shows the three-month forward curve on the trading day, the realized three-month EURIBOR rates, the actual payoff of the floor, and the potential payoff for the remaining fixing dates based on the forward curve as of February 14, 2011. On each of the floor’s reset dates when three-month EURIBOR fixes below the 1.5% strike, the loss on the asset is offset by the floor’s positive payoff. The actual floor on the asset’s return is lower than 1.5% because of the premium paid by the asset manager to enter the floor. This cost can be regarded as a running spread over the life of the floor and subtracted from the floor’s strike. If in our example the premium would have been 40 basis points (bps), then, disregarding any discounting effects from funding, the average cost per year would be 10 bps and the actual floor level would be 1.40%. (The correct approach is to divide the premium by the annuity covering the life of the floor.)
EXHIBIT 65–1
Example of a Floor Option
COLLARS AND CORRIDORS
A collar is a trading strategy created by simultaneously purchasing a cap (floor) and selling a floor (cap) with identical maturities, reference rates, and notionals but different strikes. Usually, the cap and the floor are out-of-the-money.
Because the premium paid on the cap (floor) is partially offset by the premium received on the floor (cap), the collar is a cheaper way of hedging risk. This cost reduction comes at the price of giving up the potential benefit of favorable rate movements outside the range defined by the two strikes. A borrower entering a collar is hedged against a rise in the interest rates above the cap strike but gives up any benefit when the rates move below the floor strike. In between the two strikes, the borrower continues to pay the index rate. Unlike a cap or a floor, a premium payment may or may not be necessary depending on the two strikes, volatilities and notional amounts. When the premium of the cap and that of the floor are equal, a “zero cost collar” can be structured. Outside the range defined by the two strikes, a collar is equivalent in terms of cash flows to an interest rate swap paying a fixed-rate and receiving a floating-rate.
A corridor is a strategy in which the cost of purchasing a cap is offset by the simultaneous sale of another cap with a higher strike. The buyer is hedged against an increase in the index rate between the two strikes, but loses this protection if the rates go above the higher strike. It is possible to offset entirely the cost of the lower strike cap by increasing the notional of the higher strike cap. However, if the index rate goes through the higher strike, the buyer will no longer be protected because of the notional mismatch between the two caps.
HYBRID TYPE INSTRUMENTS
Following the success of the caps and floors market, a wide range of hybrid type instruments have appeared, trying to tailor the risk to clients’ specifications. We describe a few of the more popular ones below.
A conditional premium cap/floor is a contract between two parties in which the seller agrees to pay the buyer if the underlying interest rate index is above/below the fixed strike rate (cap/floor) on the specified fixing dates. The seller pays the difference in interest (i.e., between the index and the strike rates) adjusted for the relevant day count fraction. The buyer pays the seller a premium, as a percentage of the notional, only on those occasions when the option is in-the-money. Thus, if the index never fixes above/below the strike rate, the buyer will never have to pay a premium.
A chooser cap/floor is an interest rate cap/floor with a fixed number of possible exercises out of the total market fixing times. If the interest rate index fixes above the cap strike/below the floor strike, more times than the agreed number of exercises, then the buyer will lose the protection. This contract is cheaper than a vanilla cap/floor as its premium is related to the number of activation periods. The premium is paid upfront.
Another hybrid product is a reset strike cap/floor, which is just a standard cap/floor that has a secondary strike rate. If the underlying index rate is higher/lower than this secondary strike level, then the cap/floor strike is changed to the reset strike level for that period. The premium is quoted as a percentage of the initial notional and it can be paid up front or pay-as-you-go.
POTENTIAL APPLICATIONS OF CAPS AND FLOORS
Here are a few examples of the potential use of caps and floors:
• Hedging of options embedded in assets/liabilities: It is common for insurance companies and pension funds to use caps/floors to hedge the risk arising from guaranteed-payoff annuity products.
• Hedging floating-rate assets/liabilities: Debt managers can buy floors to protect against potential losses on outstanding fixed-rate debt when rates fall (fixed coupon debt can also be swapped into floating-rate debt and a cap can be added to fix the maximum rate).
• Create synthetic positions: Using caps and floors alone or in combination with other derivatives, investors can achieve a wide variety of payoff profiles.
• Enhance returns: Hedge funds frequently use caps/floors to express views on the level of interest rates at different points in time. By purchasing options, they have a limited downside (the paid premium), but a virtually unlimited upside if their views prove correct. In general, these positions are not hedged. If these strategies are profitable, hedge funds can put hedges in place to lock in their profits or they can unwind the positions before expiry. Sometimes, these funds sell caps and floors to enhance the return on investments.
CAPLETS AND FLOORLETS
When purchasing a cap or a floor, the buyer is actually entering a collection of sequentially maturing European style options with the same strike called, respectively, caplets or floorlets. A caplet/floorlet payoff is positive if the underlying rate is higher/lower than the strike, essentially allowing the buyer to receive the underlying rate floored at the strike or pay the underlying rate capped at the strike.
A typical caplet/floorlet uses the reference rate, for instance three-month LIBOR/EURIBOR. Usually, the rate (L) is observed at the beginning of the caplet/floorlet calculation period on the reset date (DR), which, for the major currencies, is two business days before the actual start date of the caplet/floorlet (DS). At expiry (DE) the rate is compared with the strike rate (K) and the payoff is accrued for the duration of the calculation period (from DS to DE). The payoff of a caplet on the payment date can be written as:
max [LR(tenor) − K, 0] cvg (DS, DE)
where cvg(DS, DE) is the accrual period expressed as a year fraction calculated using the day count convention dictated by the respective currency (usually Actual/360; number of days during the period from time DS to DE normalized by the number of days in a year).
The market convention is to use the Black formula (the log-normal model or sometimes the normal model) to price caplets/floorlets.1 Exhibit 65–2 summarizes the pricing formulae for each of the two versions of the model:
EXHIBIT 65–2
Black’s Pricing Formulae for the Normal Model and Log-normal Model

We present a numerical example based on the log-normal model for the calculation of the price of a caplet-floorlet straddle. The details of the option are presented below for a valuation date of February 14, 2011, that is equivalent to tR = 4.99421:
![]()
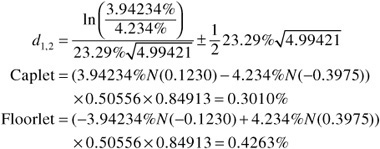
Because caplets/floorlets are essentially calls/puts on interest rates, put-call parity holds. A long position in a caplet combined with a short position in a floorlet is equivalent to a position in a forward rate agreement (FRA):
Caplet − Floorlet = (F − K) cvg (tS, tE) df (0, tE) = FRA
Hence, for pricing purposes, only the caplet or the floorlet needs to be priced.
The validity of Black’s model has been discussed in Hull.2 If interest rates over the contract’s life are assumed to be either constant or deterministic, the forward price equals the futures price, making Black’s log-normal model appropriate. Furthermore, Black’s model holds when interest rates are stochastic, provided that the discounting is done at today’s maturity tE zero-rate, given by df (0, tE). To summarize, Black’s model for interest rates exhibits the same shortcomings as the Black-Scholes model for equities, namely that it assumes constant volatility.
INSIGHTS ON TRADING CAPS AND FLOORS
Caps/floors trade in the market either spot starting (i.e., as an A-year maturity trade), or forward starting, in which case the market convention is to name the trade as an A × B cap/floor, meaning the contract kicks-in after A-years and matures in B-years’ time from the spot time. When the underlying rate is a LIBOR rate, the number of caplets and floorlets is usually determined by the tenor of the rate; that is, if the tenor is three months, the trade will have four caplet/floorlets per year.
The distinction in quotation is very important for the calibration of models using market data. The array of prices with various maturities imply a volatility surface and various models are judged in terms of performance depending on how well they can fit this surface without introducing arbitrage.
Exhibit 65–3 shows the prices of some at-the-money (ATM) forward starting cap/floor straddles for EUR, GBP, and USD (as of February 14, 2011) that could have been seen on different broker screens in financial markets.
EXHIBIT 65–3
Cap/Floor Straddles Market Prices (as of February 14, 2011)

The most common reference rates for these contracts are LIBOR or equivalent rates for the most liquid currencies: EUR, USD, GBP, and JPY. However, there is a large market for caps and floors on constant maturity swaps (CMS) rates and CMS spreads. These latter instruments can trade as single look options (one caplet/floorlet resetting and paying in arrears) or as regular spot or forward starting with quarterly or semiannual coupons. The difference with the CMS cap/floor contract is that the interest rate index is a swap rate, the forward rates are calculated from the forward swap rates plus a convexity adjustment. The premium is quoted as a percentage of the initial notional amount and it is generally paid either up front or pay-as-you-go, being spread over the life of the contract.
Since caps (floors) are collections of caplets/floorlets, the ATM strike rate is chosen such that all the caplets/floorlets are close to ATM. The convention is to define it as a weighted average of the ATM strikes (forward rates) of the individual caplets/floorlets. The weights are the discount factors corresponding to the expiry of each caplet/floorlet. The ATM strike satisfies the following equality (‘cvg’ here denotes the difference between the two times):
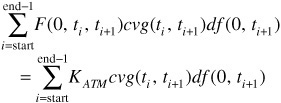
where tstart/end are the start/end dates of the cap/floor. If the strike of a cap is higher than the ATM strike then the cap is said to be in-the-money, otherwise the cap is out-of-the-money (OTM). The converse holds for a floor.
Because the ATM strike is calculated as a weighted average of the forward rates, in an environment with steep forward curves, some of the caplets will be deep in-the-money and hence they will be very expensive. In these instances, one solution to get a similar hedging performance at a reduced cost is to use a step-up cap. This product is a variation of the standard cap which uses progressively higher strikes (instead of a single fixed strike for all the caplets) to account for the higher forward rates along the forward curve. A similar product is a flexible cap/floor where the range of strikes is pre-agreed at given levels, not necessarily increasing or decreasing.
Using the put-call parity relationship for caplets/floorlets, we can easily verify that a long position in a cap combined with a short position in a floor with the same features is equivalent with paying fixed in a spot, or forward starting swap, where the two legs have the same reset frequency and day counting convention.
The convention for reset and payment for caps and floors is reset in advance and payment in arrears. That is, the payoff rate is observed at the beginning of the caplet/floorlet period and payment occurs at the end of each caplet/floorlet period. Because of this feature, spot starting contracts do not have the first caplet/floorlet, since the reset of the payoff rate would happen on the trading date and hence the payoff would be known exactly. For instance, a spot starting two-year cap with quarterly observations will only have seven caplets. Other variations like reset in arrears and payment in arrears are also quoted and traded in the marketplace.
Furthermore, the usual characteristics of options apply to caps and floors. The buyer pays the premium, which is a function of the strike rate, the period covered, and the volatility of the underlying rates. The cost of a cap/floor is the sum of the premiums of each individual component caplet/floorlet. A bank’s/dealer’s book is made of a large number of caps/floors with different start and maturity dates. Each of these trades is priced using a different volatility depending on the specific features of the product. To this end, banks/dealers construct caplet/floorlet volatility curves. For the same underlying rate, these curves show the caplet/floorlet volatility for different expiry dates. These volatilities are bootstrapped from the prices of the quoted caps/floors (ATM cap/floor straddles; a straddle is a simultaneous position in a cap and a floor with the same notional, strike, maturity, and underlying rate). Information about the volatility of the rates can be also inferred from the prices of options on short rate futures (for instance EURIBOR or EURO-dollar futures). In general, the liquidity of these futures contracts is concentrated in the short expiries. As a result, many traders’ bootstrapping procedures use both types of instruments as inputs (i.e., options on futures for short expiries and forward starting caps/floors for longer expiries). Missing points are inferred based on different interpolation schemes, which are beyond the scope of this chapter. An example of the EUR cap/floor volatility curve is illustrated in Exhibit 65–4.
EXHIBIT 65–4
Example of EUR Cap/Floor Implied Volatility as a Function of Maturity Date

The market convention is to quote cap/floor prices in terms of the implied volatility which sets the Black’s model price equal to the market premium. This is a matter of convenience, as implied volatilities are more stable over time than premiums, but it should not be interpreted to mean that market participants view the Black model as being a correct depiction of reality.
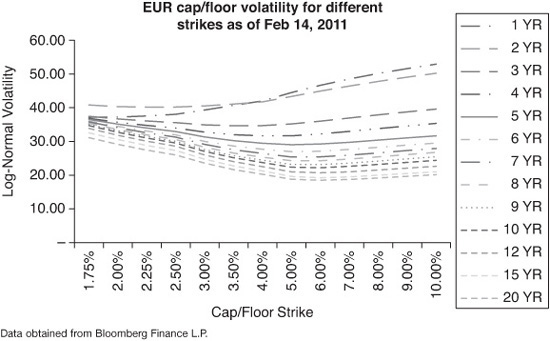
Broker screens show prices (quoted as implied volatilities) for both ATM and OTM caps/floors for different tenors. A snapshot of the EUR cap/floor market smile/skew for different maturities is depicted in Exhibit 65–5. Depending on the currency, the conventions for the underlying index rate can differ. For instance, the EUR cap/floor market uses three-month EURIBOR for maturities of up to two years and six-month EURIBOR for higher tenors.
EXHIBIT 65–5
Example of EUR Cap/Floor Volatilities as a Function of Strike Rate
The presence of volatility smiles/skews is a clear indication that Black’s model is just a pricing convention rather than rigorously inferred valuation. When it comes to modeling the volatility smile, the market standard (for both caps/floors and swaptions) is the stochastic alpha, beta, and rho (SABR) model developed by Hagan and his associates.3 For caps/floors there is an added level of complexity because one needs to model the smiles for the underlying caplets/floorlets.
The convention in the market is to refer to each caplet indicating when it will start and when it will end. For example a 6M×9M caplet will kick in after 6M and will mature in 9M. In an idealized world in which caps/floors are available for sequential maturities (i.e., every three months in the case of USD), one possible approach to calibrating the caplet/floorlet smiles could be the following. Start with the 3M×6M caplet for which prices for different strikes are available and calibrate the SABR model. Select one particular strike, say K, and move to the nine-month cap/floor struck at K. Using the price for the 3M×6M caplet/floorlet struck at K (from the previous step) determine the price of a 6M×9M caplet/floorlet struck at K and its implied volatility. By repeating this procedure for all the available strikes/prices for the nine-month cap/floor one can build the smile/skew for the 6M×9M caplet/floorlet and calibrate the SABR model to it. The process continues until all the caplets/floorlets up to a certain tenor (usually 30 year, giving 119 caplets/floorlets) have been calibrated. Exhibit 65–6 illustrates this procedure.
EXHIBIT 65–6
Caplet/Floorlet Smile/Skew Calibration
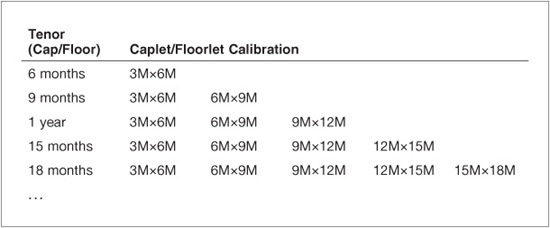
In reality the calibration procedure is more difficult. One issue is the difference in underlying index rates for different tenors (e.g., for EUR caps/floors reference three-month EURIBOR up to two-year and six-month EURIBOR thereafter). Another is the fact that the maturity grid is coarser, which makes interpolation necessary for working out intermediate caplets/floorlets volatilities. Some remedies are possible and banks/dealers use different methods to overcome these problems. Information about the three-month forward rates smiles/skews can be retrieved from options on short rate futures (EURO-dollar or EURIBOR futures). In the past, when the basis three-month to six-month was small and less volatile, one approach was to use the relationship between two successive three-month EURIBOR rates and a six-month EURIBOR (compounding) and the autocorrelation for the three-month EURIBORs. This could then be used to derive rules that linked three-month with six-month volatility. Once the SABR parameters for each caplet/floorlet are available, any cap/floor can be priced using the normal/log-normal volatilities implied by the SABR model for a particular strike. Exhibit 65–7 provides an example of a cap/floor straddle pricing for EUR 5×10 ATM cap/floor straddle (CFS) priced as of February 14, 2011. The quotation means that the straddle will start in five years and will end in 10 years’ time.
EXHIBIT 65–7
A Pricing Example of a EUR 5×10 ATM Cap/Floor Straddle on February 14, 2011

CAPS AND FLOORS VERSUS SWAPTIONS WEDGE
A swaption is a European option that allows the buyer to enter a swap upon exercise. The convention is to describe a swaption as an A-year into B-year trade; that is, upon the option expiring at A the parties will enter into a swap lasting B more years. Swaptions are divided into two types: payer and receiver swaptions, namely, the buyer of a swaption enters a B-years swap upon exercise (in A-years’ time) where he will pay/receive the fixed side at a level equal to the strike of the swaption.
Since swaps can be defined as portfolios of forward rates weighted by the discount factors, swaptions can be regarded as options on portfolios of forward rates.

where SR denotes the par swap rate and all the notation is as before.
In the beginning of this chapter we stated that caps/floors and swaptions are the building blocks of the interest rates derivatives market. On the other hand, we saw that caps/floors are portfolios of options on individual forward rates, whereas swaptions are options on portfolios of forward rates. The question which naturally arises is whether there is a relationship between the prices of caps/floors on one side and swaptions on the other side. A long/short position in a cap/floor combined with a short/long position in a swaption, both sharing the same set of spanning forward rates, is called a wedge. Some of the most common wedges are 2×4 cap/floor straddle (CFS) versus 2Y2Y P/R/S payer/receiver straddle (P/R/S) and 5×10 versus 5Y5Y.
If we assume that the caplets/floorlets determine the volatility of the forward rates, then it becomes clear that the driving force behind the price difference between caps/floors and swaptions is the correlation between the forward rates. In addition, the payoff functions of the two instruments impose constraints on the relationship between their premiums. Because of the convexity of the payoff we have the following inequality (here we made the assumption that the underlying swap of the swaption has the same day count convention and payment frequency on the two legs):

The above inequality implies that the value of a payer swaption will always be less than the value of a cap (both defined on the same set of forward rates).
In reality, the two products behave rather independently of each other and the implied correlation between the forward rates can at times exceed normal limits or what can be deemed as cheap/expensive given the market stance. Some market participants, banks and hedge funds, have tried to exploit these discrepancies and put on arbitrage plays on the correlation level. In general, these strategies require a long holding period and hence exposure to the mark to market fluctuations. On several occasions in financial markets the unwinding of such positions (which did not performed as expected) caused severe dislocations in the wedge.
The relatively high volatility of the wedge can be explained by the fact that the two products belong to two different markets with different supply/demand dynamics. In the cap/floor market, banks are natural suppliers of cap/floor volatility from their issuance of exotic structures such as snowballs, capped/floored floating-rate notes (FRNs), range accruals, callable trades, and the like. In contrast, banks may decide to buy caps perhaps as a “cheaper” alternative protection against inflation and floors for general asset/liability management. The swaptions market is usually accessed by more sophisticated investors such as banks, pension funds, and hedge funds.
The spread between caps/floors and swaptions volatilities is mean-reverting. As such, one can take directional views on wedges. The interplay between the future shape of the yield-curve (bull/bear steepening, or flattening) and volatility is a major factor affecting the dynamics of the wedge. The “carry and roll” are very important issues when one decides to enact such a trade. Another important aspect is the fact that caps/floors will have on “average” more gamma4 than a swaption (both trades sharing the same driving forward rates).
We mentioned earlier that the future shape of the curve and the volatility are important factors in the behavior of the wedge. Based on the historical analysis of yield curves, one can expect to see certain behavior of the correlation between the forward rates and volatility under different curve scenarios. From an intuitive point of view, a decrease in correlation would imply more independence in the move of the forward rates and hence, potentially higher values for the caps/floors. On the other hand, since a swap is a portfolio of forward rates with positive weights, one would expect to see a lower volatility and hence a lower value for a swaption. Under such a scenario, a cap/floor would be more valuable on a relative basis. Several studies on the shape of the yield curves have documented a decrease in correlation in steepening environments in which the forward rate curve becomes progressively steeper and the forwards more de-correlated. Based on such observations, market participants can take positions on the wedge. Exhibit 65–8 shows the evolution of the EUR 2×4 CFS versus 2y-2y swaption straddle wedge against the curve of slope (5y-2y). The exhibit seems to reinforce the observation that the steepening causes the correlation between the forward rates to drop and makes the wedge a better hold.
EXHIBIT 65–8
Example of EUR 2×4 CFS versus 2y2y Swaption Straddle Wedge against the 5y-2y Swap Spread

KEY POINTS
• Caps and floors are portfolio of European options and they offer a suitable solution for hedging interest rate risk across time.
• Hybrid type caps and floors include conditional premium cap/floor, chooser cap/floor, and reset strike cap/floor.
• Pricing is done for each individual caplet or floorlet and there is a put-call parity relationship.
• Cheaper hedging solutions can be obtained by giving up some upside opportunity and creating trading strategies such as corridor and collar. Swaptions are another viable alternative for hedging interest rate risk but in general the swaptions market is different from the caps/floors market.
• Black’s model is used for price quotation by convenience. The SABR model is used by most banks for calibration of implied volatilities with various maturities.
• Advanced trading strategies such as wedges can be implemented to take advantage of understanding how volatility affects the forward rates.