
Chapter 8 Data models and DW 2.0
The world of DW 2.0 is a complex one. There are many aspects and many facets. It is very easy to become entwined in details and quickly lose your direction. It is important to keep one’s perspective when dealing with DW 2.0.
AN INTELLECTUAL ROAD MAP
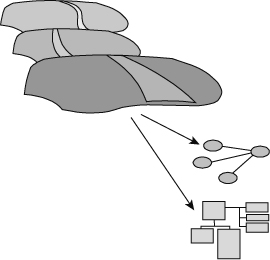
To that end, an essential part of DW 2.0 is the data model. The data model acts—in many ways—as an intellectual road map to the many parts of DW 2.0. Figure 8.1 shows the role of the data model in DW 2.0.
There are many reasons for a road map in DW 2.0. But perhaps the best reason is that DW 2.0 is not built all at once. Instead DW 2.0 is built a step at a time, over a long period of time. In addition DW 2.0 is built by many people, not just a single person.
To coordinate the efforts of these people over time and across different audiences, it is mandatory that there be a road map—a data model—that describes how the different parts of DW 2.0 fit together. Without a data model the DW 2.0 development efforts are scattered and disjointed, resulting in a mess.
THE DATA MODEL AND BUSINESS
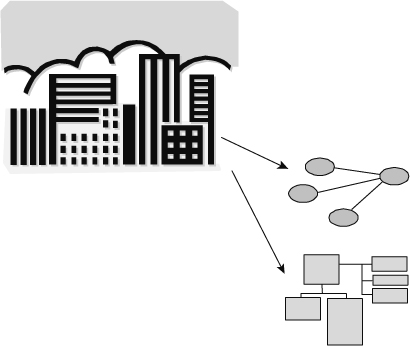
The data model is built from the business itself. It mimics the different components of the business.
Figure 8.2 shows that the data model is built from the business.

THE SCOPE OF INTEGRATION
The first step in the building of the data model is the definition of the scope of integration. The scope of integration is the statement of what is to be in the data model and what is not to be in it. The scope of integration is necessary because without it the data model can go on endlessly. It can be extended to include the universe. And when the data model includes the universe, the model is never finished.
Figure 8.3 shows that the definition of the scope of integration is the starting point for the data model.
The data model is based on the data found in the corporation. And in most organizations there is ample data. If the analyst is not careful, the data model will go on endlessly even when the scope of integration is defined, unless there is a distinction made between granular data and summarized or aggregated data. Granular data is data at its lowest level of meaning. A person’s name is granular. A person’s date of birth is granular. The salary of a person at a moment in time is granular.
Summarized data is data such as the ending transaction volume for a day, the amount of revenue for a month, the number of employees in a year, the gross national product for a quarter, and so forth.
MAKING THE DISTINCTION BETWEEN GRANULAR AND SUMMARIZED DATA
The reasons there needs to be a distinction made between granular data and summarized data are that
If summarized or aggregated data is included in the data model, the model will never be finished.
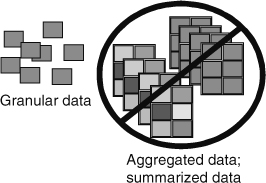
Figure 8.4 shows that granular data is the fiber of the data model.
LEVELS OF THE DATA MODEL
There are different levels of the data model. In a standard data model there are
The ERD is at a high level and can be constructed quickly. The ERD shows the major subject areas of the business of the corporation, and the relationships between those subject areas. The midlevel model—the data item set—shows the keys, attributes, and relationships of the details of the data model. The low-level model shows the physical characteristics of the data model, such as physical attributes of data, indexes, foreign keys, and the like.
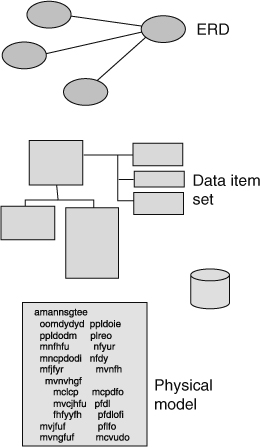
The lower the level of the model, the greater the level of detail. The higher the level of the model, the more complete the model.
Figure 8.5 shows the different levels of the data model.
The fact that there are multiple levels of modeling for something as complex as DW 2.0 is not a new or strange technique. Consider maps of the world, as seen in Figure 8.6.
In Figure 8.6 it is seen that there is a map of the United States, a map of Texas, and map of how to get to a house in Dallas, Texas. Each map has a relationship to each of the other maps. Texas can be found inside the United States. Dallas can be found inside Texas. So there is a relationship between each of the maps.
There is a different level of detail found on each map. The U.S. interstate highway system is found on the map of the United States. Texas 285 is found on the map of Texas. And Grapevine road in Denton is found in the city map of the Dallas vicinity. So the level of detail goes downward with each map.

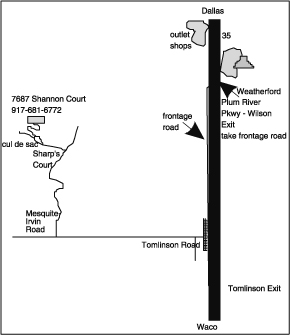
Correspondingly, the completeness of each map goes down with each level. The map of the United States shows the United States but does not show Brazil. The map of Texas shows Texas but does not show Arizona or Tennessee. The map of Dallas shows downtown Dallas but does not show Sanderson or Del Rio.
The different levels of mapping are knitted together so that there is an order to the entire globe.
In the same fashion, the data model is knitted together so that there is meaning and order to all of the systems that constitute the DW 2.0 environment. Figure 8.7 shows the data model and the order it brings to information systems.
There are many different models that are found in the DW 2.0 environment. It is a mistake to think that there is one model for DW 2.0.
DATA MODELS AND THE INTERACTIVE SECTOR
The first set of models is found in the applications that are in the Interactive Sector. As a rule there is a separate data model for each application. The application data models are shaped by the application requirements. One major consideration of the application data models is the need for performance. Throughout the application environment, especially where there are OLTP transactions, the data models are shaped by the need for performance. When performance considerations are applied to a data model, the result is a streamlined data model, in which high performance is achieved by a streamlined flow through the system. And a streamlined flow though the system is abetted by a model that positions data together.
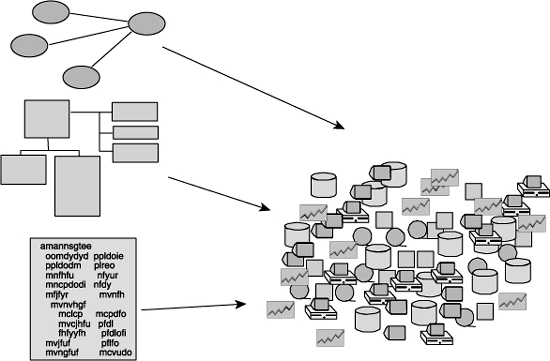
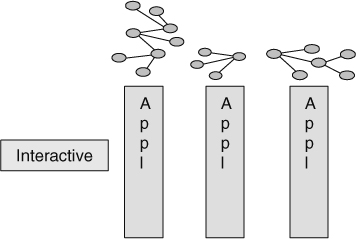
Figure 8.8 depicts applications and their models.
In Figure 8.8 it is noteworthy that there are different application models for each application.
THE CORPORATE DATA MODEL
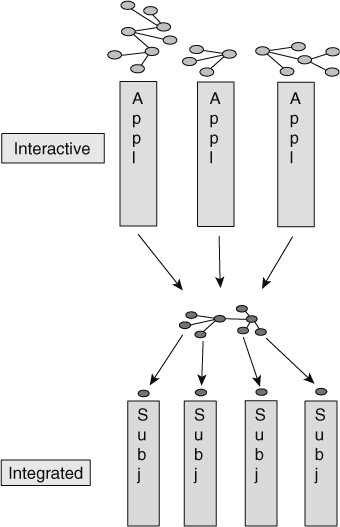
But there are other data models as well. The next data model is the corporate data model. The corporate data model is the model that shows how data coming from the application-oriented environment is to be shaped into corporate data.
The corporate data model sits between the interactive layer and the integrated layer. It is the data model of the DW 2.0 environment, if there is such a thing.
The corporate data model depicts all the data of the corporation in an integrated manner.
As a simple example of the need for integration at the corporate level, suppose there are three applications. Application A has data at the daily level, where dollars are U.S. dollars, and the gender of people is M/F. Application B has information stored at the weekly level, where dollars are Canadian, and the gender of people is stored as MALE/FEMALE. Application C has data stored by the hour, where dollars are stored in Australian dollars, and where gender is designated as X/Y.
The corporate view is at the daily level, where dollars are stored in euros, and where gender is specified as MEN/WOMEN.
The data model reflects the true corporate view of information, which is a unified view of information.
A TRANSFORMATION OF MODELS
Figure 8.9 shows that a fundamental transformation of data is made as data passes from the Application/Interactive Sector to the Integrated Sector.
It is noteworthy that as data passes into the Integrated Sector it is stored by subject area.
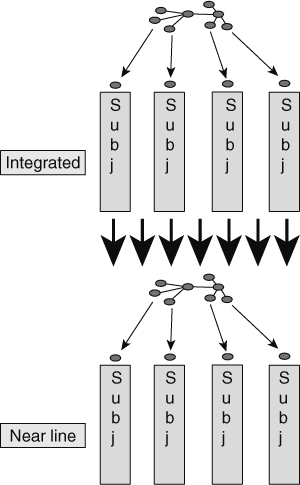
As data passes into the Near Line Sector, there is no transformation or change of data models. Because the near-line environment needs to mimic the interactive environment as much as possible, the data model for the near-line environment is exactly the same as the data model for the Interactive Sector.
Figure 8.10 shows that the data model does not change as data passes into the Near Line Sector.
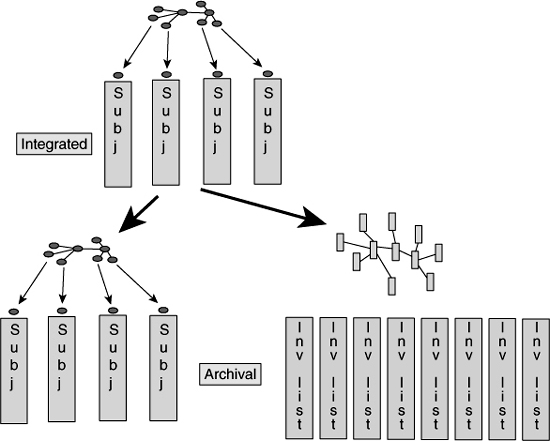
Finally data passes into the Archival Sector. As it does so, there may or may not be a change of data models. In some cases data passes into the Archival Sector in exactly the same state as it was in the Integrated Sector. In this case there is no change of data models.
![]() FIGURE 8.9 A fundamental transformation of data is made as data passes from application data to corporate data. The corporate data model is used to guide the transformation.
FIGURE 8.9 A fundamental transformation of data is made as data passes from application data to corporate data. The corporate data model is used to guide the transformation.
![]() FIGURE 8.10 As data passes from the Integrated Sector to the Near Line Sector, no changes are made at all to the data model.
FIGURE 8.10 As data passes from the Integrated Sector to the Near Line Sector, no changes are made at all to the data model.
But on other occasions, data undergoes a fundamental change as it passes into the Archival Sector. In this case data passes into what can be termed an inverted list format. When data passes into an inverted list format, it is fundamentally rearranged into a series of simple lists.
The archival analyst may want such a transformation, because it can make the data in the archival environment easier to find and analyze.
And of course, data in the archival environment can be placed in both a corporate data model format and an inverted list format.
Figure 8.11 shows this movement of data into the archival environment.
DATA MODELS AND UNSTRUCTURED DATA
Data models are appropriate for and useful to the structured side of DW 2.0. But there is some applicability of data models to the unstructured side of DW 2.0. It is not surprising that the data model does not play as big a role in the unstructured world as it does in the structured world.
![]() FIGURE 8.11 As data passes into the Archival Sector, the data model may be preserved, or the data may be transformed into an inverted list data model, or both.
FIGURE 8.11 As data passes into the Archival Sector, the data model may be preserved, or the data may be transformed into an inverted list data model, or both.
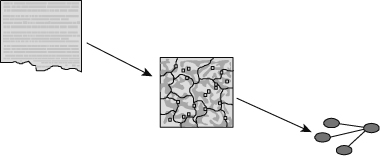
The first place where a data model is found in the unstructured component of DW 2.0 is in terms of external taxonomies. External taxonomies are used to group and classify data during the process of terminology normalization or rationalization.
Figure 8.12 shows that data models can be used to shape an external taxonomy.
![]() FIGURE 8.12 An external data model is used to shape the external taxonomies found in the unstructured environment.
FIGURE 8.12 An external data model is used to shape the external taxonomies found in the unstructured environment.
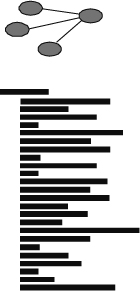
The second place where data models can be found in the unstructured environment is in the creation of an internal data model. An internal data model is used to describe the contents of and the structure of a body of text, usually a large body of text.
First the unstructured data is gathered. Then the unstructured data is organized into themes. From the themes an SOM (Self-Organizing Map) can be created. Once the SOM is created, the major themes of the unstructured text and the relationships between those themes are formed. From that basic information, an internal data model can be created.
Figure 8.13 shows the creation of an internal data model from the themes that occur in the body of unstructured text.
FROM THE PERSPECTIVE OF THE BUSINESS USER
The business user is essential to the data modeling process. Indeed, from an intellectual standpoint, the data model is the embodiment of how the end user perceives the data found in DW 2.0.
Stated differently, if the data model comes from any other source than the end user—or if the end user does not at least look at and acknowledge the validity of the data model—then the contents of DW 2.0 are shaped inappropriately.
The implication here is that the end user needs to be involved from the beginning, because it is at the beginning of the building of DW 2.0 that the data model is built. Building the data model at the beginning and then showing the data model to the end user at a later point in time risks having major aspects of DW 2.0 built incorrectly.
In some cases it is necessary to have very formal procedures in place as the data model is built and the input from the end user is recorded. The comments of the business person can be written down and the end user asked to sign off on what was and what was not said. This may be necessary when the end user is forgetful or in a large organization in which one business person speaks for a wide body of users. At a later moment in time it may become quite useful to have a written transcript of what the end user did or did not say.
The end user does not have to become an expert in data modeling techniques. (Ironically some end users become enamored of the modeling process and do—in fact—become experts in data modeling.) Instead the data modeling process is usually handled by an outsider who is a professional in data modeling.
Over time the business model will change. The business user is as involved in the changes to the data model as he/she was in the original creation of the business model.
SUMMARY
Data models form the intellectual road map for the DW 2.0 environment. DW 2.0 is large and complex and will be built over a period of time by a large number of developers. It is the data model that allows one development effort to be connected to another development effort.
The data model is shaped from the business requirements of the corporation. It is built for the most granular of data, not summarized data or aggregated data.
There are three levels of the data model—the ERD level, the midlevel (or the dis level), and the low level (or the physical level).
The Interactive Sector is shaped by an application model. The Integrated Sector is shaped by the corporate data model.
There are data models that can be applied to unstructured data. In particular, external taxonomies can have a data model built for them. In addition, an internal data model can be created by the themes that are generated out of text.