
Chapter 17 Cost justification and DW 2.0
There is no question that the infrastructure for DW 2.0 costs a lot. It costs to build it. It costs to operate it. And the equipment that it is built on costs as well.
And most corporations are adverse to large expenditures.
IS DW 2.0 WORTH IT?
So it is natural that the conversation about the worth of DW 2.0 inevitably arises. The conversation goes something like this:
“This new stuff is going to cost a lot. Are you sure it is worth it? Why should I make this big investment?”
It is absolutely normal for top management to question the worth of the DW 2.0 environment. And it simply is inadequate for you to sit there and say—” My intuition tells me that it is the right thing to do.”
So how do you answer top management when they question the value of a DW 2.0 infrastructure?
MACRO-LEVEL JUSTIFICATION
One way to respond to management is at the macro level. The macro level says that you look at very large factors and attach the worth of DW 2.0 to those factors. You might say, “The ABC Corporation brought in DW 2.0 and their stock went up.” Or you might say, “The XYZ Corporation brought in DW 2.0 and their profits soared.”
Although it may well be true that DW 2.0 had a salubrious effect on the stock price or profitability, making such an appeal lacks credibility.
There are many, many factors that affect a corporation’s stock price. In the best of circumstances, a DW 2.0 facility is only one of many factors. The same is true of profitability.
The effect of a DW 2.0 environment on such large macro factors is so specious that the credibility of the person making the claim is at stake.
Looking to macro factors is a very difficult way to convince management of the value of DW 2.0.
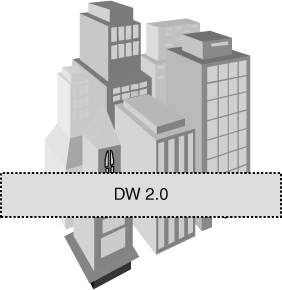
Figure 17.1 shows a DW 2.0 justification at the macro level.
A MICRO-LEVEL COST JUSTIFICATION
A much more credible way to address the issue of cost justification of the DW 2.0 environment lies at the micro level. At the micro level, there is a very convincing argument that can be made for the creation and operation of the DW 2.0 environment.
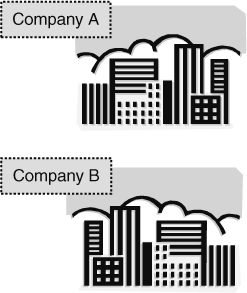
Consider two companies—company A and company B—as seen in Figure 17.2.
The information infrastructures of these two companies are very similar. Both company A and company B have a host of older legacy systems. The day-to-day business of the companies is conducted in older transaction-oriented technology and has been for a long time.
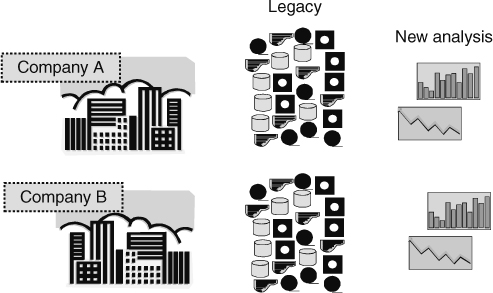
Figure 17.3 shows that company A and company B both have legacy data and a need for new, fresh analysis.
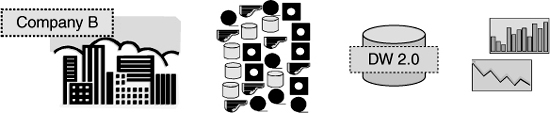
COMPANY B HAS DW 2.0
In all basic architectural components company A and company B are almost identical. There is one major difference, however. Company A does not have a DW 2.0 facility, whereas company B does. Figure 17.4 shows this basic difference between the two companies.
CREATING NEW ANALYSIS
In any case there is a need for new analysis. How exactly does company A go about creating new information from its foundation of legacy data? Figure 17.5 shows that company A has to go back to its base of legacy applications to create new and fresh analysis.
The legacy data is really the only data that company A has to operate on. There just isn’t any other data.
So what does company A have to do to create new analysis? Company A has to go to the legacy environment and
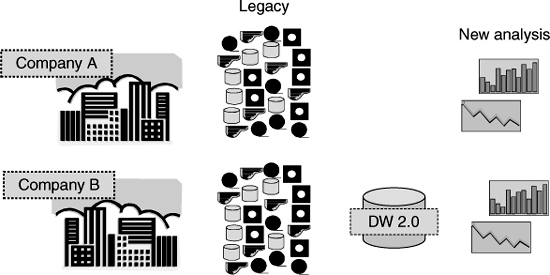
![]() FIGURE 17.4 The only difference between the two companies is that company B has a DW 2.0 environment.
FIGURE 17.4 The only difference between the two companies is that company B has a DW 2.0 environment.
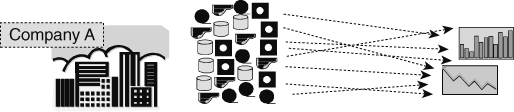
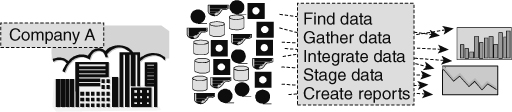
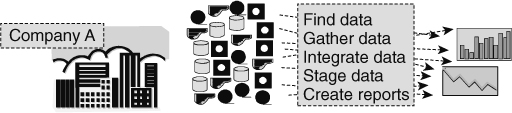
Figure 17.6 shows the steps that company A must go through.
EXECUTING THE STEPS
These are normal and natural steps. But let’s consider exactly what is required to execute these steps.
To find the data, the old legacy data must be documented. A lot of older legacy systems have no documentation whatsoever. And when documentation is found, the documentation has not been kept up to date. And there is much confusion when the older legacy systems are examined. There are no naming standards. There is a different calculation wherever you look. There are all sorts of coding standards.
Exacerbating the fact that there is no documentation, the technology that the old legacy environment is locked up in is ancient. There are no more programmers or analysts that even understand the technology of yesterday. There is old IMS code, old Model 204 code, old Adabas code, old System 2000 code. And there just are not any workers who understand that code anymore.
So finding and understanding the data that populates the old legacy systems environment are no trivial tasks.
Assuming that the old legacy code can be found and deciphered, the next step is to gather the data from the legacy environment. This requires locating skills that have long disappeared. Once those skills have been found, then the data is pulled from the legacy environment.
Next comes integrating the data. If the data comes from only one system, then there is no problem. But if the data comes from multiple systems, then there is a problem with integration. Key structures are not the same. Date formats are different. Some data is missing and default values have to be applied. Attributes have different names. The definitions of data are different, and so forth.
The person dealing with the old legacy data is asked to merge data from systems that were never designed for such a merger. Given that there is inadequate documentation and that the systems are written in technology that is arcane, making a proper job of integration is dicey, at best.
After the data is found, gathered, and integrated, then the data needs to be staged. In this case many sources of data are collected together in a single physical location.
Now, and only now, can the process of writing the report begin.
Given these challenges, how much does it cost for the creation of a new analysis? It depends entirely on the legacy environment and the analysis that is required. Some legacy environments are really a mess. Other legacy environments are fairly tame. Some reports and analyses are simple. Other reports and analyses are very difficult.
SO HOW MUCH DOES ALL OF THIS COST?
A range of costs for the building of an analysis is shown in Figure 17.7.
Depending on the particulars, it may cost $ 100,000 to $ 10,000,000 to build a new analysis. And it may take 3 months to 3 years to build such an analysis. The costs vary widely because of many factors, such as:
CONSIDER COMPANY B
Now consider company B. Company B also needs a new analysis. How much money does it cost to build a new analysis from the DW 2.0 facility? The answer is shown in Figure 17.8.
![]() FIGURE 17.7 And how much does this cost and how long does it take? From $ 100,000 to $ 10,000,000; from 3 months to 3 years.
FIGURE 17.7 And how much does this cost and how long does it take? From $ 100,000 to $ 10,000,000; from 3 months to 3 years.
![]() FIGURE 17.8 Once the DW 2.0 environment is built, how much does it cost to make a new analysis and how long does it take? From $ 1000 to $ 10,000; from 1 hour to 5 days.
FIGURE 17.8 Once the DW 2.0 environment is built, how much does it cost to make a new analysis and how long does it take? From $ 1000 to $ 10,000; from 1 hour to 5 days.
In Figure 17.8 it is seen that it takes from $ 1000 to $ 10,000 and an hour to maybe 5 days to build an analysis. From these figures it is seen that company B has a much, much easier time with the information facility than company A. And the only difference between company A and company B is the existence of a DW 2.0 facility.
From these observations it is seen that DW 2.0 greatly lowers the cost of information for a corporation. Stated differently, DW 2.0 opens the door to information that has always been there but has been essentially inaccessible.
FACTORING THE COST OF DW 2.0
But the comparison of the figures for information is somewhat biased. The bias comes in the cost of the DW 2.0 facility that has not been factored in to the equation.
What happens when the cost of the DW 2.0 facility is factored in?
Figure 17.9 shows that the equation needs more work.
Building and operating the DW 2.0 facility is not cheap. Of course a lot depends on the volume of data, the number of users, the number of old legacy systems, the length of time data will be kept, the types of analysis, and so forth.
But for the purpose of this analysis, it is assumed that a DW 2.0 facility has cost $ 5,000,000.
Now, how much does it cost for company A to build a report? Let us assume that it costs $ 700,000 to build a report. And how much does it cost for the same report from company B? The answer is $ 10,000.
Now that these report costs are factored in along with the cost of the DW 2.0 environment, what does the cost equation look like?
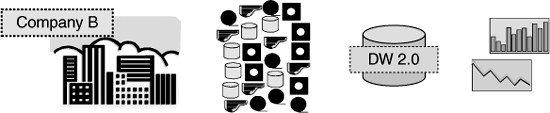

Figure 17.10 shows us the figures.
Using this analysis, it seems that building a DW 2.0 environment is quite expensive. The figures in Figure 17.10 show that a report costs $ 700,000, whereas the same report with a DW 2.0 facility costs $ 5,010,000. In this analysis the cost of a DW 2.0 is prohibitive.
REALITY OF INFORMATION
But there is something very unrealistic about Figure 17.10. This figure makes the assumption that the corporation will want only one report. And there is no corporation of any size and sophistication that operates all of its business on one report. For even a midsize corporation, at least 100 reports are necessary. The finance department needs its reports one way. The marketing department needs its reports another way. The sales department needs its reports yet another way.
And for a large corporation, there are not hundreds of reports. There are thousands of reports.
But for the purpose of our analysis, let us assume that 100 reports are needed. How does the reality of the number of reports needed change the economics?
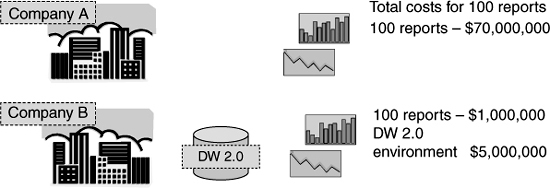
Figure 17.11 shows the consequences of considering how many reports are really needed by the corporation.
In the case of company A, the cost of the reports is multiplied by 100 to $ 70,000,000. In the case of company B, the cost of the reports is multiplied by 100 to $ 1,000,000. But there is only one DW 2.0 facility that is needed. So the cost of the DW 2.0 environment remains static.
THE REAL ECONOMICS OF DW 2.0
Now the real economic analysis of the cost justification of a DW 2.0 environment becomes apparent. DW 2.0 drops the cost of a new analysis by an order of magnitude or more. It is simply true that DW 2.0 allows a corporation to access and analyze its data as it never has before.
But the raw economics of DW 2.0 do not tell the full story.
THE TIME VALUE OF INFORMATION
There is a very real case to be made for the time value of information. DW 2.0 greatly facilitates the speed with which information can be retrieved.
Consider this. Your boss walks into your office and asks for a report. You get to work, traipse through a bunch of old legacy systems, and get the analysis to your boss 6 months later. When you walk into your boss’s office with your report, your boss has forgotten what he/she asked you to do months ago.
Compare that scenario with the following.
Your boss walks into your office and asks for an analysis. You get to work and you have the analysis ready for your boss the next day. You walk into your boss’s office at 8:00 AM the next morning with the report. How useful is that information to your boss?
The point is that information that is 6 months late is usually not useful at all. The fresher and the more current the information, the better the chance that the information will be useful in the business equation.

There is a real time value of information, and it is the DW 2.0 environment that greatly accelerates the speed with which information is accessible.
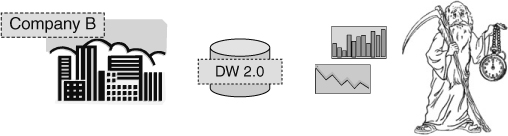
Figure 17.12 depicts the time value of information.
THE VALUE OF INTEGRATION
But there are other major benefits which are not measured by the raw economic calculation that has been presented. There is the value of integration as well.
To many corporations, integration itself is worth the cost of the DW 2.0 environment. With integration, information from one place and one use can be connected to and related to information from another place and another use.
The result of this connectivity is integration. And with integration such valuable things as being able to create a true 360 ° view of the customer can be accomplished.
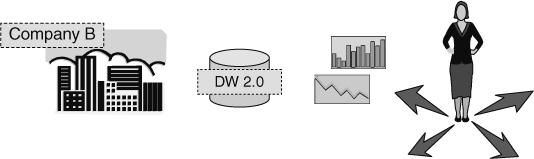
Figure 17.13 shows that integration is an intangible benefit of the DW 2.0 environment.
HISTORICAL INFORMATION
There is yet one more intangible benefit of the DW 2.0 environment and that benefit is the ability to look across information from the perspective of time.
Prior to DW 2.0 there were legacy systems. Many of those legacy systems were transaction oriented. And where there are transactions, there is a need for high performance. Where there is a need for high performance, there is a need to rid the system of any unnecessary data. Unnecessary data inside a system acts like cholesterol inside the human body.
Therefore, in the legacy environment, the tendency is to jettison historical data as fast as possible. The more historical data found in a legacy system, the slower the system runs. The net result is that there is only a minimum of history in the legacy systems environment.
The problem is that there is real value in historical data.
If the legacy, transaction-processing environment is not the place to store historical data, the DW 2.0 environment is the place to store historical data.
Figure 17.14 shows that the DW 2.0 environment is the place for historical data to reside.
FIRST-GENERATION DW AND DW 2.0—THE ECONOMICS
There is yet another perspective on the economics of data warehousing. First-generation data warehousing had the habit of collecting lots of data on disk storage. In fact many first-generation data warehouses stored data on nothing but disk storage.

![]() FIGURE 17.15 The cost of a DW 2.0 data warehouse is significantly less than the cost of a first-generation data warehouse.
FIGURE 17.15 The cost of a DW 2.0 data warehouse is significantly less than the cost of a first-generation data warehouse.
But DW 2.0 recognizes that there are at least two places where data should be stored on other than disk storage. DW 2.0 recognizes that data should be stored in near-line storage when it still needs to be accessed but has a low probability of access. And DW 2.0 recognizes that archival data is not normally stored on disk storage.
Because of the usage of different storage devices, the cost of DW 2.0 is significantly less than the cost of traditional first-generation data warehouses.
Figure 17.15 compares the storage media for the different generations of data warehousing.
FROM THE PERSPECTIVE OF THE BUSINESS USER
Cost justification is an activity that is usually done once in the life of DW 2.0. Under all normal circumstances there is no need to do repeated justifications.
The business user is very heavily involved with the process of cost justification of DW 2.0. Indeed, in many ways the exercise of cost justification is done for the business user.
It is understood that the business user pays—either directly or indirectly—for the DW 2.0 infrastructure. Therefore it is the business users and their management that have to be satisfied with the results of cost justification.
SUMMARY
Trying to cost-justify DW 2.0 at the macro level is a difficult thing to do because the benefits of the DW 2.0 environment get lost among many other macro factors. Instead the best way to cost-justify a DW 2.0 environment is to look at cost justification in a micro fashion.
Look at two companies—one with a DW 2.0 environment and one without a DW 2.0 environment. Then look at the costs of
Look at these factors for many reports and many analyses, and the cost of the DW 2.0 environment comes out as much lower than that of an environment without DW 2.0.
But there are other noneconomic factors to be considered. There is the time value of data. There is the integration of data. And there is the historical data, which is now available (for the first time).
DW 2.0 unlocks data for analytical purposes and enables the organization to look at and do analyses that they have never been able to do before.