
Machinery and Information Technology for Biomass Production
Tadashi Chosa, Takeshi Matsumoto and Masahiro Iwaoka
Abstract
This chapter outlines machinery, information technology, infrastructure, and their integration for efficient biomass production in agriculture and forestry. Both agriculture and forestry in Japan are performed in regions of large-scale production that is unique compared with other Asian countries. The original technologies that have been developed and implemented for this unique situation as discussed in this chapter may be adopted as advanced technologies for other situations. The first part of the chapter summarizes the biomass production technology used in agriculture. Introducing seeding machines leads to an agricultural system with low production and labor costs, and implementing the information system is also of importance to establish more efficient production systems. The second part covers the forestry on forest planning, management, and harvesting technologies, including discussions on historical background. The extensive application of geographic information system (GIS)-based precise management technology as an information system to aid forestry production is also reviewed in this chapter.
Keywords
Biomass production; farm machinery; forest biomass; geographic information system; management; planning; precision agriculture; information systems
Chapter Outline
6.1. Machinery for Production of Energy Crop
6.1.2. Farm Machinery for Low Land
6.1.3. Farm Machinery for Converted Fields and Uplands
6.2. Information Systems in Crop Production
6.2.2. Use of a Personal Digital Assistant
6.2.3. Optimization of Farm Operations
6.3. Harvesting the Forest Biomass
6.3.2. Harvesting Technology of Forest Biomass
6.3.3. Forest Road Network as an Infrastructure for Biomass Harvesting
6.3.4. Harvesting System for Biomass
6.4. Information System for Forestry Production
6.4.1. Information for Forestry Production
6.4.2. Using a Geographic Information System (GIS)
6.1 Machinery for Production of Energy Crop
Tadashi Chosa
6.1.1 Introduction
An energy crop refers to plants grown and harvested for energy by direct combustion to generate electricity or heat, or making biofuel. Energy crops are generally categorized as woody biomass or herbaceous biomass, and the machinery to be discussed in this chapter is used only for herbaceous biomass production.
A herbaceous biomass, e.g. rape, sunflower, sugar canes, and rice, is basically an agricultural product that can be produced and managed using agricultural machinery in the open field. The use of agricultural machinery to replace human labor for engagement in heavy and dangerous tasks has introduced evolutional profit for the farming industry by increasing the productivity of crops. This technical innovation improves farmers’ life expectancy and farming management; it also contributes to a stable food supply for the modern society.
Conventional agricultural machinery can be used to produce energy crops. But commercial energy crops need to be planted more densely than food crops for high crop yields and better product quality. The most important point is that the costs of producing energy crops must be much lower than for producing conventional agricultural food and feed crops in order for the bio-energy to be competitive in price with low-cost conventional fossil energy.
The technical background for biomass production in Japan is completely different from other countries. Growing frequently mentioned energy crops such as copra, jatropha, palm, rapeseed or soybean is not feasible in Japan because of weather conditions. Additionally, the intensive agricultural production system currently practiced in Japan also poses a problem for producing energy crops. The sophisticated production system in Japan has the advantage of using narrow land effectively for stable production but the production costs become high. Hence, reducing the agricultural production cost is one of the most important concerns for agriculture in Japan to produce either food or energy crops. The intention of producing biomass for energy may provide an opportunity for Japan to address this concern by improving the current production system.
6.1.2 Farm Machinery for Low Land
Rice, which is suitable as a crop in the Asian monsoonal climate, is a major agricultural crop in Japan. More than half of arable land in Japan is paddy fields to grow rice for maintaining a high self-sufficiency rate of rice. The production system of rice has been studied as a unique technology because most farm work, including tillage, paddling, transplanting and harvesting, has been mechanized in Japan. The rice-transplanting machine developed in the 1960s is also one of Japan’s original technologies. The establishment of “mat-type rice seedlings” and re-enactment of the sensitive planting operation were the breakthroughs in developing the rice-transplanting machine.
Transplanting rice in a traditional cropping system has many advantages. The nursery can be grown under controlled indoor conditions to avoid unstable changes of temperature in early spring and risk of damage caused by disease and insects. The grown nursery is more competitive than weed, and the root-cutting stress during transplantation is beneficial to the growth of rice seedlings. Recently, the technology of applying chemicals to nurseries before and during transplanting has been studied. Farmers will not have to care for the plants after transplanting until harvesting. On the other hand, the high production cost is the problem associated with the transplanting operation. High energy consumption and the resulting high costs are needed to manage the rice nursery. Additionally, the nursery will eliminate the labor involved in rice planting so that some farmers will become unemployed; hence, farmers in many regions of the world are choosing the direct seeding method without a rice nursery for producing rice. There are increasing numbers of reports on experimental and practical direct seeding in Japan published recently (e.g. Box 6.1).
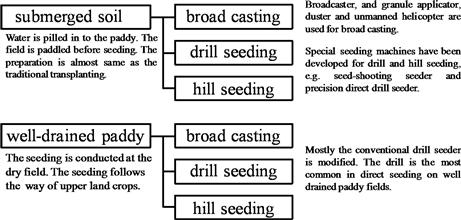
Direct seeding in Japan can be roughly classified as direct seeding of rice on well-drained paddy field and submerged soil; it is also classified as broad casting, drill seeding, and hill seeding from the viewpoint of sowing method (Figure 6.1).
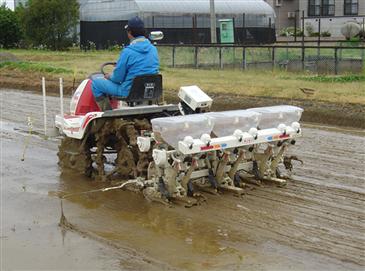
A seed-shooting seeder of rice (Togashi et al., 2001a) combined with a tractor-mounted paddy harrow is used in the submerged soil for hill seeding (Figure 6.2). Seeding is carried out simultaneously with the last paddling operation in a paddy field. The seeder employs a seed roller to feed the seeds, which are then coated with calcium dioxide (CaO2) before being shot on to the soil surface of the paddy field with a saw-toothed disk. Both disk and roller are driven by a direct current motor powered with a tractor battery. Results of performance tests of the seeder (Togashi et al., 2001b) show that the depth of seeding is 5–20 mm if the seeds were shot into the submerged soil (viscosity 50–150 dPa•s) of the paddy field, with dimensions of the hill-seeded spot (ellipse in shape) in the paddy field of 6–10 cm (longer diameter) by 3–5 cm (shorter diameter). The hill-seeded rice has nearly the same lodging tolerance as the transplanted rice, and better lodging tolerance than the broadcasted rice. The yield of the hill-seeded rice is about 10%, inferior to that of the transplanted rice. A precision direct drill seeder (Nishimura et al., 2001) that is capable of controlling the seeding depth precisely is also used in the submerged soil for hill seeding (Figure 6.3). The seeder was mounted on a paddy vehicle consisting of a feeding unit and a furrow opener–closer unit, and the furrow opener–closer unit consisted of a float that follows the soil surface smoothly, a two-stage adjustable furrow opener, and a seeding depth controller with the soil surface hardness sensor. This device will enable stable germination by planting seeds at a precise depth so that inappropriate seed germination is reduced. According to a field trial in adaptability tests (Nishimura et al., 2003), the precision direct drill seeder is found to be capable of planting rice seeds with accuracy in various types of fields.
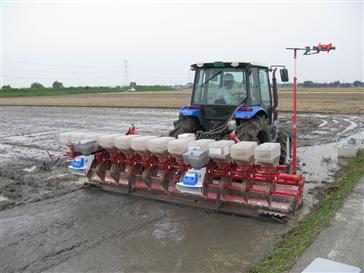
FIGURE 6.2 A seed-shooting seeder of rice. (Photo by Koichiro Fukami, National Agriculture and Food Research Organization, Japan.)
Direct seeding of rice on well-drained paddy fields does not need a paddling operation and the seeding vehicle can travel more smoothly. The seeders designed for seeding wheat, barley, and other upland crops can easily be modified for seeding rice. The rate of pulverization of soil is an important factor to consider to ensure satisfactory performance. Problems caused by water leakage and uneven leveling may occur depending on the soil conditions, so that the soil properties in each region have to be considered. Using the winter-paddling seedbed preparation to prepare the land prior to seeding may help to solve these problems. The V-furrow no-till direct rice seeder is usually used to perform winter-paddling seedbed preparation. According to practical experiments by farmers in Anjo, Aichi (Hamada et al., 2007), seedling emergence is improved with increasing seedling stand number, substantially less seeds are eaten by birds, and control of weeds in winter-paddling seedbed preparation sites as compared with the complete no-till sites was easier. Furthermore, the soil of field surfaces of tested sites became as hard as that of fields with no till, but seeding was possible even after rainfall. The seedling emergence number and the grain yield of rice plants grown in interpaddling seeded preparation fields are as high as those of conventional transplanting rice cultures.
The management of cropping and harvesting for direct seeding plants are not very different from those for conventional transplanting plants. A head-feeding combine harvester can be used for any type of direct seeding plants. Recently, small conventional combine harvesters adaptable for both rice and other upland crops have been developed (Umeda et al., 2012); its adaptability to high-moisture paddy is studied (Kurihara et al., 2011). The achievements in flexible use of combine harvesters will also contribute to reducing the production cost.
6.1.3 Farm Machinery for Converted Fields and Uplands
Japan has abundant rainfall compared to other countries of moderate climate, and the groundwater level is thus quite high; this is one of the reasons why paddy is the most popular land use for farming in Japan. However, these conditions sometimes become disadvantageous for upland crops. Recent oversupply of rice has led to conversion of paddy crops to upland crops.
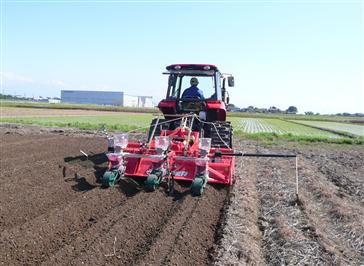
The use of simultaneous tilling and ridging implements (Hosokawa, 2009) was originally developed to improve soybean cropping in converted fields with heavy clay that is very unstable for upland crops. The developed equipment (Figure 6.4), which simultaneously makes ridges, spreads fertilizers, and seeds when tilling the soil, reduces the adverse effects on wet injury. It features an up-cut rotary shaft and improved holder with excellent pulverization performance. Clods of soil are thrown into the center of the ridge by the curved tines. Then, by slightly raising the leveling plate, the soil can be tilled and piled to form ridges at the same time (Hosokawa, 2009). Various types of seeders for seeding soybean, corn, buckwheat, and rapeseed, among many others, have been developed.
6.2 Information Systems in Crop Production
6.2.1 Precision Agriculture
Information technology has developed rapidly in the last 20 years. GPS, which is a mobile phone with other useful terminals, has become widespread in our daily life. Additionally, the internet has become available almost anywhere. Nowadays, our daily living depends on these devices and technologies. Information technology is also useful for farming operations to produce crops. Some examples of the practical use of information technology are presented in the following section.
a Precision Agriculture in Japan
Precision agriculture that began in Japan in the mid-1990s is about 15 years behind the USA and Europe; it may be implemented to solve problems of variability within and between fields that leads to economic and environmental benefits and stable production. Methods of precision agriculture are based on information technology; farmers make optimal decisions depending on site-specific information, about fertility, growth, and yield. Because the cropping system in Japan is completely different from those in the USA and Europe, the technology developed internationally must be modified to suit the conditions encountered in Japan. For example, because of small-scale Japanese farming operations, only undersized farming machinery with more sensitive monitoring devices can be used efficiently in Japan. Moreover, the main crop in Japan is rice rather than corn, barley and wheat, among many others, that are popularly grown in other nations; research on precision agriculture has been attracting attention with regard to the production of rice in Japan.
b Yield Monitoring System
Many types of devices, techniques, systems, and technologies have been developed for implementing precision agriculture in Japan over the last decade. The system includes a soil sensor to monitor soil fertility, an image-mapping technique to monitor growth, a plant growth information-processing system using cellular phones, and a variable-rate application technology for paddies. The yield monitoring system is also a representative technology used in precision agriculture. An understanding of yield variations within a field or among fields has been used to evaluate growth and management profiles that provide important information to determine site-specific management strategies for the following year. Less fertilizer should be applied at sites where lodging has been observed, whereas more fertilizer needs to be applied at sites where yields have been low. Although general yield variation information can be obtained from experience with routine farming work, the results obtained with yield monitoring are expected to play an important role in establishing the technology for implementing site-specific crop management and spreading practices.
Although yield monitors are installed in combines as standard equipment, they have been marketed and installed as after-sale accessories throughout Europe and the USA and are not sufficiently accurate for head-feeding combine harvesters in Japan. The sensor and system have usually been designed for a conventional combine; their detecting signals (e.g. grain flow or change of mass in the grain tank) are inappropriate for a head-feeding combine. This is because the combine has narrower operating width than a conventional combine due to differences in feeding kernels to the grain tank. Kernels are continuously fed to the grain tank by a grain auger in the head-feeding combine, whereas kernels are intermittently fed to the grain tank by a bucket conveyer in a conventional machine. Also, the required accuracy of yield variations is different because of the difference in grid size. Consequently, developing an original yield monitoring technique for a head-feeding combine is necessary so that yield monitoring combines are generally adopted by Japanese farmers.
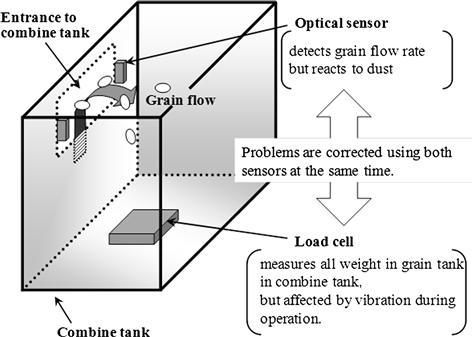
A hybrid yield monitoring system (Chosa et al., 2006) is one solution to the problems described above. The system applies one pair of optical sensors attached to the entrance of the grain tank coupled with a load-cell unit fixed at the bottom of the grain tank (Figure 6.5). The regression analysis results of signals from the optical sensor that reflect the grain particle flow rate at the top of the grain auger are not stable because of changes in coarse particulates or dusty conditions caused by variations in operating conditions, such as field and grain moisture and mixing of weeds and mud due to lodging. Additionally, the load-cell signal varies according to the weight of discharged grain; it is not adopted for the sequence yield monitor due to the effects of vibration. To solve these problems, a batch yield monitor is used to measure the grain weight at each stroke for calculating the accumulated variations in the particle flow sensor. Subsequently, the regression equation is defined by comparing the total grain weight and the accumulated variations in the particle flow sensor. Finally, sequence yield variations are calculated using the regression equation.
c Comprehensive Trials
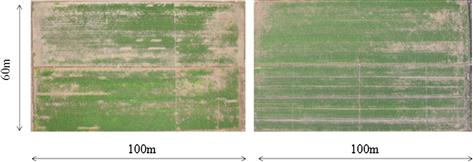
Several integrating systems, i.e. precision farming systems, using developed technologies have also been developed. One example is a site-specific nitrogen management system that applies fertilizer at a variable rate in accordance with fertility and growth information; results with reduced yield variability and higher quality of rice production have been reported (Toriyama et al., 2003). Some of the technologies developed for rice production are also useful in other types of field. The use of site-specific information is being applied to wheat production, resulting in higher quality (Sasaki et al., 2007). Morimoto et al. (2006) introduced a decision-making method for harmonizing objectively the sensed information with a farmer’s knowledge. Chosa et al. (2009a) showed that the site specific management is effective to introduce newly developed technology to practical farm (Figure 6.6).
In addition to rice, other crops including wheat, soybean, vegetables, tea, forage crops, fruit, sugar cane, and many others are now being targeted, and a number of farmers are becoming interested in the information acquired. Unfortunately, the devices developed so far are too expensive or inconvenient for practical use by working farmers; hence, the first stage of developing new technologies for precision agriculture in Japan is coming to an end. The next stage must focus on improving and disseminating these technologies.
While “precision agriculture” is based on site-specific crop management for narrow field space, it is more practical and comprehensive because it includes not only the farming system but also a natural resource management model coupled with a business model. The concept of precision agriculture is being extended from production management marketing management. The new generation of precision agriculture is expected to be a tool of regional commutation between farmers, consumers, and the general public.
6.2.2 Use of a Personal Digital Assistant
Cell phones are common communication devices nowadays; farmers and consumers will have individual cell phones. Many studies on using cell phones to realize traceability systems or more effective production systems have been reported. SEICA (http://seica.info) that follows the virtually identified produce system (Sugiyama, 2004) is a brochure on the internet. Using a cell phone, farmers can input information not only on crop production but also crop shipment. Cell phones are available to input and browse the system using both text and images; QR code and IC tags can assist farmers in accessing the system in the field with ease.
Acquiring cropping information is also possible using a cell phone. A mobile phone-based field data logger system for mandarin orange production has been reported (Kamiya et al., 2011). The system focuses on collecting data that can be used to determine the watering schedule for cultivation using drip irrigation. Automated field monitoring was performed using Field Server, which is a server computer installed in the field, and a sensor network to collect weather information. The results can be visualized as a timeline using a web-based system; users can compare their results with the data provided by other users, and can then consult with experts in their area.
6.2.3 Optimization of Farm Operations
The farming operation is deeply related to regional culture and unpredictable climate, so that optimizing the farming operation depends on collections of information, knowledge, wisdom, and skill. However, the situation is changing dramatically in that the management size is increased and many operations are completed rapidly by using farming machinery. Hence, many types of weather information services are needed and have to be utilized properly to reduce production costs while maintaining high crop quality.
A database that consists of information on operation name, cost, time, and machines and materials can be used to develop proper farming operations including a technical approach such as the dependence of optimum cropping on farm machinery and climate, among many others, and a financial approach such as financial management. Both topics have been studied by researchers in other disciplines; how to implement the study results and concepts integrated with the knowledge and concepts accumulated on farming management has also been reported. FAPSDB (Nanseki and Matsushita, 2005) is designed as a web application with a unified concept and information; it generates 15 CSV files to describe the index of farming management using a prepared database.
Describing a farm operation as a mathematical model is another solution to achieve an optimum system. The model of operation is developed using linear programming, simulated annealing, probabilistic modeling, and other mathematical analysis. Optimization of the system for harvesting and shipping a potherb mustard crop including driving route within fields and other operations, has been introduced using mathematical modeling and analyses (Miyasaka and Ohdoi, 2005).
Integration of farming operations and a geographic information system (GIS) is valuable because the latter improves farming by covering a wider area. Records of the farming operation obtained with the GIS can be analyzed to determine the optimum operation schedule using a computer-assisted system. As reported by Daikoku (2005), based on practical experiments, tightly scheduled operations in early spring, paddling and transplanting can be properly scattered in hilly and mountainous areas.
BOX 6.1
Direct seeding of rice instead of transplanting seedlings has been gradually developed in order to achieve a low-cost and labor-saving system in Japan. The most practical direct seeding methods are drill seeding and hill seeding using a seed-shooting seeder as well as a precision direct drill seeder in the flooded paddy. Direct seeding of rice in well-drained paddy fields is also becoming popular because the seeding machine can be used for both rice and other upland crops. The most efficient method, broad casting, is not very popular because the broad-cast seeds are not completely buried in soil; they are often eaten by birds in addition to a low rate of germination with and unstable initial germination.
The objective of the air-assisted strip seeder (Chosa et al., 2009b) is to achieve efficient operation as broad casting and stable initial growth as drill seeding. The machine for air-assisted seeding was developed using commercially available farm machinery. The original machine was a granule applicator with improved swath and fixing device for seeding rice in a paddy field (Goto, 1997). The tested applicator can be mounted on a conventional tractor using a three-point hitch and power take-off (PTO). The air-assisted seeding machine consists of a hopper, a boom-shaped application pipe, an application roll, DC motors, a ventilation fan, and 16 blow heads. The motor drives the application roll, which transports granular material from the hopper to the application pipe. The application rate of seeds can be controlled by the revolution rate of the DC motor, and the ventilation fan blows granular seeds through the pipe to the right and left, creating a 10-m wide swath (Chosa et al., 2009a) (Figure 6.7). A high-speed camera shows that the speed of rice seed falling is 4–7 m s−1, and the direction of falling is 7.1° from the vertical. The rice seed falling speed is too slow to be buried properly under any conditions. The direction of falling should be lessened to narrow the strip width. Further experiments to improve the air-assisted seeder have continued (e.g. Loan et al., 2011); more practical machines and technology will be developed and implemented in new rice cropping systems in the future.
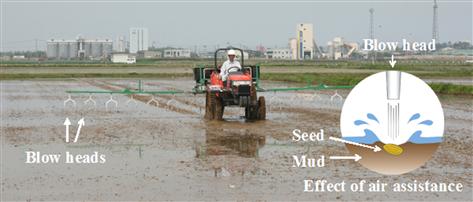
FIGURE 6.7 Field operation by air-assisted seeding machine and effects of air-assisted seeding. (From Chosa et al., 2009a.)
According to field trials using high-quality grain with good eating quality rice, kosihikari (Furuhata et al., 2011), air-assisted strip seeding methods lead to superior numbers of eras and crop yields than hill seeding using a seed-shooting seeding method. Mukouyama et al. (2012) applied the lodging tolerant rice cultivar, Takanari, and reported that the air-assisted drilled rice produces heavier dry matter and grain yield than the hill-seeded and transplanted rice because the former has a higher crop growth rate. Higher efficiency of the seeding operation using the air-assisted strip seeder has also been confirmed through field investigations (Chosa et al., 2009c).
6.3 Harvesting the Forest Biomass
Takeshi Matsumoto
6.3.1 Forest Biomass
a Introduction
The famous old Japanese tale “Momotaro” starts as follows: Long, long ago, there lived an old man and his old wife in a village. He went to the mountain to gather Shiba (Shiba-kari). She went to the river to wash clothes. The word “Shiba” refers to miscellaneous small trees grown in fields and mountains that can be used for fence or fire wood (Maki). The Momotaro, well known in Japan, starts the story by harvesting the biomass.
In Japan, biomass harvesting from fields and mountains traditionally constitutes a useful resource as fuel, life materials, and agricultural fertilizer (Karishiki). The area of fields and mountains needed to supply Karishiki is 10 times the size of cultivated land area (Mizumoto, 2003). Figure 6.8 shows the transportation of firewood by sledding in the Edo Era.

Today, the total quantity of usable wood biomass in Japan is estimated at 32 million tons per year from the following sources: logging residue (3 million tons), thinning timber (5 million tons), and low-level broad-leaved trees (9 million tons) (Yoshioka and Suzuki, 2012).
In Japan, forest biomass is produced by practicing forest management measures such as thinning or regeneration cutting, and also from fallen stands or broken limbs caused by snow or wind events. Straight logs are shipped as grade A timber for building materials; crooked or bronzing logs are shipped as grade B timber to be used mainly for plywood. The allowable level of crook is that the height of the curve is under 1% of the log length. Larger crook logs, short logs, heartwood rot logs, and distorted logs are shipped as grade C timber mainly for pulp or chip. Low-level logs, including small logs, logs from the basal part of the tree and logs from the top end of the tree, are shipped as grade D timber mainly for fuel. Traditionally, Japanese forest has produced mainly grade A timber, but recent demand for grade B timber has been increasing because of the growing number of plywood factories using domestic timber. However, most grade C and D timber is left in forest land.
b Units for Measurement of Forest Biomass
SI units are used in the measurement of forest biomass. However, in the Japanese forestry sector, traditional units (Shaku-Kan system) are also frequently used.
Various methods such as the Huber formula, Rieke formula, Smalian formula, and square-a-shorter diameter method are used for calculating log volume. Japanese forestry and timber dealers use the square-a-shorter diameter method in which the log volume V (m3) is calculated by substituting the small-end diameter D (m) and log length L (m) into the following formula for log length less than 6 m:
![]() (6.1)
(6.1)
When the log length exceeds 6 m, the following modified formula is used:
![]() (6.2)
(6.2)
where L′ is the integer of log length (m). The volume of a log 3 meters in length with a small-end diameter of 60 cm is almost 1 m3.
The stem volume of standing trees can be estimated by using various methods, including the form factor method, Pressler method, log volume table method, and Denzin method. The Denzin method is very simple; it is used to calculate the stem volume V (m) from the diameter breast height DB (cm) using the following formula:
![]() (6.3)
(6.3)
This method assumes a tree height of 25–30 m, and therefore the following corrections are needed: +4% per m for a tree height of over 30 m; and −4% per m for a tree height of under 25 m.
c Current Status of Japanese Forests
Most of the Japanese region termed “forest” is synonymous with “mountain”. Thus, in many cases, mountain means not only mountainous terrain but also forest.
The terrain index I (%) is calculated from the inclination Ii (%), the relief energy R (m), and the valley density V (valleys per km2), using the following formula (Hori, 1965):
![]() (6.4)
(6.4)
![]() (6.5)
(6.5)
The following terrain classifications are used: gentle terrain (I = 0–19), middle terrain (I = 20–39), steep terrain (I = 40–69), and steeper terrain (I > 70). The Japanese forest land consists of 3.7 million ha of gentle terrain, 10.3 million ha of middle terrain, 11.4 million ha of steep terrain, and 1.1 million ha of steeper terrain (Sakai, 2000). The terrain index can be regarded as the inclination of the ground (Sakai, 2000), and therefore 50% of Japanese forest land is composed of steep and steeper terrain with inclinations greater than 40% (22°).
Seventy percent of the countryside land in Japan comprises forest land (25.1 million ha) and the growing stock is 4.4 billion m3. Artificial forests constitute 10.4 million ha (41%), with a standing volume of 2.7 million m3 (61%). Most of the species in artificial forests are coniferous, for example Sugi (Cryptomeria japonica; 4.5 million ha), Hinoki (Chamaecyparis obtusa; 2.6 million ha), Karamatsu (Larix leptolepis; 1.0 million ha), Matsu (Pinus; 0.9 million ha), and Ezomatsu and Todomatsu (Picea jezoensis and Abies sachalinensis respectively; 0.9 million ha) (Forestry Agency, 2012b). More than 50% of artificial forests, which are 36–50 years old, need thinning. In 2010, thinning was conducted across 556,000 ha, and the volume of wood produced by thinning was 6.7 million m3. Based on a unit volume of forest thinning of 300 m3 ha−1, and a thinning ratio of 30%, the thinning volume will be 100 m3 ha−1. If the yield rate of felling and bucking trees is 50%, thinning will produce 50 m3 of timber per ha. Accordingly, the total production potential in 2010 was estimated to be 27.8 million m3 of wood resources; however, the actual volume produced was approximately 25% of the estimate.
Japanese forest resources (mainly artificial forests) are increasing at an annual rate of 80 million m3; this volume exceeds the annual Japanese gross timber demand of 72 million m3. In 1989, the annual gross timber demand was 116 million m3, but has been decreasing in recent years. Today, Japanese forest resources are sufficient to meet domestic timber demand (i.e. 100% self-sufficiency) by harvesting only the annual growth volume. However, in 2010, the self-sufficiency rate was only 26% with a large gap between actual and potential self-sufficiency. The gross timber demand peaked at 113.7 million m3 in 1995, and has been decreasing in recent years. In 2010, the gross timber demand was 72 million m3, consisting of 35% sawn wood, 45% pulp and chip, 13% plywood, and 13% others. In 2009, the Japanese government developed the “Forest and Forestry Revitalization Plan”, aimed at achieving a wood self-sufficiency rate of 50% or higher in 10 years.
Japanese forests are classified based on their ownership; national forest accounts for 31%, whereas non-national forest accounts for the remaining 69%. Non-national forest comprises 77% private forest, 19% public forest, and others. As for holding size of private forest, the number of owners with holding area smaller than 20 ha represents 81% of the total number of owners, and the total holding area represents 15% of the total private forest. Moreover, 24% of private forest owners are absentee owners who do not live in the same municipality where their forest is located.
d Forest Planning System
The forest grows for a very long time. Therefore, the forest planning system in Japan is based on a long-term perspective with appropriate management practices aimed at stable supply of forest products and development of multiple functions for public benefits. According to the “Basic Plan for Forest and Forestry”, the “Nationwide Forest Plan” that covers three 5-year periods is formulated by the Ministry of Agriculture, Forestry and Fisheries for managing 44 planning areas divided by major river basins. At prefecture level, the “Regional Forest Plan” for two 5-year periods for a total of 10 years is formulated by the prefectural governor for managing private forests that covers 144 forest planning blocks. For national forest, the “Regional Plan for National Forests” is formulated by the director general of the regional forest office. At the municipality level, the “Municipality Forest Management Plan” is formulated by the head of municipality; this plan is adopted as the “master plan” for on-the-ground forest management.
At the individual forest owner level, a 5-year “Forest Management Plan” was until recently developed by the individual forest owners and others involved. However, in 2012, a new “Forest Management Plan” was introduced. This plan is formulated to cover forest operation and other practices to manage geographically continuous forest by forest owners or trustees of forest management. Under the new system, the costs of forest management (including thinning and construction of forestry road) are paid to the forest owners or trustees to meet the required conditions with the “Forest Management and Environmental Conservation Direct Support System”.
e Current Japanese Forestry Situation
The number of forestry workers in Japan was estimated to be 210,000 in 1970, fell to 40,000 in 2007, and subsequently increased to approximately 80,000 in 2010, which represents 0.13% of the total Japanese workforce of 62.6 million. In 1995, 70% of forestry workers were older than 50 years of age (Ministry of Health, Labor and Welfare, 2002). In recent years, this rate has decreased to 50%; nevertheless, forestry remains an aging industry in comparison with the overall average industry that has 40% of workers older than 50 years of age.
The total number of forestry worker accidents has decreased in recent years, but the frequency of accidents remains at a high level. The forestry industry has 15 times higher incidence ratio per 1000 workers than other industries, and six times higher than the construction industry.
The self-sufficiency rate of domestic timber peaked at 94.5% in 1955, fell to under 18% in 1995, and subsequently recovered to 26% in 2010. The timber price of middle-class Sugi log (φ = 14–22 cm, length = 3.65–4 m) was 8200 yen m−3 in 1960, increased to reach 38,700 yen m−3, and subsequently fell to 10,900 yen m−3 in 2009 (lower than in 1960). The log price at roadside could pay the wages of 11.8 workers in 1960 but only 0.22 workers in 2010. In 2010, forestry production generated 157.6 billion yen, representing 0.03% of Japanese GDP (481.8 trillion yen).
f Forest Management Prescription
The forest management prescription combines different practices aimed at developing sustainable forests.
(i) Afforestation
Planting seedlings or sowing seeds is practiced; the planting density depends on the species, region, and production objectives. For example, planting densities are 1500 ha−1 for Obi forest district in Miayzaki prefecture, 6000–8000 ha−1 for Owase forest district in Mie prefecture, 8000–10,000 ha−1 for Yoshino forest district in Nara prefecture, and 10,000–12,000 ha−1 for Kitayama forest district in Kyoto prefecture. Today, the standard planting density in Japan is 3000 ha−1. Recently, the afforestation area has decreased because of the increasing non-clear-cut operations.
(ii) Tending
Tending is practiced to stimulate tree growth for developing healthy forest after planting until harvesting. The tending practice consists of weeding, snow-break preservation, pruning, cleaning cutting, climber cutting, thinning, etc.
Weeding
Weeds and shrubs are removed to avoid suppression of planted seedlings. It is practiced during spring and summer for about 5 years after planting. In recent years, the weeding area has decreased because of reduction in the afforestation area. Weeding and planting that are labor intensive have previously contributed to spring and summer employment.
Snow-Break Preservation
If planted seedlings felled by snow are left, the top of the seedlings will grow to above the fallen position with a crooked base. Therefore, the planted seedlings are raised for normal growth.
Pruning
Unnecessary and lower branches are cut down to produce knot-free timber with high quality. Pruning is practiced during non-growing season in autumn and winter.
Climber Cutting
This operation removes the climbers that wind around planted trees to prevent the latter growing healthily. Climbers often proliferate after weeding until crown closure; they are removed to maintain healthy tree growth and avoid debasement of the timber quality.
Cleaning Cutting
This operation removes shrubs that prevent growth of the planted tree. Cleaning cutting is practiced several times after weeding to remove branches coming into contact with each other.
(iii) Thinning
Thinning is included in tending to remove some of the planted trees after crown closure in order to induce intraspecific competition. The adjustment of forest density is aimed at reducing competition, improving timber quality, promoting growth of floor vegetation, and developing the multiple functions of artificial forests. Thinning is indispensable in Japan for developing healthy artificial forests. There are various methods of thinning.
Thinning from Above
With thinning from above, upper-story trees (dominant trees) are removed from stands, while lower-story trees (oppressed trees) are left in place. The main purpose of thinning from above is to generate large incomes.
Thinning from Below
With thinning from below, only lower-story trees are removed from stands.
Thinning from All Stories
With this method, trees of all stories are removed from stands. The same result is achieved by line thinning and zone thinning.
Qualitative Thinning
With qualitative thinning, felling trees are determined beforehand based on their characteristics such as superiority or inferiority of crown, crook of stem, and flaw of stem among many others.
Quantitative Thinning
With quantitative thinning, the quantity (number or volume) of felling trees is determined beforehand and some trees are selected for quantitative thinning based on similar tree characters.
Mechanical Thinning
With mechanical thinning, felling trees are selected mechanically using line thinning or zone thinning. In Japan, line thinning was first practiced in the 1970s.
Traditionally, the thinning ratio was generally 20–25%. Today, however, thinning is often practiced with a ratio of 30–35%. Intense thinning (40–45%) is sometimes practiced; 10–15 years after thinning, the stand volume of most 36- to 50-year-old forests recovers to at least the same level as that prior to thinning.
(iv) Regeneration Cutting
Regeneration cutting involves removing trees that have reached their usable age to promote the growth of next-generation trees (regeneration). Clear cutting means cutting all or most stands. Although the technique and practice of cutting and afforestation is easy, public function must be secured. Selective cutting involves cutting mature trees every few years to several decades. This practice causes minimal change to the status of a forest, and can sustainably breed next-generation trees. There are two methods of selective cutting: single tree cutting and small group tree cutting.
Shelter wood cutting involves cutting and utilizing the forest where it divides several times (or dozens of times) and introducing next-generation trees.
g Seasonality of Forestry Working
Forestry operations are outdoor occupations that are influenced by the weather; inclement weather leads to lost working days. This operation is also seasonal because it is practiced in accordance with the growth of trees. An example of an annual working schedule is shown as follows:
• January–March: Thinning or regeneration cutting
• February–March: Ground clearance
• September–October: Cleaning cutting
• October–December: Pruning (thinning or regeneration cutting).
During spring and summer, trees are heavy, tarnishable, and rotable; therefore, they are not suitable for felling. Additionally, the timber price is lower during summer and winter than autumn and spring.
6.3.2 Harvesting Technology of Forest Biomass
a Logging Operation
(i) Felling
This practice involves felling standing trees by using axes, saws, or chainsaws.
(ii) Yarding, Skidding
The felled trees or bucked logs are moved to the forest road or landing, where convenient transportation is available. Kiyose or Yabudashi are traditional terms for yarding; however, today, Kiyose refers to prehauling. Yarding methods include classified manpower yarding, animal skidding, and machine yarding. Today, machine yarding is mainly practiced. Depending on tree form, yarding consists of short-stem yarding, full-stem yarding, and whole-tree yarding.
Short-Stem Yarding
Logs are felled and bucked in the forest and collected. Unnecessary parts of the felled tree (branches, tree tops, crooked stem parts, etc.) are removed on-site in the forest. In comparison with full-stem yarding and whole-tree yarding, short-stem yarding leaves the greatest amount of biomass in the forest.
Full-Stem Yarding
Stems that are limed and not cut are collected. Branches are left in the forest.
Whole-Tree Yarding
Felled trees that are not limed and cut are collected, along with the branches. All biomass is removed from the forest.
(iii) Limbing and Bucking, Processing
Branches of felled trees are limbed, and the stems are cut to logs. Sometimes barking is carried out at the same time. Traditionally, this operation was practiced by using chainsaws; however, recently, the use of processors has been increasing in Japan.
b Present-Day Biomass Harvesting Technology
(i) Chainsaws
The chainsaw is a hand-held machine, which mechanically turns a chain of saw blades at high speed. It is used to fell stands, limb branches and cut timber. The use of chainsaws increased rapidly in Japan after destruction of trees by the Toyamaru typhoon of 1954. Chainsaw operators are required to attend a course on tree-felling work. Chainsaw felling is the mainstream forest operation in Japan, where most forests are located on steep terrain. Hence, chainsaw accidents account for at least 50% of deaths within the forestry sector, with 20% of these deaths caused by hung-up trees.
(ii) Yarders
A yarder is a log-collecting machine that mechanically turns an internal drum to release and rewind a wire rope. According to the Industrial Safety and Health Law Enforcement Ordinance Article 6, the cable-yarding system with skyline is defined as equipment in which “timber or fuel wood is rolled up or carried in the air using power with skyline, carriage, prop and attachments.” Employers must elect a person to be in charge of forestry cable-yarding with skyline. The use of cable-logging systems in Japan increased rapidly after World War II. Typical systems include the endless-Tyler system, downhill North Bend system, and double endless system. In addition, an H-type system that can collect logs from a wide area is in use. In recent years, cable logging has been decreasing and there are concerns that this will affect the technique of cable yarding. In 2009, the number of yarders accounted for slightly more than half of the total number of high-performance forestry machines (Forestry Agency, 2012a).
(iii) Processors
The processor takes limbed whole trees with branches and leaves, cuts them into logs, and bunches the logs. In Japan, many attachments are available for a processor head (e.g., backhoe, oil pressure shovel). With regard to movable equipment, crawler-type processors are common in Japan whereas wheel-based machines exist in Europe and America. The processor head consists of a grapple arm for catching timber, feeding equipment such as a feeding roller or crawlers, a cutter to remove branches while feeding timber, a head sensor to measure timber length while feeding, and a chainsaw for cutting timber into logs. The spread number of processors in Japan is increasing.
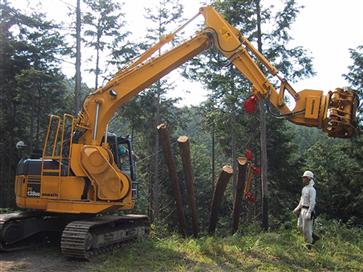
In recent years, a new type of processor has been developed to cut the top end of the tree and its branches by using scissors, and deposit the wood directly in a container. These features are added to its conventional logging and lumber-production function (Mozuna et al., 2011).
(iv) Harvesters
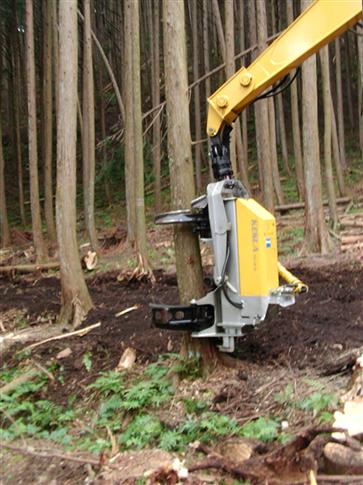
A harvester travels throughout the forest felling standing trees, limbing branches, cutting timber into logs, and bunching the logs. In addition to their processing role, harvesters operate as construction machines (e.g. backhoe, oil pressure shovel) with attached harvester heads. As far as movable equipment is concerned, crawler-type harvesters are common in Japan whereas wheel-based machines are popular in Europe and America. Harvesters are equipped with a tilt system that is capable of felling standing trees. In comparison with processors, the number of harvesters has increased in recent years because of their capability of handling timber on the narrow spur roads constructed on steep terrain. In addition to roller-type harvesters, stroke-type machines (Figure 6.9) and crawler-type machines (with a timber-feed system) have recently been introduced.
(v) Tower Yarders
A tower yarder (classified as a cable-logging forestry machine) is a movable yarder equipped with an artificial prop. Traction types and self-run types (e.g. loaded on the truck loading) are available. In recent years, the number of tower yarders in Japan has remained relatively stable. Machines equipped with a processor and tower yarder are common in other countries. Typical yarding systems include the downhill North Bend system, running skyline system, and high-lead system. With regard to log carriage, various mechanisms are available, from a simple type equipped with only two guide brocks to a remote control type with a built-in drum for lifting logs.
(vi) Swing Yarders
A swing yarder (Figure 6.10) is a self-run movable yarder mounted on a construction machine (e.g. backhoe, oil pressure shovel) equipped with a winch, and using an arm and boom to substitute for a prop. Similar to a tower yarder, a swing yarder is classified as a cable-logging forestry machine. In contrast to tower yarders, swing yarders are becoming popular in Japan, but are uncommon in other countries.
(vii) Feller Bunchers
Feller bunchers travel throughout the forest to fell standing trees and bunch whole trees without limbing. The major type consists of a feller buncher head attached to a construction machine (e.g. backhoe, oil pressure shovel). Feller bunchers are uncommon in Japan.
(viii) Grapples
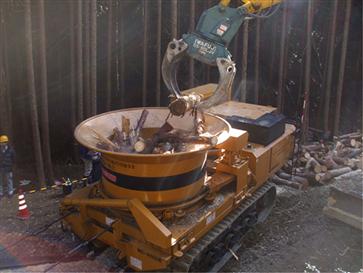
This machine has an attached grapple head to catch logs and pass them to a construction machine. Grapples are used to collect, sort, load (Figure 6.11), and prehaul trees, and may therefore be considered as general high-purpose machinery. Although wheel-based machines exist, the most common type in Japan is the crawler-type grapple.
(ix) Skidders
A skidder travels throughout the forest and pulls whole trees that have been lifted at one end. They are increasingly used in Europe and America, but are uncommon in Japan.
(x) Forwarders
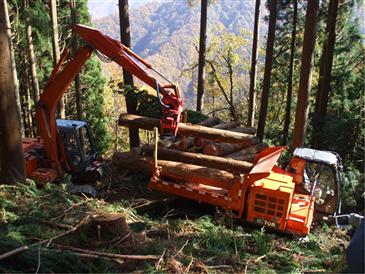
A forwarder (Figure 6.11) is a self-run machine that loads logs using a grapple crane, and transports them to the landing or forest road. In Japan, most movable forwarders use crawler-type equipment. The load capacity varies from 3 to 6 tons. A model equipped with a carrier structure to push the bulky biomass forward has recently been developed (Jinkawa et al., 2011).
(xi) Bundling Machines
This machine constructs bundles (Figure 6.12) by compressing the bulky biomass (mainly on the branch) obtained from the logging and timber production work of harvesters or processors. The resulting bundle can be handled (like a log) by a grapple. Transportation of bundles with trucks or trailers is much more efficient than transportation of raw branches. Domestic bundling machines have recently been developed (Yogi et al., 2006, 2008; Murakami and Yamada, 2008).
(xii) Mobile Chippers
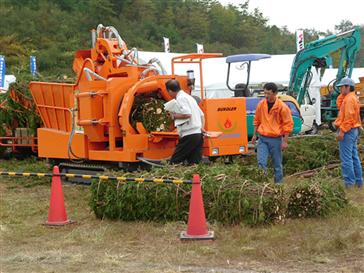
A mobile chipper (Figure 6.13) is a self-run machine that crushes raw wood on the forest road or landing to reduce the volume of harvested biomass so that it can be transported more efficiently. In some countries, combined machines, e.g. chipper truck (a chipper combined with a truck) and chipper forwarder (a forwarder combined with a truck), are available.
(xiii) Self-Propelled Carriages
A self-propelled carriage hanging from a wire rope suspended in the forest (without using a mechanical yarder) is used to collect timbers using an automatic winch. The number of mobile yarders in Japan had increased until 2000, but has recently been decreasing.
(xiv) Monorails
A monorail is a riding or baggage vehicle, which is connected to a powered vehicle equipped with engine, driving wheel, operation device, and braking system, and runs on a rail supported by a prop. Different types of running methods are available. In the chinning type the vehicle is hung under the rail, whereas in the mounted type the vehicle is mounted over the rail. With regard to drive type, in the pinion-rack type, the pinion pin of the driving wheel engages with a wave-shaped rack that is attached to the side and bottom of the rail. This allows the vehicle to climb steep slopes of around 45° so that it moves along the local topography to minimize disturbance to the forest floor or soil. The rail structure may differ among manufacturers but the versatility is low.
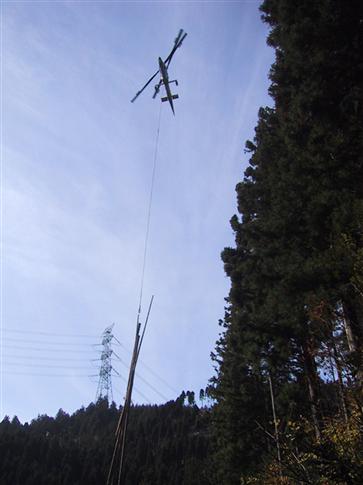
(xv) Helicopters
Helicopters can be loaded and unloaded while hovering (Figure 6.14) with a high transportation capability. However, helicopter transportation is limited to high-value or high-volume materials because of high operating costs. Several other factors including the requirement to obtain different licenses for specific models must be considered for using helicopters for forest-related transportation.
6.3.3 Forest Road Network as an Infrastructure for Biomass Harvesting
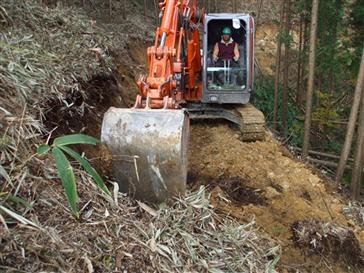
With regard to the forest management infrastructure, public road passing through or within 200 m from a forest and forest roads have been constructed for many years in Japan. However, the importance of the spur road network as an operating base for forestry machines or the base of warm forest management (detailed road network) has recently been emphasized. Successful examples and technical standards have been clarified, and the spread of spur or strip roads (Figure 6.15) is regulated. In 2006, the Forestry Agency designated the component of the road network for forestry, and the function of each category of forest road, spur road, and strip road. In addition, the “Forest and Forestry Revitalization Plan 2009” was developed to establish standards for the various roads serving forests, such as “forest road”, “wood transportation road” for trucks, and “log salvage road” for forestry machines.
According to the current version of Forest Road Regulations Article 3, roads for forestry are defined based on the process of divergence with regard to forest management. A “main road” is defined as a core road of the exploitation area, a “branch road” diverges from “a main road”, and a “lateral road” differs from a “branch road”. In addition, the Forest Road Regulations Article 4 classifies the concrete standard of each road into two categories, “motor road” (grades 1–3) and “light motor road”. For motor road, a first-grade road (width 4.0 m, single traffic lane) is a main road that connects public roads such as a national road, prefectural road, or municipal road, whereas a third-grade road (width 2.0 or 1.8 m) is a “branch road” or “lateral road” located in a small exploitation area. All other roads are classified as second grade, which has vague definitions. In Japan, second-grade roads account for 69.1% of all forest roads, with first-grade and third-grade roads representing 11.7% and 19.2% respectively (Forest Road Technology Meeting for the Study, 1999). Light motor roads (width between 1.8 and 3.0 m) are defined as roads that serve only light cars. Monorail was defined in the forest road regulations revised in 2001, and categorized as forest road. It can be constructed using subsidies for forest road projects. Matsumoto (2000) defined the following relationship in Aichi prefecture:
![]() (6.6)
(6.6)
where S is the exploitation area of forest road (ha) and P is the number of forest owners of forest land in the exploitation area. The agreement of all owners (average 50 persons) is required for forest road construction (Matsumoto and Kitagawa, 1999b).
The standard for constructing a forest road network is related to the road network density D (m ha−1), according to the following formula:
![]() (6.7)
(6.7)
where L is the road length (m) and S is target forest area (ha).
In addition, the average yarding (arrival) distance from the road to forest land is used as an index to express a qualitative standard. When roads are placed in parallel in a rectangular area, the average yarding distance Mg (m) is expressed by the following formula:
![]() (6.8)
(6.8)
where D is the road density (m ha−1) (Segebaden, 1964).
If only one side of road is available, Mg is calculated using the following formula:
![]() (6.9)
(6.9)
There is a difference between the calculated Mg (theoretical distance) and the actual average yarding distance (m). The parameter Vcorr is the adjustment coefficient, and is expressed by following formula:
![]() (6.10)
(6.10)
where Vcorr is 1.0 in the above-mentioned rectangular model, but becomes large in actual road networks with many deviations, divergences, or detours. Examples of Vcorr values in Japan are as follows:
• 1.18–1.68 for forest road networks in which road placement is as uniform as possible (Hori et al., 1971).
• 1.2 for forest roads in each exploitation area (Sakai, 1990).
• 1.42–2.41 for forest road networks of the national forest, and 1.8 for an outline price (Sawaguchi, 1996).
• 1.7 for a road network that includes public road and forest road in a municipality unit (Matsumoto and Kitagawa, 1999a).
• 1.91–2.15 for a road network that includes public roads, forest roads, and spur roads in a municipality unit (Nakazawa et al., 2005).
6.3.4 Harvesting System for Biomass
a Productivity
Productivity refers to the amount of production from an individual machine or a single site; it is expressed as m3/machine or m3/day for timber, and t/machine or t/day for other wood biomass. Labor productivity, which is the productivity divided by the labor input, is expressed as the productivity per unit hour and unit labor input, i.e. m3 per person per hour for timber, and t per person per hour for wood biomass, or m3 per person per day for timber and t per person per day for wood biomass. Labor productivity is globally expressed as m3 per person per hour (or t per person per hour), and it is often expressed as m3 per person per day (or t per person per day).
Labor productivity in Japan is lower than that in Europe and America. However, the actual working hours of the day differ among companies. There are several types of unit processes related to forestry work, e.g. felling, prehauling, limbing, bucking, and yarding. On timber production sites, various machines operate in different unit processes collectively known as the operation system.
The labor productivities for each unit process within the operation system often differ. The total labor productivity (TLP) for the whole operation system is calculated using the following formula:
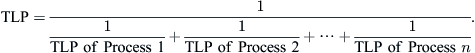 (6.11)
In this formula, a smaller process number in whole system is preferable when the productivity is concerned. If the labor productivity of all processes is 10 m3 per person per hour and if only one unit process is involved, the labor productivity of the whole operation system is thus 10 m3 per person per hour. However, in case two or three unit processes are involved, the labor productivity for the whole system is 5 m3 per person per hour for two unit processes, and 3.3 m3 per person per hour for three unit processes. In addition, keeping the labor productivities at the same level as possible is preferred for the forestry operation.
The average Japanese labor productivity for the timber industry is 3.45 m3 per person per day for thinning and 4.76 m3 per person per day for regeneration cutting. In its “Basic Plan for Forest and Forestry”, the Forestry Agency has set a goal for labor productivity to exceed 10 m3 per person per day within 10 years (Forestry White Paper).
b Harvesting System
The forest biomass is harvested using machines, staff, and infrastructure. The Japan Forestry Agency recommends a number of different operating systems according to terrain conditions as listed in Table 6.1 (Forestry Agency, 2010).
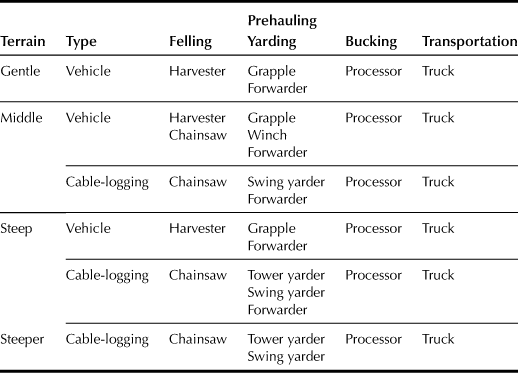
(ii) Middle Terrain (15–30°)
• Felling: Harvester or Chain-saw → Prehauling: Grapple or Winch → Bucking: Processor → Yarding: Forwarder → Transportation: Truck
• Forest road density: 75–200 m
• Felling: Chainsaw → Prehauling: Swing yarder → Bucking: Processor → Yarding: Forwarder → Transportation: Truck
or
(iii) Steep Terrain (30–35°)
• Felling: Harvester → Prehauling: Grapple → Bucking: Processor → Yarding: Forwarder → Transportation: Truck
• Forest road density: 100–250 m
• Felling: Chainsaw → Prehauling: Tower yarder or Swing yarder → Bucking: Processor → Yarding: Forwarder → Transportation: Truck
or
• Felling: Chainsaw → Prehauling: Tower yarder or Swing yarder → Bucking: Processor → Transportation: Truck
6.4 Information System for Forestry Production
Masahiro Iwaoka
6.4.1 Information for Forestry Production
a Site Index
Site quality is a concept to classify the growth potential of forest trees for a particular site. It is a fixed constant with respect to tree species, and thus must be defined for each species. There are two methods for assessing site quality: (1) direct measurement of tree growth such as yield in volume or tree height growth, and (2) observation of environmental factors such as species or ground cover of vegetation under trees. The increment of wood volume during a cutting period indicates site quality directly; however, the result is influenced by stand density or duration of the cutting period so that it cannot be an objective indicator. Therefore, tree height, which is easy to measure, is usually used for indicating site quality because it is sensitive to site productivity but not sensitive to stand density. However, because tree height is the only parameter to index site productivity, it needs to be properly converted into yield using a specific yield conversion table. Site quality is generally classified into three or five classes designated as I, II, III or 1, 2, 3 (Shiraishi, 2001).
Tree height at specified stand age is thus used to indicate site quality. For example, the average height in feet of the top 150 dominant trees growing in one acre is used as the site index in the USA. The stand age is 50 years old on the east coast where the major species grow quickly, and 100 years on the west coast where the major species grow slowly. In Japan, the average height of dominant trees expressed by rounded-off integers is used as site index; the stand age is usually 40 or 50 years.
Site index can also be calculated based on environmental factors such as elevation, topography, geology, soil, meteorology, and others using score tables. The score tables for site indices are developed by using quantification theory I for calculating site indices from the environmental factors. The sum of all scores is site index (Ohta et al., 1996).
b Evaluation of Potential for Forest Functions
The various forest functions have been classified by the Science Council of Japan classified into eight types: conservation of biodiversity, conservation of global environment, sediment disaster prevention and conservation of soil, water source cultivation, comfortable environment forming, health and recreation, culture, and material production. Prefecture governments in Japan try to evaluate the potential of each of the above functions based on official notices of the Forestry Agency. In this trial, score tables for evaluating four functions, i.e. flood prevention, water source cultivation, sediment disaster prevention, and health and culture, will be made based on quantification theory II, flood. Some prefectures use GIS to evaluate functions based on environmental information (Tanaka, 2001).
c Yarding Distance of a Cable Logging System
A Scandinavian style cut-to-length mechanized logging system equipped with a harvester and a forwarder is spreading worldwide. It has also become popular in Japan for dense logging road networks. However, there are many sites not suitable for dense logging road networks because these sites have extremely steep topography. Cable yarding systems are needed at such sites because of the long yarding distances due to the low density of road networks. Usually, the cable yarding systems use aerial lines strung over the top of trees and uneven surfaces. Therefore, the area covered by a cable yarding system can be calculated using the buffering function available in GIS. This approach is similar to the basic concept of opening percentage as proposed by Backkmund (1966).
6.4.2 Using a Geographic Information System (GIS)
a What is a GIS?
A GIS is a technique to manage and process spatial data, and display the results visually to enable advanced data analyses and timely judgment using geographic position as a clue (Geospatial Information Authority Japan, 2012). The company ESRI that developed the popular ArcGIS states: “a geographic information system (GIS) integrates hardware, software, and data for capturing, managing, analyzing, and displaying all forms of geographically referenced information.”
A GIS can display a map and information, extract information, patchily paint map, overlay figures, measure distance, measure area, judge osculation or overlap of features, and search neighborhoods, among many other things. Its functions are based on Boolean operations such as logical AND, OR and XOR in figures, relations within neighborhoods such as buffering, analysis on aging, simulation on virtual reality, analysis of three-dimensional space, and many others. GIS manipulates data in either vector or raster mode. Any shape of figures can be handled in vector mode whereas only fixed shape and sized figures can be handled in raster mode. The positioning accuracy depends on the scale of the based map in a vector model and minimum units such as meshes. Objects are represented by nodes, arcs or polygons in a vector model and unit area in a raster model. Attributes are linked to node, arc or polygon in a vector model and unit area in a raster model. A vector model has functions to process graphics, and a raster model does not have functions. On the other hand, data structures are more complex in a vector model than in a raster model.
b GIS in Forestry Industries
GIS is used in many fields to manage geographic data. In forestry industries, GIS is a useful tool to manage forest data because forest land spreads over wide areas with drastically different conditions. The forest data include lot number, stand compartment number, stand area, stand type (natural forest and plantation), tree species, blending ratio of species, stand age, soil type, and many others. In Japan, many prefectures use GIS to manage these forest data. For example, Gifu prefecture began to publish web GIS in 2005 and then switched the web GIS system to Gifu prefecture unified GIS. Data on forest type, vegetation type, forest road network, and others are open to the public via the internet (Gifu prefecture, 2012).
GIS can be used for calculating site index and yarding distance, as well as analyzing potential of forest functions and alignment of road network, etc. It is also used as part of the unified information system. For example, Komatsu Maxi is the umbrella term for Komatsu Forest’s comprehensive control and information system for effective and profitable logging. It has all the necessary components to give sawmills, forestry companies, and contractors full control over the logistics chain from order to roadside delivery. The GIS is also used to control machines for optimum productivity and flexibility. GIS results and records are plotted on the map and site information stored in map layers is added by the operator.
c Positioning Method with GPS
Global positioning system (GPS) is now a popular and useful tool for positioning. At first, methods that give high accuracy of positioning were studied by many researchers because the GPS positioning data includes selective availability (SA) with the signal intentionally degraded for civilian use. High-quality positioning data became available after 2000 because the SA had been turned off. After this, any user can get highly accurate positioning data with accuracy of less than 20 meters in addition to many additional available applications. GPS has been used with GIS to position specific points, to measure forest road networks, and sometimes to fix maps. Nowadays, new applications are developed to analyze forestry operations. For example, GPS is mounted on forwarders for positioning in order to control their operations. Moreover, GPS is also mounted on the carriage of a cable yarder to position the carriage and to control the carriage operation.
6.4.3 Applications of GIS for Forest Management
a Site Index
The author has calculated site indices of Japanese cedar (Cryptomeria japonica) and Japanese cypress (Chamaecyparis obtusa) growing in the forest area of Tokyo using the score table of Tokyo and ArcGIS. The environmental factors used were elevation, inclination, soil types, geology, local topography, deposition pattern, effective depth, soil texture, and aspect. The elevation, inclination, and aspect were calculated from a digital elevation map (DEM) with a horizontal grid spacing of 50 meters; other elements were collected from forest registers. The site indices were calculated regarding all stands as Japanese cedar plantations or as Japanese cypress plantations.
A comparison of site indices for Japanese cedar and Japanese cypress reveals that the Japanese cypress has much higher site indices than Japanese cedar in this area. This result is contrary to the present situation of forest cover type. Japanese cedar, however, grows faster than Japanese cypress, and small-diameter logs of Japanese cedar have been produced historically for scaffolding in this area. As shown in this example, site indices can be easily calculated and recalculated for a wide area using GIS.
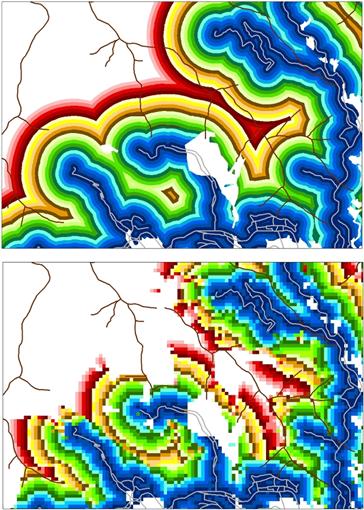
b Yarding Distance of a Cable Logging System
The area covered by a cable yarding system is usually calculated with the GIS buffering function as described above. However, the author advocates that the local topography must be considered for evaluating mountainous diversified terrains. Cable yarding systems must also be influenced by local topography; for example, the usual cable yarding system is difficult to string over high ridges. The possibility of setting up a yarding cable is evaluated by investigating the production area; only the stands with the possibility of setting up a yarding cable can be used for timber production. The author has calculated yarding distances and area covered by cable yarding systems at each stand in the forest area of Tokyo to consider the possibility of setting up a yarding cable by using the Spatial Analyst extension of ArcGIS 8. The viewshed analysis is carried out on the forest terrain from points 10 meters above forest roads. The distance of 10 meters indicates the height of head spar for cable yarding. The local topography of forest terrain is collected from the DEM, and the visible points are selected as sites with the possibility of setting up a yarding cable. This method was applied on each actual stand. For stands with the potential of setting up a cable yarding system, the cable span is calculated as the inclined distance between the visible point of the nearest visible forest road and the farthest point of the stand from the visible point. As a result, the distribution of covered area for each cable span is lower than the usual results obtained using the buffering method that does not consider terrain elevation. This result means that yarding distances become longer when the possibility of setting up a cable is considered; this causes a reduction in productivity with higher logging costs. This type of analysis could not be done without GIS. The analytical results are shown in Figure 6.16.
References
1. Backmund F. Kennzahlen für den grad der erschließ ung von forstbetrieben durch autofahrbare wege. Forstwissenschaftliches Centralblatt. 1966;85(12):342–354.
2. Chosa T, Shibata Y, Kobayashi K, et al. Yield monitoring system for a head-feeding combine. Japan Agricultural Research Quarterly. 2005;40(1):37–43.
3. Chosa T, Furuhata M, Omine M, Sugiura R. Development and improvement of air-assisted seeding for paddy field following map information. In: van Henten EJ, Goense D, Lokhorst C, eds. Precision agriculture ’09. Wageningen: Wageningen Academic Publishers; 2009a;127–132.
4. Chosa T, Furuhata M, Omine M, Matsumura O. Development of air-assisted strip seeding for direct seeding in flooded paddy fields. Japanese Journal of Farm Work Research. 2009b;44(4):211–218 [in Japanese with English summary].
5. Chosa T, Furuhata M, Motobayashi K, et al. Operation analysis of an air-assisted strip seeding using GPS. Japanese Journal of Farm Work Research. 2009c;44(Extra 1):15–16 [in Japanese].
6. Daikoku M. Development of computer-assisted system for planning work schedule of paddling and transplanting in distributed fields. Japanese Journal of Farm Work Research. 2005;40(4):210–214 [in Japanese with English summary].
7. Forestry Agency. Final report of forest road network and operation system committee. 2010; <http://www.rinya.maff.go.jp/j/seibi/saisei/pdf/romousaisyuu.pdf>; 2010; Accessed 23.08.2012 [in Japanese].
8. Forestry Agency. Annual report on forest and forestry in Japan 2012. Tokyo: Association of Agriculture and Forestry Statistic; 2012a; [in Japanese].
9. Forestry Agency. The forest and forestry statistics handbook. 2012b; <http://www.rinya.maff.go.jp/j/kikaku/toukei/pdf>; 2012b; Accessed 22.08.2012 [in Japanese].
10. Furuhata M, Chosa T, Shioya Y, Tsukamoto T, Seki M, Hosokawa H. Current status, issue and perspective of direct seeding culture using an air-assisted row seeder. Hokuriku Crop Science. 2011;46:45–48 [in Japanese].
11. Geospatial Information Authority Japan. What is GIS? 2012; <http://www.gsi.go.jp/GIS/whatisgis.html>; 2012; Accessed September 2012.
12. Gifu prefecture, Gifu Forenavi. 2012; <http://www.gis2.pref.gifu.jp/MyMap2_0/GifuAdvanceMap/GifuAdvanceMap.jsp>; 2012; Accessed September 2012.
13. Goto T. Paddy management works by riding machine. Journal of the Japanese Society of Agricultural Machinery. 1997;59(4):131–135 [in Japanese].
14. Hamada Y, Nakajima Y, Hayashi M, Shaku I. Development of the V-furrow no-till direct seeding of rice: Stabilization of culture by adopting the water-paddling seedbed preparation. Japanese Journal of Crop Science. 2007;76(4):508–518 [in Japanese with English summary].
15. Hori T. A classification of ground configuration for logging planning. Journal of Japanese Forestry Society. 1965;47:168–170 [in Japanese].
16. Hori T, Kitagawa K, Hasegawa Y. Study on the area distribution of the terrain distances in a forest. Journal of Japanese Forestry Society. 1971;53:355–358 [in Japanese].
17. Hosokawa H. Rotary tilling and ridge-making implement of soybean for avoiding wet injury. Proceedings of the NARO international symposium on agricultural machinery 2009;189–192.
18. Inoue Y. Forest management. Tokyo: Chikyusha; 1974; [in Japanese].
19. Jinkawa M, Yoshida C, Mozuna M, et al. Development of a forwarder for biomass. Journal of the Japan Forest Engineering Society. 2011;26:227–231 [in Japanese].
20. Kamiya T, Numano N, Yagyu H, Shimazu H. Field datalogger system using mobile phones and a web-based interface to allow the local community to determine the watering schedule for mandarin orange. Agricultural Information Research. 2011;20(3):95–101.
21. Komatsu Forest, Maxi. 2012; <http://www.komatsuforest.com/default.aspx?id=2138&productId=&rootID=1475>; 2012; Accessed September 2012.
22. Kurihara E, Umeda N, Hidaka Y, Sugiyama T, Nonami K. Study on increased high-moisture-paddy adaptability in combine (Part 3) – Schema of practical model and result of proof test. Journal of the Japanese Society of Agricultural Machinery. 2011;73(6):387–396 [in Japanese with English summary].
23. Loan NTT, Chosa T, Tojo S. Effects of auxiliary airflow in external side of seeding tube in air-assisted seeding for rice paddy. Proceedings of the 2011 CIGR international symposium on “Sustainable bioproduction – Water, energy, and food”, No 22D07, on CD-ROM 2011.
24. Matsumoto T. Evaluation of forest road networks to forestry and social infrastructure in a mountainous area. Nagoya University Forest Science. 2000;19:55–100 [in Japanese with English summary].
25. Matsumoto T, Kitagawa K. Relationship between current forest operations and provision of roads in private forests. Journal of Forest Planning. 1999a;5:19–27.
26. Matsumoto T, Kitagawa K. Current problems of consensus building between forest owners in forest road planning. Journal of the Japan Forest Engineering Society. 1999b;14:85–94.
27. Ministry of Health, Labor and Welfare. Handbook of forestry employment management 2002. Tokyo: Koyo-Mondai-Kenkyukai; 2002; [in Japanese].
28. Miyasaka J, Ohdoi K. Optimization methods and case studies for farm work scheduling. Japanese Journal of Farm Work Research. 2005;40(4):205–209.
29. Mizumoto K. Early modern Japan recounted by the grass mountain. Tokyo: Ymakawa-Shuppansha; 2003; [in Japanese].
30. Morimoto E, Umemoto H, Shimada Y, et al. Feasibility study of precision agriculture in Ishikawa rice production. Conference abstracts of the 8th international conference on precision agriculture 2006;21.
31. Mozuna M, Jinkawa M, Yoshida C, et al. Trial manufacturing of processor that can be used also for biomass harvesting. Journal of the Japan Forest Engineering Society. 2011;26:221–225 [in Japanese].
32. Mukouyama T, Motobayashi T, Chosa T, et al. Dry matter production and grain yield of high yielding rice cultivar, Takanari, directly seeded in the paddy field with an “air-assisted drill”: Effects of planting pattern on ecophysiology of direct seeded rice. Japanese Journal of Crop Science. 2012;81(4):414–423 [in Japanese with English summary].
33. Murakami M, Yamada T. Volume reduction of forest biomass with large scale bundling machine. Journal of the Japan Forest Engineering Society. 2008;23:175–178 [in Japanese].
34. Nakazawa M, Matsumoto T, Yamada Y, Kondo M. Route planning and road construction priority based on forest operations in Aichi prefecture, Japan. Journal of the Japan Forest Engineering Society. 2005;20:71–82.
35. Nanseki T, Matsushita S. Farm planning support system with FAPSDB. Japanese Journal of Farm Work Research. 2005;40(4):199–204 [in Japanese].
36. Nishimura Y, Hayashi K, Gotoh, et al. Development of a precision direct drill seeder for direct sowing of rice on paddy field (Part 2) – Schematic of a precision direct drill seeder and seed depth control. Journal of Japanese Society of Agricultural Machinery. 2001;63(6):114–121 [in Japanese with English summary].
37. Nishimura Y, Hayashi K, Gotoh HM, Ichikawa T. Development of a precision direct drill seeder for direct sowing of rice on paddy field (Part 4) – Regional adaptability of developed seeder. Journal of Japanese Society of Agricultural Machinery. 2003;65(1):143–151 [in Japanese with English summary].
38. Ohta T, Kitamura M, Kumazaki M, Suzuki K, Sutou S, Tadaki Y, Fujimori T, eds. Encyclopedia of forests. Tokyo: Maruzen; 1996.
39. Sakai T. Geographical features of Japanese forest. Journal of the Japan Forest Engineering Society. 2000;15:221–224 [in Japanese].
40. Sasaki Y, Tasaka K, Tsuchiya S, et al. Protein content of wheat for bread by variable fertilization in south-western Japan. Proceedings of the 2nd Asian conference on precision agriculture (on CD-ROM) 2007.
41. Sawaguchi I. Studies on forest-road evaluation and forest-road standards in mountain forests (I) - Characteristics of parameters for forest-road evaluation. Bulletin of the Forestry and Forest Products Research Institute. 1996;372:1–110.
42. Segebaden GV. Studies of cross-country transport distances and road net extension. Studia Forestalia Suecica. 1964;18:5–70.
43. Shiraishi N. Site quality. In: The Japan Forestry Association Encyclopedia of forests and forestry. Tokyo: Maruzen; 2001;653.
44. Sugiyama J. Information technology and accountability system for produce. Journal of Japanese Society of Agricultural Machinery. 2004;66(4):16–20.
45. Tanaka K. Quantification theory. In: The Japan Forestry Association Encyclopedia of forests and forestry. Tokyo: Maruzen; 2001;533.
46. Togashi T, Shimotsubo K, Yoshinaga S. Development of seed-shooting seeder of rice combined with a paddy harrow and characteristics of the sowing depth. Japanese Journal of Farm Work Research. 2001a;36(4):179–186 [in Japanese with English summary].
47. Togashi T, Shimotsubo K, Yoshinaga S. Performance of seed-shooting seeder of rice combined with a paddy harrow and the growth characteristics of rice. Japanese Journal of Farm Work Research. 2001b;36(4):195–203 [in Japanese with English summary].
48. Toriyama K, Sasaki R, Shibata Y, et al. Development of a site-specific nitrogen management system of rice in a large paddy field. Japan Agricultural Research Quarterly. 2003;37(4):213–218.
49. Umeda N, Kurihara E, Shimazu M, et al. Development of the small conventional combine harvester. Proceedings of the joint conference on environmental engineering in agriculture, No D11, on CD-ROM 2012; [in Japanese].
50. Yogi K, Okabe S, Takuwa M. A study on the low cost harvesting and transporting of forest biomass – Development of No 2 bundling machine for branches and treetrops. Journal of the Japan Forest Engineering Society. 2008;22:285–288 [in Japanese].
51. Yogi K, Okabe S, Tsuge Y, Takuwa M. A study on the low cost harvesting and transporting of forest biomass – Development of a new bundling machine for branches and treetops. Journal of the Japan Forest Engineering Society. 2006;20:229–232 [in Japanese].
52. Yoshioka T, Suzuki Y. Unutilized resource amount of forest biomass. Journal of the Japan Forest Engineering Society. 2012;27:111–117 [in Japanese].