Evaluation of Biomass Production and Utilization Systems
Chihiro Kayo, Seishu Tojo, Masahiro Iwaoka and Takeshi Matsumoto
Abstract
Potential adverse impacts of biomass production such as deforestation, deteriorating environmental quality, and competition between food supply and biomass production have led to a demand for developing appropriate sustainability indicators and criteria. Life cycle assessment is a technique that considers the entire life cycle of concerned products and/or services from their resources through their use until final disposal (i.e. cradle to grave) by measuring the amounts of resources consumed and the pollutants formed in order to assess the environmental impact. The discussion on sustainability indicators for bioenergy production can assist in assessing the relationship between production and use of modern bioenergy and its sustainable development. Forest certification is one of several available tools to implement sustainable forest management driven by consumer’s intention. Remote sensing methods are used for large-scale investigations at the municipal, prefectural, and nationwide levels. Forest resource monitoring surveys using the standard Montreal Process have been practiced by the Forestry Agency to investigate the quantity, quality, and dynamics of forest resources in Japan. The sustainable use of bioenergy will demand a comprehensive understanding of the land use and management by applying available tools for monitoring gas emissions and surface runoffs of pollutants with the ultimate goal to abate excessive adverse environmental impacts.
Keywords
Inventory analysis; life cycle assessment (LCA); monitoring system; sustainability indicator; sustainable forest management
Chapter Outline
14.1. Life Cycle Assessment (LCA) on Bioenergy
14.1.2. Goal and Scope Definition
14.1.4. Life Cycle Impact Assessment
14.1.6. LCA Criteria on Biomass
14.2. Sustainability Indicators for Bioenergy
14.2.1. Importance of Sustainability Indicators
14.2.2. Sustainability Indicators Developed by the Global Bioenergy Partnership
14.3. Management of Forest Land for Biomass Production
14.3.1. Sustainable Forest Management
14.3.2. Forest Certification Schemes
14.4. Management of Farming Land for Biomass Production
14.4.1. Environmental Indicators for Agriculture
14.4.2. Nutrient Runoff from Biomass Production Fields
14.4.3. Abandoned Agricultural Land in Japan
14.5. Monitoring System for Forest Management
14.5.2. Monitoring Methods Applicable for Forest Management
14.6. Monitoring System for Farm Management
14.1 Life Cycle Assessment (LCA) on Bioenergy
Chihiro Kayo
14.1.1 The Concept of LCA
Human society consumes various products and services; their production, use, and final disposal gradually exhausts natural resources including minerals and fossil fuels, in addition to emitting pollutants in gaseous, liquid, and solid forms to deteriorate environmental quality. The root cause of the global environmental problems that we are facing today is the excessive burden imposed on the global environment due to mass production, mass consumption, and mass disposal to support human activities. To move toward a sustainable society requires that we minimize inputs from the natural environment to human society, and outputs from human society to the environment as well. Measuring the environmental burdens of products and services during their life cycle, and correctly ascertaining their impacts on the global environment are important initial steps toward a sustainable society.
Life cycle assessment (LCA) is a technique that considers the entire life cycle of particular products and services from their resources to their use and final disposal. This is also known as the cradle-to-grave concept that measures the quantity of resources consumed and the emission of pollutants, and assesses environmental impacts during the steps of resource extraction, transportation, material production, part manufacture, product assembly, use, and final disposal. LCA is characterized by considering not only the visible environmental impacts of products and services but also the invisible elements when the products and services are created until they are finally disposed of.
Using the LCA concept to assess the environmental impact of a product was initiated in the USA and some European countries in the 1970s (SETAC, 1993), and the term “ecobalance” became popular in the 1980s. The 1992 Earth Summit in Rio de Janeiro (Brazil) led to the development of international standards for environmental management in 1993; the term “life cycle assessment” was then adopted internationally. LCA international standards (ISO) had been discussed by Technical Committee 207 on Environmental Management (TC207), and were published as ISO 14040–14049. Under this set of standards, the four steps in the general procedures for conducting a life cycle assessment are: “Goal and scope definition”, “Life cycle inventory”, “Life cycle impact assessment”, and “Interpretation”. General discussions of these four steps are provided in the following sections.
14.1.2 Goal and Scope Definition
The first step of goal and scope definition is to define the reason for initiating the study, how the results will be utilized, and who will benefit from the reported results in the objectives for conducting an LCA. Specifically, the product or service to be studied is determined, and the impacts to be assessed are clearly defined. If one is going to assess “the impact of wood pellets with a calorific value of 500 MJ on global warming” in accordance with this goal, what pollutants should be measured must be decided beforehand, and the scope within which they are collected must then be defined.
LCAs assess the “functions” of products. If the product is wood pellets, then the function is “heat use”. The unit that indicates the magnitude of this function is called the “functional unit”, such as “500-MJ calorific value”. When comparing multiple products in an LCA, the functional unit must be unified. If we are comparing wood pellets, coal, and oil, for example, the comparison must be based on the same functional unit of 500-MJ calorific value.
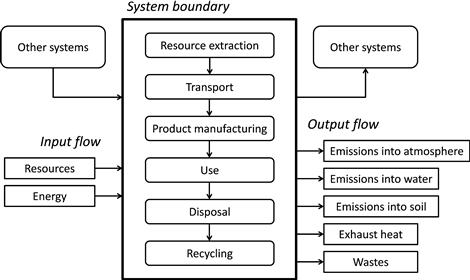
The boundary with the natural environment that subsumes the entire life cycle process of the assessed product or service is called the “system boundary”. Material flows that cross the system boundary from the natural environment into each process are “input flows”, whereas material flows from each process to the natural environment are “output flows”. Figure 14.1 is a schematic diagram of a system boundary, and the input and output flows. International LCA standards require that the scope of an LCA be clearly described as the system boundary.
14.1.3 Life Cycle Inventory
A life cycle inventory (LCI) is the step to collect data on the input flows of both resources and energy entering the entire LCA system and the output flows of the products and discharged emissions (output flows) across the same LCA system boundary. When conducting an LCI, one must first gather data on the manufacture, use, and disposal of the products being assessed. The data that are directly related to the products are generally called “foreground data”. Subsequently, one must investigate quantities of the input and output flows, e.g. pollutants discharged or emitted in producing power that is consumed when producing the materials to be used in the products, and when using the products. These data are indirectly related to the assessed products; hence, they are generally called “background data”.
Gathering foreground data involves conducting the material and energy balance in each of the life cycle processes in the manufacturing, transport, use, disposal, and recycling of a product. Although quantifying pollutants discharged or emitted from system boundaries into the atmosphere is desirable, gaseous emissions such as those of the primary greenhouse gas CO2 are often monitored infrequently. The equivalent greenhouse gas emissions can be obtained indirectly by determining the amount of energy consumed; the greenhouse gas emission intensity can then be estimated for each type of energy consumed, e.g. fuel oil or kerosene (Ministry of the Environment of Japan, 2012).
Collecting background data can be roughly divided into “process analyses”, in which calculations are based on physical quantities such as the consumed amounts of resources, and “I-O analyses”, in which the ad valorem environmental burden amounts are estimated based on the input–output tables published every 5 years by the Ministry of Internal Affairs and Communications. Background data obtained by using process analyses are produced by using physical numerical quantities such as the actual amounts of materials and fuel consumed by a factory, but the method used to collect data does not differ greatly from that for collecting foreground data. The data are easy to understand because they are presented as physical quantities so that figuring out detailed data based on the characteristics of the analyzed products is possible. However, the data are often insufficient even if one has searched for all possible background upstream or downstream data sets; the preparation of new data often becomes necessary. Therefore, process analysis is considered a labor-intensive method. For carrying out I-O analysis, a nation’s economy is divided into a number of sectors (e.g. 400 sectors for Japan’s economy) to represent the annual flows of goods and services among sectors in monetary units. Input–output tables can be used to determine the amounts of environmental burdens, such as the CO2 that is directly or indirectly emitted in conjunction with production activities (Nansai and Moriguchi, 2009). Although detailed analyses of individual products are difficult because input–output tables only present macroscopic statistical data for the whole nation, this method is suitable for analyzing average or nationwide emissions of environmental burdens. In general, LCIs commonly involve using process analyses to obtain foreground and other important data sets while adopting hybrid analyses to make use of input–output tables for deriving data of less importance.
14.1.4 Life Cycle Impact Assessment
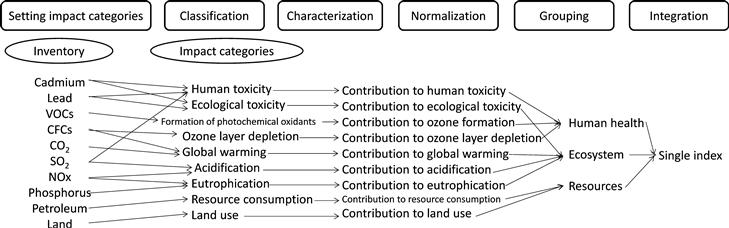
Life cycle impact assessment (LCIA) refers to the steps that assess the type and extent of environmental impacts that may arise quantitatively based on data collected in the LCI. The LCIA procedure primarily consists of: (a) categorizing, (b) classifying, (c) characterizing, (d) normalizing, (e) grouping, and (f) integrating environmental impact (Itsubo et al., 2007). Figure 14.2 shows schematically how these steps are related.
Categorizing impacts determines which technique will be used to assess what kinds of environmental problems (impact categories) such as global warming, ozone layer depletion, and acidification (SETAC, 1996). Classifying impacts is the task of sorting inventory data into their related impact categories and results in several substances being grouped into one impact category. For example, CO2, CH4, and N2O are grouped into global warming, whereas NOx and SOx are grouped into acidification. Characterizing impacts involves assessing the environmental impacts of impact categories. Here, characterization factors that have been created for each environmental problem in the impact category are designated. For example, global warming potential (GWP; IPCC, 1995) is often used as the characterization factor for global warming so that the type of greenhouse gases contributing to global warming and to what extent can be analyzed. Normalizing impacts is a process that normalizes the assessment results obtained by characterizing each impact category in order to make relative comparisons. Grouping impacts typifies the impact categories resulting from characterization and normalization according to certain fixed conditions. Integrating impacts assigns weights to impact categories to achieve a single index weighting. Integration methods are now a subject of research under worldwide discussion. For example, one question is at which stage, e.g. from the emission of environmental burdens to the point where actual harm is done, is the integration performed? A method that directly integrates impact categories is called “midpoint assessment”, whereas “endpoint assessment” is another method that calculates the actual magnitude of harm for items in each impact category, and remakes them into safeguard subjects such as “human health” or “ecosystem conservation” to be integrated later. In this way, although converting a number of approaches and methodologies into a single index weighting has been proposed, the resulting single index is often an economic or dimensionless indicator. Either way, the integration process requires that the different components of the natural environment, such as human health, the ecosystem, or social assets be weighed. The fairness and transparency of judgment criteria must be guaranteed because subjective value judgments are sometimes unavoidable. One must also fully keep in mind that results may change depending on how the environmental planners are tackling the problems, and how they implement the aforementioned integration method.
The LCIA methodology and scientific framework are still in development, and no specific item has been widely adopted. For this reason, among the international standards being implemented currently, (a)–(c) above are mandatory whereas (d)–(f) are optional. In other words, when carrying out an LCIA, one must perform all tasks up to and including characterization. Whether to carry out normalization and integration depends on the final objective because the difficulties of comprehensively judging the importance of different impact categories and formulating a single index are recognized.
14.1.5 Interpretation
The interpretation step objectively and rationally examines the LCI and LCIA results obtained up to this point. Different results may be derived depending on, for example, differences in scope, definition of the system boundary in LCI, or the selection of characterization factors in LCIA, among many others. Hence, the influence of these factors on the results of the interpretation step must be examined. Furthermore, many of the data used in LCI, including those for measuring and estimating errors, and assessing how these errors affect the results, are important as well. One must perform “sensitivity analyses” and “uncertainty analyses” to take errors into account. However, there is a need for future research to advance knowledge related to subjects in this area because current specific methodologies lack uniformity.
14.1.6 LCA Criteria on Biomass
Some examples of using biomass for energy are presented in this section to demonstrate several important criteria for performing a biomass LCA.
a Life Cycle
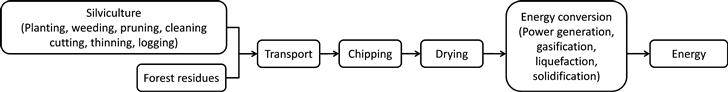
When using biomass as energy, considering the energy efficiency of the energy conversion technology is important. However, one must consider the energy efficiency and environmental burden throughout the entire life cycle. In the case of woody biomass, the environmental burdens of a series of life cycle processes, such as biomass production, preprocessing, and energy conversion, must be assessed, as shown in Figure 14.3.
b Energy Balance
Energy balance basically involves comparing and assessing the biomass energy produced and the energy input for its production. As shown in Figure 14.3, considering the entire life cycle connected with production of biomass feedstock, its transport, and energy conversion is important in determining the invested energy. However, there are several ways of doing this, such as limiting the energy input to that from fossil fuels, or including the energy in the biomass feedstock itself. In the former case one assesses how much more energy is produced than invested, whereas in the latter case one assesses the extent to which the feedstock energy is being effectively used (e.g. Box 14.1).
BOX 14.1
Energy Analyses on the Production of Wood Pellets from Wood Bark
1 Wood Pellets
Wood pellets are small cylindrical pieces 10–20 mm long with diameters varying from 5 to 10 mm produced from fine-ground wood bark. They are usually used as fuel by feeding into burner automatically because of their small and fixed form. On the other hand, energy is consumed in the process of drying and grinding wood barks for making wood pellets. Therefore, wood pellets have a smaller ratio of output energy to input energy than wood chips; however, wood pellets can be used in residential houses to be burnt efficiently in relatively small stoves. The energy efficiency of wood pellet production system must be improved to reduce their greenhouse gas (GHG) emission for expanding the use of wood pellets as a major energy source.
2 Materials and Methods
A mill that has been established as a guild of sawmills to process wood barks, which are a gavage from the sawmilling process, was evaluated twice on the production of bark pellets. This mill mainly produces about 500 t bark pellets per year. The first evaluation was carried out just after the establishment of the mill, and the ratio of output energy to input energy was 2.64. This ratio was considered low because the mill operation had not been stable due to a short period of operation since its establishment. The second research was carried out 5 years later; the ratio was expected to be improved because of a more efficient process and stable operations.
The output energy is defined as the high calorific value of the pellet as calculated from available shipments and the unit high calorific value. The available shipment is smaller than production because a portion of products is used as fuel for drying the ground bark in the mill. It was calculated as a reminder of subtracting stock of the previous month from the amount of sales and stocks of the current month. The output energy Eo was calculated using the following equation:
![]() (14.1)
(14.1)
where Pr is the available shipment (t), u is water content of pellets (%), and ep is high calorific value of pellets (GJ t−1).
The input energy can be divided into four categories: (1) electric power consumed inside of the mill; (2) energy of fuels consumed by a forklift inside of the mill; (3) transportation energy to collect barks from outside the mill; and (4) transportation energy to ship pellets outside the mill. The electric power consumption and the fuel consumption by the forklift can be obtained from the invoices. The transportation energy to collect barks and to ship pellets can be calculated using the mass-distance method based on the average loadage, number of transportations, and transportation distances. The average loadage and the number of transportations can be acquired from the invoices, whereas the transportation distance is measured using the Map Fan Web (http:// www.mapfan.com), and the input energy Ei (GJ) is calculated using the following equation:
![]() (14.2)
(14.2)
where Fl is fuel consumption, Fu is electric power consumption, el is high calorific value of fuels, and eu is the conversion factor from electric power to energy.
The GHG emission can also be calculated using the following equation:
![]() (14.3)
(14.3)
where gl is GHG emission factor of fuels and gu is GHG emission factor of electric power.
This pellet mill consumes the pellet product as the fuel to dry ground wood barks as described above. The energy consumption of drying is calculated based on the quantity of consumed pellets and the quantity of pellets dried. The water contents of pellets and barks are determined using the collected pellet and bark samples.
3 Results
The average wood pellet production was 2637.6 kg per day by consuming on average 50.26 kg an hour of wood pellets during the study period. For 7.9 hours operational period per day, the total amount of consumed pellets was 397.05 kg per day, which amounted to 20% of total wood pellet production.
Results of the mass-distance method indicate that fuel consumption of the bark collection process is 2153.6 L per year to produce 478.5 t of wood pellets per year that is available for shipment. Therefore, the wood bark collection process consumes 0.17 GJ t−1 (Figure 14.4) and emits 11.66 kg-CO2 t−1. The pellet shipping process consumes 742.5 L fuel a year that is equivalent to 0.06 GJ t−1 with the emission of 4.42 kg-CO2 t−1. The invoice investigation reveals that the average electric power consumption is 4.99 GJ t−1 and the average CO2 emission from the electric power is 240.5 kg-CO2 t−1. The average energy consumption to operate the forklift is 0.12 GJ t−1 with 8.08 kg-CO2 t−1 emitted. Hence, electric power is the most consumed energy; it amounts to 93% of the total energy consumption. Moreover, most of CO2 emission is from the electric power, and it amounts to 91% of the total CO2 emission.
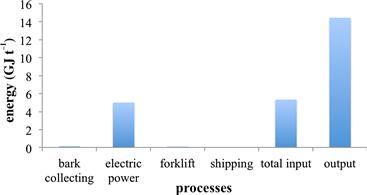
Based on the data collected in this study, the ratio of output energy to input energy for processing wood pellets is 2.70 that conforms to the value observed in previous studies. This indicates that improving the production process to make the operation more stable does not contribute to improving the ratio of output energy to input energy or the energy efficiency of this process. However, the wood pellet process has a higher ratio than the biodiesel fuel from rapeseed but a smaller ratio than the ethanol fuel from sweet potato.
The process of drying the ground bark before processing into wood pellets is powered by burning the produced pellets that is equivalent to consuming 15% of total production (2.98 GJ t−1). If kerosene is used for drying the ground bark, the CO2 emission will increase from 264.6 to 394.4 kg-CO2 t−1. Hence, using the processed wood pellets to dry the bark will reduce CO2 emissions by 129.8 kg-CO2 t−1, or a reduction of 70 t-CO2 emissions per year.
Masahiro Iwaoka
c Carbon Neutrality
When used as energy, biomass emits CO2, but the biomass energy is often assessed to be “carbon neutral”, meaning zero emissions. This is based on the idea that because the CO2 emitted from biomass has originally been absorbed through photosynthesis during the biomass growth process, the net carbon emission is thus considered to be zero. Another way of visualizing this concept is that the net emissions are zero because the CO2 emitted is eventually absorbed by the next-generation biomass crop. However, there are concerns with such reasoning and assessment methods. First, fossil fuels including coal and oil are similar in that they had been formed by the absorption of CO2 eons ago, thereby making it necessary to clearly specify that the carbon neutrality concept does not apply to fossil fuels. The second concern is the uncertainty of CO2 reabsorption. Unless the next-generation crop is grown, zero CO2 emissions are not warranted. Additionally, CO2 reabsorption takes time, and future absorption is uncertain at the time when the energy is used. This leads one to perform assessments that include uncertainty. In view of these concerns, the matter of how to assess the CO2 emission of using biomass energy itself is a major research topic that requires future discussion and study with regard to LCAs.
d Greenhouse Gas Emissions Associated with Land Use Changes
A very large amount of carbon has been reported to be stored in soil as part of the global carbon cycle (IPCC, 2007). Changes of land use due to biomass production by forestry, agriculture, and other industries cause the carbon stored in soil emitted as CO2 and other greenhouse gases. A representative example is the carbon emissions caused by land use changes when producing palm oil in the peat soil of tropical rainforests. However, appropriate soil management will also make it possible to keep the stored carbon intact as much as possible, thereby alleviating greenhouse gas emissions. In biomass LCAs, conducting assessments that consider the carbon emissions occurring in conjunction with land use changes is important as well.
14.2 Sustainability Indicators for Bioenergy
Seishu Tojo
14.2.1 Importance of Sustainability Indicators
Concerns about potential negative effects of large-scale biomass production and export on environmental quality by deforestation and reduction of food production by diverting food resources for energy production have led to the necessity of developing sustainability criteria and certification systems for managing and regulating biomass production and trade (Lewandowski and Faaij, 2006). There is a need to establish minimum sustainability criteria for importing bioethanol to avoid unwanted negative impacts or leakage effects (Corbière-Nicollier et al., 2011). Sheehan (2009) stresses the complex issue of sustainability for biofuels that certainly requires a holistic vision as well as the recognition of its ethical nature.
Identifying what is sustainable is difficult because sustainability as a social value is controversial by nature (Buchholz et al., 2009). For instance, some people value the social, economic, and ecological factors of sustainability equally, whereas some others support the view of nested components of sustainability to stress that sustainability can only be achieved when its social and economic factors do not violate ecological limits (Gowdy, 1999). Since the multiple perspectives encompassed in the concept of sustainability are based on normative values, the concept requires specific measurements (Buchholz et al., 2009). Thirty-five sustainability criteria that are regularly included in discussions on bioenergy have been identified. The criteria that had been identified were grouped into the broad categories of 15 social criteria, four economic criteria, and 16 environmental criteria based on four attributes including relevance, practicality, reliability, and importance using the following definitions:
• Relevance: How relevant is the criterion to the concept of sustainable bioenergy systems? Does its assessment contribute to a better understanding of the sustainability of the bioenergy system?
• Practicality: Are there existing scales and/or measurement units? Are there measurable threshold values? How easily can data be obtained? Is measuring the indicator cost, time, and/or resource effective?
• Reliability: How reliable is the result of assessing the criterion? Is there a high uncertainty attached to the criterion? Are results reproducible? How easily can consensus be achieved?
• Importance: How important is the criterion for assessing the sustainability of the bioenergy system? Is it critical, i.e. is it assessed according to opinion in a mandatory way, to include it in a sustainability assessment of bioenergy systems?
According to Mayer (2008), the determination of the sustainability of human–environment systems is based on the consideration of three main characteristics: resilience to disturbances, both natural and anthropogenic; desirability to human societies; and temporal and spatial scale boundaries. Resilience and desirability determine policy goals, and the scale determines the system to be monitored and managed to reach those goals. In relation to biofuels, such means are (Silva Lora et al., 2011):
• To remain carbon neutral, considering the necessity of fossil fuel substitution and global warming mitigation.
• Not to affect the quality, quantity, and rational use of available natural resources as water and soil.
• Not to have undesirable social consequences such as starvation because of high food prices.
• To contribute to society’s economic development and equity.
14.2.2 Sustainability Indicators Developed by the Global Bioenergy Partnership
The Partners and Observers of the Global Bioenergy Partnership (GBEP) under FAO (Food and Agriculture Organization) developed the sustainability indicators for bioenergy to provide a framework for assessing the relationship between production and use of modern bioenergy with sustainable development. These indicators offered policymakers and other stakeholders a set of analytical tools for developing national bioenergy policies and programs, and monitoring the impact of these policies and programs. A set of 24 GBEP sustainability indicators for bioenergy, as shown in Table 14.1, is developed under three pillars, i.e. environmental, social and economic, with the relevant themes listed as follows:
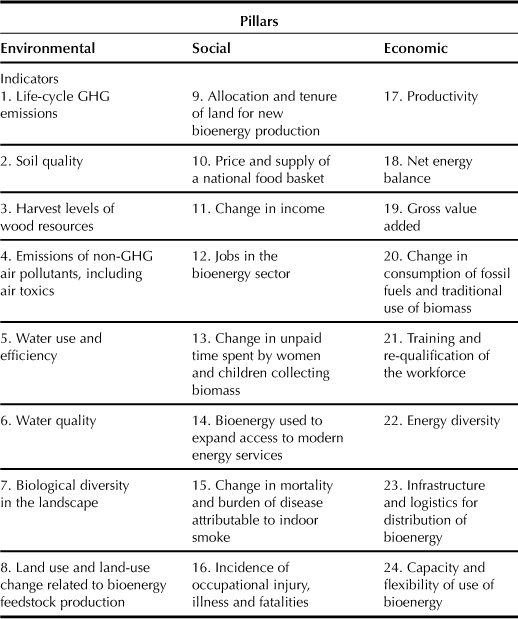
• Environmental: Greenhouse gas emissions, Productive capacity of the land and ecosystems, Air quality, Water availability, Use efficiency and quality, Biological diversity, Land-use change, including indirect effects.
• Social: Price and supply of a national food basket, Access to land, Water and other natural resources, Labor conditions, Rural and social development, Access to energy, Human health and safety.
• Economic: Resource availability and use efficiencies in bioenergy production, Conversion, Distribution and end-use, Economic development, Economic viability and competitiveness of bioenergy, Access to technology and technological capabilities, Energy security/diversification of sources and supply, Energy security/infrastructure and logistics for distribution and use (e.g. Box 14.2).
BOX 14.2
Evaluation of Bioethanol Production from Rice Straw
Due to rapid growth in population and industrialization, worldwide ethanol demand is increasing continuously. The production of conventional crops such as corn and sugar cane that have been cropped for food and feed is insufficient to meet the new global demand of bioethanol production.
Therefore, lignocellulosic substances such as agricultural wastes are attractive alternative sources for bioethanol production because they are cost-effective, renewable, and abundant. Bioethanol from agricultural waste emerges as a promising technology, although the process has several challenges and limitations such as biomass transport and handling, and efficient pretreatment to achieve a nearly complete delignification of lignocelluloses (Sarkar et al., 2012). Considering the evolution and need of second-generation biofuels, rice straw appears a promising and potent candidate for production of bioethanol due to its abundant availability and attractive composition (Binod et al., 2010). Bioconversion of lignocellosics to bioethanol is difficult due to: (1) the nature of biomass to resist breakdown; (2) identification of natural microorganisms or genetic creation of new species of organisms that are capable of fermenting the variety of sugars released from the degraded hemicellulose and cellulose polymers not being completed currently; (3) relatively high costs for collection and storage of low-density lignocellosic materials (Balat, 2011).
According to Park et al. (2011b), significant amounts of soft carbohydrates (62–303 g kg−1) have been detected in all rice cultivars, with 58.9–86.0% of the total soft carbohydrates being starch and sucrose. In addition to cellulose, soft carbohydrates are regarded as important sources of hexoses that can be fermented by using the commercially available ethanol-producing yeast, Saccharomyces cerevisiae. Soft carbohydrates constitute about 20.8–133% of cellulose that signifies the importance of utilizing soft carbohydrates for ethanol production from rice straw.
Many researchers reported effective pretreatment, saccharification, and ethanol fermentation processes to enhance ethanol production from rice straw. These processes include acid hydrolysis, liquid hot water extraction, steam explosion, dilute acid–steam explosion, ammonia fiber explosion, lime pretreatment, pretreatment by using aqueous ammonia solution (Ko et al., 2009), the combined use of ammonia and ionic liquid treatment (Nguyen et al., 2010), and the simultaneous saccharification and ethanol fermentation process (SSF). Shinozaki and Kitamoto (2011) reported that (i) silage made from whole-plant rice can be used for bioethanol production, and (ii) proper selection and combination of commercially available enzymes can make the SSF process more cost-efficient by eliminating the pretreatment step. New strategies to ferment the mixture of hexose and pentose have been developed using co-cultures of Saccharomyces cerevisiae and Pichia stipites (Yadav et al., 2011), and with sequential application of Saccharomyces cerevisiae and Pichia stipitis (Park et al., 2011a).
Roy et al. (2012a) evaluated the life cycle of bioethanol production from rice straw with three indicators, i.e. net energy consumption, CO2 emission, and production costs estimated for bioethanol produced from the most common variety of rice straw in Japan (Oryza sativa L. cv. Koshihikari). Their studies were based on the three scenarios of a basic case, an innovative case, and a futuristic case using data collected from their pilot plant and taken from the literature. The net energy consumption, CO2 emission, and production costs are 10.4–11.6 MJ L−1, 1.10–1.14 kg L−1, and 0.88–1.37 US$ L−1 respectively. They also reported on bioethanol from sugar-rich straw of variety “Leaf Star” with energy scenario (Table 14.2). The net energy consumption, CO2 emissions, and production costs vary from 10.0 to 17.6 MJ L−1, −0.47 to 1.58 kg L−1, and 0.86 to 1.44 US$ L−1 respectively. A shift in energy scenarios in the type of primary energy not only reduces emissions and production costs, but may also alleviate the fluctuation in production costs over time, thus decreasing the risk on investment in the bioethanol industry (Roy et al., 2012b). The rice straw collection/transportation cost accounts for 68% of the total cost of the ethanol production system. In terms of cost-effectiveness, bioethanol is not competitive with gasoline. The bioethanol, however, can be competitive for the end user if it is tax exempt from the gasoline tax in Japan (Yang and Sagisaka, 2009).
TABLE 14.2
Life Cycle Inventory of Indicators for Bioethanol from Rice in Japan
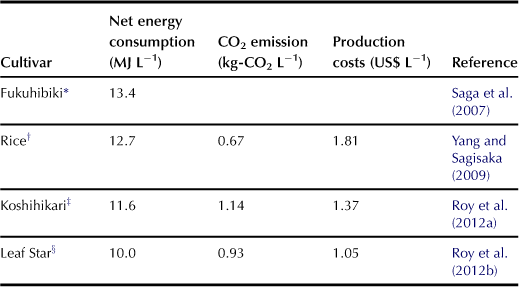
∗Rice cultivar for livestock feed “forage rice”.
†Cultivar is not identified, standard cultivar.
‡The heat generation from the residual lignin is used to offset some of the energy consumption, CO2 emission, and production cost.
§Rice cultivar for livestock feed “forage rice”. The lignin and hemicellulose recovered in the waste management process is used for heat or electricity generation.
Rice straw management has significant impacts on CH4 emissions from paddy fields. When rice straw was left in the field and mixed into the soil, total CO2-equivalent greenhouse gas emission is 25.5–28.2 t-CO2 ha−1. However, a method that is effective in mitigating CH4 emission is to remove rice straw from the paddy fields after rice harvest (Koga and Tajima, 2011). Thus, rice straw removal from paddy fields as bioethanol feedstock has significant impacts on alleviating greenhouse gas emissions.
14.3 Management of Forest Land for Biomass Production
Masahiro Iwaoka
14.3.1 Sustainable Forest Management
Forest land needs to be properly managed in order to maintain sustainability. The United Nations held a conference on environment and development at Rio de Janeiro in June 1992 to reach an agreement known as “Agenda 21”; moreover, the declaration of a forest principle was also agreed upon. Sustainable forest management is described in the declaration as “Forest resources and forest lands should be sustainably managed to meet the social, economic, ecological, cultural and spiritual needs of present and future generations. These needs are for forest products and services, such as wood and wood products, water, food, fodder, medicine, fuel, shelter, employment, recreation, habitats for wildlife, landscape diversity, carbon sinks and reservoirs, and for other forest products.” The term “sustained yield” that was once popular in the forestry industry is defined in Webster’s Dictionary as “production of a biological resource (as timber or fish) under management procedures which ensure replacement of the part harvested by regrowth or reproduction before another harvest occurs” by Merriam-Webster. “Sustained yield” mainly concerns the yield, whereas “sustainable forest management” is a broader concept including environment quality in addition to forest resources.
There are several methods to implement sustainable forest management; forest certification is one of these methods based on the consumer’s intention. The forest certification schemes will be described in the following sections.
14.3.2 Forest Certification Schemes
a Definition of Forest Certification Scheme
Forest certification is a system that certifies a well-managed forest and guarantees timber or non-timber production in the forest. A well-managed forest is “environmentally appropriate, socially beneficial, and economically viable” (Forest Stewardship Council), and uses “global and local management to ensure that all of us can enjoy the environmental, social and economic benefits that forests offer” (Program for the Endorsement of Forest Certification, PEFC). Forests will gain some benefits when consumers prefer the forest products labeled as environmentally conscious products to other products with similar quality and price. The benefits may not only come from direct income but also cover intangible benefits such as lower non-tariff barrier or less consumer resistance to non-environment-conscious products.
Forest certification can usually be divided into two parts: certification for forest management (FM) and certification for the supply chain, known as chain of custody (CoC). The FM certification guarantees forest management systems whereas the CoC certification guarantees timber or non-timber production for FM certified forests. For achieving these purposes, the FM requires a system for monitoring, checking, and improving forest management, whereas the CoC requires another separation system for certifying forest-related products. Every component of a supply chain involved in forest-related products and services must be certified as CoC in order for the final products and services to be certified as “environment-conscious products”.
b International Forest Certification Schemes
The Forest Stewardship Council A.C. (FSC) and the Program for the Endorsement of Forest Certification (PEFC) are the two most popular forest certification schemes worldwide, although there are numerous other international or local forest certification schemes. The FSC Secretariat opened in Oaxaca, Mexico and the FSC was established as a legal entity in Mexico in February 1994, 2 years after the United Nations Conference on Environment and Development – the Earth Summit was held in Rio de Janeiro in 1992. Although producing no legally binding commitments on forest management, the Earth Summit resulted in Agenda 21 and the non-legally binding Forest Principles that provide a crucial forum for congregating many non-governmental organizations and pooling support for the innovative idea of a non-governmental, independent, and international forest certification scheme. Following intensive consultations in 10 countries to build support for the idea of a worldwide certification system, the FSC Founding Assembly was held in Toronto, Canada in 1993. The mission of FSC is to promote environmentally appropriate, socially beneficial, and economically viable management of the world’s forests. To perform the mission, the FSC has developed 10 principles and 56 criteria; each principle is supported by several criteria that provide a way of judging whether the principle has been met in practice. All principles and criteria must be applied by a forest management unit before the latter can receive FSC certification. The Principles and Criteria apply to all forest types and to all areas covered by the management unit included in the scope of the certificate. These principles and criteria are not specific to any particular country or region, they are applicable worldwide and are relevant to various forest areas and different ecosystems, as well as cultural, political, and legal systems. The FSC’s principles and criteria are characterized by three unique principles. The first is an indigenous people’s rights that require identifying and upholding indigenous people’s rights of ownership and use of land and resources. The second is about maintenance of high conservation value forests that requires maintaining or enhancing the attributes that define such forests. The third is about plantations that require planning and managing plantations in accordance with FSC Principles and Criteria. FSC accredits certification bodies and the accredited certification body certifies each forest. The FSC has an integrated accreditation program that systematically checks the forests that have been certified by the FSC. The area of FSC certified forest amounts to 152,157,408 ha in 80 countries as of June 2012. In Japan, 35 certificates have been issued by the FSC covering 392,989 ha of forest.
The PEFC, which is an international non-profit, non-governmental organization dedicated to promoting sustainable forest management (SFM) through independent third-party certification, is an umbrella organization that endorses national forest certification systems. It was established in 1999 by national organizations from 11 countries representing a wide range of interests to promote sustainable forest management, especially among small forest managers. The PEFC recognized the first national system in 2000, enabling forest owners and managers in Finland, Sweden, Norway, Germany, and Austria to certify their responsible forest management practices. In 2001, in an effort to integrate social concerns more fully in its activities, the PEFC became the first global forest certification organization to require compliance with all the fundamental ILO conventions in forest management. In 2004, Australia and Chile became the first non-European nations with national standards endorsed by the PEFC. With the endorsement of the Canadian standard in 2005, the PEFC became the world’s largest forest certification system with more than 100 million hectares of certified forest area. The mission of the PEFC is “to give society confidence that people manage forests sustainably” to realize their vision of “a world in which people manage forests sustainably”. The PEFC bases its understanding of SFM on the definition adopted by the Food and Agriculture Organization (FAO) and originally developed by Forest Europe. SFM is defined by FAO and Forest Europe as: “The stewardship and use of forests and forestlands in a way, and at a rate, that maintains their biodiversity, productivity, regeneration capacity, vitality and their potential to fulfill, now and in the future, relevant ecological, economic and social functions, at local, national, and global levels, and that does not cause damage to other ecosystems.” To achieve sustainability under this definition, the PEFC states that forest management practices must result in outcomes that are economically viable, ecologically sound, and socially just. The PEFC collaborates with national forest certification systems tailored to local conditions and involving a wide range of stakeholders to encourage the delivery of sustainably sourced products to the marketplace because the diversity of both forests and communities that depend upon the forests for their livelihoods means that a “one-size-fits-all” standard is not the solution. A national certification system that has developed standards in line with PEFC requirements can apply for endorsement to gain access to global recognition and market access through PEFC International. To achieve endorsement, the national system needs to meet the PEFC’s rigorous Sustainability Benchmark. This “bottom-up” approach provides a high degree of independence of national processes, and allows for the development of standards tailored to the political, economic, social, environmental, and cultural realities of their respective countries, yet in compliance with rigorous international benchmarks. The area of PEFC-certified forest is 242,317,994 ha in 27 countries as at June 2012.
c Japanese Local Forest Certification Scheme
The Sustainable Green Ecosystem Council (SGEC) established in 2003 is the only Japanese local forest certification scheme in the context of Japanese forestry. It was established based on the idea that “sustainable forest management (SFM)” can be achieved effectively through forest certification systems. SGEC is becoming popular because it promotes SFM, encourages cyclical use of forest resources, raises forest management level, contributes to global warming prevention efforts, and supports people’s lives in both country and urban settings. One year before the SGEC was established, the investigative committee led by the Japan Forestry Association proposed the establishment of the SGEC based on the investigation of a local forest certification system suitable for Japanese forestry. The purpose of the SGEC is to spread the idea of SFM throughout Japanese societies, promote effective use of wood products from “sustainable forest management (SFM)”, construct a cyclical society so as to support a pleasant lifestyle, and help maintain a natural environment. To achieve these objectives, the SGEC has initiated four important activities:
1. Operation of SGEC certification system that contains a labeling system for identifying products from SGEC-certified forests.
2. Accreditation of certification bodies and registration of the consultation bodies.
The procedure of SGEC forest certification system starts with an application to a certification body by an individual or a deputized consultation body. According to forest certification standards, the certification body assesses the management of a forest being certified to report the findings to SGEC. If approved by the SGEC audit committee, SGEC issues a SGEC certificate to the applicant who can then claim himself as owner/manager of the certified forest. Subsequently, the audit committee investigates the certified forests once a year in order to confirm that the certified forest continues appropriate forest management practices. The SGEC labeling system follows the same procedure as those stated in the above sections. That is, SGEC issues a certificate to an eligible applicant who may be called a certified entity. The certification body, which is independent of the applicant, should conduct accurate examination for making fair and neutral judgments and decisions. Additionally, the certification body should operate independently from other forest certification schemes. A consultation body should be registered on condition of its ability to give advice to applicants in a precise, quick, and efficient manner. The SGEC promotes both separation control and label control so that forest products from SGEC-certified forests (hereinafter referred to as “certified wood products”) are properly supplied to consumers. The SGEC has established seven standards; Table 14.3 lists a comparison of SGEC standards to principles of the FSC and criteria of the SGEC. The SGEC standards are arranged in order of management definition, subjects, and measures. In contrast, the FSC principles are arranged in order of relationships between the forest and people or society around the forest, management subjects and measures, whereas the PEFC criteria are arranged according to management subjects. The arrangement of SGEC standards is similar to FSC principles; however, each SGEC standard is similar to a corresponding PEFC criterion. These differences in arrangements cause discrepancies between the numbers of environmental conservation items, and larger numbers of SGEC standards than numbers of FSC criteria. The total SGEC-certified forest area is 888,779.55 ha and the number of total CoC-certified business entities is 381 in June 2012.
TABLE 14.3
Comparison of SGEC Standards, FSC Principles, and PEFC Criteria
| Standards of SGEC | Principles of FSC | Criteria of PEFC |
| Standard 1: Identification of forests and their management policies | Principle 1: Compliance with laws and FSC principles | Criterion 1: Maintenance and appropriate enhancement of forest resources and their contribution to the global carbon cycle |
| Standard 2: Conservation of biological diversity | Principle 2: Tenure and use rights and responsibilities | Criterion 2: Maintenance of forest ecosystem health and vitality |
| Standard 3: Conservation and maintenance of soil and water resources | Principle 3: Indigenous people’s rights | Criterion 3: Maintenance and encouragement of productive functions of forests (wood and non-wood) |
| Standard 4: Maintenance of productivity and health of forest ecosystem | Principle 4: Community relations and worker’s rights | Criterion 4: Maintenance, conservation and appropriate enhancement of biological diversity in forest ecosystems |
| Standard 5: Legal and institutional framework for SFM | Principle 5: Benefits from the forest | Criterion 5: Maintenance and appropriate enhancement of protective functions in forest management (notably soil and water) |
| Standard 6: Maintenance and promotion of societal and economic benefits | Principle 6: Environmental impact | Criterion 6: Maintenance of other socio-economic functions and conditions |
| Standard 7: Monitoring and disclosure of information | Principle 7: Management plan | Criterion 7: Compliance with legal requirements |
| Principle 8: Monitoring and assessment | ||
| Principle 9: Maintenance of high conservation value forests | ||
| Principle 10: Plantations |
14.4 Management of Farming Land for Biomass Production
Seishu Tojo
14.4.1 Environmental Indicators for Agriculture
Many OECD countries have established goals to reduce discharges of agricultural surface runoffs, particularly from livestock farming, which are rich in nitrogen and phosphorus, into the environment. The EU (European Union) Nitrate directive (EU Council Directive 676/91) is one of the measures introduced to comply with EU drinking water standards; it is implemented by limiting the use of fertilizer to reduce nitrogen inputs to designated nitrate vulnerable zones. Many countries have also introduced similar programs to alleviate acidification, including agricultural ammonia emissions into the atmosphere resulting from livestock farming, and the use of inorganic fertilizers.
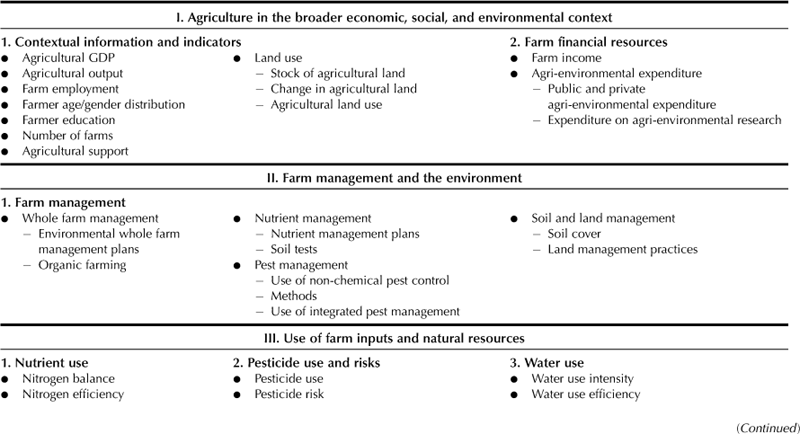
The OECD published environmental indicators for agriculture in 2001 (OECD, 2001) based on the work carried out by the OECD Joint Working Party of the Committee for Agriculture and the Environment Policy Committee. These indicators are primarily useful for policymakers and the general public, in both OECD and non-OECD countries. Specific indicators for the environmental impact of agriculture are categorized as soil quality, water quality, land conservation, greenhouse gases, biodiversity, wildlife habitats, and landscape (Table 14.4).
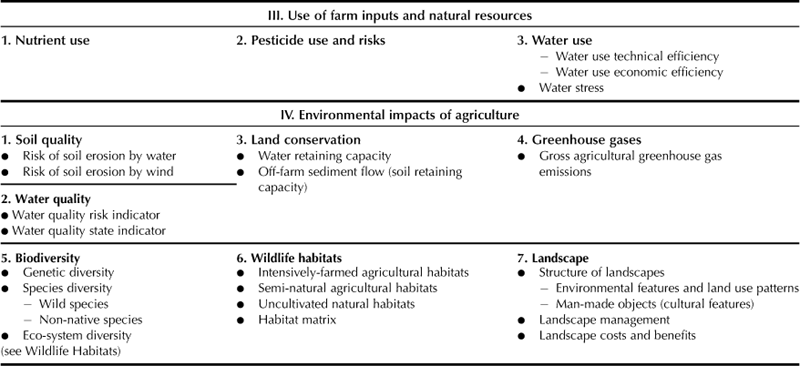
According to the report published by OECD, changes of cropping pattern such as exploiting the potential of agricultural land as a source of biomass instead of foodstuff production will have considerable environmental consequences. An important aspect concerning the link between biodiversity and agriculture is the relationship between biomass production from agriculture (i.e. crops and forage) and species diversity. There are also important links between biomass production in agriculture and productivity, such as the possibilities of growing extra plant biomass through technology to provide energy in addition to food stuff. Research into the relationship between biomass production and biodiversity, however, is still at an early stage of development.
EU Directive 2009/28/EC specifies three criteria for the land to provide biofuel from feedstock. First, biofuels shall not be made from raw materials obtained from land with high biodiversity value, which includes primary forest and other wooded land, areas designated for nature protection or the protection of rare, threatened or endangered ecosystems or species, and highly biodiverse grassland. Second, biofuels shall not be made from raw materials obtained from land with high carbon stock, namely wetlands, continuously forested areas, or land spanning more than one hectare with a certain minimum canopy cover. Third, biofuels shall not be made from raw materials obtained from peatland, unless evidence is provided to show that the cultivation and harvesting of that raw material does not involve drainage of previously undrained soil.
In Brazil, the expansion of soybean production could adversely affect rainforests. In Indonesia 27% of palm oil concessions are on peat forest, whereas in Malaysia 10% of plantations are on former peat forest. Therefore, the biodiesel fuel from some Brazilian soybean as well as Malaysian and Indonesian palm oil may not conform to the EU Directive (Lendle and Schaus, 2010).
14.4.2 Nutrient Runoff from Biomass Production Fields
The sustainable development of alternative renewable fuel can offer many benefits but will demand comprehensive understanding of how our choice of land use affects the ecological systems around us. The Mississippi-Atchafalaya River Basin covers almost half of the USA in an enormous swath of land before the river finally empties into the Gulf of Mexico. The area includes predominant wheat- and corn-growing fields of the mid-west region that supplies a large share of feedstock for current production of starch-based biofuels (Figure 14.5).
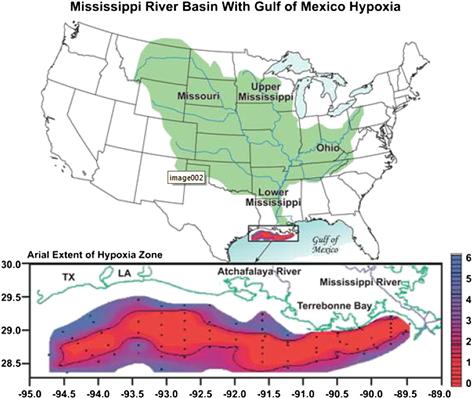
FIGURE 14.5 Mississippi river basin with Gulf of Mexico hypoxia. (Source: Programmatic environmental impact statement, Biomass crop assistance program; USDA, 2010.)
History reveals that land-use choices in these upstream agricultural belts have far-reaching effects on the environment. The use of nitrogen- and phosphorus-rich fertilizer over several decades has led to abundant nutrient-rich surface runoffs that eventually make their way into the Mississippi to cause algal blooms and murky water. The algae die and decompose rapidly, causing serious depletion of dissolved oxygen, creating areas known as the “dead zone” where only a few species of organisms can survive.
The Advisory Panel of the Environmental Protection Agency’s Science Advisory Board recommended the promotion of environmentally sustainable approaches to biofuel crop production, such as no-till farming, the reduced use of fertilizer, and the use of riparian buffers in targeted areas of the basin (Dale et al., 2010).
The use of dedicated energy crops generally requires less nutrient applications than corn or wheat. Switchgrass, which is currently recommended as a potential biomass crop, is harvested in quantities of about one-third of the quantity of corn cropped in the Southeast USA (Garland, 2008). The grass also contains less phosphorus than does corn. Reviewing the literature on potential water quality resulting from the use of switchgrass as a potential source of biofuel, Simpson et al. (2008) summarized the benefits as fewer nutrients existing in runoff and less drainage by approximately 50–90% than corn–soybean rotations that will have a significant positive impact on water quality.
14.4.3 Abandoned Agricultural Land in Japan
Urban sprawl and other changes in land use including abandonment of cultivation had caused a loss of agricultural land area by 922,700 ha from 1973 to 2001 (Takata et al., 2011). The Japanese government announced that the abandoned agricultural land increased rapidly in the 1990s and reached a high level of 396,000 ha or 10.6% of total arable land in 2010, as shown in Figure 14.6. Yoshikawa et al. (2004) warns that a large-scale soil loss of 90 t ha−1 y−1 will occur within several years immediately after a cultivated field is abandoning. According to Uematsu et al. (2010), recent land-use changes involving abandonment have rapidly reduced the biodiversity of agricultural landscapes and decreased habitats of endangered and rare species as well.
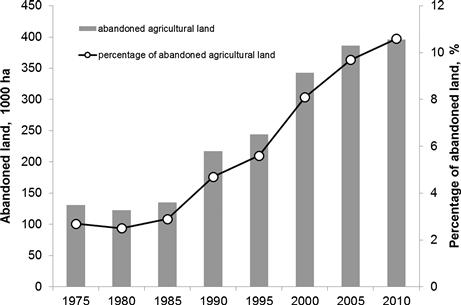
FIGURE 14.6 Abandoned agricultural land in Japan. (Source: Census of agriculture and forestry, MAFF, Japan.)
One of the countermeasures for alleviating land abandonment launched by a municipal government in Yamagata prefecture, Japan in cooperation with the truck association is to cultivate rapeseed in abandoned fields as an energy crop. Rapeseed oil is used as cooking oil free of charge at public school lunch centers and public elderly care facilities. The used cooking oil is collected and processed into biodiesel that will be sold to truck association members. In this manner, biomass production may help to preserve farmland.
14.5 Monitoring System for Forest Management
Takeshi Matsumoto
14.5.1 Monitoring Methods
Investigating the forest enables us to grasp the current state of a forest’s biomass resources. A direct and exact investigation is difficult because forests cover large areas and have huge quantities of resources. Sampling methods have been adopted in many cases for investigating forests. Furthermore, broader investigations at the municipal, prefectural, and national levels using remote sensing methods and other advanced technologies have been developed in recent years.
a Ground Survey Method
(i) Complete Enumeration Method
This method measures the diameter at breast height (DBH) of all trees and heights for some selected trees in a target forest. The results will be used to develop a height–diameter curve, which can be used for estimating the height of all trees in the forest. The timber volume and stand volume are estimated using a two-way DBH and tree height volume table for each species in a certain region (Forestry Agency, 1970). Although the method is costly and time-consuming, it is an exact method that collects information on individual trees. Hence, this method is suitable for fine and expensive wood forests.
(ii) Sample Plot Method (by Non-Random Selection)
This method estimates the stand density and growth stock of a target forest based on field data collected on DBH, tree height, and number of stand trees in a selected sample plot, which is a typical representative point of the forest. In a uniform forest, the plot area tends to be larger but fewer plots are measured. In contrast, when the plot area is smaller more plots are measured, as in streaky forests. The following are examples of plot scale and accuracy:
• Circle (radius 4 m: using a fishing rod) = 50 m2 → 200 times is 1 ha, a tree stand represents 200 trees in 1 ha.
• A 10-m square = 100 m2 → 100 times is 1 ha, a tree stand represents 100 trees in 1 ha.
• A 20-m square = 400 m2 → 25 times is 1 ha, a tree stand represents 25 trees in 1 ha.
• A 30-m square = 900 m2 → 11 times is 1 ha, a tree stand represents 11 trees in 1 ha.
Sometimes, a rectangular plot is also used.
(iii) Sample Plot Method (by Random Selection)
This method differs from the above-mentioned non-random selection method because it applies sampling survey methods based on statistics that allows the calculation of standard errors and confidence intervals.
(iv) Plotless Method
Among the many available methods, the following three methods are described in this chapter.
Bitterlich method
This method counts the number (N) of trees thicker than the collimation angle (after the investigator collimates trees around the sample point), and calculates the basal area of breast height [G (m2 ha−1)] using the following formula (O’sumi, 1987):
![]() (14.4)
(14.4)
where k is the basal area factor that is calculated using the following formula:
![]() (14.5)
(14.5)
where d is the width of slit and R is the distance between the slit and the investigator’s eye.
In most cases, mirror relascopes (Spiegel relascope) are used in the Bitterlich method; however, sometimes the surveyor’s thumb is simply used. If the thumb is used, the investigator goes around on a sample point with an outstretched arm and raised thumb to count the number of trees thicker than the thumb’s width. The basal area factor k is near 4; however, exact values should be calculated using the above-mentioned formulas with the slit width (d). The distance between the slit and the investigator’s eye (R) is replaced by width of thumb (d), and the distance between the thumb and eye (R) respectively.
Stoffels method
This method measures the distance of the jth nearest tree from sample point and estimates tree density D (number ha−1) by using the following formula (O’sumi, 1987):
![]() (14.6)
(14.6)
where ![]() is the average distance to the jth nearest tree. The stand volume is calculated by averaging the single-stand volume and tree density.
is the average distance to the jth nearest tree. The stand volume is calculated by averaging the single-stand volume and tree density.
Suzuki–Essed method
The Suzuki–Essed method measures the distance of the third-nearest tree from the sample point and estimates tree density D (number ha−1) by using Suzuki’s (1965) formula:
![]() (14.7)
(14.7)
where ![]() is the average distance to the third-nearest tree. The stand volume is calculated by averaging the single-stand volume and tree density.
is the average distance to the third-nearest tree. The stand volume is calculated by averaging the single-stand volume and tree density.
(v) Parameters for Calculation of Forest Biomass
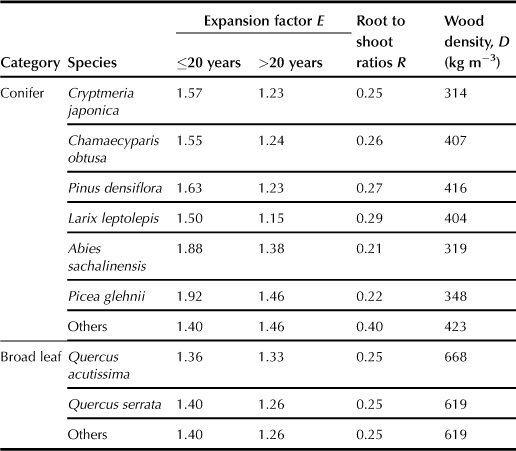
Various methods for measuring or estimating stem volume or stocks have been proposed. However, the forest biomass includes branches, leaves, and roots, which are often difficult to measure. The total forest biomass B (kg) is estimated from the stem volume V (m3), expansion factor E, root to shoot ratio R, and wood density D (kg m−3) by using the following formula (National Institute for Environmental Studies, 2012):
![]() (14.8)
(14.8)
Table 14.5 shows the expansion factor E, root to shoot ratio R, and wood density D for each species.
b Remote Sensing Method
(i) Aerial Photography
Aerial photographs are taken from airplanes, helicopter, balloons, and other airborne devices. Geographical Survey Institutes, the Forestry Agency, and other organizations, including private companies, take photographs to construct maps. Aerial photographs, which include important information such as forest type, tree species, geography, topography, soil, roads, and other features, must be viewed and interpreted using reading and stereoscopic techniques, particularly in the practical business of forestry, forest management, erosion control, and consultation, among many others. When GIS is used, aerial photographs need to be digitalized or undergo orthophoto conversion using an orthophoto engine that is sometimes included in the GIS software.
(ii) Satellite
Various earth observation satellites have been launched since the 1960s. Famous satellites include LANDSAT series (USA), SPOT series (France), IKONOS (USA), and ALOS (DAICHI, Japan). These satellites are equipped with various sensors to measure various light or electromagnetic waves reflected by (or radiated from) objects on the Earth’s surface. Each satellite is usually equipped with multiple sensors that detect various electromagnetic waves varying from ultraviolet (short wave) to microwave (long wave). A variety of indices for reading the vegetation information off satellite images have been developed. The Normalized Difference Vegetation Index (NVDI) is one such typical index. Plant leaves absorb most of the visible light and reflect a large portion of the near-infrared (NIR) light. The NVDI is calculated using the following formula (Kato, 2010), based on the NIR and Red (red band) readings:
![]() (14.9)
(14.9)
The NVDI ranges from −1.0 to 1.0.
(iii) Global Positioning System (GPS)
GPS is a global navigation satellite system (GNSS); the location of a user can be determined using GPS receivers that receive signals from at least four satellites at an altitude of 20 km. Two methods are used for positioning. Single-point positioning is performed using a single hand-held GPS receiver, which costs approximately 5000 to tens of thousand yen. However, its accuracy ranges from a few meters to 10 m. The differential method, which is classified as interferometric positioning or differential GPS (DGPS), uses two receivers resulting in higher accuracy than single-point measures. For the interferometric method, one receiver is set on a reference point, such as a triangulation station point, and another is set on an unknown point. This method requires expensive receivers and software, and complex calculations as well.
The DGPS method can use the correct information for GPS positioning, such as the medium-wave beacon for ships used by the Maritime Safety Agency and the MTSAT Satellite-based Augmentation System (MSAS). This method is capable of positioning with an accuracy of within a few meters.
14.5.2 Monitoring Methods Applicable for Forest Management
In Japan, the Forestry Agency using the standard Montreal Process (1995) has practiced “Forest resource monitoring surveys” to investigate the amount, quality, and dynamics of forest resources since 1999. This survey implements a systematic sampling method that differs from the traditional forest registration system (Shinrinbo system) (Yoshida, 2008). In this survey, the nation’s land is covered by using 4-km distance grids to establish plots on the grid points. If a plot is forest land, further investigations will be carried out for the plot. There are approximately 15,700 points (plots) in Japan, and the investigations have been conducted on approximately 20% of the plots annually. This method is practiced by prefectural governments on privately owned forests, and by the Forestry Agency or regional forestry offices on national forests.
The survey also covers site condition, elevation, direction of slope, surface geology, soil erosion, and distance from road. Understory vegetation and degree of cover are investigated in a separate vegetation survey. Species, DBH, tree height, stump, and existence of withering are investigated, and a complete enumeration of stands is conducted. Birds and other forest creatures inhabiting forest plots, as well as damage from disease, harmful insects, and climate, are also included in the survey.
14.6 Monitoring System for Farm Management
Seishu Tojo
14.6.1 Water Quality
Management of surface runoff is crucial to reduce pollutant loads from the watershed to surface water bodies and their surround wetland. Monitoring water quality of forest runoff is necessary for implementing good management practices to reduce pollutant levels in farm drainage water (Rice et al., 2002).
The rainfall is recorded with automatic rain gages, and water quantity is monitored with water level monitors at the sampling point. Typical water quality analyses include water temperature, hydrogen ion concentration (pH), electrical conductivity (EC), chemical oxygen demand (COD), suspended solids (SS), ammonium nitrogen, nitrate nitrogen, total nitrogen, and total phosphorus (Nakasone, 2003). According to Yoshinaga et al. (2007), the field results observed with a 1.5-ha paddy field in the foreshore of Biwa Lake located in central Japan show that the total nitrogen in a 4-month cropping period is 18.8 kg ha−1, with 7.2 kg ha−1 from surface drainage and 11.6 kg ha−1 from percolation loss.
Pesticide and herbicide are indispensable chemicals even for biomass production on farm land. If applied excessively, they are easily carried by surface runoffs to pollute the receiving surface water bodies. These chemicals include tricyclazole (5-methyl-1,2,4-triazolo[3,4-b]benzothiazole), which is a systemic fungicide commonly used to control the rice blast in Asian countries (Phong et al., 2009). The study on tricyclazole spray in a basin reveals that high concentrations of tricyclazole are found in water of the paddy farms (Padovani et al., 2006). Analyses of pesticides and herbicides contained in the water sample are conducted in the laboratory using HPLC or GC after the chemicals are extracted by eluting the sample with an acetone–hexane mixture.
14.6.2 Gas Emission
Human activities in agriculture accelerate the production of environmental loading gas on a global scale. Increasing gas emissions from farmland may lead to adverse environmental effects, including global warming, acid rain, changes in biodiversity, and stratospheric ozone depletion.
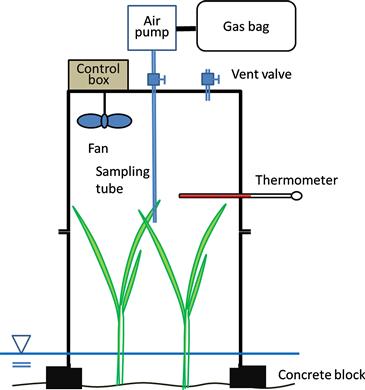
The closed chamber schematically shown in Figure 14.7 is a device used for measurements of the gas flux emitted from paddy fields into the atmosphere. The CH4 flux is determined by measuring the temporal increase of the CH4 concentration of the air within the chamber that is placed on a paddy field to hold some growing rice plants inside. The chamber air sampling is usually collected within 10 min after the chamber has been set in place; the gas is stored in a gas sampling bag to be analyzed later in the laboratory by using a gas chromatograph equipped with a flame ionization detector (GC/FID) (Yagi and Minami, 1990). Methane flux rates from rice fields is likely overestimated by using the closed chamber technique because decreasing grain yield by chamber enclosure may result in more plant photosynthetic products released into soils to enhance CH4 production (Yu et al., 2006).
Analysis of atmospheric air using open-path Fourier transform infrared (OP/FT-IR) spectrometry has been available for over two decades but has not been widely accepted because of the limitations of the software for commercial applications of the instrument. Most OP/FT-IR spectrometers use a photoconductive mercury cadmium telluride (MCT) detector that is cooled down to about 80 K either with liquid nitrogen (LN2) or by using a closed-cycle cooler (Griffiths et al., 2009). To simultaneously monitor concentrations of N2O and CO2 at a height of 3 m in the stable boundary layer, a concentration measurement precision of 1% for 3 min on average was achieved over a 97-m-long, open-air absorption path. The precision of N2O concentration measurements with OP/FT-IR is an order of magnitude poorer than with GC/ECD. The associated errors are random and equal to 0.6% and 0.06% for the FTIR and GC/ECD systems respectively (Kelliher et al., 2002).
Emissions of ammonia (NH3), which is the most abundant form of reduced reactive nitrogen in the atmosphere, have increased significantly as a result of intensive agricultural management and greater livestock production in many developed countries. Synthetic fertilizers and agricultural crops together contribute 9 × 10¹² g NH3-N y−1 or 12% of total NH3 emissions (Schlesinger and Hartley, 1992). The absorption flasks sampler method is the typical method for capturing atmospheric ammonia. Two absorption flasks, each containing 30 mL of orthophosphoric acid or boric acid solution (0.1, 0.01, or 0.001 mol L−1), are connected in series at the sampling point. Air is forced through the flasks through a 4-mm tube at 2 or 4 L min−1 to trap the ammonia contained in the air. Following the sampling step, the solution volumes are adjusted to 100 mL using deionized water; the ammonia trapped in the solution is determined using colorimetry or liquid chromatography (Misselbrook et al., 2005).
14.6.3 Field Monitoring Server
In order to facilitate field and environment monitoring of air and water qualities over long periods of time, a new method using a remote monitoring system as shown in Figure 14.8 has been developed. Field servers are one of the small monitoring sensor nodes that are equipped with a web server to be accessed via the internet using wireless LAN to provide a high-speed transmission network (Fukatsu and Hirafuji, 2005). The information technology (IT) field monitoring system consists of an intelligent sensor node web server that is equipped with in situ camera and sensor networks for agrometeorological, soil, and plant growth monitoring. The actual field conditions are captured well by a combination of images, numerical results, and graphical data sets (Manzano et al., 2011).
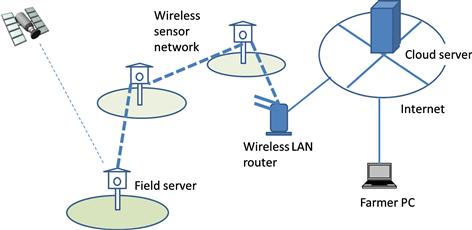
Wireless sensor network (WSN) technology has the potential to reveal fine-grained, dynamic changes in monitored variables of an outdoor landscape. The design and implementation of a reactive, event-driven network for environmental monitoring of soil moisture has been proposed (Cardell-Oliver et al., 2005). The outdoor monitoring server system with a solar cell power supply collects environmental and soil information using a combination of WSN-based environmental and soil sensors, image information through CCTVs, and location information using GPS modules (Hwang et al., 2010).
Applying information technology to gather cumulative environmental and agricultural data can enhance high yields of biomass production while alleviating environmental burdens.
References
1. Balat M. Production of bioethanol from lignocellulosic materials via the biochemical pathway: A review. Energy Conversion and Management. 2011;52:858–875.
2. Binod P, Sindhu R, Singhania RR, et al. Bioethanol production from rice straw: An overview. Bioresource Technology. 2010;101:4767–4774.
3. Buchholz T, Luzadis VA, Volk TA. Sustainability criteria for bioenergy systems: Results from an expert survey. Journal of Cleaner Production. 2009;17:S86–S98.
4. Cardell-Oliver R, Kranz M, Smettem K, Mayer K. A reactive soil moisture sensor network: Design and field evaluation. International Journal of Distributed Sensor Networks. 2005;1:149–162.
5. Corbière-Nicollier T, Blanc I, Erkman S. Towards a global criteria based framework for the sustainability assessment of bioethanol supply chains: Application to the Swiss dilemma: Is local produced bioethanol more sustainable than bioethanol imported from Brazil? Ecological Indicators. 2011;11:1447–1458.
6. Dale VH, Kline KL, Wiens J, Fargione J. Biofuels: Implications for land use and biodiversity. Biofuels and sustainability reports Ecological Society of America 2010.
7. Forest Stewardship Council (FSC). <http://www.fsc.org/vision-mission.12.htm> Accessed August 2012.
8. Forestry Agency. Standing tree volume table (east Japan version and west Japan version). Tokyo: J-FIC; 1970.
9. Fukatsu T, Hirafuji M. Field monitoring using sensor-nodes with a web server. Journal of Robotics and Mechatronics. 2005;17(2):164–172.
10. Garland CD. Growing and harvesting switchgrass for ethanol production in Tennessee. Publication NO. SP701-A Knoxville, TN: University of Tennessee Extension; 2008.
11. GBEP. The global bioenergy partnership sustainability indicators for bioenergy. Rome: Food and Agriculture Organization of the United Nations (FAO); 2011.
12. Gowdy J. Hierarchies in human affairs: microfoundation and environmental sustainability. In: Kohn J, ed. Sustainability in question: The search for a conceptual framework. Northampton, MA: Edward Elgar; 1999;67–84.
13. Griffiths PR, Shao L, Leytem AB. Completely automated open-path FT-IR spectrometry. Analytical and Bioanalytical Chemistry. 2009;393:45–50.
14. Hwang J, Shin C, Yoe H. Study on an agricultural environment monitoring server system using wireless sensor networks. Sensors. 2010;10:11189–11211.
15. IPCC. IPCC Second Assessment Report: Climate Change 1995 (SAR). 1995.
16. IPCC. IPCC Fourth Assessment Report: Climate Change 2007 (AR4). 2007.
17. Itsubo N, Tahara K, Narita A, Inaba A, Aoki R. Outline of LCA. 2007; Japan Environmental Management Association for Industry.
18. Kato M, ed. Forest remote sensing. 3rd ed 2010; From base to application. Tokyo: J-FIC [in Japanese].
19. Kelliher FM, Reisinger AR, Martin RJ, Harvey MJ, Price SJ, Sherlock RR. Measuring nitrous oxide emission rate from grazed pasture using Fourier-transform infrared spectroscopy in the nocturnal boundary layer. Agricultural and Forest Meteorology. 2002;111:29–38.
20. Ko JK, Bak JS, Jung MW, et al. Ethanol production from rice straw using optimized aqueous-ammonia soaking pretreatment and simultaneous saccharification and fermentation processes. Bioresource Technology. 2009;100:4374–4380.
21. Koga N, Tajima R. Assessing energy efficiencies and greenhouse gas emissions under bioethanol-oriented paddy rice production in northern Japan. Journal of Environmental Management. 2011;92:967–973.
22. Lendle A, Schaus M. Sustainability criteria in the EU renewable energy directive: Consistent with WTO rules? ICTSD information note No 2. International Centre for Trade and Sustainable Development (ICTSD) 2010.
23. Lewandowski I, Faaij APC. Steps towards the development of a certification system for sustainable bio-energy trade. Biomass and Bioenergy. 2006;30:83–104.
24. Manzano VJP, Mizoguchi M, Mitsuishi S, Ito T. IT field monitoring in a Japanese system of rice intensification (J-SRI). Paddy Water Environment. 2011;9:249–255.
25. Mayer AL. Strengths and weaknesses of common sustainability indices for multidimensional systems. Environment International. 2008;34(2):277–291.
26. Merriam-webster, <http://www.merriam-webster.com/dictionary/sustained%20yield> Accessed August 2012.
27. Ministry of the Environment of Japan. Calculation and report manual of greenhouse gas emissions, Ver 3.2. 2012.
28. Misselbrook TH, Nicholson FA, Chambers BJ, Johnson RA. Measuring ammonia emissions from land applied manure: An intercomparison of commonly used samplers and techniques. Environmental Pollution. 2005;135:389–397.
29. Nakasone H. Runoff water quality characteristics in a small agriculture watershed. Paddy Water Environment. 2003;1:183–188.
30. Nansai K, Moriguchi Y. Embodied energy and GHG emissions intensities based on the 2005 Japanese input-output tables (3EID). National Institute for Environmental Studies 2009.
31. National Institute for Environmental Studies. National Greenhouse Gas Inventory Report of Japan. 2012; <http://www-gio.nies.go.jp/aboutghg/nir/2012/NIR-JPN-2012-v3.0E.pdf>; 2012; Accessed 23.08.2012.
32. Nguyen TAD, Kim KR, Han SJ, et al. Pretreatment of rice straw with ammonia and ionic liquid for lignocellulose conversion to fermentable sugars. Bioresource Technology. 2010;101:7432–7438.
33. OECD. Executive summary of environmental indicators for agriculture. Method and results. Vol. 3 Paris: OECD; 2001.
34. O’sumi S. Lecture on forest measurement. Tokyo: Yokendo [in Japanese]; 1987.
35. Padovani L, Capri E, Padovani C, Puglisi E, Trevisan M. Monitoring tricyclazole residues in rice paddy watersheds. Chemosphere. 2006;62:303–314.
36. Park J, Kanda E, Fukushima A, et al. Contents of various sources of glucose and fructose in rice straw, a potential feedstock for ethanol production in Japan. Biomass and Bioenergy. 2011a;35:3733–3735.
37. Park J, Shiroma R, Tokuyasu K. Bioethanol production from rice straw by a sequential use of Saccharomyces cerevisiae and Pichia stipitis with heat inactivation of Saccharomyces cerevisiae cells prior to xylose fermentation. Journal of Bioscience and Bioengineering. 2011b;111(6):682–686.
38. Phong TK, Nhung DTT, Motobayashi T, Thuyet DQ, Watanabe H. Fate and transport of nursery-box-applied tricyclazole and imidacloprid in paddy fields. Water Air Soil Pollution. 2009;202:3–12.
39. Program for the Endorsement of Forest Certification (PEFC). <http://www.pefc.org/about-pefc/overview> Accessed August 2012.
40. Rice RW, Izuno FT, Garcia RM. Phosphorus load reductions under best management practices for sugarcane cropping systems in the Everglades Agricultural Area. Agricultural Water Management. 2002;56:17–39.
41. Roy R, Tokuyasu K, Orikasa T, Nakamura N, Shiina T. A techno-economic and environmental evaluation of the life cycle of bioethanol produced from rice straw by RT-CaCCO process. Biomass and Bioenergy. 2012a;37:188–195.
42. Roy R, Tokuyasu K, Orikasa T, Nakamura N, Shiina T. Evaluation of the life cycle of bioethanol produced from rice straws. Bioresource Technology. 2012b;110:239–244.
43. Saga K, Yokoyama S, Imou K. Net energy analysis of bioethanol production system from rice cropping. Journal of Japan Society of Energy and Resources. 2007;29(1):30–35.
44. Sarkar N, Ghosh SK, Bannerjee S, Aikat K. Bioethanol production from agricultural wastes: An overview. Renewable Energy. 2012;37:19–27.
45. Schlesinger WH, Hartley A. A global budget for atmospheric NH3. Biogeochemistry. 1992;15:191–211.
46. SETAC. Guidelines for life cycle assessment: A code of practice. 1993.
47. SETAC. Towards a methodology for life cycle impact assessment. 1996.
48. Sheehan J. Biofuels and the conundrum of sustainability. Current Opinion in Biotechnology. 2009;20:318–324.
49. Shinozaki Y, Kitamoto HK. Ethanol production from ensiled rice straw and whole-crop silage by the simultaneous enzymatic saccharification and fermentation process. Journal of Bioscience and Bioengineering. 2011;111(3):320–325.
50. Silva Lora EE, Escobar Palacio JC, Rocha MH, Grillo Renó ML, Venturini OJ, Almazán del Olmo O. Issues to consider, existing tools and constraints in biofuels sustainability assessments. Energy. 2011;36:2097–2110.
51. Simpson TW, Sharpley AN, Howarth RW, Paerl HW, Mankin KR. The new gold rush: Fueling ethanol production while protecting water quality. Journal Environmental Quality. 2008;37:318–324.
52. Sustainable Green Ecosystem Council (SGEC). <http://www.sgec-eco.org/index%28e%29.html> Accessed August 2012.
53. Suzuki T. A new Essed’s distance method. Bulletin of the Nagoya University Forest 1965; 51–58 [in Japanese with English summary].
54. Takata Y, Obara H, Nakai M, Kohyama K. Process of the decline in the cultivated soil area with land use changes in Japan. Japanese Journal of Soil Science and Plant Nutrition. 2011;82(1):15–24.
55. Uematsu Y, Koga T, Mitsuhashi H, Ushimaru A. Abandonment and intensified use of agricultural land decrease habitats of rare herbs in semi-natural grasslands. Agriculture, Ecosystems and Environment. 2010;135:304–309.
56. United Nations. The declaration of forest principle. 1992; <http://www.un.org/documents/ga/conf151/aconf15126-3annex3.htm>; 1992; Accessed August 2012.
57. USDA. Programmatic environmental impact statement. 2010; Biomass crop assistance program, Farm Service Agency, US Department of Agriculture.
58. Yadav KS, Naseeruddin S, Prashanthi GS, Sateesh L, Rao LV. Bioethanol fermentation of concentrated rice straw hydrolysate using co-culture of Saccharomyces cerevisiae and. Pichia stipites Bioresource Technology. 2011;102:6473–6478.
59. Yagi K, Minami K. Effect of organic matter application on methane emission from some Japanese paddy fields. Soil Science and Plant Nutrition. 1990;36(4):599–610.
60. Yang C, Sagisaka M. Evaluation of bioethanol production system from rice straw. Journal of Life Cycle Assessment, Japan. 2009;5(4):501–509.
61. Yoshida S. Comparison between the past and present system used for national forest inventory in Japan. Journal of Japanese Forestry Society. 2008;90:283–290 [in Japanese with English summary].
62. Yoshikawa S, Yamamoto H, Hanano Y, Ishihara A. Hilly-land Soil Loss Equation (HSLE) for evaluation of soil erosion caused by the abandonment of agricultural practices. Japan Agricultural Research Quarterly. 2004;38(1):21–29.
63. Yoshinaga I, Miura A, Hitomi T, Hamada K, Shiratani E. Runoff nitrogen from a large sized paddy field during a crop period. Agricultural Water Management. 2007;87:217–222.
64. Yu KW, Chen GX, Xu H. Rice yield reduction by chamber enclosure: A possible effect on enhancing methane production. Biology and Fertility of Soils. 2006;43:257–261.