Soil Fertility and Soil Microorganisms
Haruo Tanaka, Akane Katsuta, Koki Toyota and Kozue Sawada
Abstract
Classification of soil potential productivity, the classification criteria, and standards for evaluating the soil fertility in Japan are introduced in this chapter. Increasing the carbon sequestration in soil during the process of biomass production is of great importance to improve the soil fertility for producing more biomass. The modified Rothamsted Carbon model that has been improved for evaluating major arable soils in Japan, i.e. Andosols and paddy soils, will also be included. Soil microbes play crucial roles in soil functions, especially nutrient cycling, and thus contribute significantly to sustainable crop production. General aspects of soil microbes are discussed in order to provide an understanding of the role that soil microbes play in crop production. Because soils with higher nitrogen-supplying capacity, expressed as the rate of microbial mineralization of soil organic matter, are considered to have higher soil fertility; microbial mediation to enhance soil fertility is also discussed.
Keywords
Soil fertility; soil organic matter; land capability classification; Rothamsted Carbon model; carbon sequestration; function; microbial biomass; nitrogen fixation; nitrification; turnover
Chapter Outline
5.1.1. Definition of Soil Fertility
5.1.2. Soil Potential Productivity Classification
5.1.3. Factors Affecting the Capability Classification
5.1.4. Expression of Productive Capability Class
5.1.5. Improvement of Potential Productivity Classification
5.2. Soil Management and Soil Organic Matter
5.2.1. Carbon Dynamics on the Earth Scale
5.2.2. Factors in the Increase and Decrease of SOC
5.2.3. Principle of Rothamsted Carbon Model
5.2.4. Modification of RothC for Andosols and Paddy Soils
5.2.5. Application of Modified RothC
5.3.5. Soil Sickness due to Continuous Cropping
5.4. Microbially Mediated Soil Fertility
5.4.1. Productivity and Environmental Impacts
5.4.2. Nitrogen Cycles Through Microbial Biomass in Soils
5.4.3. Nitrogen Cycle Through Microbial Biomass in Japanese Agricultural Soils
5.4.4. Management of Microbial Biomass Nitrogen During a Crop Growth Period
5.1 Soil Fertility
Haruo Tanaka
5.1.1 Definition of Soil Fertility
Soil fertility is defined as “the quality of a soil that enables it to provide nutrients in adequate amounts and in proper balance for the growth of specified plants or crops” (Soil Science Glossary Terms Committee, 2008). It is not only based on the natural conditions or peculiar property that the soil has but also the human activities such as growing various crops by applying different cultivation methods. Soil fertility is the most important factor to affect the production of biomass in a field. Usually, sustainable high yields of biomass can be expected from fertilized soil. For land that is not fertile, application of a large quantity of natural or chemical fertilizer with high labor demand is necessary to maintain high biomass production.
An agro-ecosystem is viewed as a subset of a natural ecosystem. Traditionally, the agro-ecosystem is characterized as having a simpler species composition and simpler energy and nutrient flows than a natural ecosystem. The soil has the function as the decomposer in the agro-ecosystem to decompose the organic matter such as composts or plant residues applied to the soil into inorganic matters biologically by animals and microorganisms inhabiting the soil. However, excessive application of organic matter causes environmental pollution such as the groundwater contamination with ammonium. In addition, as a producer, the soil supports the growth of plants that absorb nutrients and water from the soil to grow under solar irradiation. Hence, “soil productivity” is a synonym of “soil fertility”.
5.1.2 Soil Potential Productivity Classification
In Japan, “Soil Potential Productivity Classification” (National Conference of Soil Conservation and Survey Project, 1979) is used to evaluate soil fertility; the soil potential productivity classification is presented based on the report by Hamazaki and Micosa (1991).
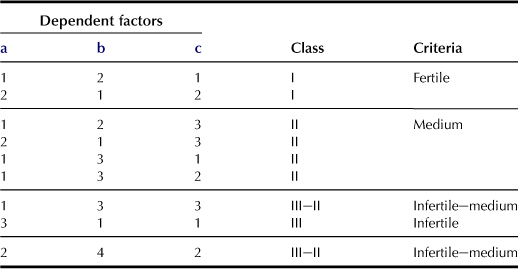
Classification of soil potential productivity is a form of interpreting the results of soil surveys. It is a practical method to grade or group soils based upon their limitations or hazards for crop production and/or risk of soil damage to jeopardize crop production; all these concerns are closely related to soil’s physical and chemical properties. The objective of land capability classification is to eliminate limitations for increasing crop productivity. There are four soil capacity classifications, i.e. I, II, III, and IV, defined as follows:
• Class I – Land has almost no limitations or hazards for crop production and/or risks of soil damage.
• Class II – Land has some limitations or hazards and/or risks of soil damage, and some improvement practices are required for normal crop production.
• Class III – Land has many limitations or hazards and/or risks of soil damage, and fairly intensive improvement practices are required.
• Class IV – Land has great natural limitations, so it is difficult to use as arable land.
5.1.3 Factors Affecting the Capability Classification
The classification standard varies according to types of crops, such as paddy, upland, orchard, and grassland. In Japan, the Soil Potential Productivity Classification is carried out by evaluating each of the standard factors, or the inherent soil characteristics; some of these factors are determined by a combination of dependent factors, or supplementary soil characteristics. The standard and dependent factors are described in sections (a)–(m) that follow.
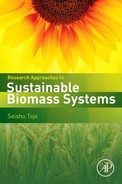
a Thickness of Topsoil (t: code in simplified formula; Table 5.1)
Topsoil is the surface horizon where plant roots can easily penetrate; this horizon corresponds to the plowed layer in general arable land. It is grouped according to the thickness of topsoil as shown in Table 5.1. For upland or orchard, more than 25 cm of topsoil is classified as class I, and less than 25 cm is classified as class II or III. On the other hand, for the paddy or grassland, more than 15 cm is classified as class I, because paddy or grassland crops are capable of growing in thinner topsoil than upland or orchard crops.
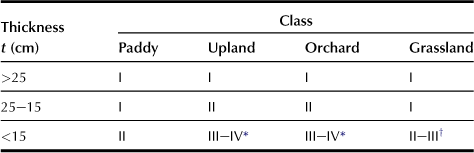
b Effective Depth of Soil (d; Table 5.2)
Effective depth is the maximum depth beyond which the soil’s physical conditions become unfavorable for the downward root to develop for normal crops, for example bedrock with hard pan more than 29 mm of soil hardness as determined using Yamanaka’s core penetration, and more than 10 cm of thick gravel layer.
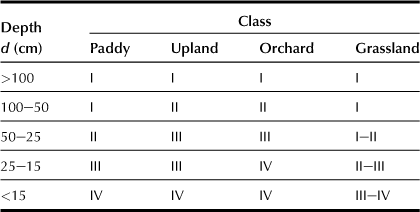
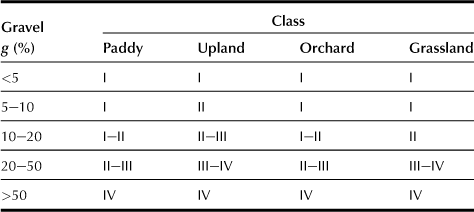
c Gravel Content of Topsoil (g; Table 5.3)
Gravel (rock and mineral fragments) contents in the topsoil are expressed as percentages of exposed surface area of gravel in the soil profile.
d Ease of Plowing (p; Table 5.4)
Estimation of plowing is based on the evaluation of resistance against agricultural machinery and friability of soil clods. Both properties are largely dependent upon the soil moisture condition as well as the quantity of clay and organic matter. Classes of this factor are evaluated using four dependent factors and their combinations. For example, soil texture is based on the classification used in the ISSS system; textures of S, LS, SL, FSL, L, and SiL are classified as “Coarse to medium”; SCL, CL, and SiCL are classified as “Fine”; and SC, LiC, SiC, and HC are classified as “Very fine”.
TABLE 5.4
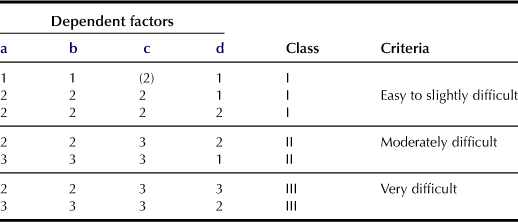
aTexture of top soil (Coarse to medium: 1; Fine: 2; Very fine: 3).
bStickiness of topsoil (Non-sticky to slightly sticky: 1; Sticky: 2; Very sticky: 3).
cConsistence of topsoil when dry (Loose to soft: (2); Slightly hard: 1; Hard: 2; Very hard to extremely hard: 3).
dMoisture condition of topsoil (Dry to moderately dry: (2); Moist: 1; Wet: 2; Very wet: 3). Moisture condition refers to the major part of the year and/or 2–3 days after considerable rainfall.
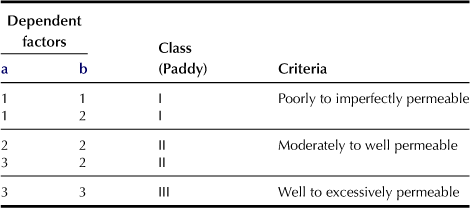
e Permeability Under Submerged Conditions (l; only for paddy fields; Table 5.5)
This soil permeability affects the movement of water in the soil, soil temperature, and leaching of nutrients or development of reduced condition of the soil. It is evaluated mainly by the combination of soil texture and the presence of a compact layer within 50 cm of the surface as dependent factors. The measurement of the water permeability coefficient and/or water requirement in depth has been widely used, and hence the permeability data are handy for carrying out the soil permeability classification. The dependent factors that are relevant to classifying the soil are as shown in Table 5.5. This table shows similar classifications of finest soil texture as in Table 5.4, but the ratings are different. To determine the maximum compactness within 50 cm of the surface, Yamanaka’s core penetrometer is used. Value ranges of >24, 24–11, and <11 are classified as “Very compact to compact”, “Medium to loose”, and “Very loose” respectively.
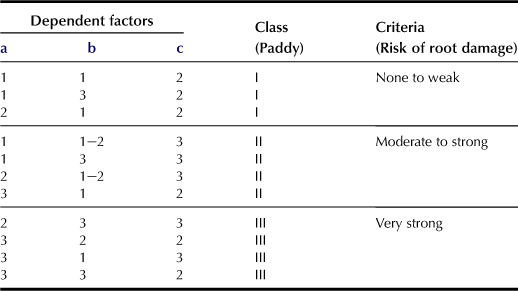
f State of Oxidation–Reduction Potentiality (r; only for paddy fields; Table 5.6)
This standard factor indicates the risk of root damage due to strong reduction of soil, resulting in low rice production. Three dependent factors, i.e. “Content of easily decomposable organic matter in topsoil”, “Contents of free iron oxides in topsoil”, and “Degree of gleyzation” are used. Organic matter that is easily decomposed is represented by NH4-N cg kg−1 in air-dried soil (A) and NH4-N cg kg−1 in soil after the soil sample has been incubated at 30°C for 4 weeks (B). The easily decomposable organic matter is classified as “Low” (A < 10, B < 10), “Medium” (A: 10–20; B: 10–15), and “High” (A: >20; B: >15). If based on the content of free iron oxides (cg kg−1), the topsoil can be classified as “High” (>1.5), “Medium” (1.5–0.8), and “Low” (<0.8). For the degree of gleyzation, the depth of the top gley horizon is used, and the soil is classified as “Weak” (≥50 cm), “Moderate” (50 cm to bottom of plow layer), and “Strong” (above the bottom of plow layer). Peat and muck are regarded as the gley horizon.
g Wetness of Land (w; wet condition, (w) dry condition, for upland, orchard, and grasslands; Table 5.7)
This standard factor is used for estimating of the risk of drought or wetness of upland crops, trees, and grasslands; the classes and criteria are as follows: (Class-criteria) (IV) – High possibility of drought; (III) – Possibility of drought; (II) – Low possibility of drought; I – None; II – Low possibility of over-wetness; III – Possibility of over-wetness; IV – High possibility of over-wetness. These classes are evaluated by the combination of three dependent factors, as shown in Table 5.7. One of the dependent factors, water-holding ability of surface and subsurface horizons, is evaluated based on the quantity of water between field capacity (pF 1.5) and permanent wilting point (pF 4.2). A value of available water (g L−1) >200 is “High”, 200–100 is “Medium”, and <100 is “Low”. The above classification is for upland, orchard, and grassland; different criteria are used for paddy fields.
TABLE 5.7
High Possibility of Over-Wetness (w; for upland, orchard, and grassland field)
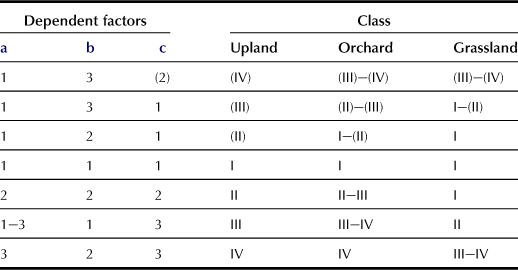
aPermeability of solum (High: 1; Medium: 2; Low: 3).
bWater-holding ability of surface and subsurface horizons (High: 1; Medium: 2; Low: 3, determined by available water).
cMoisture condition (Dry to moderately dry: (2); Moist: 1; Wet: 2; Very wet: 3).
h Inherent Fertility of the Soil (f; Table 5.8)
The soil’s inherent fertility is evaluated by using combinations of the following three dependent factors: nutrient-holding capacity, nutrient fixation power, and base status. Nutrient-holding capacity is evaluated based on cation exchanged capacity (CEC; cmolc kg−1 soil) as “High” (>20), “Medium” (20–6), and “Low” (<6). Classification of nutrient fixation power is based on the phosphate absorption coefficient of the topsoil evaluated using the Blakemore method, and the classifications are “Very low” (value <35%), “Low” (35–80%), “Medium” (80–90%), and “High” (>90%). Base on the pH (H2O) value, the soil can be classified as “good” (pH > 5.5), “medium” (pH between 5.5 and 5.0), and “poor” (pH < 5.0). Table 5.8 shows the classification for upland, orchard, and grassland, while other tables are used for paddy fields.
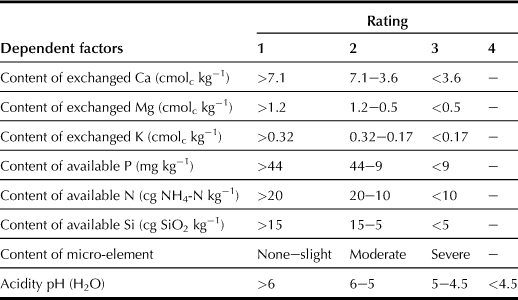
i Content of Available Nutrients (n; Table 5.9)
Available nutrients in topsoil are closely related to the inherent soil fertility, but evidently influenced by the combination of the following dependent factors: contents of exchangeable Ca, exchangeable Mg, exchangeable K, content available P (determined by using the Truog method), available N and Si (for paddy), and micro-elements (evaluated by using the risk of deficiency), as well as soil acidity as indicated by the pH (H2O) value.
j Hazard (i; Table 5.10)
This standard factor refers mainly to the limitation caused by the presence of excessive quantities of hazardous substances such as sulfur compounds, soluble salts, and heavy metals, among many others. Dependent factors for this standard factor include: (1) Harmful sulfur compounds (None, Slight, Moderate, and Severe), salt content (None to slight, Moderate, and Severe, evaluated by using chlorine as the indicator), heavy metals including Cr, Ni, Cu, Zn, As, Mn, Mo, etc. (None, Slight, Moderate, and Severe); (2) irrigation water quality based on temperature, pH (H2O), total N, salts, and heavy metal (none to Slight, Moderate, and Severe), and (3) physical hazards that involve the difficulty of removal of bedrock, pan, compact layer or gravel layer being within 50 cm of the surface (None, Difficult, and Very difficult).
k Frequency of Accidents (a; Table 5.11)
This standard factor is mainly influenced by natural environmental conditions rather than by soil characters. Classification of this standard factor is determined based on the following two independent factors: risk of overhead flooding inundation (None to slight, Moderate, and Frequent), and risk of land creep (None to slight, Moderate, and Frequent).
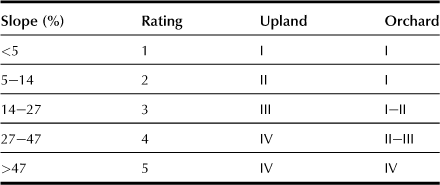
l Slope of the Field (s; for upland and orchard; Table 5.12)
The natural slope is the main dependent factor; its classification is decided by a combination of natural slope, direction of slope, and artificial slope.
m Erosion (e; for upland orchard; Table 5.13)
The degree of erosion or occurrence of rill or gully (Very slight, Slight, Moderate, and Severe), the power to resist water erosion for topsoil determined using the dispersion ratio (Strong, Moderate, and Weak), and the resisting power wind erosion for topsoil determined using the soil bulk density (Strong and Weak) are pertinent here.
5.1.4 Expression of Productive Capability Class
The evaluation of these standard and dependent factors is expressed as either a simplified code formula or a detailed code formula. When a simplified code formula, e.g. “II plrn”, is used, the productive capability class is placed in the lowest class of factors. This code formula arranges briefly the information regarding the kind and the degree of limitations with each class of land. The code “II plrn” means that the land is classified class II because the factors p (ease of plowing), l (permeability under submerged conditions), r (state of oxidation–reduction potentiality), and n (content of available nutrient) are grouped in class II. If the soil fertility of this land is to be improved, improving all of these factors together is necessary.
5.1.5 Improvement of Potential Productivity Classification
Soil Potential Productivity Classification, which is focused on crop production, represents the inhibitory factors of the crop production clearly with a simple code formula. Now that environmental conservation has become an important issue, these issues may include prevention of nitrogen eluviation to the groundwater, and prevention of the emission of greenhouse gases including methane and nitrous oxide. The classification must include environmental conservation functions. In addition, as far as the current situation is concerned, the classification must consider not only chemical and physical factors, but also biological factors such as activity or variety of the soil organisms.
5.2 Soil Management and Soil Organic Matter
5.2.1 Carbon Dynamics on the Earth Scale
In recent years, the importance of soil organic carbon (SOC) in the carbon cycle on a global scale has attracted the attention of public and private sectors, and the general public as well. Increasing greenhouse gases such as CO2 in the atmosphere causes adverse effects on the climate system. For the whole Earth, about 750 Pg of carbon exist in the atmosphere as CO2 and about 500 Pg of carbon accumulates in the land plant biomass. On the other hand, about 1500 Pg carbon exists as SOC in soil organic matter (SOM), and the quantity is equivalent to approximately twice the total atmospheric CO2 and approximately three times the total land plant biomass (IPCC, 2001). Hence, it is certain that the slightly increasing or decreasing SOC quantity influences global carbon greatly because of the huge quantity of SOC existing in the soil. It is estimated that about 2000 Pg of carbon used to exist in soil as SOC during the prehistoric age, and the amount SOC presently is estimated to be about 1500 Pg. Human activities to degrade soil and reduce SOM contained in the soil lead to the loss of about 500 Pg SOC. The amount of carbon released as a result of soil degradation is equivalent to double the amount of 230 Pg, which is the total quantity of carbon released by consuming fossil fuels (Hakamata et al., 2000). If the soil degradation is restored using appropriate management practices, soil can become a huge sink of atmospheric carbon through carbon sequestration. Much research has been undertaken to study how to predict the quantitative change of SOC, and estimate the carbon balance more accurately. This is also emphasized in the Kyoto Protocol in order to prevent the expected global warming.
5.2.2 Factors in the Increase and Decrease of SOC
The SOC decomposition rate is affected by environmental factors as discussed in the following paragraphs:
1. In the range of natural temperature, both the microbial activity and the SOC decomposition rate increase at higher temperature. Hence, tropical zones have less SOC than frigid zones due to the temperature difference.
2. Either higher or lower water content than the level for maximum microbial growth in the soil causes the SOC decomposition rate to slow down, so that the amount of SOC increases. If the soil water content is appropriate, microbial activity reaches the highest level so that more SOC is decomposed to result in less SOC in the soil. In paddy fields, SOC accumulates because the paddy soil is fully submerged in irrigation water when rice is cultivated.
3. The quantity of SOC increases when the soil is clayey.
4. Soil with extreme acidity or alkalinity inhibits the activity of soil microorganisms, so that the SOC decomposition rate becomes slow, and SOC accumulates in the soil.
5. The amount of SOC increases in soil that is not tilled for growing crops.
6. The amount of SOC increases if more organic matter such as plant residues or composts is applied.
7. The amount of SOC increases when the organic matter applied to the soil contains a higher C/N ratio.
8. If the ratio of organic matter that is refractory to microbial decomposition, e.g. lignin, is applied, the quantity of SOC increases.
5.2.3 Principle of Rothamsted Carbon Model
Among the many SOM turnover models proposed by international researchers, the Rothamsted Carbon model (RothC) developed for non-waterlogged soil will be reviewed. RothC was developed by Jenkinson and Rayner (1977) based on data from long-term experiments on soils at the Rothamsted Experimental Station (currently known as Rothamsted Research) in the UK. The model has been improved several times, and the current version is known as RothC-26 (Coleman and Jenkinson, 1996).
RothC is one of the multicompartmental models in which SOC is split into one non-active compartment and four active compartments with different decomposition rates. The calculation is carried out on a monthly basis. Incoming plant carbon is split between decomposable plant material (DPM) and resistant plant material (RPM) depending on the DPM/RPM ratio of the carbon. Both DPM and RPM decompose to form microbial biomass (BIO), humified organic matter (HUM), and partly CO2 that is lost from the system. The proportion that goes to CO2 and to BIO + HUM is determined by the clay content of the soil; clayey soil has a slower SOC decomposition rate than sandy soil. Both BIO and HUM undergo further decomposition repeatedly to produce more CO2 as well as other species of BIO and HUM. The model also includes inert organic matter (IOM) that does not decompose so that it remains in the soil with the quantity unchanged. Decomposition of SOCs in the four active compartments except IOM follows first-order kinetics with different characteristic decomposition rate constants. Both soil temperature and/or water content influence the magnitude of this rate constant; a fast decomposition rate is expected at high temperature and slow decomposition rate constant with dry soil. When the soil experiences temperature changes to alter the SOC decomposition rate, the decomposition rate constants are modified by multiplying by one or more “rate modifiers”.
The input data required to run the model include:
2. Monthly open pan evaporation (mm)
3. Average monthly air temperature (°C)
4. Clay content of the top soil (as a percentage)
5. An estimate of the decomposability of the incoming plant material – DPM/RPM ratio
6. Soil cover – Is the soil bare or vegetated in a particular month?
7. Monthly input of plant residues (Mg-C ha−1)
8. Monthly input of farmyard manure (FYM, in Mg-C ha−1), if any.
The PC software to run RothC can be downloaded free from the website http://www.rothamsted.ac.uk/aen/carbon/rothc.htm.
5.2.4 Modification of RothC for Andosols and Paddy Soils
RothC has been used to adequately simulate changes in the SOC content for a variety of upland soil types, including arable land and grassland in Europe and the USA. In Japan, Andosols and paddy soils are major arable soils in Japan, and they have slow organic matter decomposition rates. However, this model does not simulate SOC changes in Andosols and paddy soils in Japan with satisfactory results. Modifications of the RothC model have been performed in recent years for a better application to Japanese characteristic fields (Shirato et al., 2004; Shirato and Yokozawa, 2005).
The main reason that RothC does not work properly for Andosols is that active aluminum formed in the weathering process of the volcanic ash holds organic matter strongly. The presence of Al–humus complexes in Andosols makes the HUM pool extremely stable. This has not been considered in the original RothC model. In the modified RothC model for Andosols, a factor H(f) is incorporated, and the value of H(f) is calculated based on the quantity of pyrophosphate extractable aluminum (Alp), i.e. H(f) = 1.20 + 2.50 × Alp (%). The decomposition rate of the HUM compartment is modified by dividing the original HUM by H(f). The IOM pool is set to “zero” because the soil did not contain carbon when it was formed from fresh volcanic ash. The modified model has been evaluated with satisfactory results by using sets of long-term experimental data collected on Andosols under various climate conditions.
The main reason for the slow decomposition rate of organic matter during the rice-growing season in flooded paddy fields is that the submerged soils are waterlogged and subjected to anaerobic conditions to hamper the activities of soil microorganisms. On the other hand, the decomposition of organic matter is inhibited in paddy soils not only during the submergence period but also throughout the whole year because of the difference in the composition of microorganisms between upland and paddy soils. The decomposition rate in the modified RothC model for paddy fields is set to 0.2-fold in the submergence period (summer) and 0.6-fold in the period without submergence (winter) as compared with the original model. These modifications have been found to be satisfactory for the long-term experimental data sets collected from paddy soils.
5.2.5 Application of Modified RothC
Box 5.1 shows examples of utilizing the modified RothC. It becomes clear that cultivation of the forage rice for high crop yield will assist in alleviating global warming through not only bioethanol production but also increased soil carbon sequestration. Hence, a turnover of SOC varies according to the difference in cropping system so that changes of SOC sequestration can be predicted using an appropriate model such as RothC. Additionally, choosing an appropriate cropping system that does not alter the SOC sequestration process needs to be considered for future agricultural activities.
BOX 5.1
Prediction of Soil Organic Carbon Sequestration Change using Modified Rothamsted Carbon Model
The method of predicting changes of soil organic carbon (SOC) using the modified Rothamsted Carbon model (RothC) is explained here.
Figure 5.1A shows a prediction of the changes of SOC in the field of Andosols, which is the upland located at 35°41′ N and 139°29′ E. Mean monthly temperatures at this location are 4.6°C in January and 27.0°C in August, with an annual mean temperature of 15.6°C. Mean precipitation is 38 mm in January and 315 mm in August, with an annual precipitation of 1639 mm. Dry density of the soil at this location is 0.68 Mg m−3, and the clay content is 35.6%. This soil is Melanic Silandic Eutrosilic Andosols; the pyrophosphate extractable Al (Alp) is 0.67%. Compost in an amount of 5.38 Mg-C ha−1 y−1 is applied to the compost application plot. When the plot is rotated with growing wheat and soybean crops, input of the plant residue becomes 4.44 Mg-C. The SOC of the chemical fertilizer plot was 60 Mg-C ha−1 in 2007, but is expected to decrease to 55 Mg-C ha−1 in 2050 when compost will not be applied. Compost application is known to be a necessary procedure for maintaining an appropriate SOC level in the soil; applying 5.38 Mg-C ha−1 of compost continuously will lead to a predicted SOC level of 105 Mg-C ha−1 in 2050. Hence, applying an adequate amount of compost is expected to either maintain or increase carbon sequestration in soil that will contribute significantly to alleviating the global warming problem.
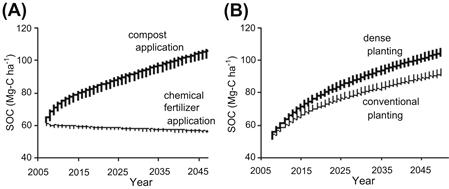
FIGURE 5.1 Estimation of soil organic carbon sequestration changes from 2008 to 2050 with different fertilizer application in the upland field (A), and with different planting density of forage rice (Leaf Star) in the paddy field (B).
Figure 5.1B shows a prediction of changes of SOC in the soil of the paddy, located at 35°40′ N, 139°28′ E in the alluvial plain of the Tama River near the upland field. Both locations have almost the same climatic conditions. The soil at this location is Fluvic Hydragric Anthrosols; its dry density is 0.64 Mg m−3 and the clay content is 34.2%. The amount of compost application is 4.30 Mg-C ha−1 y−1. In this field, forage rice of “Leaf Star” is cultivated for producing bioethanol. For the cultivation of “Leaf Star”, input of the plant residue is 3.78 Mg-C ha−1 y−1 with dense planting and 2.30 Mg-C ha−1 y−1 with conventional planting. The cultivation of forage rice requires more plant residue to be plowed into the soil, and as a result SOC is predicted to increase to 92 Mg-C ha−1 for conventional planting and 106 Mg-C ha−1 for dense planting in 2050. Cultivation of the forage rice in high yield will contribute to alleviating the global warming problem through bioethanol production and by increasing soil carbon sequestration.
5.3 Soil Microorganisms
Akane Katsuta and Koki Toyota
Soil microbes are mainly composed of bacteria, fungi, protozoa, algae, archaea such as methanogens and halobacteria, and viruses. They play crucial roles in soil function, especially in nutrient cycling, and thus contribute to sustainable crop production. In agricultural systems, the contribution of synthetic nitrogen fertilizers to crop production is unequivocal. Surprisingly, the largest amount of nitrogen uptake by a crop is derived from the mineralization of soil organic matter in general. Soil microbes are essential to this mineralization process, and soils with higher nitrogen-supplying capacity are considered to have higher soil fertility. In this section, general aspects of soil microbes are presented by emphasizing the role of soil microbes involved in crop production. In the next section, microbial mediation of soil fertility is discussed.
5.3.1 Abundance and Biomass
In general, hundreds of millions to billions of bacteria and hundreds of thousands to millions of fungi exist in 1 g of soil, although the number of microorganisms differs depending on soil properties and environmental conditions (Table 5.14). The total amount of microbial biomass ranges from 0.1 to 1 mg g−1 of soil. Bacteria and fungi are the two predominant soil microbes in number and mass. The third most dominant category of microbes are protozoa consisting of ciliate, flagellate and ameba, and their numbers range from tens to hundreds of thousands per gram of soil, and their biomass varies from 1 to 10 μg g−1 of soil.
TABLE 5.14
Abundance and Biomass of the Major Soil Organisms
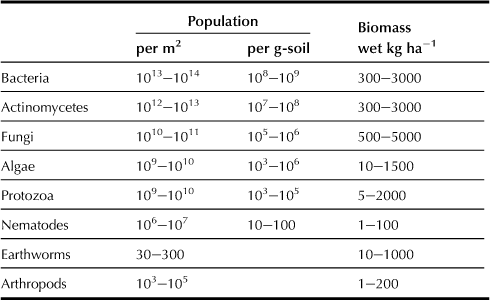
Data from Alexander (1977), Brady (1974), and Lynch (1983).
5.3.2 Habitats
Soil microbes live in the liquid and/or gas phases of soil and mostly by attaching themselves to soil particles. Microbes need to obtain energy and nutrients through their membranes in the presence of water, and thus they cannot grow without water. Therefore, pores filled with water or the surfaces of soil particles having water films are the primary microhabitats. Micropores with diameters of 3 μm or less, in which water is held by capillary force, are the major habitats for soil bacteria; macropores are habitats for fungi and protozoa.
Microbial number and activity are enhanced where organic matter such as compost and plant residues is abundant (see Box 5.2). The surrounds of crop residues and dead bodies of soil animals are the major sites colonized by abundant microbes. The rhizosphere, defined as the narrow zone of soil subject to the influence of living roots, is also a hot spot for microbes because organic matter such as the leakage or exudation from roots is plentiful.
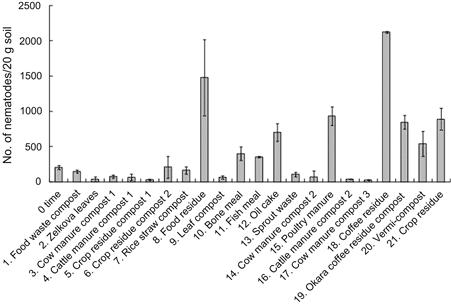
BOX 5.2
Effects of Organic Supplements on Nematode Populations in Soil
Organic materials have some characteristics that cannot be replaced by chemical fertilizers. One such characteristic is to enhance the growth, activity, and diversity of soil microorganisms. An example relating to the impact on the populations of nematodes, which play an important role in nutrient cycling in soil, is presented here.
Twenty-one types of organic material including compost, crop or food residue were added into samples of Andosols, which is a typical soil covering 50% of total upland fields in Japan, at rates ranging from 1.2 to 100 g kg−1 soil on a fresh basis and 0.9–45 g kg−1 soil on a dry basis. After incubation for 3 weeks at 25°C, nematodes were extracted from the soils by using the Baermann funnel method to be counted under a microscope.
As shown in Figure 5.3, the nematode population varies greatly depending on the type of organic material applied. The nematode population increases in soils supplemented with nine materials such as food residue (No. 8; application rate 14 g (dry) kg−1 soil) and coffee residue (No. 18; 11 g (dry) kg−1 soil). Most nematodes in soil are either bacterial or fungal feeders, suggesting that the increasing nematode population reflects higher biomass of bacteria and fungi. Because there is no significant correlation observed between the organic matter application rates and the increase in nematode populations, the degree of increase in nematode populations is considered to vary depending on the quality rather than quality of organic materials added.
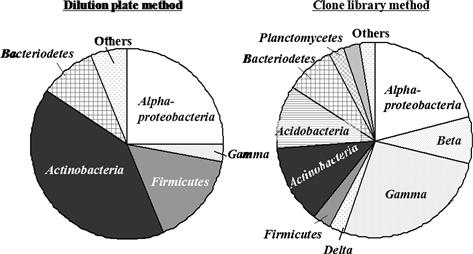
FIGURE 5.2 Molecular taxonomy of the major soil bacteria evaluated by the dilution plate and molecular methods.
Thirty to forty isolates or clones were analyzed. (Toyota and Kuninaga, 2006; Katayama, Yamakawa and Toyota, unpublished data)
Since nematodes enhance the nitrogen-supplying capacity of soil through the mineralization of organic matter, the organic materials that enhance the nematode population are considered to be beneficial to soil fertility.
5.3.3 Taxonomy
With advances in molecular taxonomy, microorganisms are now divided into three domains, Bacteria, Archaea and Eucarya, according to the sequences of ribosomal RNA. Approximately 800 genera and 5000 species of bacteria have been described, and they are classified into more than 19 divisions or groups.
A bacterial group that used to be called Gram-negative bacteria mainly corresponds to Proteobacteria and Bacteroides/Chlorobi. Proteobacteria consist of five subdivisions, α, β, γ, δ, and ε. Symbiotic nitrogen-fixing bacteria Rhizobium and free-living nitrogen fixing bacteria Azospirillum are included in α-proteobacteria. Burkholderia, Ralstonia, and nitrifying bacteria (Nitrosomonas) are members of β-proteobacteria. Pseudomonas and Enterobacteriaceae such as Escherichia coli and Salmonera spp. are γ-proteobacteria, and sulfate-reducing bacteria (Desulfovibrio) are δ-proteobacteria. Cytophagales, as well as Flavobacterium and Sphingobacterium, are included in Bacteroides/Chlorobi. Bacteria that used to be called Gram-positive bacteria are divided into two divisions: Actinobacteria and Firmicutes; Actinobacteria contain filamentous bacteria such as Streptomyces and coryneform bacteria such as Arthrobacter, whereas Firmicutes include spore-forming bacteria such as Bacillus and Clostridium.
It is well known that the classical dilution plate method depicts only a part of soil bacteria. Recent advances in molecular techniques have revealed the presence of quite diverse bacteria, which are rarely deposited in culture collections. Strains belonging to Arthrobacter, Streptomyces, and Bacillus used to be considered as the major soil bacteria based on the dilution plate method, but it appears that they occupy a tiny portion of the total bacteria based on the molecular method (Table 5.15). A comparison between the dilution plate and molecular methods (Figure 5.2) shows that Actinobacteria, Firmicutes, and α-Proteobacteria are dominant in the dilution plate method whereas more diverse bacterial groups are observed in the clone library method.
TABLE 5.15
Major Soil Bacteria Based on the Dilution Plate and Molecular Methods
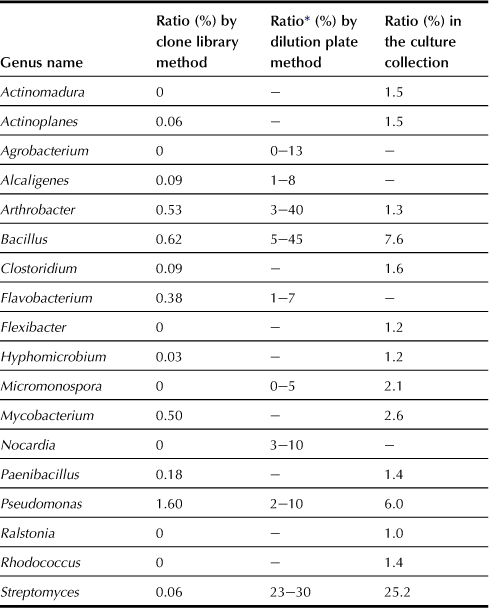
∗Calculated based on Alexander (1977).
Data from Janssen (2006).
Eighty thousand species of fungi have been described, and they are divided into the four classes Zygomycota, Ascomycotina, Basidiomycetes, and Chytridiomycetes. Mycorrhizal fungi, Mucor and Rhizopus, are classified as Zygomycota and ectomycorrhizal fungi as Basidiomycetes. Soil-borne plant pathogens belonging to imperfect fungi such as Fusarium and Verticillium are now classified as Ascomycotina. Plasmodiophora brassicae, clubroot fungi, which were previously classified as fungi but is now classified as Cercozoa, belong to a group of protists.
5.3.4 Microbial Functions
a Decomposition
The principal role of soil microbes is the decomposition of organic materials. Once incorporated into soil, all biodegradable organic materials are readily decomposed by soil microorganisms into carbon dioxide eventually, although at different rates. The largest source of organic materials is the residues of plant that generally contain 15–60% cellulose, 10–30% hemicellulose, 5–30% lignin, 2–15% protein, and about 10% saccharides, amino sugars, organic acids, amino acids and nucleic acids. Soil microbes have the capability to decompose a variety of organic materials. In general, microbes that degrade hemicelluloses or cellulose are less diversified, and their degradation rates are slower than microbes degrading simple sugars. Lignin is known to be more resistant to microbial decomposition than hemicelluloses and cellulose. While their degradation rates are different, microbes degrading these organic materials are ubiquitous in soil.
b Anaerobic Respiration
Although the degradation of organic materials by microorganisms is faster under aerobic conditions, degradation of organic materials will occur even under anaerobic conditions. In anaerobic respiration, nitrate, Mn4+, Fe3+, sulfate, acetate, and carbon dioxide are used as electron acceptors instead of oxygen. The degradation of organic materials is readily carried out under anaerobic conditions such as in a flooded paddy soil, if some of the electron acceptors are available. The anaerobic respiration is performed by diverse microbes. Nitrate respiration in which nitrate or nitrite is reduced to nitrous oxide or molecular nitrogen is performed by bacteria belonging to diverse genera, including α-, β- and γ-Proteobacteria and Firmicutes. Furthermore, some fungi, including the most typical genus Fusarium, obtain energy for their growth under anaerobic conditions by reducing nitrite to nitrous oxide.
Strictly anaerobic bacteria live even in upland soil, suggesting that anaerobic microsites are localized in soil, e.g. within macro-aggregates.
c Nitrification
Autotrophic bacteria that gain energy by the oxidation of mineral materials and carbon from CO2 in the air exist in soil. A typical example is ammonia-oxidizing bacteria that obtain energy by oxidizing ammonia to nitrite. Nitrite-oxidizing bacteria are also autotrophs that obtain energy by oxidizing nitrite to nitrate. Because nitrification is an energy-generating process, the reaction proceeds readily in soil if appropriate substrates are available. Nitrogen fertilizer applied in the form of urea or ammonium sulfate is transformed into nitrate through nitrification in soil. Because nitrifying bacteria are strictly aerobic, their growth is enhanced in upland soil. In general, most nitrogen applied as fertilizer is transformed into nitrate within weeks in agricultural soils. Nitrate is easily leached out of the soil layers along with water movement. The leached nitrate that is a loss of the applied nitrogen fertilizer can lead to nitrate pollution of groundwater and surface water bodies such as lakes and rivers. Thus, the nitrification process is not always beneficial to agriculture. For this reason, nitrification inhibitors have been developed in order to mitigate the loss of nitrate in agricultural soils. Furthermore, it is known that a small but significant portion of nitrogen fertilizer applied to agricultural soil is transformed into nitrous oxide, a potent greenhouse gas, through the nitrification processes.
Paddy field soil is generally under anaerobic conditions but there are aerobic pockets in the soil, e.g. the oxidation layer (a few mm) at the upper part of the plow layer and the rhizosphere of rice plants, where aerobic nitrification occurs.
d Nitrogen Fixation
The most beneficial microorganisms in agriculture are nitrogen-fixing bacteria, including prokaryotes, bacteria, and archaea of diverse groups. Some cyanobacteria have functions of both photosynthesis and nitrogen fixation, and therefore are expected to play a role in the restoration of infertile soil. Nitrogen-fixing bacteria are extremely diverse in terms not only of taxonomy but also physiology and ecology. Some nitrogen-fixing bacteria, such as Rhizobium and Bradyrhizobium, are symbiotic to leguminous plants, whereas other diverse bacteria have been reported as free-living nitrogen fixers. Filamentous bacteria such as Frankia are known to live in symbiosis with non-leguminous plants such as alder (Alnus sp.) and Comptonia sp. Among free-living nitrogen fixers, some are plant associated and others not. Nitrogen-fixing bacteria are also known in archaea, such as methanogens and Halobacterium. Some nitrogen fixers are strict aerobes, whereas some others are strict anaerobes such as Clostridium, or photosynthetic and facultative such as Enterobacter and Klebisiella. In any type of nitrogen-fixing bacteria, the major nitrogen-fixing enzyme nitrogenase functions only in the absence of oxygen and therefore anaerobic bacteria must have some mechanisms to avoid oxygen near the cells.
The total amount of nitrogen fixed biologically in terrestrial regions of 139 million ton N per year exceeds that fixed artificially (100 million ton N per year) (Brady and Weil, 2008). A plant’s nitrogen-fixing potential differs depending on the type of land use (Table 5.16), with the highest in leguminous crops and relatively high nitrogen fixation in paddy fields. Cyanobacteria and photosynthetic bacteria play important roles in the nitrogen fixation of paddy soil. Many studies have revealed the presence of endophytic and/or plant-associated nitrogen-fixing bacteria, such as Herbaspirillum, Azoarcus, and Burkholderia, in non-leguminous plants.
TABLE 5.16
Nitrogen-Fixing Potential under Different Land Uses
| kg-N ha−1 y−1 | |
| Paddy rice | 20 |
| Legume | 140 |
| Non-legume | 8 |
| Pasture | 15 |
| Forest | 10 |
| Other vegetation | 20 |
Data from Brady and Weil (2002) and Nishio (2005).
Nitrogen-fixing activity is affected by different parameters. Firstly, inorganic nitrogen suppresses nitrogen-fixing activity significantly. Therefore, the application rate of nitrogen fertilizer is generally low in leguminous crops. A future trend in research is the stimulation of biological nitrogen fixation in agricultural soils as an alternative to applying synthetic nitrogen fertilizers.
e Plant Growth-Promoting Microorganisms
Fluorescent Pseudomonas is well known to suppress soil-borne plant diseases, and such types of bacteria are called plant growth-promoting rhizobacteria (PGPR). In addition to bacteria, some fungi like Phoma and Trichoderma also promote plant growth; they are called plant growth-promoting fungi (PGPF). The term PGPR is usually used for antagonists that colonize plant roots and suppress pathogens; however, PGPR also includes microorganisms that enhance plant growth by producing plant hormones such as auxin and supplying nutrients such as nitrogen or phosphorus (Table 5.17).
TABLE 5.17
Free-Living Nitrogen-Fixing Bacteria Isolated from Plants
| Plants | Taxonomy |
| Sugar cane (Saccharum spp.) | Azospirillum sp., Azotobacter sp., Beijerinckia indica, Beijerinckia fluminensis, Derxia sp., Enterobacteriaceae, Klebsiella sp., Paenibacillus azotofixans, Vibrio sp. |
| Maize (Zea mays) | Azospirillum lipoferum, Azotobacter vinelandii, P. azotofixans, K. terrigena, Enterobacter sp., E. cloacae, Bacillus circulans, Burkholderia sp., B. vietnamiensis |
| Wheat (Triticum spp.) | A. lipoferum, Azotobacter sp., Bacillus sp., E. cloacae, E. agglomerans, K. oxytoca, K. pnuemoniae |
| Rice (Oryza sativa) | A. lipoferum, Azotobacter sp., Clostridium sp., E. cloacae, E. agglomerans, K. oxytoca, K. pnuemoniae, P. azotofixans, Pseudomonas sp., H. seropedicae, Burkholderia brasilensis, Azospirillum irakense |
| Paspalum notatum | Acetobacter paspali, A. halopareferans, Enterobacter agglomerans |
| Kallar grass (Leptochloa fusca) | A. halopareferans, E. cloacae, E. agglomerans, Azoarcus sp. |
| Spartina | A. lipoferum, H. frisingense, A. brasilense, Gluoconacetobacter diazotrophicus, H. seropedicae, A. vinelandii, Azotobacter chroococcum, P. stutzeri |
| Banana (Musa spp.) | K. pnuemoniae, E. cloacae, H. seropedicae, H. rubrisubulbicans |
| Sweet potato | Pantoea agglomerans, Acetobacter diazotrophicus |
| Oak | P. putida, P. fluorescence, Xanthomonas oryzae, B. megaterium |
| Cereals | H. seropedicae, A. lipoferum, Azospirillum amazonense, Azospirillum irakense, A. brasilense, B. brasilense |
| Sugar cane | H. seropedicae, B. tropicalis, G. diazotrophicus, G. azotocaptans, A. brasilense, A. lipoferum, A. amazonense, B. brasilensis, H. seropedicae, Pantoea sp. |
| Forage grasses | H. seropedicae, A. brasilense, A. lipoferum, B. brasilensis |
| Sago palm (Metroxylon sagu) | K. pnuemoniae, K. oxytoca, E. cloacae, P. agglomerans, B. megaterium |
| Coffee | Gluconacetobacter johannae, G. azotocaptans |
| Mangrove | A. chroococum, A. vinelandii, A. beijerinckii |
| Pineapple | Acetobacter diazotophicus, H. rubrisubulbicans |
| Dune grass | B. tropicalis, P. agglomerans, Sternotrophomonas maltophilia |
| Pine | B. gladioli, B. glathei, Bacillus sp. |
| Miscanthus spp. | A. doebereinerae, A. lipoferum, H. frisingense |
5.3.5 Soil Sickness due to Continuous Cropping
In general, crop yield decreases after continuous cropping. This is because some pathogenic soil microbes or nematodes accumulate in the soil and cause diseases in plants. Sugar cane, sugar beet, maize or corn, wheat, etc. have been evaluated as biofuel-producing plants, but many types of soil-borne disease are reported in these crops that may pose a threat to future crops. Crop rotation has been recommended and practiced to avoid such losses. Soil disinfection with synthetic chemicals or solar energy is also regularly used where crop rotation is difficult to implement. Such disinfection practice is feasible in relatively smaller land areas for growing vegetables but is not practical in large fields for growing cereals and energy crops. Most soil-borne plant pathogens are aerobic and have difficulty surviving in paddy fields, as seen by the continuous cropping of paddy rice for more than 1000 years. Hence, rice should be focused on as a sustainable energy crop in future studies.
5.4 Microbially Mediated Soil Fertility
Kozue Sawada and Koki Toyota
5.4.1 Productivity and Environmental Impacts
Soil fertility has been considered as the characteristics of soils that support high crop yields in order to enhance crop production. With recent concerns about the environment, however, the developments of agriculture with less damage to the environment is desirable. Therefore, improving soil fertility should consider not only enhancing crop yields but also maintaining the balance between crop nutrient requirements and nutrient supplies because either excessive or deficient nutrients have major adverse impacts on the productivity and the environment.
Soil microbes govern the numerous reactions of nutrient cycles in soils. Transformations between organic and inorganic nutrients by microbes (i.e. biological mineralization and immobilization) contribute significantly to supplying nutrients to crops, especially nitrogen (N) and sulfur, and to some extent phosphorus. The availability of potassium, which is mostly fixed in minerals such as micas and feldspars, is not affected by microbial activities. In the agricultural field, nitrogen is one of the major limiting elements for crop yields. In addition, excessive nitrogen causes nitrate leaching, ammonia volatilization, and nitrous oxide emissions that often lead to adverse environmental effects, including air and water pollution, soil acidification, ozone destruction and global warming, as well as human health problems. This section focuses on the biological mineralization and immobilization of nitrogen, which contribute significantly to soil fertility in agricultural ecosystems.
5.4.2 Nitrogen Cycles Through Microbial Biomass in Soils
Major processes in the nitrogen cycle through microbial biomass in soil are illustrated in Figure 5.4. In agricultural ecosystems, both organic and inorganic nitrogen are supplied through the application of organic materials, such as crop residues and manure, and mineral fertilizer (Figure 5.4a). The organic nitrogen, whether freshly added or already existing in soil, is continuously decomposed by soil microbes via two routes: (1) mineralization of organic nitrogen to inorganic forms (Figure 5.4b), and (2) immobilization of inorganic nitrogen to organic forms through microbial assimilations (Figure 5.4c). Although the organic nitrogen forms a large pool of nitrogen in soil, only a small fraction of soil organic nitrogen, i.e. easily decomposable nitrogen, can be decomposed biologically during the crop growing period. Recent studies show that microbes can assimilate significant amounts of organic molecules (e.g. amino acids) directly in their tissues (Figure 5.4d) (Geisseler et al., 2010). Turnover of microbial biomass nitrogen releases inorganic nitrogen (mineralization (Figure 5.4b)) and organic nitrogen (humification (Figure 5.4e)). Uptake of inorganic nitrogen and some organic nitrogen by plants occurs in the vegetated area (Figure 5.4f), and the excess inorganic nitrogen is lost from soil to groundwater (nitrate leaching), to surface runoff, or to the atmosphere as N2, N2O (dinitrification), and NH3 (volatilization) (Figure 5.4g). Soil microbes play important roles in regulating the nitrogen cycles, especially the highly labile nitrogen pool.
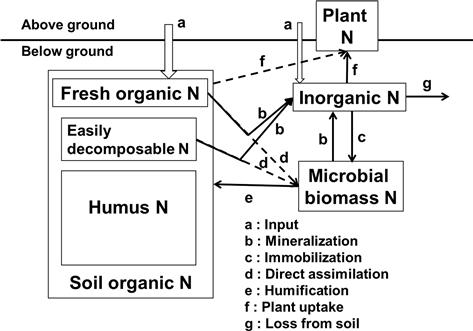
The nitrogen cycles in soils and ecosystems are more complicated than those shown in Figure 5.4. For example, nitrification of ammonium to nitrate occurs continuously in the inorganic nitrogen pool. Ammonium in soil is strongly and almost irreversibly fixed by several 2:1-type clay minerals such as vermiculites, fine-grained micas and some smectites in soils. The conversion of atmospheric N2 into soil inorganic nitrogen (nitrogen fixation) or the atmospheric input of inorganic nitrogen to soil also occur. In the soil environment, nitrification, denitrification, and nitrogen fixation are carried out respectively by some specific microbial groups (see reviews by Hayatsu et al., 2008). The decomposer system in soil is a diverse food web that involves numerous types of organisms; the most important groups are bacteria, archaea, fungi, and protozoa, collectively known as soil microbes, which account for about 80% of the decomposition activities (Brady and Weil, 2008). Soil fauna (e.g. nematodes, mites, earthworms) act as regulators of decomposition through feeding on microbes, and also alter the soil’s physical environment through movement and burrowing of the soil.
5.4.3 Nitrogen Cycle Through Microbial Biomass in Japanese Agricultural Soils
a Nitrogen-Supplying Capacity in Japanese Agricultural Soils
Mishima et al. (2006) evaluated recent trends in nitrogen application and crop production for Japanese agricultural land. Chemical nitrogen fertilizer application peaked in 1985 (near 130 kg-N ha−1) and then decreased (less than 100 kg N ha−1) whereas the total amount of livestock excreta applied to agricultural land peaked in 1990 to near 110 kg-N ha−1 and then decreased to less than 80 kg-N ha−1. The nitrogen uptake by crop plants peaked in 1985 to about 65 kg-N ha−1 and then decreased to about 59 kg-N ha−1. Total nitrogen surplus is the difference between the sum of nitrogen inputs to agricultural land including applications of chemical fertilizer, livestock excreta as manure as well as irrigation and N2 fixation, and the sum of nitrogen outputs in crop yields from agricultural land such as the removal of by-products and natural denitrification. The nitrogen surplus peaked in 1985 at about 150 kg-N ha−1 and then declined to less than 100 kg-N ha−1 (Figure 5.5).
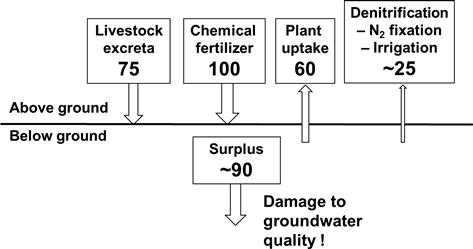
FIGURE 5.5 Average annual input, output and surplus of nitrogen in Japanese agricultural soils in 2002 (units: kg-N ha−1).
The mean content of total nitrogen in Japanese agricultural soils is ∼2600 mg-N kg−1, calculated based on 2272 sets of data collected from Japanese agricultural fields by the Soil Conservation Project (Oda and Miwa, 1987). Japanese agricultural lands vary widely in soil types, reflecting mainly the differences in parent materials, weathering degree and topography, as well as land uses, e.g. paddy, upland, pasture, and orchard. In general, the content of total nitrogen and distribution pattern of various nitrogen fractions are significantly affected by soil types and land use. Sano et al. (2004) grouped soil nitrogen into three fractions: inorganic, potentially mineralizable, and stable organic. The potentially mineralizable nitrogen is considered as the estimated net accumulation of inorganic nitrogen after long-term aerobic incubation of the soil sample for 22 weeks or until the net inorganic nitrogen accumulation reaches a plateau. This nitrogen pool that originates from the easily decomposable nitrogen and the microbial biomass nitrogen pools is shown in Figure 5.4. The sum of inorganic and potentially mineralizable nitrogen is thought to represent the amount of nitrogen available for crop uptake during the crop growing period. This nitrogen available for plant growth amounts to 196 mg kg−1 (295 kg-N ha−1) or 7.6% of total nitrogen assuming that the plow layer depth is 15 cm and the bulk density is 1.0 Mg m−3. The potentially mineralizable nitrogen is higher in paddy soils (200 mg-N kg−1) than in upland soils (108 mg-N kg−1), probably because relatively abundant fresh organic matter is added through the application of rice straw, the natural depositions by algae, and N2 fixation in paddy soils. Another possibility is that the organic matter in paddy soils is less degraded than that in uplands under anaerobic conditions. Stable organic nitrogen, which is unavailable for plant growth, is higher in volcanic soils than in non-volcanic soils because the presence of Al–humus complexes in volcanic soils gives humus strong stability. Volcanic soils cover more than 50% of the total upland fields in Japan, hence, Japan has higher total nitrogen in agricultural soil (∼2600 mg-N kg−1) than the average value in the world (∼1600 mg kg−1) (Batjes, 1996). However, the high total nitrogen in Japanese agricultural soil does not necessarily imply that the soil has high nitrogen-supplying capacity for crop production, although the nitrogen-supplying capacity in various soils is closely related to the total nitrogen content in the soil.
b Microbial Biomass Nitrogen in Japanese Agricultural Soils
Soil microbial biomass nitrogen is usually determined by using the chloroform fumigation extraction method (Brookes et al., 1985). This method is based on the extraction of cell components immediately after chloroform fumigation. Although microbial biomass nitrogen occupies only 1–6% of the total nitrogen in soils, the biomass nitrogen pool has the potential to supply available nitrogen for crop growth because of rapid turnover rate of the biomass nitrogen. The microbial biomass nitrogen is reported to be highly correlated with the quantity of available nitrogen for crops to uptake in Japanese upland soils (e.g. Sakamoto and Oba, 1993). Inubushi and Watanabe (1986) also observed that microbial biomass nitrogen is highly correlated with nitrogen uptake by rice under conditions of nitrogen deficiency in flooded paddy fields, although biological processes in paddy soils are complicated (see review by Inubushi and Acquaye, 2004). Nira (2000) estimated both turnover rates of microbial biomass nitrogen and amounts of mineralized nitrogen for 1 year by applying 15N-labeled crop residues to different types of upland soils. His results show that the flux of nitrogen through microbial biomass enhances the amounts of mineralized nitrogen by 39–138% (average 67%). Sakamoto et al. (1997) observed that the flux of nitrogen through microbial biomass is a major source of nitrogen uptake for upland rice in the vegetative growth stage (until 6 weeks). These results support that managing microbial biomass nitrogen is essential for the maintenance and improvement of soil fertility.
Guan et al. (1997) observed that fractions of microbial biomass nitrogen to total nitrogen in nine volcanic soils of 0.76% average are about one-fourth lower than those in seven non-volcanic soils (3.2% average) in Japan. This result further supports that total organic nitrogen is not a good indicator of the nitrogen-supplying capacity to crop uptake, especially in volcanic soils.
It is known that long-term applications of organic materials (e.g. crop residue or manure, etc.) to soils usually increase the total soil organic nitrogen, including microbial biomass nitrogen (e.g. Sakamoto and Oba, 1991), and improve the soil fertility profoundly. The present status of long-term field studies using chemical fertilizers and organic materials conducted at national and prefectural agricultural research stations in Japan is summarized by Kanamori (2000). Shirato et al. (2004) used a model approach and showed that soil organic matter can be more easily accumulated after long-term application of organic materials in Japanese volcanic soils than in non-volcanic soils due to the presence of active aluminum and iron in the latter. However, the information on the effect of long-term application of organic materials on microbial biomass nitrogen is relatively scarce, especially in volcanic soils (Sakamoto and Oba, 1991). This is because microbial biomass nitrogen must be measured using soil samples freshly collected from the field, whereas soils stored in air-dried conditions is acceptable for measuring total nitrogen.
5.4.4 Management of Microbial Biomass Nitrogen During a Crop Growth Period
a The Effect of Drying–Rewetting on Microbial Biomass Nitrogen
(i) Basic Principle
Surface soils are sometimes subjected to rapid rewetting by rainfall following dry conditions, and the rewetting of dried soil is recognized to cause a significant and sudden increase in net nitrogen mineralization (Birch, 1958) through the enhanced availability of both microbial biomass and non-biomass soil organic nitrogen. Mineralized nitrogen is derived from lyses of microbial cells (Bottner, 1985) and/or release of microbial osmoregulatory compounds responding to the water potential shock (Halverson et al., 2000), as well as through the physical release of occluded soil organic matter from soil aggregates (Denef et al., 2001). Results of case studies conducted in Japanese paddy ecosystems and in dry tropical ecosystems on the turnover of microbial biomass nitrogen under drying–rewetting cycles are summarized in the following paragraphs.
(ii) Japanese Paddy Ecosystems
The amount of nitrogen mineralization after flooding following an air-drying period increases drastically in Japanese paddy fields in a phenomenon known as the “drying effect”. Mineralized nitrogen associated with the drying effect in Japanese paddy fields is estimated to be 50–100 kg-N ha−1, which corresponds approximately to the amount of chemical nitrogen fertilizer applied to paddy soils annually. Toriyama et al. (1988) evaluated the effect of soil water contents before flooding on the measured mineralized nitrogen after flooding, and found that the mineralized nitrogen increases linearly with decreasing soil water contents before flooding when the soil has been dried below pF 4. Ando et al. (1995) also observed that the amount of nitrogen taken up by rice plants increases with decreasing soil water contents before flooding. These results prove that the soil water content before flooding affects significantly the amount of nitrogen mineralized caused by the drying effect. According to Marumoto et al. (1997), the contribution of microbial biomass nitrogen to total nitrogen mineralized due to the drying effect is 20–48% in Japanese paddy soil. This result clearly shows that microbial biomass nitrogen in Japanese paddy soil acts as an available nitrogen pool for rice crops. Therefore, the management of microbial biomass nitrogen is essential for maintaining and improving rice production. Practicing long-term application of organic materials is usually recommended for enhancing the soil biomass nitrogen, especially for soils that have been subject to sufficient drying before flooding.
(iii) Dry Tropical Ecosystems
The availability of nitrogen limits crop production in dry tropical cropland with nutrient-poor soils. Soil microbes in this region act as an important nitrogen pool for crop nitrogen uptake. Singh et al. (1989) observed in dry tropical natural ecosystems in India that microbial biomass nitrogen is accumulated, probably due to accumulation of intracellular solutes during the dry seasons and the later depletion of these solutes during the early rainy seasons. Sugihara et al. (2010a) also observed that microbial biomass nitrogen in dry tropical cropland in Tanzania tends to decrease during rainy seasons but will increase and remain at high levels during dry seasons. These results suggest that the mineralization of biomass nitrogen stimulates plant growth during rainy seasons in nutrient-poor dry tropical ecosystems. However, if crops are unable to uptake the nitrogen mineralized during early rainy season because of their slow growth, the mineralized nitrogen would be potentially lost from soil through leaching.
b Effect of Application of Organic Materials on Microbial Biomass Nitrogen
(i) Basic Principle
Application of organic materials (e.g. crop residue or manure, etc.) to soils immediately and significantly alters several fractions in nitrogen pools and enhances the turnover rates by increasing the soil microbial activities (Jensen and Magid, 2002). The rates of gross mineralization and immobilization differ depending on the type of organic materials applied to soil. When no organic material is applied to soil, gross mineralization is usually slightly higher than gross immobilization, thus resulting in net mineralization (Figure 5.6A). When organic materials with low C/N ratio, e.g. animal manure, are applied to soil, the increased biological activity causes a greater increase of gross mineralization than gross immobilization, although gross immobilization increases. Therefore, the net mineralization of nitrogen is usually enhanced (Figure 5.6B). In contrast, when organic materials with high C/N ratio, e.g. crop straw, are applied to soil, the enhanced biological activities result in a greater increase of gross immobilization than gross mineralization. Therefore, the net immobilization of nitrogen (Figure 5.6C) causes a shortage of nitrogen for crops immediately after the applications of organic materials. This phenomenon is called “nitrogen starvation”.
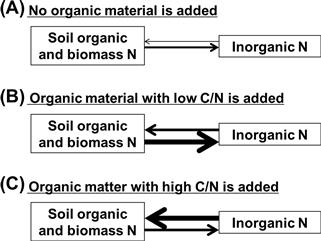
FIGURE 5.6 The processes of gross mineralization and gross immobilization of nitrogen when (a) no organic material, (b) organic material with low C/N, and (c) organic material with high C/N are added. The thickness of the arrow signifies the magnitude of the flux rates.
Nitrogen turnover is regulated by two microbial parameters, i.e. microbial growth efficiency and C/N ratio of newly formed biomass, in addition to the C/N ratio of organic materials applied. The microbial growth efficiency is defined as the ratio of substrate carbon and the carbon that is incorporated into microbial biomass. Substrate that is not incorporated is respired as CO2. Substrate quality, defined as the ease with which a substrate is decomposed, also affects the temporal patterns of gross mineralization and immobilization of nitrogen.
(ii) Nitrogen Cycle Through Microbial Biomass after Application of Organic Materials
Katoh et al. (2009) evaluated the effects of combined applications of 15N-labeled ammonium sulfate and cattle, swine and poultry manures (with C/N ratios of 6–26) on nitrogen cycles under upland soil conditions. They observed that 15N-NH4 derived from ammonium sulfate (5–60 mg-N kg−1 soil) is immobilized by microbes 7 days after the application of manure although the manure contained high concentrations of nitrogen. They also observed that the quantity of immobilized 15N is significantly correlated with the amounts of easily decomposable carbon. This suggests that the quality of substrate carbon is an important factor to influence the gross immobilization of nitrogen immediately after the application of organic materials.
Herai et al. (2006) measured microbial biomass nitrogen, NO3-N leaching and nitrogen uptake by corn over 4 months after application of sawdust compost (with C/N ratio of ∼30) to a sandy soil in Japan. Their results clearly showed that the assimilation of nitrogen to microbial biomass decreases NO3-N leaching without negative impact on nitrogen uptake by corn. This method is effective in reducing NO3-N leaching.
Sugihara et al. (2010b) observed that a significant amount of inorganic nitrogen (∼50 kg-N ha−1) is lost from the surface soil through leaching during early rainy seasons, and that inorganic nitrogen remains low thereafter (∼20 kg-N ha−1) in dry tropical cropland in Tanzania. Therefore, Sugihara et al. (2012) evaluated the effect of the application of plant residue (with C/N ratio of ∼70) on nitrogen leaching and crop productivity. They observed that microbial biomass nitrogen clearly increases (14.6–29.6 kg-N ha−1) with the application of plant residue during the early crop growth period, and that potentially leachable nitrogen is also immobilized. They also reported that the crop nitrogen uptake is improved by applying the plant residue with the conclusion that the re-mineralization of immobilized nitrogen stimulates crop growth during the later period. Therefore, plant residue application is a promising option to improve crop production and reduce the leaching of nutrients.
5.4.5 Future Prospects
In developing countries, especially in low-input traditional systems, nitrogen availability limits crop production because of low soil fertility and the inability of farmers to afford chemical fertilizers. In these regions, soil microbes act as an important nitrogen pool for crop nitrogen uptake, and therefore the management of microbial biomass nitrogen has the potential to improve crop production (Sugihara et al., 2012). However, to date, little quantitative information concerning the effect of the management of microbial biomass nitrogen on crop production, especially the flux of nitrogen through microbial biomass, is available in literature. Therefore, further research needs to be initiated to carry out quantitative analyses on soil nitrogen, such as with the 15N-labeled nitrogen.
In contrast, in developed countries such as Japan, intensive agricultural practice that has already increased crop production causes severe environmental problems. In Japanese agricultural ecosystems, surplus nitrogen adversely affects environment quality (Figure 5.5). To reduce the nitrogen surplus effectively, various types of organic materials need to be applied as an alternative to chemical fertilizers. When organic materials are applied to agricultural fields, synchronizing nitrogen supply with crop demand is needed in order to maintain crop production while minimizing the nitrogen surplus. With recent concerns about environmental quality, further studies are needed to understand the biological mineralization and immobilization over different time scales, even though high agricultural productivity has already been achieved in Japan. Additional studies should be initiated to address solving problems for volcanic soils and paddy soils that are unique to Japan.
References
1. Alexander M. Introduction to soil microbiology. Wiley 1977.
2. Ando H, Marumoto T, Wada G, Nakamura T. Mineralization of soil organic nitrogen and nitrogen absorption by rice (Oryza sativa) plant as affected by drying duration. Japanese Journal of Soil Science and Plant Nutrition. 1995;66:499–505 [in Japanese].
3. Batjes NH. Total carbon and nitrogen in the soils of the world. European Journal of Soil Science. 1996;47:151–163.
4. Birch H. The effect of soil drying on humus decomposition and nitrogen availability. Plant and Soil. 1958;10:9–31.
5. Bottner P. Response of microbial biomass to alternate moist and dry conditions in a soil incubated with 14C and 15N labelled plant material. Soil Biology and Biochemistry. 1985;17:329–337.
6. Brady NC. The nature and properties of soils. 8th ed. MacMillan 1974.
7. Brady NC, Weil RR. The nature and properties of soils. 13th ed. Prentice Hall 2002.
8. Brady NC, Weil RR. Organisms and ecology of the soil. In: The nature and properties of soils. 14th ed. Upper Saddle River, NJ: Prentice Hall; 2008;443–494.
9. Brookes PC, Landman A, Pruden G, Jenkinson DS. Chloroform fumigation and the release of soil nitrogen: A rapid direct extraction method to measure microbial biomass nitrogen in soil. Soil Biology and Biochemistry. 1985;17:837–842.
10. Coleman K, Jenkinson DS. RothC-26.3 – A model for the turnover of carbon in soil. In: Powlson DS, Smith P, Smith JU, eds. Evaluation of soil organic matter models: Using existing long-term datasets. Berlin: Springer; 1996;237–246.
11. Denef K, Six J, Bossuyt H, et al. Influence of dry–wet cycles on the interrelationship between aggregate, particulate organic matter, and microbial community dynamics. Soil Biology and Biochemistry. 2001;33:1599–1611.
12. Geisseler D, Horwath WR, Joergensen RG, Ludwig B. Pathways of nitrogen utilization by soil microorganisms – A review. Soil Biology and Biochemistry. 2010;42:2058–2067.
13. Guan G, Marumoto T, Shindo H, Nishiyama M. Relationship between the amount of microbial biomass and physicochemical properties of soil – Comparison between volcanic and non-volcanic ash soils. Japanese Journal of Soil Science and Plant Nutrition. 1997;68:614–621 [in Japanese].
14. Hakamata T, Hatano R, Kimura M, Takahashi M, Sakamoto K. Interaction between greenhouse gases and soil ecosystem: 1 Carbon dioxide and terrestrial ecosystem. Japanese Journal of Soil Science and Plant Nutrition. 2000;71:263–274 [in Japanese].
15. Halverson LJ, Jones TM, Firestone MK. Release of intracellular solutes by four soil bacteria exposed to dilution stress. Soil Science Society of America Journal. 2000;64:1630–1637.
16. Hamazaki T, Micosa AG. Land capability classification in Japan – Productive capability classification of land based on soil survey Collected papers on environmental planning/Division of Environmental Assessment. National Institute of Agro-Environmental Sciences. 1991;No. 7:1–20.
17. Hayatsu M, Tago K, Saito M. Various players in the nitrogen cycle: Diversity and functions of the microorganisms involved in nitrification and denitrification. Soil Science and Plant Nutrition. 2008;54:33–45.
18. Herai Y, Kouno K, Hashimoto M, Nagaoka T. Relationships between microbial biomass nitrogen, nitrate leaching and nitrogen uptake by corn in a compost and chemical fertilizer-amended regosol. Soil Science and Plant Nutrition. 2006;52:186–194.
19. Inubushi K, Acquaye S. Role of microbial biomass in biogeochemical processes in paddy soil environments. Soil Science and Plant Nutrition. 2004;50:793–805.
20. Inubushi K, Watanabe I. Dynamics of available nitrogen in paddy soils: II Mineralized N of chloroform-fumigated soil as a nutrient source for rice. Soil Science and Plant Nutrition. 1986;32:561–577.
21. IPCC. Climate change 2001: The scientific basis. Cambridge: Cambridge University Press; 2001.
22. Janssen PH. Identifying the dominant soil bacterial taxa in libraries of 16S rRNA and 16S rRNA genes. Applied and Environmental Microbiology. 2006;72:1719–1728.
23. Jenkinson DS, Rayner JH. The turnover of soil organic matter in some of the Rothamsted classical experiments. Soil Science. 1977;123:298–305.
24. Jensen LS, Magid J. Nutrient turnover in soil after the addition of organic matter. In: Jensen LS, ed. Plant nutrition, soil fertility, fertilizers and fertilization. 4th ed. 2002;15.1–15.20. Samfundslitteratur.
25. Kanamori T. Present state of long-term field experiments on successive application of chemical fertilizers and composts as organic matters in national and prefectural agricultural research stations. Japanese Journal of Soil Science and Plant Nutrition. 2000;71:286–293 [in Japanese].
26. Katoh M, Hayashi Y, Morikuni H. Effect of combined application with 15N-labeled ammonium sulfate and swine or poultry manure compost on mineralization of compost nitrogen. Japanese Journal of Soil Science and Plant Nutrition. 2009;80:152–156 [in Japanese].
27. Lynch JM. Soil biotechnology. 1986; Blackwell.
28. Marumoto T, Andoh H, Wada G. Air-drying treatment and mineralization of biomass nitrogen in paddy soils. Japanese Journal of Soil Science and Plant Nutrition. 1997;68:376–380 [in Japanese].
29. Mishima S, Taniguchi S, Komada M. Recent trends in nitrogen and phosphate use and balance on Japanese farmland. Soil Science and Plant Nutrition. 2006;52:556–563.
30. National Conference of Soil Conservation and Survey Project. Actual condition and improvement of cultivated soils in Japan, National Conference of Soil Conservation and Survey Project. 1979; Tokyo [in Japanese].
31. Nira R. Comparison between flux of nitrogen through microbial biomass and estimated amount of nitrogen mineralization by kinetic method in upland soil. Japanese Journal of Soil Science and Plant Nutrition. 2000;71:388–390 [in Japanese].
32. Nishio M. Agriculture and environmental pollution. Rural Culture Association of Japan 2005; [in Japanese].
33. Oda K, Miwa E. Compact data base for soil analysis data in Japan. Japanese Journal of Soil Science and Plant Nutrition. 1987;58:112–131 [in Japanese].
34. Sakamoto K, Oba Y. Relationship between the amount of organic material applied and soil biomass content. Soil Science and Plant Nutrition. 1991;37:387–397.
35. Sakamoto K, Oba Y. Relationship between available N and soil biomass in upland field soils. Japanese Journal of Soil Science and Plant Nutrition. 1993;64:42–48 [in Japanese].
36. Sakamoto K, Guan G, Yoshida T. The contribution of nitrogen through microbial biomass to plant nitrogen uptake in upland soils with different physicochemical properties. Japanese Journal of Soil Science and Plant Nutrition. 1997;68:402–408 [in Japanese].
37. Sano S, Yanai J, Kosaki T. Evaluation of soil nitrogen status in Japanese agricultural lands with reference to land use and soil types. Soil Science and Plant Nutrition. 2004;50:501–510.
38. Shirato Y, Yokozawa M. Applying the Rothamsted carbon model for long-term experiments on Japanese paddy soils and modifying it by simple turning of the decomposition rate. Soil Science and Plant Nutrition. 2005;51:405–415.
39. Shirato Y, Hakamata T, Taniyama I. Modified Rothamsted carbon model for Andosols and its validation: changing humus decomposition rate constant with pyrophosphate-extractable Al. Soil Science and Plant Nutrition. 2004;50:149–158.
40. Singh JS, Raghubanshi AS, Singh RS, Srivastava SC. Microbial biomass acts as a source of plant nutrients in dry tropical forest and savanna. Nature. 1989;338:499–500.
41. Soil Science Glossary Terms Committee. Glossary of soil science terms. Soil Science Society of America 2008.
42. Sugihara S, Funakawa S, Kilasara M, Kosaki T. Effect of land management and soil texture on seasonal variations in soil microbial biomass in dry tropical agroecosystems in Tanzania. Applied Soil Ecology. 2010a;44:80–88.
43. Sugihara S, Funakawa S, Kilasara M, Kosaki T. Dynamics of microbial biomass nitrogen in relation to plant nitrogen uptake during the crop growth period in a dry tropical cropland in Tanzania. Soil Science and Plant Nutrition. 2010b;56:105–114.
44. Sugihara S, Funakawa S, Kilasara M, Kosaki T. Effect of land management on soil microbial N supply to crop N uptake in a dry tropical cropland in Tanzania. Agriculture Ecosystems and Environment. 2012;146:209–219.
45. Toriyama K, Sekiya S, Miyamori Y. Quantification of effect of air-drying of paddy soil before submergence on amount of nitrogen mineralization. Japanese Journal of Soil Science and Plant Nutrition. 1988;59:531–537 [in Japanese].
46. Toyota K, Kuninaga S. Comparison of soil microbial community between soils amended with or without farmyard manure. Applied Soil Ecology. 2006;33:39–48.