
Energy Storage for Mitigating the Variability of Renewable Electricity Sources
Marc Beaudin; Hamidreza Zareipour; Anthony Schellenberg; William Rosehart Department of Electrical and Computer Engineering, University of Calgary, 2500 University Drive NW, Calgary, Alberta, Canada T2N 1N4
Abstract
Wind and solar power generation is growing quickly around the world, mainly to mitigate some of the negative environmental impacts of the electricity sector. However, the variability of these renewable sources of electricity poses technical and economical challenges when integrated on a large scale. Energy storage is being widely regarded as one of the potential solutions to deal with the variations of variable renewable electricity sources (VRES). This chapter presents an review of the state of technology, installations and some challenges of electrical energy storage (EES) systems. It particularly focuses on the applicability, advantages and disadvantages of various EES technologies for large-scale VRES integration. This chapter indicates that each challenge imposed by VRES requires a dierent set of EES characteristics to address the issue, and that there is no single EES technology that consistently outperforms the others in various applications. This chapter also discusses external factors, such as mineral availability and geographic limitations, that may aect the success of the widespread implementation of EES technologies.
Acknowledgments
This work was partially supported by NSERC Canada and the Institute for Sustainable Energy, Environment and Economy (ISEEE).
1 Introduction
This chapter provides a survey of applying electric energy storage (EES) for facilitating the large-scale integration of variable renewable electricity sources (VRES), such as wind and solar power, into electric power systems. Large-scale integration of VRES introduces significant uncertainty into operation and planning of electric power systems. Electric energy storage is considered a tool for mitigating the impacts of VRES uncertainty [1] and [2].
In general, several criteria are analyzed when considering and choosing EES technologies for a specific application [3–5]. Those criteria include lifetime, life cycle, power and energy, self-discharge rates, environmental impact, cycle efficiency, capital cost, storage duration, and technical maturity. Based on these criteria, the appropriateness of EES for various applications has been evaluated in the literature, such as, for flexible alternating current transmission systems, small-medium-large-scale applications, system efficiency, emissions control, peak shaving, and deferring facility investments in peaking generators [3–8]. A limited amount of the reported research focuses on the necessary characteristics of EES specifically for VRES applications [4–6]. Nevertheless, other energy-storage literature can be applied for this purpose [8–11]. However, these references can either have a limited scope of EES or be outdated [4,9], and [10]. For example, [4,6], and [10] do not elaborate on battery types, and [4,8,11] are limited to bulk EES only.
In the present chapter, the previous literature is extended by providing an updated review of the state of technology and installations of a broad range of EES technologies. The main focus is on applications and appropriateness of each EES technology for mitigating the variability of renewable electricity generation sources. This chapter also includes discussions on important criteria for understanding the potential future of EES technologies, considering the impact of distributed generation, maturity and timing, and world metal resources on EES penetration for VRES applications.
The remainder of this chapter is organized as follows: Section 2 provides an overview of variable renewable electricity sources. Section 3 presents the current state of EES systems, which includes information on current worldwide installations, cost of the technology, and current applications. Section 4 discusses the appropriateness and competitiveness of EES for VRES applications. Finally, Section 5 provides a summary of the chapter.
2 An Overview of Variable Renewable Electricity Sources
With growing concerns about the environmental impacts of the electricity sector, there has been increasing interest to invest in wind and solar power. The 121 GW of global wind-installed capacity in 2008 produced 260 TWh of electricity and saved 158 million tons of CO2 [12]. It is estimated that the worldwide wind cumulative capacity reached 318 GW in 2013 [12]. In the same year of 2008, nearly 6 GW of new photovoltaic and thermal solar to power installations contributed to the cumulative installed capacity of 14.7 GW [13]. In recent years, installed solar to power capacity has been growing very fast (e.g., 8% growth in 1992 and 46% in 2008), and reached 139 GW in 2013. However, the variable nature of these renewable resources introduces a new source of uncertainty in the operation and planning of electric power systems.
Variations in VRES depend on the size of the evaluated system and the timescale of wind variations. Proportionately, small wind farms tend to have larger expected hourly variation than variations from an entire area. For example, in Western Denmark, it can be reasonably expected that wind power may vary by 3% of its 2400 MW capacity, whereas a 5 MW wind farm in the same area may vary by 12% [14]. VRES timescale variations can be characterized as microscale, mesoscale, and macroscale. Microscale variations primarily affect regulation (seconds to minutes), while mesoscale variations affect the load-following timescale (minutes to hours), and macroscale variations affect the unit-commitment timescale (hours to days). While microscale fluctuations are smoothed to a significant extent across a typical wind-power array, mesoscale and macroscale fluctuations can be significant for wind farms and even for an entire region [15]. For example, in Denmark, small hourly variations of 10% are common for wind farms, but hourly fluctuations above 30% still occur once every 1.1 years (1/10000 probability) [15]. As a comparison, in the Republic of Ireland, the probability of a thermal-generation plant tripping in any given hour is between 0.0006 for the most reliable units to 0.003 for the least reliable units (median time to failure of 9.6-48 days) [16].
The impact of large-scale VRES variations on power systems differs by time-scale [17,18]. In microscale, large-scale integration of VRES may require significantly more regulation reserves and frequency control depending on the power systems characteristics. For example, a study conducted for Ontario Power Authority indicates that integration of 10,000 MW wind-power capacity into the Ontario system of 26,000 MW peak demand would require an 11% increase in regulation requirements [19]. In mesoscale, VRES variations impact the balance between the supply and demand, and thus, may require a significantly increased amount of operating reserves [16]. The same study for Ontario shows that a 47% increase in operating reserves is necessary in order to deal with mesoscale variations of wind under a 10,000 MW wind-integration scenario [19]. In macroscale, VRES variations impact unit commitment and scheduling of conventional generators, and unpredictable variations may result in significant economic costs. For example, system start-up costs could increase by up to 227.2% in German power systems as a result of day-ahead wind-power forecasting errors [20]. In addition, the inverter-based operation of wind generators also has some power-quality impacts on power systems [21], which are further discussed in Section 4.1.1.
In practice, large variations of VRES, particularly wind, have led to operational difficulties in some cases. As an example, on February 26, 2008, an unexpected 1,400 MW drop in wind-power generation coincided with an unexpected load increase and loss of a conventional generator in Texas [22]. These events forced the Electric Reliability Council of Texas (ERCOT) to take emergency steps and cut 1,100 MW firm load in order to restore system frequency. In addition, wind generators were dispatched down three times in 2008 in the Irish power system for security reasons [23]. Such events and considerations are the basis for limiting large-scale wind-power integration in some power systems. For instance, a 362 MW wind-power restriction is in effect on the 800 MW peak load power system in the Canary Islands [24]. In the province of Alberta, Canada, the electric system operator put a 900 MW cap on wind-power integration because of “operational concerns” [25]. Although this cap was later removed, the system operator has been continuously looking for solutions to deal with the variability associated with wind power in Alberta, such as significant investments in a central wind forecasting project.
Some utility studies have concluded that the grid can absorb wind energy up to 10% of the system load without major technical changes or significant costs [14] and [16]. However, the same studies have also recognized the importance of evaluating the impact of larger scale wind integration in electric grids [14] and [16]. Wind-power variations may currently be smaller than variations from large plant-forced outages, typically, 20% over 30 minutes for the former compared to 100% over seconds for the latter. However, with the expected 22% wind-power annual growth, innovation to reduce the impact of variable and distributed energy resources may become increasingly necessary [12,26].
To deal with the variability of wind and solar to power electricity generation at large scale, several methods are proposed, where each attempt to solve one aspect of integration challenges. For example, expanding transmission and trade allows higher VRES penetration by providing higher flexibility, but is expensive due to the magnitude of energy exchange required to make them profitable [27,28]. Improving VRES forecasting reduces system dispatch errors, but does not give full economic opportunity to the VRES power generator [29,30]. Increasing dispatchable back-up power generation may improve the system’s ability to cope with dispatch errors at the cost of greenhouse gas emissions, since these units generally require fossil fuels for power [31,32,33]. Alternatively, hydro power responds quickly and can absorb some of the fluctuations in wind-power output; however, hydro resources are limited [34]. Decoupling VRES generation from the grid removes power-quality problems associated to VRES at the cost of reducing the clean energy sources feeding the grid [24,35–37,]. Although the above solutions solve several challenges presented by VRES, they are insufficient to mitigate every challenge. Electric energy storage (EES), although generally expensive, has the ability to address several VRES integration issues [1].
3 Electric Energy-Storage Applications and Technologies
The installed EES capacity is approximately 125 GW worldwide, mostly from pumped hydro. This capacity is about 3% of the world’s total generation capacity of 3,900 GW [6,38]. However, performance studies have suggested that approximately 8% of the total power capacity should be in the form of energy storage solely for the purpose of peak shaving and daily charge/discharge cycles [3]. This suggests that for expanding EES to include VRES integration, the required capacity of EES will need to grow beyond the estimated 8%.
In this section, a comprehensive review of the state of technology, installations, and main challenges of EES technologies is provided. Although energy can be stored in any hydroelectric facility by limiting the discharge of water, we only consider and discuss pumped-storage hydro facilities for our survey since this technology allows for both discharge and charge of water.
To give context to this chapter, a short description of each EES technology is also provided, but it is not intended to be a contribution of this work. Characteristics of each technology are also summarized in Tables 1.2 and 1.3. Further details on available technologies, capacity sizing, and operation of EES can also be found in the literature [1–6,8–11,27,39–44]. More specifically, the functionality of various EES are described in [39,42]; calculations for amount of energy stored can be found in [9]; and the important characteristics of different EES technologies are explained in detail in [3,4,6,41,42]. Some relevant topics such as specific EES installations for several applications, the current state of several technologies, and predictions of future technologies and developments have been previously discussed in the literature (e.g., in [8,11,39,40,41]. However, the present chapter focuses on worldwide installations and illustrates specific examples of EES used for VRES applications.
3.1 Pumped Hydro Storage
Pumped hydroelectric storage (PHS) stores potential energy from height differences in water levels, and differs from ordinary hydroelectric power because it has the ability to pump water from the lower reservoir to the upper reservoir. It is the most common form of energy storage, representing approximately 3% of the world’s total installed power capacity, and 97% of the total storage capacity [3,6]. The approximate 250 PHS plants have a cumulative 120 GW of generation capacity, and this capacity is growing at a rate of approximately 5 GW/year. The reason that PHS has been very popular as an energy-storage medium is because it can provide relatively high efficiency (65-85%), large power capacity (typically 100-1000 MW), large storage capacity (1-24 + hours), and a long life (30-60 years), at a low cycle cost (0.1-1.4 ![]() /kWh/cycle) [3,6].
/kWh/cycle) [3,6].
There is considerable interest in investing more resources into PHS for grid reliability and wind variability applications [5,11,24,45–47]. For example, the utility Xcel Energy upgraded a PHS system in Cabin Creek, Colorado, in the United States, to have 359 MW of PHS generation capacity to mitigate wind variability. [48]. In the past, the turbine and the pump were separate due to increased efficiency, but as technology has matured, one rotating machine is now used both as a motor and a generator to reduce costs. However, this tendency is not universal. For example, the Kopswerk II pumping station in Austria, inaugurated in May 2009, has a separate 525 MW turbine from the 450 MW pump. Its purpose is to increase the efficiency of each process and to increase ramping speed for peaking and for integrating renewable energy, since both the turbine and generator can be ramping at the same time [49].
PHS is generally limited to high-power applications only for several reasons, such as its high capital cost (![]() 100 million -
100 million - ![]() 3 billion US or 600 - 2,000
3 billion US or 600 - 2,000 ![]() /kW), the resulting environmental damages by flooding 10-20 km2 of land to make reservoirs, and its long project lead time (typically 10 years). The low modularity of PHS systems at small-scale power (kW to MW range) can limit its ability to be used to solely mitigate wind fluctuations. If a wind farm is not sufficiently large enough, it would be necessary to use the PHS system for multiple purposes (peak shaving, grid stability) to justify the PHS installation, as it is not feasible to have two large reservoirs to mitigate fluctuations in a small wind production.
/kW), the resulting environmental damages by flooding 10-20 km2 of land to make reservoirs, and its long project lead time (typically 10 years). The low modularity of PHS systems at small-scale power (kW to MW range) can limit its ability to be used to solely mitigate wind fluctuations. If a wind farm is not sufficiently large enough, it would be necessary to use the PHS system for multiple purposes (peak shaving, grid stability) to justify the PHS installation, as it is not feasible to have two large reservoirs to mitigate fluctuations in a small wind production.
When using a PHS to level VRES power variations, it is important to ensure that the ramp rates are high enough to level the production. This is generally not an issue, but it is something that will gain importance as the penetration of these sources increases. For example, at very high penetrations of VRES, the Geesthacht pumping stations (0-120 MW in 70 seconds) may not be as appropriate as the Dinorwig pumping station (0-1,800 MW in 16 seconds) [50].
3.2 Compressed to Air Energy Storage
A typical compressed to air energy-storage (CAES) system uses an existing underground site (e.g., a salt dome, a rock cavern, or an abandoned mine), and stores gas at approximately 4 to 8 megapascals [3,6,8]. CAES and PHS are the only storage technologies that are currently suitable for large-scale power and high energy-storage applications [51].
Research shows that CAES is a viable method to mitigate wind variability for wind levelling and energy management purposes [52]. For example, the McIntosh plant, which has a 134 MW generation and 110 MW compression rating, can swing from full generation to full compression in less than 5 minutes, and back to full generation in less than 15 minutes.
There are currently two CAES plants in the world for a total capacity of 400 MW. The first is in Huntorf, Germany with a capacity of 290 MW for 2 hours. This site was installed in 1978 by Alstom. This system, initially built to support a nuclear plant, is now used for grid support 3 hours a day [8]. It has demonstrated a 90% availability and a 99% starting reliability [10]. The second CAES plant was built in 1991, in McIntosh, Alabama, in the United States, with a 110 MW capacity for 26 hours. This plant uses a recuperator, which reduces the fuel consumption by approximately 25% compared to the Huntorf plant [3]. It has the purpose of complementing a coal plant in Lohman, Alabama. Neither of these two sites are used for variable energy sources.
Although there are only two CAES plants in the world, they have both demonstrated high reliability and economic feasibility, and have sparked considerable interest in constructing more in wind integration. For example, the Iowa Stored Energy Park, expected to be commissioned in year 2011 or 2012, would be the first plant to use wind-energy and off-peak electricity to store compressed air in an aquifer [53,54]. This system, with a capacity of 268 MW/13,400 MWh, will get its energy from a 75 to 150 MW wind farm, and is expected to reduce emissions by 60% compared to a system that does not use the CAES through energy management [53]. Due to large storage time, i.e., 50 + hours at full generation, it is expected that the system will cut down on wind dumping when energy demand is low, and will support shifting wind-energy production to periods with high grid emissions intensity. Another example is the Shell-Luminant CAES plant in Texas, where TXU Energy and Shell WindEnergy are working to build a 3,0 MW wind farm connected to a CAES system that will pump air into underground salt beds. The Shell-Luminant CAES plant will store 1,000 MWh of energy in Briscoe County. Finally, Magnum Energy is planning to create an integrated energy-storage facility that can store natural gas and compressed air to help improve the integration of wind and solar power in Utah, in the United States [55]. Eight salt caverns have been identified as suitable, and the first CAES plant is planned be built for approximately ![]() 200 to
200 to ![]() 400 million after the first gas-storage cavern is operational in 2012 [56].
400 million after the first gas-storage cavern is operational in 2012 [56].
CAES shares many of the same attractive qualities of PHS, such as high-power capacity (50-300 MW), large energy-storage capacity (2-50 + hours), a quick start-up (9 minutes emergency start, 12 minutes normal operation), a long storage period (over a year), and a relatively high efficiency (60-80%) [3,6,42]. It also suffers from some of the same problems, such as a reliance on favorable geography (proximity to underground storage area and availability of natural gas), a requirement for large power storage to make the system feasible, and low energy density (12 kWh/m3) [3,6].
However, there are also several features that make CAES very different from PHS. The capital cost of CAES is significantly lower (400-800 ![]() /kW) and since the storage is underground, there is very little impact on the surface environment [3,51]. In addition, appropriate sites are bountiful and virtually untapped; three quarters of the United States has the potential for this technology [10,51]. This may sound promising, but site-specific data is required to evaluate the suitability of the site for CAES such as geography, accessibility, economics, and correlation with wind [51]. The use of natural gas in the expansion cycle causes the system not to be carbon neutral, and the ability of CAES to quickly change output power generation is limited [3,51].
/kW) and since the storage is underground, there is very little impact on the surface environment [3,51]. In addition, appropriate sites are bountiful and virtually untapped; three quarters of the United States has the potential for this technology [10,51]. This may sound promising, but site-specific data is required to evaluate the suitability of the site for CAES such as geography, accessibility, economics, and correlation with wind [51]. The use of natural gas in the expansion cycle causes the system not to be carbon neutral, and the ability of CAES to quickly change output power generation is limited [3,51].
Although CAES is technically capable of increasing VRES penetration, it must be combined with other functions listed in Table 1.1 to economically justify its operation. For example, [57] use the deterministic EnergyPLAN model to analyze the system-economic potential of a CAES plant in electricity systems. In [57], a CAES system with a 216 MW compressor, 360 MW turbine, and 1,478 MWh storage requiring an annualized 14 million Euro of capital investment and operational costs, created an annual 4-12 million Euro shortfall by selling electricity on the spot market. To generate an annual profit of 1-3 million Euro [57] proposed to make the turbine operate solely on the regulating power market for monthly availability payments of 3,330 Euro/MW, and make the compressor operate on the spot market while ensuring that the storage is never empty.
Table 1.1
Benefits of energy storage and desired characteristics, by function
| Function | Value ($/kW) | Storage time at rated capacity (hours) | Power Requirement (MW) | Response time required |
| Renewables capacity firming | 172 [121], 323 [115] | 6–10 [121], 1–3 [115] | minutes | |
| Renewables contractual time of production payments | 655 [121,123] | 6–10 [121,123], 4–6 [121], 8 [6] | minutes | |
| Smoothing microscale wind variations | 0.01–0.05 [6] | < 1 cycle [4] | ||
| Smoothing mesoscale wind variations | 0.33–2 [6], 1 [4] | 0–10 [4] | < 1 cycle [4] | |
| Smoothing macroscale wind variations | 2–3000 [6], 168 [4] | 0.1–1 | Seconds–minutes [4] | |
| Removing effects of intermittent clouds on PV | 0.33 [6] | Rated power of PV generation | < 1 cycle [4] | |
| Distributed generation peaking | 1 [4] | 0.5–5 [4] | < 1 minute [4] | |
| Voltage and frequency control, and governor controlled generation | 25 [115] | 0.005 [6] | < 1 cycle | |
| Electric service power quality | 717 [115,121] | 0.0027–0.017 [115,121] | < 1/4 cycle | |
| Peak shaving | 600 [100], 832 [115] | 2 [6], 6–10 [4], 2–8 [115] | 100 + [4] | minutes [4] |
| Regulation control | 2300 [100], 789 [115] | 0.16–1 [115], 0.25–1 [5] | 175–600 [5] | |
| Bulk electricity price arbri trage | 200–300 [121] | 1–10 [121] | ||
| Central generation capacity | 215 [100,121], 753 [115] | 4–6 [121], 2–6 [115] | ||
| Transmission support | 169 [115,121] | 0.00056–0.0014 [115,121] | 1–100 + [4], 1–10 [119] | < 1/4 cycle [4] |
| Reducing transmission access requirements | 72 [121] | 1–6 [121] | ||
| Transmission congestion relief | 72 [115,121], 20–50 [66] | 2–6 [115,121] | minutes | |
| Distribution upgrade deferral | 666–1067 [100,121] | 2–6 [121] | minutes | |
| Transmission upgrade deferral | 650 [121], 1200 [115] | 4–6 [121], 2–6 [115], 1–3 [119] | 10–100 + [119] | minutes |
| Time-of-use energy cost management | 1004 [121], 1649 [115] | 4–6 [115] | minutes | |
| Demand charge management | 465 [121], 1076 [115] | 6–11 [121], 1 [4], 4–6 [115] | < 1 [4] | < 1 minute [4] |
| End-user electricity service reliability | 359 [100,115,121] | 0.25–5 [121], 0.08–5 [115] | < 1 [4] | < 1/4 cycle [4] |
| Spinning reserves | 258 [115], 72 [121] | 0.05–0.33 [6], 0.5 [4], 0.16–1 [115], 1–5 [121] | 1–100 [4], 10–400 [119] | < 3 seconds [4] |
| Standing reserves | 72 [121] | 2 [6], 1–5 [121] | 1–100 [4] | < 10 minutes [4] |
| Minimization of trade penalties | 2 [6] | minutes | ||
| Telecommunications backup | 2 [4] | 0.001–0.002 | < 1 cycle [4] | |
| Uninterruptible power suppy | 2 [4] | 0.05–2 [4] | seconds [4] | |
| Load following | 2 + [4] | 100 + [4], 1–100 + [119] | < 1 cycle [4] | |
| Emergency back-up | 24 [4] | 1 | Seconds–minutes [4] | |
| Seasonal storage | 168 + [4] | 50–300 | minutes [4] |
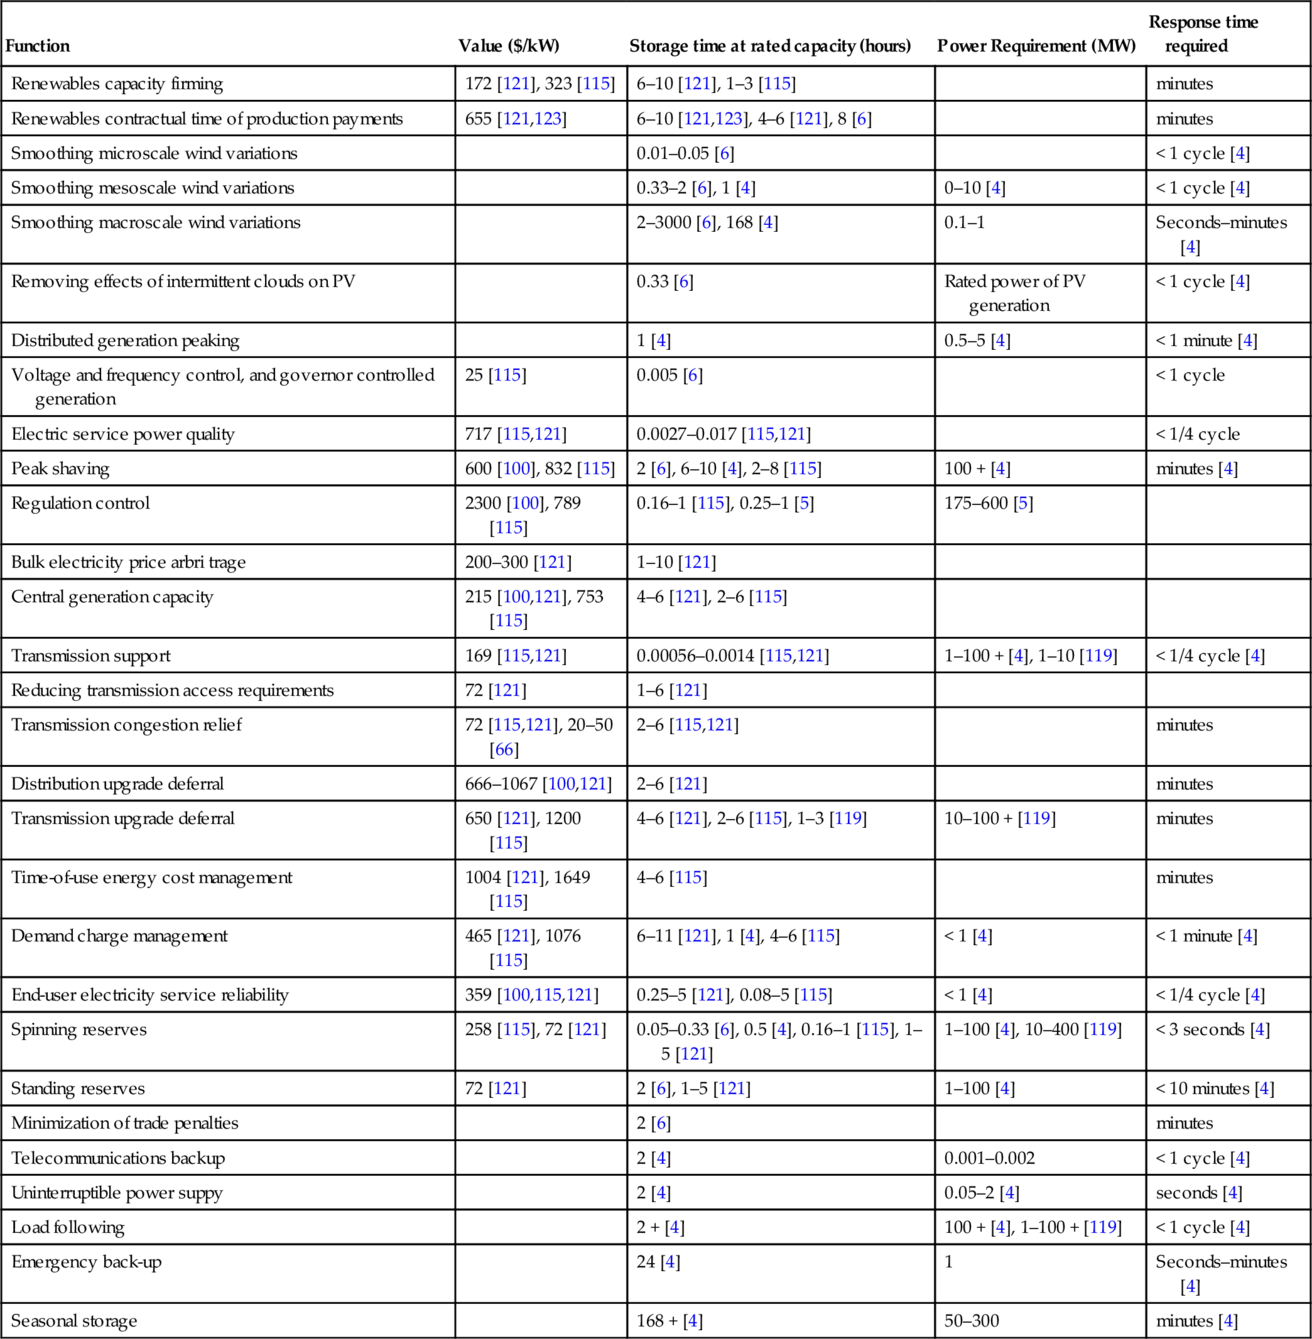
Table 1.2
Characteristics of [3] EES systems
| Energy-storage Technology | Energy Capacity Cost ($/kWh) | Discharge at rated capacity (hours) | Rated capacity (MW) | Response time | Maturity |
| PHS | 5–100 [3], 10–12 [4], 50–100 [41] | 1–24 + [3], 12 + [4] | 100–5000 [3], 1–4000 [4], 1000–3000 [41] | minutes [4] | Mature |
| CAES | 2–50 [3], 3 [4],15–100 [41] | 1–24 + [3], 24 + [4] | 5–300 [3], 220 [4], 100–3000 [41], 50–350 [15] | Seconds–minutes [4] | Used |
| Lead-Acid Battery | 200–400 [3], 175–250 [4], 50–100 [42], 456–1574 [59] | 0.0027–2 + [3], 1–5 [6], 4–8 [4] | 0–20 [3,4], 0–40 [59] | < 1/4 cycle [4] | Mature |
| Nickel-Cadmium Battery | 800–1500 [3], 400–2400 [42] | 0.0027–2 + [3], 1–10 [6], 6–8 [40] | 0–40 [3] | < 1/4 cycle | Used |
| Sodium-Sulphur Battery | 300–500 [3], 245 [4] | 0.0027–2 + [3], 4–8 [6], 1 [4], 6 [67] | .050–8 [3], 0–34 [67] | < 1/4 cycle [67] | Commercializing |
| Lithium-Ion Battery | 600–2500 [3], 900–1300 [42] | 0.017–2 + [3] | 0–0.1 [3] | < 1/4 cycle | Commercializing |
| Fuel Cell | 425–725 [4], 15 [4] | 0.0027–24 + [3], 12 + [6] | 0–50 [3,41], 0.2 [4] | < 1/4 cycle [4] | Developing |
| Vanadium Redox Battery | 150–1000 [3] | 0.0027–10 [3], 2–12 [6] | 0.03–3 [3] | < 1/4 cycle | Developed |
| Zinc-Bromine Battery | 150–1000 [3], 200 [4], 400 [15] | 0.027–10 [3], 2–5 [6], 2 [4], 5 [124] | 0.05–2 [3], 0.05 [4], 0–0.5 [124] | < 1/4 cycle [4] | Developed |
| SMES | 1000–10000 [3], 500–72000 [4] | 2.7 × 10⁻⁷–0.0022 [3] | 0.1–10 [3], 0–100 [41] | < 1/4 cycle [4] | Developing |
| Flywheel | 1000–5000 [3], 300–25000 [4], 400–800 [42], 100–800 [15] | 2.7 × 10⁻⁷–0.25 [3], 0.000–0.01 [6], 0.00083–0.03 [4] | 0–0.250 [3,40], 0–1.65 [4], 0–10 [41] | < 1 cycle [4] | Developed |
| Capacitor | 500–1000 [3] | 2.7 × 10⁻⁷–1 [3] | 0–0.05 [3] | < 1/4 cycle | Used |
| Supercapacitor | 300-2000 [3], 82000 [4], 200000 [42] | 2.7 × 10⁻⁷–1 [3], 0.0027 [4] | 0–0.3 [3], 0–0.1 [4], 0–10 [41] | < 1/4 cycle [4] | Developing |
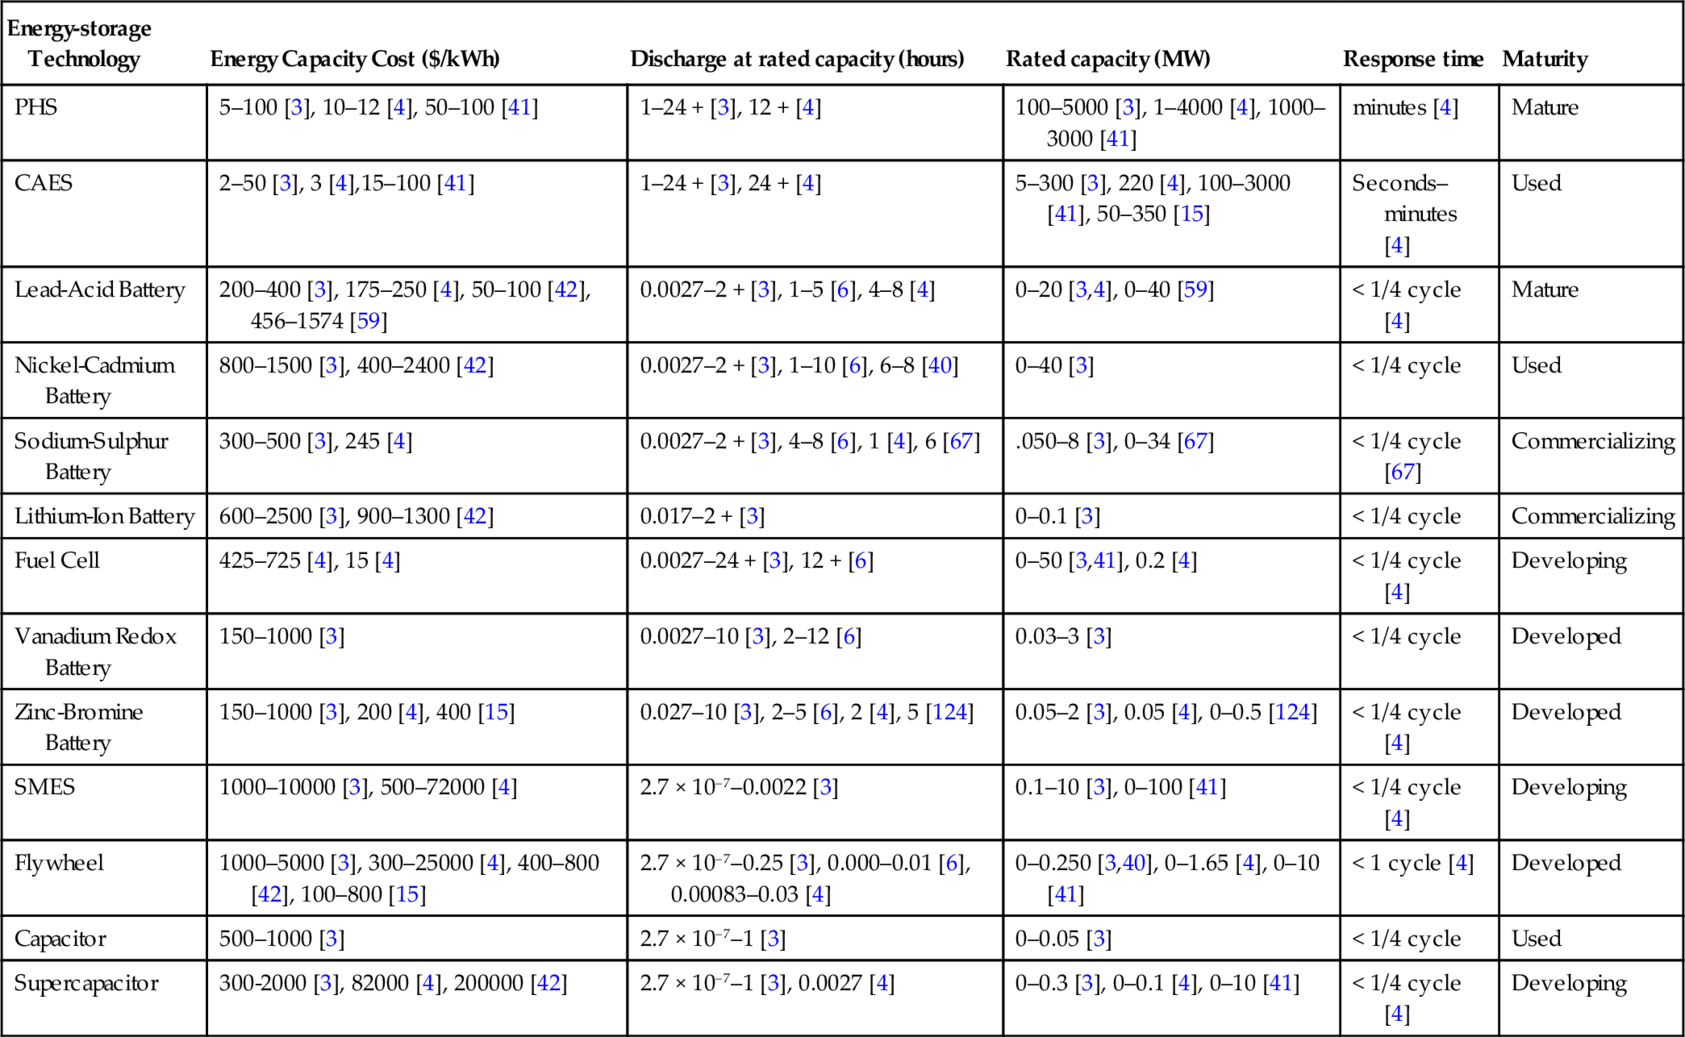
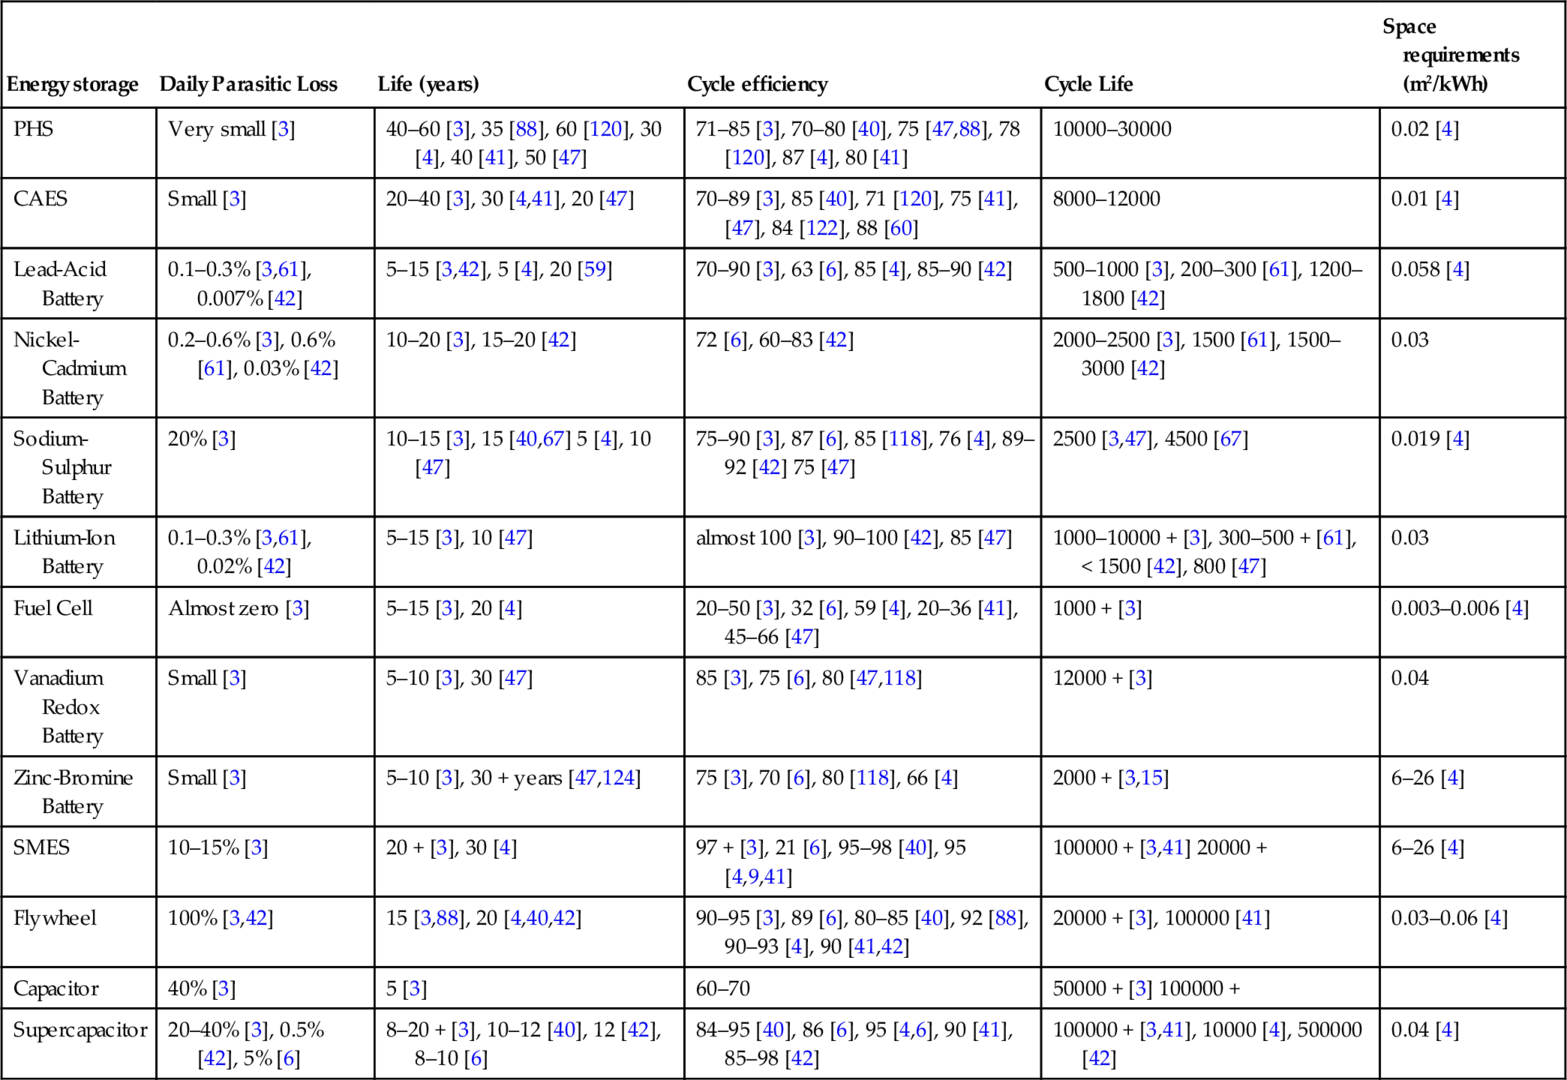
Table 1.3
Other characteristics of [3] EES systems
| Energy storage | Daily Parasitic Loss | Life (years) | Cycle efficiency | Cycle Life | Space requirements (m2/kWh) |
| PHS | Very small [3] | 40–60 [3], 35 [88], 60 [120], 30 [4], 40 [41], 50 [47] | 71–85 [3], 70–80 [40], 75 [47,88], 78 [120], 87 [4], 80 [41] | 10000–30000 | 0.02 [4] |
| CAES | Small [3] | 20–40 [3], 30 [4,41], 20 [47] | 70–89 [3], 85 [40], 71 [120], 75 [41], [47], 84 [122], 88 [60] | 8000–12000 | 0.01 [4] |
| Lead-Acid Battery | 0.1–0.3% [3,61], 0.007% [42] | 5–15 [3,42], 5 [4], 20 [59] | 70–90 [3], 63 [6], 85 [4], 85–90 [42] | 500–1000 [3], 200–300 [61], 1200–1800 [42] | 0.058 [4] |
| Nickel-Cadmium Battery | 0.2–0.6% [3], 0.6% [61], 0.03% [42] | 10–20 [3], 15–20 [42] | 72 [6], 60–83 [42] | 2000–2500 [3], 1500 [61], 1500–3000 [42] | 0.03 |
| Sodium-Sulphur Battery | 20% [3] | 10–15 [3], 15 [40,67] 5 [4], 10 [47] | 75–90 [3], 87 [6], 85 [118], 76 [4], 89–92 [42] 75 [47] | 2500 [3,47], 4500 [67] | 0.019 [4] |
| Lithium-Ion Battery | 0.1–0.3% [3,61], 0.02% [42] | 5–15 [3], 10 [47] | almost 100 [3], 90–100 [42], 85 [47] | 1000–10000 + [3], 300–500 + [61], < 1500 [42], 800 [47] | 0.03 |
| Fuel Cell | Almost zero [3] | 5–15 [3], 20 [4] | 20–50 [3], 32 [6], 59 [4], 20–36 [41], 45–66 [47] | 1000 + [3] | 0.003–0.006 [4] |
| Vanadium Redox Battery | Small [3] | 5–10 [3], 30 [47] | 85 [3], 75 [6], 80 [47,118] | 12000 + [3] | 0.04 |
| Zinc-Bromine Battery | Small [3] | 5–10 [3], 30 + years [47,124] | 75 [3], 70 [6], 80 [118], 66 [4] | 2000 + [3,15] | 6–26 [4] |
| SMES | 10–15% [3] | 20 + [3], 30 [4] | 97 + [3], 21 [6], 95–98 [40], 95 [4,9,41] | 100000 + [3,41] 20000 + | 6–26 [4] |
| Flywheel | 100% [3,42] | 15 [3,88], 20 [4,40,42] | 90–95 [3], 89 [6], 80–85 [40], 92 [88], 90–93 [4], 90 [41,42] | 20000 + [3], 100000 [41] | 0.03–0.06 [4] |
| Capacitor | 40% [3] | 5 [3] | 60–70 | 50000 + [3] 100000 + | |
| Supercapacitor | 20–40% [3], 0.5% [42], 5% [6] | 8–20 + [3], 10–12 [40], 12 [42], 8–10 [6] | 84–95 [40], 86 [6], 95 [4,6], 90 [41], 85–98 [42] | 100000 + [3,41], 10000 [4], 500000 [42] | 0.04 [4] |
3.3 Batteries
The batteries discussed in this chapter store energy through a reversible chemical reaction.
3.3.1 Lead-Acid Batteries
Lead-acid batteries have been used for more than 130 years in many different applications and they are still the most widely used rechargeable electrochemical device for small-medium scale storage applications. In China, lead-acid batteries are used in 75% of new solar photovoltaic systems, which was 5% of the entire lead-acid battery market in year 2007, and expected to hold 10% by 2011. Seventy percent of lead-acid batteries are used for vehicles, 21% for communications, and 4% for other applications [58]. The largest lead-acid storage installation was a ![]() 18.2 million, 10 MW/40 MWh unit in Chino, California in July 1988 for load leveling [3,10]. It is currently operated by Southern California Edison Company. More installations are discussed in [59].
18.2 million, 10 MW/40 MWh unit in Chino, California in July 1988 for load leveling [3,10]. It is currently operated by Southern California Edison Company. More installations are discussed in [59].
Lead-acid batteries have low cost (300-600![]() /kW), high reliability, strong surge capabilities, high efficiency (65-80%), and are usually good for uninterruptible power supply, power quality, and spinning reserve applications [3]. However, they are poor for energy management purposes because they have a short life (500-1,000 cycles), require regular maintenance, have low energy density (30-50 Wh/kg), emit explosive gas and acid fumes, and have a poor cold temperature performance, which requires a thermal management system [3]. Although valve-regulated lead-acid batteries require less maintenance, create less gaseous emissions, and self-discharge they are primarily designed for back-up power supply and telecommunication applications due to their decreased cycle life [58].
/kW), high reliability, strong surge capabilities, high efficiency (65-80%), and are usually good for uninterruptible power supply, power quality, and spinning reserve applications [3]. However, they are poor for energy management purposes because they have a short life (500-1,000 cycles), require regular maintenance, have low energy density (30-50 Wh/kg), emit explosive gas and acid fumes, and have a poor cold temperature performance, which requires a thermal management system [3]. Although valve-regulated lead-acid batteries require less maintenance, create less gaseous emissions, and self-discharge they are primarily designed for back-up power supply and telecommunication applications due to their decreased cycle life [58].
3.3.2 Nickel-Cadmium Batteries
Nickel-cadmium (NiCd) batteries compete with lead-acid batteries because they have a higher energy density (50-75 Wh/kg) and have a longer life (2000-2500 cycles). They are good for uninterruptible power supply and generator-starting applications [3]. In Golden Valley, Fairbanks, Alaska, the world’s second most powerful battery bank is a NiCd type. The 27 MW rated battery in this site can provide 40 MW for 7 minutes, and is used for spinning reserves and grid stabilization in an electrical-island operation mode [3,60].
However, NiCd battery sales declined for the period of 1995 to 2003 [61]. This may be attributed to increasing environmental controls for toxic cadmium, such as the 2006 European Union’s directive on batteries and accumulators to ban NiCd batteries in September 2008, or because new battery developments do not justify the cost of NiCd batteries (1,000 ![]() /kWh) for certain applications [62]. Concerning VRES integration, NiCd batteries have a unique feature that makes them unsuitable: the memory effect [3]. If NiCd batteries are not fully discharged before being recharged, the battery will start losing its capacity. Since wind and solar power are non-dispatchable and include forecast errors, NiCd batteries can not operate economically without creating problems caused by the memory effect.
/kWh) for certain applications [62]. Concerning VRES integration, NiCd batteries have a unique feature that makes them unsuitable: the memory effect [3]. If NiCd batteries are not fully discharged before being recharged, the battery will start losing its capacity. Since wind and solar power are non-dispatchable and include forecast errors, NiCd batteries can not operate economically without creating problems caused by the memory effect.
3.3.3 Sodium-Sulphur Batteries
In the last decade, sodium-sulphur (NaS) battery-based installations have grown exponentially from 10 MW in 1998 to 305 MW (2,000 MWh) at the end of 2008 [63]. NaS batteries are a very attractive emerging technology for VRES generation management, such as wind power, because they can be cycled 2500 times, have high-power density (150-240 W/kg), are efficient (75-90%), and have a 600% rated pulse power capability that can last 30 seconds [64,65]. It is claimed that NaS batteries are the most economically feasible battery storage option for energy management, requiring electricity prices of 32 cents/kWh [64].
NGK Insulators Inc., the only NaS battery supplier in the world, has installed several batteries for VRES applications, and is considering ramping up their annual production capacity from 90 MW in 2009 to 210 MW in 2011 [63]. NGK has installed a 34 MW 245 MWh system in northern Japan for stabilizing a 51 MW wind farm [66,67]. This is the largest energy-storage system in the world, discounting PHS and CAES systems. The utility company Xcel Energy is exploring the viability of coupling a 1.2 MW/7.2 MWh NaS battery installation with the 11.8 MW MinnWind wind project [68,69]. A 1.5 MW battery has been shown to work with 5 MW of solar to power stabilization. In May 2009, Electricite de France and NGK agreed on 150 MW of NaS batteries over the next 5 years to mitigate fluctuations in solar and wind-energy production on various Mediterranean islands in order to reduce carbon emissions [67,70].
NaS batteries are environmentally benign since the batteries are sealed and thus allow no emissions during operation. Also, more than 99% of the overall weight of the battery materials can be recycled. Only sodium must be handled as a hazardous material [64]. Although NaS batteries can be modular down to 50 kW, the general sizes are approximately 1 MW.
However, the NaS batteries must be kept at approximately 300 to 350 degrees Celsius, and are subject to a high capital cost (2,000![]() /kW or 350
/kW or 350![]() /kWh) [3,63,67]. Beta R&D is hoping to compete with NGK Insulators Inc., with their sodium nickel-chloride batteries, known as ZEBRA batteries. ZEBRA batteries have similar characteristics as the NaS batteries (120 Wh/kg energy density and 150 W/kg power density), but can operate at temperatures from -40 to 70° Celsius [3].
/kWh) [3,63,67]. Beta R&D is hoping to compete with NGK Insulators Inc., with their sodium nickel-chloride batteries, known as ZEBRA batteries. ZEBRA batteries have similar characteristics as the NaS batteries (120 Wh/kg energy density and 150 W/kg power density), but can operate at temperatures from -40 to 70° Celsius [3].
3.3.4 Lithium-ion batteries
Lithium-ion batteries were commercialized by Sony in 1991, and the demand for these batteries has grown exponentially in several markets. This is attributed to the many desirable characteristics these batteries have, such as efficiencies of over 95%, long life cycle of 3,000 cycles at 80% depth of discharge, high energy density of 200 Wh/kg, and high-power density [3]. These, along with fast-discharge capabilities have made them nearly ideal for portable electronics applications. The main hurdles for large- scale lithium-ion batteries are their high cost (above ![]() 1,200/kWh) and the circuitry needed for safety and protection [68].
1,200/kWh) and the circuitry needed for safety and protection [68].
A123 Systems and EaglePicher Technologies are two examples of companies that are developing lithium-ion battery technology for the power systems industry. In May 2009, EaglePicher Technologies announced the construction of a 60 MWh battery, the size of a football field, to store wind energy in Kansas, United States [71]. A123 Systems is currently developing lithium-ion batteries for reserves, frequency regulation, and grid stabilization [72]. However, most of the focus has been on the automotive sector. Lithium-ion battery production produces 70 kg CO2 /kWh capacity; this is less the emissions produced by fossil-fuel alternatives after only 120 recharges of hybrid vehicles. However, lithium-ion reserves are limited and creating 800 million vehicles that use a 15-kWh lithium-ion battery each would deplete 30% of world’s lithium reserves [73].
3.3.5 Zinc-Bromine Batteries
Zinc-bromine (ZBR) batteries are a special type called flow batteries, which store at least one of its liquid electrolytes in an external storage tank that flows through the reactor to store/create electricity [3]. As a result, the energy storage can be independent of the power capacity, depth-of-discharge can be ignored, and self-discharge is negligible. This makes flow batteries flexible for a wide range of applications including seasonal storage. With a sub-millisecond response time and pulse capability, flow batteries are more than capable for VRES following and power quality.
In low levels of wind penetration, flow-battery systems delivered the lowest cost per energy stored in a study that compared lead-acid batteries, flow batteries, flywheel, superconducting magnetic energy storage, CAES, hydrogen, and PHS, with a profitable price of 41 to 45 cents/kWh [15,64]. In the [64] case, a 600 kW/3,000 kWh battery was used for shifting the power generation of a single 2.5 MW wind turbine in ten bottom-up pricing scenarios, and it was found that that the minimum selling price of electricity needed to be 45 cents/kWh. In [15], the levelized cost of storage was evaluated to be 41 cents/kWh, assuming a 10% wind penetration in the state of California using the HOMER model.
Since the development of ZBR batteries by Exxon in the 1970s, two companies have tried to develop the technology for commercial purposes, namely, ZBB Energy Corporation and Premium Power Corporation [3]. ZBB’s commercial products include the ZESS 50 (50 kW/50kWh) and the ZESS 500 (250 kW/500kWh). Premium Power’s commercial products include the PowerBlock 150 (100 kW/150 kWh) and the Transflow 2000 (500 kW/2.8 MWh). Although ZBR batteries are suitable for small-scale applications, medium-scale ZBR battery technology was tested as early as 1991 (e.g., at Kyushu Electric Power, 1 MW/4 MWh), and up to a total power capacity of 2 MW (e.g., at PG&E in California in 2005). By the end of 2009, it is estimated that there was 4 MW of installed capacity in the world, with a storage capacity of 8 MWh [74–77].
ZBR batteries have 75% efficiency, 200% peaking capacity, 3 to 4 hours recharge time, 75 to 85 Wh/kg, over 2,000 charge life cycle, and deep discharge capabilities [78]. This, along with ZBB’s “plug-and-play” capabilities make the technology suitable for small distributed energy storage [78].
3.3.6 Vanadium Redox Batteries
Vanadium redox batteries (VRB) are another type of flow battery that is suitable for small- and medium-scale applications. Starting with the development of VRB technology by the University of New South Wales in the 1980s, there are now currently over 20 MWh of installed VRB in the world. The installed VBR batteries are used for load leveling, remote-area power systems, renewable energy stabilization, uninterruptible power supply, back-up power, and power quality [79,80]. The technology has been tested, proven, and installed in various locations, and has been characterized as a storage system with one of the lowest environmental impact. Plants can be upgraded at a relatively low incremental cost, by increasing the volume of electrolytes for more stored energy or by adding new cell stacks for additional power [81].
The main VRB suppliers are Sumitomo Electric Industries and Prudent Energy who marketed VRB Power Systems in January 2009 [80,81]. The largest installation by VRB Power Systems is 0.25 MW/2 MWh [79,80]. The largest installations by Sumitomo Electric Industries is a 4 MW/6 MWh unit in Tomamae Wind Villa in Japan, in 2005, which has been cycled over 270,000 times to various depths of charge within 3 years to stabilize a 32 MW wind farm [3,79,81].
VRB have been used to mitigate fluctuations in both wind and solar power. To understand the potential of VRB for wind and daily wind management, the Institute of Applied Energy in Japan installed a 170 kW, 1 MWh VRB system in 2001. The Riso Research Institute in Denmark installed a 15 kW, 240 kWh battery in 2006 for the same purpose [81]. For solar power, a 30 kW, 240 kWh, VRB system has been used for a solar photovoltaic-hybrid application at the Obayashi Corp’s Dunlop Golf Course.
VRB are modular down to 5 kW/10 kWh, have an efficiency of 75% to 80%, and with proper annual maintenance, have a high cycle life of over 12,000 at 100% depth of charge because the electrolytes do not degrade. However, due to their low energy density of 16-33 kWh/m3, they require a large amount of space, and are only suitable for small or medium stationary VRES applications [3].
3.4 Superconducting Magnetic Energy Storage
A superconducting magnetic energy-storage (SMES) unit is a device that stores energy in the magnetic field generated by direct current flowing through a superconducting coil [3,9]. SMES is a relatively new technology with low exposure to power applications, although one estimate reports that there may be as much as 100 MW capacity already installed in the world [3]. SMES units can only generate electricity at rated capacity for a few seconds, have strong magnetic fields, and are extremely expensive at 1,000 to 10,000![]() /kW due to the need for cryogenics to maintain superconductivity.
/kW due to the need for cryogenics to maintain superconductivity.
Micro-SMES devices in the range of 1 to 10 MW are commercially available, and over 30 devices with approximately 50 MW of total capacity are installed in different parts of the United States for good power quality or uninterruptible power supply [39]. The largest installation includes six or seven units in upper Wisconsin by American Superconductor in year 2000. These units of 3 MW/0.83 kWh are currently operated by the American Transmission Company, and are used for power quality applications and reactive power-support where each can provide 8 MVA [82,83].
Although there is research examining the technical ability of SMES to integrate renewable energies, there is little indication that SMES has or can fill a unique niche. For most purposes, supercapacitors and flywheels can fill the same niches as SMES [84,85].
3.5 Hydrogen Storage
Hydrogen differs from the conventional idea of energy storage because it uses separate processes for hydrogen production, storage, and use. For hydrogen production, an electrolyzer produces hydrogen and oxygen from water by introducing an electric current. A hydrogen fuel cell converts hydrogen and oxygen back into water to release energy. Different strategies of integrating wind and solar energy with hydrogen storage are proposed in [28,37,64,86–89].
Norsk Hydro and Enercon installed the first and largest wind-hydrogen plant in Utsira, Norway, in 2004, which operates as an isolated power system with 90% availability [28,90]. It couples a 600 kW wind turbine with a 48 kW electrolyzer and a 10 kW fuel cell. Hydrogen is stored in a 12 m3 tank, which is enough to power 10 houses for 2 to 3 days without wind [90]. Grid stability and back-up are provided by a flywheel and a battery bank.
In the town of Nakskov, Denmark, a wind-hydrogen project has been successfully producing hydrogen since May 2007 [91]. It uses an 8 kW electrolyzer, a 10.5 kW fuel cell, and a 25 m3 hydrogen storage tank. The hydrogen is used to produce electricity when demand exceeds generation, and the excess oxygen is used for waste-water cleaning projects [92]. To increase efficiency, fuel cells will be installed in 35 residential homes to be used as combined heat and power generation [91].
Hydrogen storage is estimated to cost between 500 to 10,000 ![]() /kW [3] [4]. Because the capital cost is currently more expensive than other options and it has a low storage conversion efficiency (30-40%), hydrogen storage for integrating VRES can be expensive. A wind-hydrogen system should sell energy generated by the fuel cell at a price between 1.76 to 2.5
/kW [3] [4]. Because the capital cost is currently more expensive than other options and it has a low storage conversion efficiency (30-40%), hydrogen storage for integrating VRES can be expensive. A wind-hydrogen system should sell energy generated by the fuel cell at a price between 1.76 to 2.5 ![]() /kWh to be competitive in energy-management timescales [64,87]. Because hydrogen storage costs approximately 4.5 times more than natural gas, electrolyzer / fuel cell systems are either inoperable or uneconomical at low levels of wind penetration [36,88,89]. However, research suggests that replacing the fuel cell with a hydrogen internal combustion engine may be more viable, especially if mixed with natural gas [93]. Fuel-cell technology may be a viable option for the future, as it is expected that the cost may drop to 15 to 145
/kWh to be competitive in energy-management timescales [64,87]. Because hydrogen storage costs approximately 4.5 times more than natural gas, electrolyzer / fuel cell systems are either inoperable or uneconomical at low levels of wind penetration [36,88,89]. However, research suggests that replacing the fuel cell with a hydrogen internal combustion engine may be more viable, especially if mixed with natural gas [93]. Fuel-cell technology may be a viable option for the future, as it is expected that the cost may drop to 15 to 145 ![]() /kW by 2020 [94].
/kW by 2020 [94].
Hydrogen production and storage may currently be an option for certain applications, such as when grid reinforcement is expensive, when there are limiting environmental policies or concerns for other options, for isolated electricity networks with low flexibility generation and high variability in load and generation, or for small-scale self-sufficient power supply systems disconnected from the electric grid [27,95]. However, many EES can be applied to these problems at a smaller cost.
Hydrogen may become competitive for seasonal storage of VRES. For applications in seasonal storage, EES requires large energy capacity and a very low self-discharge. For this application, only PHS, flow batteries, CAES, and hydrogen are technically viable. Due to the high seasonality of VRES, long-term storage may become more attractive as VRES penetration increases. For example, one study showed that hydrogen becomes an attractive option if wind penetration increases to 18% in Southern California by 2020 [15]. The hydrogen market may also expand if it enters the transport sector as an emissions-free alternative to gasoline [28].
Some research shows that hydrogen storage can drastically increase wind-energy penetration [96]. This is because the excess wind after hydrogen production can be used for purposes other than electricity, such as fueling ferries or cars. A hydrogen storage system connected to both filling stations and electrical generators can be regarded as a future solution in areas where grid-connected wind generation is economically and/or technically viable. It may be possible to use hydrogen pipelines to connect stations into a network to provide energy for vehicles and electrical loads [28].
3.6 Flywheels
A flywheel is a mass that stores/retrieves energy according to its change in rotational velocity, and is a promising technology because of its long life of 15 to 20 years, long cycle life of 10,000 to 100,000, and high efficiency of 90 to 95% [3,9,42]. However, the capital cost for flywheels is high in the range of 1,000 to 5,000 ![]() /kWh. The self-discharge rate is between 55 to 100%/day [42].
/kWh. The self-discharge rate is between 55 to 100%/day [42].
Although flywheels are not yet widespread in the power industry, they are slowly penetrating the market, mostly for uninterruptible power supply, power conditioning and pulse power, and are starting to be used with VRES. For example, a 5 kWh, 200 kW flywheel is used to stabilize the 10-household grid in Utsira, Norway, in a wind-hydrogen system [90]. In addition, Urenco Power Technologies has also installed some flywheels for smoothing wind turbine output and stabilizing a small-scale island wind supply [3]. Beacon Power claims that flywheels can be used for cloud-cover effects mitigation for solar photovoltaic by preventing voltage disturbances, and as an energy buffer for mitigating wind-power ramping [97]. Strategies have been suggested to combine the characteristics of flywheels, i.e., fast ramping and low energy, with another device, such as PHS, hydrogen, or diesel to remove the weaknesses of both devices for better VRES integration [5,90,97]. A unique strategy only applicable to wind is to use the rotating wind turbines as flywheels to remove the frequency variations to which the grid is susceptible [98].
3.7 Capacitors and Supercapacitors
Capacitors and supercapacitors store electric energy by accumulating positive and negative charges [9]. They can be charged substantially faster than conventional batteries and can be cycled over 100,000 times, but they have low energy density, so they are best used for fast cycling applications [3].
Capacitors accumulate charges on parallel plates separated by a dielectric. They last approximately 5 years, and have 60 to 70% cycle efficiency [3]. In power systems, they are typically used for power-factor correction, voltage and VAR support, and harmonic protection instead of energy storage. A few energy-storage applications that can be used for VRES integration include increasing battery life, surge power, and dynamic voltage restoration.
Supercapacitors usually store energy by means of an electrolyte solution between two solid conductors. They have many similar characteristics as capacitors, but have several differences. Supercapacitors have a durability of 8 to 10 years, an efficiency of 95%, they are deep discharge/overcharge capable, and have an extremely high-power density of 10,000 W/kg [6,42]. However, supercapacitors have a high energy dissipation rate of 5 to 40%/day and their cost is estimated to be ![]() 20,000/kWh. There are currently no known installed high-voltage applications for supercapacitors [10].
20,000/kWh. There are currently no known installed high-voltage applications for supercapacitors [10].
By connecting capacitors or supercapacitors to the direct current link of an VRES generator, multiple benefits could be extracted. It removes the need for a DC/AC converter and some control equipment from the system; this is true for all direct current EES technologies. In addition, it is also capable of providing low voltage ride-through and filtering higher frequencies to smooth VRES generation [99].
4 Discussion
This section is divided into three subsections. Section 4.1 addresses the basic premise of the chapter and answers the question of which EES technology can mitigate VRES variability at various timescales while taking economic feasibility into account. Although certain EES technologies can economically manage the variations of VRES, the geographically distributed nature of VRES may prevent certain EES from being practicably installed. Section 4.2 considers the practical applicability of EES given the distributed nature of VRES. Finally, despite the suitability of certain EES for VRES applications, there are non-technical factors that have an impact on the future development of EES. Section 4.3 discusses the limitations of EES developments and factors that may favor the development of certain EES.
4.1 Managing VRES variability using EES
We evaluate the impact of VRES on power systems with respect to power quality, regulation, load following, unit commitment, and seasonal storage timescales in this section. We also qualitatively evaluate the feasibility of EES systems to manage the impact of VRES in each case. The necessary characteristics of EES for various applications are listed in Table 1.1, and can be compared to the characteristics of all the EES in Table 1.2. Although there are studies that can compare the economic and technical fitness of an EES technology for certain applications, many characteristics such as the financial strength of suppliers and the commercial maturity of a product can only be evaluated qualitatively. For example, a study evaluated the desired EES characteristics for load-leveling applications and qualitatively compared the fitness of NaS, lead-acid, ZBR, and VRB batteries [100]. The result showed that NaS batteries were the best fit for load-leveling applications.
4.1.1 Power Quality
Power converters, which are needed for solar photovoltaic and some wind power, introduce several undesired harmonics that can have a negative impact on electronic equipments [21]. Furthermore, the reconnection of wind turbines after cut-in or furl-out wind speeds can cause brownouts at high levels of wind penetration. Moreover, solar power is susceptible to power spikes as clouds or objects pass over the array of panels [101]. Finally, wind-power oscillations, and flicker as the blade sweeps over the tower, may reduce system stability and transmission capability in weak or isolated grids [84,101]. However, the latter is usually not a problem because wind turbine flicker is asynchronous and independent of other turbines, and is mostly damped throughout a wind-power array. In isolated electricity grids, the maximum output of wind farms is limited due to the higher power-quality requirements [101]. In larger power systems [102] suggests that power-quality issues related to VRES fluctuations need to be addressed when voltage varies more than 10% from the rated value, more often than 5% of the time, or if a voltage dip below 15% of the rated voltage occurs.
EES technologies that can deal with the these power-quality-related issues require high cyclability and fast response rates, i.e., sub-cycle response, at a reasonable cost, which could be provided by flywheels, capacitors, and batteries. Supercapacitors and SMES devices, which also have excellent cycle life, may have potential in these applications, but are not yet mature enough to be considered in a utility application [65]. However, it is worth noting that their response rates are much faster than flywheels, and may become necessary as VRES penetration increases. Each of these technologies are emerging and improving at a rapid rate to replace the dominance of lead-acid batteries.
4.1.2 Regulation
The seconds-to-minutes timescale involves the relatively rapid response to changing load and VRES generation conditions. When they deviate from forecasted values, electricity companies may face temporary capacity mismatches and cause brownouts or blackouts [36]. Regulation usually requires an automatic generation control scheme that tells one or more units to change its output in response to short variations to maintain a balanced system. At the regulation timescale, microscale variations in VRES create additional variability and unpredictability in the dynamic balance between generation and load [15]. At the regulation timescale, EES systems need a combination of good ramp rates, i.e., 10 to 20 MW/s, and a power capacity with the ability to provide rated power for at least one hour [103]. It is estimated that 15 to 20% of a wind-farm nameplate size can provide a 90% smooth output [81]. Many EES systems have characteristics that make them suitable for both regulation and power-quality application. Although large flywheel and large SMES might technically be able to accomplish these, NaS batteries are currently economically the best due to their high power, scalability, and cyclability for a reasonable cost, followed by lithium-ion and flow batteries. At the regulation timescale, EES is beneficial when there are significant penalties for deviation from scheduled power production due to inaccurate VRES power forecasts. For example, the Bonneville Power Administration charges ![]() 100/MWh for deviation from scheduled power delivery [104].
100/MWh for deviation from scheduled power delivery [104].
4.1.3 Load following
For timescales of minutes to hours, load-following matches relatively slow but large magnitude swings in daily electricity demand and mesoscale wind variations. Electricity demands are typically low at night and high during the day [24]. On the load-following timescale, VRES can affect economic dispatch where priority is usually given to the VRES because of its low cost and non-dispatchability, but can also increase the strain on the regulation unit because VRES does not actually follow the load [15]. For an EES system used for this purpose, ramp-rate requirements are less important than stored energy and power capacity; a 0.3 to 1 MW/s could be sufficient [103]. In order to be profitable when participating in electricity markets, energy must be stored and charged/discharged over periods of hours to justify the use of EES. The amount of EES required to manage generation-forecasting errors is 2 to 6% power (6-10% energy) of the wind-rated capacity for a 20% wind-penetration level, and 3 to 8% (10-15% energy) for 30% wind penetration; penetration is defined as the wind capacity over the system peak demand [14,15]. These results were drawn from the calculation methodology in [16], which evaluates the need for back-up power requirements based on unforcasted load and wind variations in addition to generator-forced outages to fulfill the reliability criterion. By reviewing the current energy-storage technologies, PHS might be the most economical for energy management, followed by CAES. Also, sodium-sulphur batteries are suitable for this application as they have approximately 7 hours of storage at rated capacity, and are gaining popularity in the market.
4.1.4 Unit commitment
For timescales of hours to days, generation units need to be committed to meet forecasted load. Operating reserves, generally about 3 to 10% of system load, are normally available to support the system against unexpected supply-demand mismatches. The difficulty of forecasting macroscale VRES variations complicates the issue of determining which generators should be committed for certain time periods, and as a result, there needs to be more back-up power to compensate for the uncertainty. However, because a large wind system will always produce at least some power, the reserves do not need to be matched on a one-to-one basis. The addition of VRES, especially at high penetration levels, decreases overall system efficiencies. This is because dispatchable plants cannot operate constantly at their most efficient output as they have to provide the system with more spinning reserves [36].
At the unit-commitment timescale, EES for VRES mitigation would be beneficial in a deregulated power system when VRES and electricity price variations justify the joint dispatch of VRES and EES [34,105–107]. The added value of joint operation between a 10 MW wind farm and a 10 MW/100 MWh EES is estimated to be approximately ![]() 62,500/year (12.5 %) for energy arbitrage under uncertainty in wind production [108]. Currently, pumped hydro storage and compressed air energy-storage systems are used for this application, but it is also possible for some large ESS with a high energy to power ratio, such as sodium sulfur batteries, to be used.
62,500/year (12.5 %) for energy arbitrage under uncertainty in wind production [108]. Currently, pumped hydro storage and compressed air energy-storage systems are used for this application, but it is also possible for some large ESS with a high energy to power ratio, such as sodium sulfur batteries, to be used.
4.1.5 Seasonal storage
The cost of a large seasonal energy storage may not justify the benefits due to the diminishing marginal returns. In other words, after a certain amount of installed capacity, EES used for multiple purposes (e.g., transmission deferral and renewables capacity firming) may lose the incremental benefit of one of its purposes. For applications in seasonal storage, large-energy capacity and low self-discharge are necessary, power density and cycle efficiency are moderately important, and access time and ramp rates bears little significance. For this application, only PHS, flow batteries, CAES, and hydrogen are technically viable. However, PHS has such low energy density that seasonal storage may cause unacceptable changes to water levels in the storage reservoirs, and hydrogen storage may be unacceptable due to its very low 30-40% cycle efficiency [95,109,110].
4.2 Managing the Distributed Nature of VRES
A well-placed EES system can mitigate many of the issues caused by distributed VRES [84,100,111]. For example, an on-site SMES can improve a wind farm by stabilizing voltage fluctuations, reducing flicker, and preventing wind-farms from tripping during a temporary fault in the grid, thus allowing continued wind farm operation [112]. However, to be a viable option in distributed VRES applications, a EES system needs to be scalable and modular to accommodate for various size requirements from a few kW for rooftop solar power to multiple MW for wind farms. Ideally, distributed EES systems should also require low maintenance and have a long life to decrease costs associated with replacements, maintenance, and operations. Acceptable choices are capacitors, flywheels, SMES, and most batteries (except lead-acid batteries). Sodium-sulphur batteries are the most suitable for distributed VRES management according to [100]. The other EES technologies are undesirable for various reasons, such as PHS and CAES are site-specific and have very low energy density; lead-acid batteries have low cycle life and need regular maintenance; and finally, it is difficult to incrementally add hydrogen storage, especially underground, because of cost.
Note that many areas with rich wind resources are not readily connected to high-voltage transmission systems. It is estimated that it costs between 200-1,000![]() /kW to build and upgrade transmission to areas with high VRES potential [113,114]. On the other hand, the value of deferring transmission would have an estimated benefit of approximately
/kW to build and upgrade transmission to areas with high VRES potential [113,114]. On the other hand, the value of deferring transmission would have an estimated benefit of approximately ![]() 500/kW, and could be as high as
500/kW, and could be as high as ![]() 1,200/kW if the energy can be transported to shave peak loads at different locations [115].
1,200/kW if the energy can be transported to shave peak loads at different locations [115].
4.3 EES Development Potential
While world resource consumption and availability set the boundaries of possible EES developments, technological inertia and VRES growth rates favor the growth of certain technologies over others. The Earth has a limited quantity of minerals and resources, and some sparse metals are becoming more difficult to extract. Data for extraction rates, reserves, and reserves base for 86 metals and minerals are found in ([116]). Mineral extraction for EES depends on several quantities. Reserves, which are currently the economically extractable resources, limit short-term EES production. The reserves base, which is the amount of mineral ores (excludes saltwater) discovered and technologically extractable, may be extracted if the demand and pricing of EES is favorable to its production. Finally, the remaining undiscovered reserves may set limits to the total possible development of certain EES types. As resources are discovered and mining technology is improved, the price and demand of metals will change and affect EES development.
Metals that are both necessary and irreplaceable for a specific EES system are shown in Table 1.4, along with available reserves. For example, zinc metal, which is needed to produce Zinc-Bromine batteries, is expected to last between 35 to 45 years at the current rate of consumption [117]. Conversely, EES technologies with high material substitutability (PHS, CAES, flywheels, capacitors, and SMES) are not at risk of a shortage since the choice in suitable materials is more flexible. However, an EES technology should not be discounted as an option solely because of lack of alternatives, as the size of the reserves and the world consumption rates may indicate that a mineral will still be available for an extended period [116]. It is possible to produce lithium, sodium, vanadium, and platinum for 150 or more years at current resource-consumption rates. However, ZBR batteries and lead-acid batteries may face supply shortage, as there would only be approximately 20 years of available supply reserves for zinc and lead. This would indicate that these are not feasible options for VRES storage in the long run. Furthermore, using scarce resources for EES will impact their long-term availability. At present, both the resources and consumption rates for lithium and platinum are small, and could last for 150 to 200 years, but any increase in consumption rates will substantially decrease its available time frame. To ensure sustainable usage, metal recycling will play an important factor in the future.
Table 1.4
World metals availability for EES [115]
| Metal | EES Usage | Reserves (kilotons) | Yearly use (kilotons) | Years left (constant usage) |
| Bismuth | SMES | 320 | 5.8 | 55.2 |
| Barium | SMES | 190000 | 7770 | 24.5 |
| Copper | SMES | 550000 | 15700 | 35.0 |
| Lead | Lead-Acid, SMES | 79000 | 3800 | 20.8 |
| Lithium | Lithium-ion | 4100 | 27.4 | 149.6 |
| Magnesium | SMES, Fuel Cell | 808 | > 1000 | |
| Nickel | NiCd, Fuel Cell | 70000 | 1610 | 43.5 |
| Palladium and Platinum | Fuel Cell | 80 | 0.41 | 197 |
| Sodium | NaS | 3300000 | 4000 | 825 |
| Strontium | SMES | 6800 | 512 | 13.3 |
| Titanium | Flywheel, Fuel Cell | 5280 | 166 | 31.8 |
| Vanadium | VRB | 13000 | 60 | 216.7 |
| Yttrium | SMES | 540 | 8.9 | 60.7 |
| Zinc | ZBR | 180000 | 11300 | 15.9 |
| Zirconium | Fuel Cell | 51000 | 1360 | 37.5 |
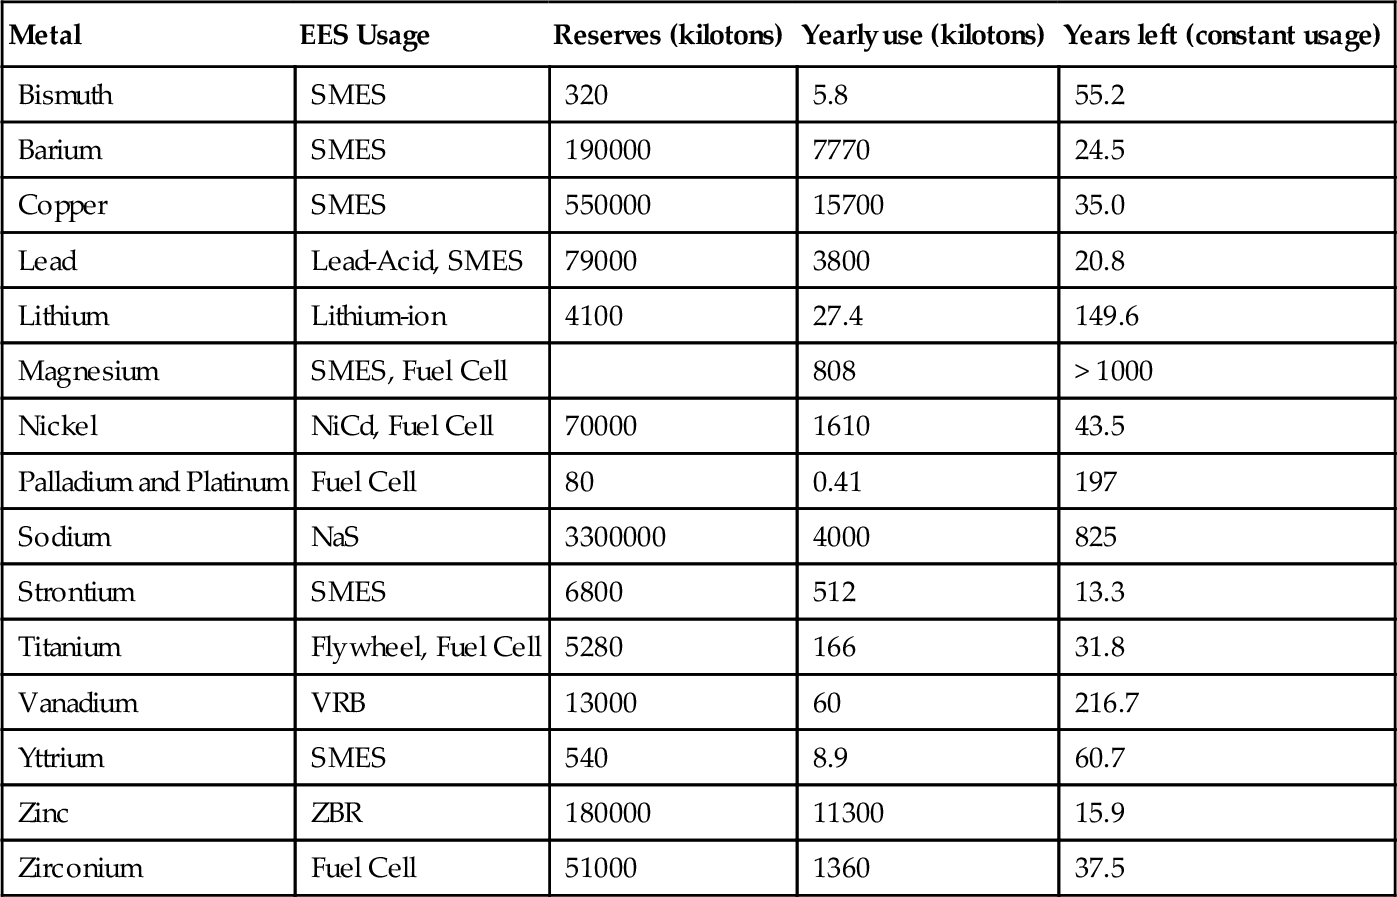
Table 1.2 qualitatively shows the technical maturity achieved by each technology based on four criteria, namely, penetration of the technology, peer review, age of the technology, and quantity of research. By considering capital cost, cycle efficiency, and cycle life in Tables 1.2 and 1.3, a trend shows that technology maturity is inversely proportional to cost, potentially due to mass production and the learning effect.
Research and development on EES technologies is driven by the expected increase in EES demand for mitigating the effects of VRES. In the narrowing window of opportunity to solve the VRES variability issues, it is not necessarily the most suitable EES that will be used, but rather the most competitive when VRES variability becomes a critical issue. Depending on when VRES gains enough penetration to become a critical issue, any SMES, flywheel, sodium-sulphur batteries, or lead-acid batteries, may be used for power-quality and grid-stabilization applications. Timing depends on many factors, and may change from one location to the next. A weak grid with rapid VRES generation-growth rates in turbulent areas will more likely favor mature technologies, whereas a strong grid that can absorb VRES variations and afford to delay EES installations will more likely to favor the best technology.
5 Conclusion
In this chapter, an updated review of the state of technology and installations of several EES technologies were presented, and their various characteristics were analyzed. The analyses included their storage properties, current state in the industry, and feasibility for future installation.
Although EES technologies are expensive, large-scale VRES integration would be a more difficult challenge without it. At low levels of VRES penetration in a strong grid, electricity storage is not crucial, but as load growth congests the grid and VRES penetration increases, the strategic placement of EES may be more viable than the construction of new transmission and generation capacity.
To manage VRES variations, flywheels, capacitors, and batteries are most suitable for maintaining power-quality and grid, stability applications. Sodium-sulphur batteries are economically feasible for the regulation timescale, and pumped hydro storage for the load-following and unit-commitment timescales when good reservoir locations are available. For seasonal storage, compressed air energy storage and flow batteries seem promising.
To account for the distributed nature of VRES, capacitors, flywheels, superconducting magnetic energy storage, and most batteries (except for lead-acid) are suitable because they are scalable, modular, durable, and low maintenance.
Long-term growth of certain EES can be promoted or impeded by supply shortage. Compressed to air energy storage, flywheels, capacitors, superconducting magnetic energy storage, sodium-sulphur batteries, and vanadium redox batteries have the potential to continue growing without facing supply shortages. However, ZBR and lead-acid batteries will face a supply limit at the current extraction rates.