
Potential of Sodium-Sulfur Battery Energy Storage to Enable Further Integration of Wind
Saurabh Tewari Electrical & Computer Engineering, University of Minnesota Twin Cities, Minneapolis MN 55455.
Abstract
Wind generation is the leading alternative for environmentally responsible power generation and for energy independence in the future. However, wind power output cannot be controlled same as conventional generation, and wind is not necessarily available to serve peak load. In this chapter, the use of a Sodium Sulfur battery directly coupled with a wind farm to provide generation shifting for serving peak demand and for limiting the wind farm power output ramp-rate is discussed. Results from field operation of a 1 MW, 7.2 MWh Sodium Sulfur battery coupled with an 11.55 MW wind farm were provided to validate the battery’s ability to successfully carry out both the tasks. It is shown that the two tasks could be combined to achieve maximum benefit. Value addition from shifting wind generation to on-peak is calculated and the optimal ratio storage to wind ratio is discussed.
Acknowledgments
Gratitude is due to Xcel Energy for providing the necessary framework, data, and financial support. Matching financial support from the Initiative for Renewable Energy and the Environment (IREE), University of Minnesota, is also gratefully acknowledged.
1 Introduction
According to the data from the International Energy Agency [1] and the U.S. Energy Information Administration [2], fossil fuels-based electricity generation constitutes about 65 percent or more of the total installed capacity worldwide and in the countries with the highest production, namely China, U.S, and Japan. Among the fossil fuels used in electric-power generation, coal and natural gas are by far the dominant sources. Extraction and combustion of these fuels has been conclusively linked to climate change [3]. Coal is especially hazardous since it also presents the risk of heavy metal pollution, radioactive pollution, and the release of nitrogen and sulfur oxides among other pollutants. Natural gas, while cleaner than coal, is imported by many countries and therefore the prices and availability are subject to geopolitical considerations.
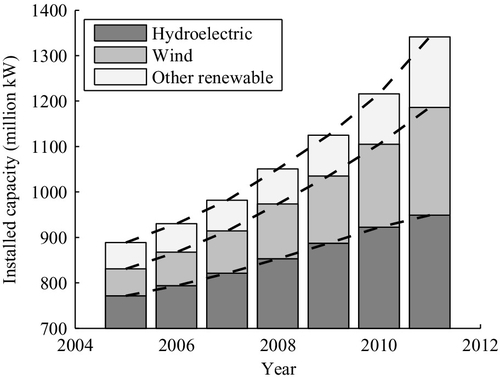
Wind generation is among the leading alternatives for environmentally sustainable electricity and for energy independence, and is second only to hydroelectric power in terms of installed capacity [1,2]. In addition, the growth in the installed wind power is much faster than hydroelectric, and wind has nearly tripled in less than a decade (Figure 3.1). Furthermore, this growth is not expected to slow down in view of the interest from major economies of the world [4,5].
Estimates by the Energy Information Administration in Table 3.1 [6] indicate that the levelized cost of new wind generation is lower than any form of coal-based generation and lower than all fossil fuel generation equipped with carbon control and sequestration (CCS). These estimates also consider the transmission investment necessary for bringing the wind-generated energy to the load centers. These estimates do not include the potential production/investment tax credits that the new wind farms might receive that would further lower the cost of wind-generated power. It is notable that the levelized cost of wind generation is also lower than other renewable generation.
Table 3.1
U.S. average levelized costs (2011 $/MWh) for plants entering service in 2018 [6]
| Dispatchable Technologies | Non-Dispatchable Technologies | ||
| Conventional Coal | 100.1 | Wind (onshore) | 86.6 |
| Advanced Coal with CCS | 135.5 | Solar PV | 144.3 |
| Advanced Combined Cycle | |||
| Natural Gas with CCS | 93.4 | Hydroelectric | 90.3 |
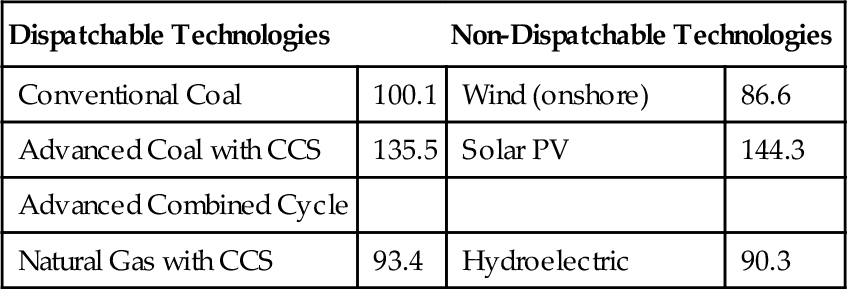
In Table 3.1, wind generation is listed as a “non-dispatchable technology.” The technical community in general recognizes that wind power is not as dispatchable as traditional generation since the output of a wind farm cannot always be forecast precisely or controlled over the operating range at will. Traditional power system includes intermediate generation, peaking generation, and operating reserves to compensate for the variability in load and contingencies. At lower penetrations of wind, the unforeseen variations in wind power can be compensated by the existing devices on the system. At higher levels of penetration, however, the management of wind generation either necessitates additional transmission and/or reserves, or places extra burden on the existing infrastructure [7–9]. Denmark, Spain, and Ireland are among the countries with the highest penetration of wind [1,2]. Table 3.2 shows the installed wind in these countries along with their electricity imports for the year 2011. While the net imports are small for all three, Denmark exchanges significantly higher power with its neighbors in proportion to its total generation. Indeed, the interconnections with Norway, Sweden, and Germany have facilitated the integration of large amounts of wind in Denmark [10].
Table 3.2
Electricity imports and net imports for countries with high wind penetration for the year 2011
| Installed wind (% of total capacity) | Generation (billion kWh) | Imports (billion kWh) | Net imports (billion kWh) | |
| Denmark | 29.25% | 33.72 | 11.69 | 1.32 |
| Spain | 21.28% | 276.83 | 7.93 | -6.09 |
| Ireland | 18.83% | 26.04 | 0.73 | 0.49 |

The Spanish system is weakly interconnected to the rest of Europe and the Irish system is for the most part islanded. The variability and forecast errors have been managed using operating reserves on these systems, and instances where wind generation had to be curtailed for security reasons have been recorded in both these systems [10].
2 Energy storage as an alternative
The Danish system is unique since it enjoys strong interconnections to the larger systems in its vicinity. Furthermore, the significant hydroelectric power in the Nordic countries provides a simple solution to balance the generation and the load [10]. In general, to support high amounts of wind on the system, a flexible power system is necessary that can adjust quickly to the unforeseen variations in generation and load [4,11–13]. Traditionally, flexibility is achieved using operating reserves. Energy storage is an alternative toward adding flexibility to the current power system. There are certain advantages that are unique to energy storage compared to classical generation used for load following and operating reserves:
1. Avoided fuel cost and pollution from less efficient but fast-acting peaking generation; use of rigid but efficient units to serve baseload while avoiding wind curtailment.
2. Eliminating the need for generators to compensate for fast variations that could otherwise cause rotor fatigue and impose additional costs.
3. Guaranteed availability of wind generation to serve peak load, establishing wind as a viable peak load resource/enhancing the dispatchability of wind.
Making wind generation available to serve the peak load using energy storage is equivalent to load leveling from the perspective of the remainder of the generation. Therefore, further benefits like deferred transmission and capacity upgrade, reduced T&D losses, and robustness could be realized [14–18].
2.1 Energy storage in electricity markets
The discussion above considers energy storage coupled directly to wind generation. Power systems worldwide are moving toward energy markets to efficiently and economically balance supply and demand of electric power. It is highly likely that different entities would own wind farms and energy storage, interacting only through the market. Even in this case, energy storage can facilitate the integration of wind by the following mechanisms:
1. The locational marginal prices (LMPs) in the energy markets are expected to exhibit higher variability with a higher amount of wind generation on the system [19]. In the absence of enough transmission, the LMPs could become unstable - negative LMPs have been observed in regions with high wind generation but insufficient transmission [20]. Market participants that own energy storage can take advantage of low LMPs during periods of high generation and low demand to charge the storage and discharge/sell energy when the demand is high.
This action will have a stabilizing effect on the LMPs, and will also mitigate the need for transmission upgrade imposed by additional wind.
2. Higher amount of wind on the system causes the operating reserve requirement to go up. In energy markets, this increased requirement would manifest as higher prices for reserves. Energy storage can take advantage of these higher prices while meeting the increased demand for operating reserves, thereby aiding the integration of wind [21–24].
Therefore, energy storage, whether coupled to wind generation directly, or interacting through energy markets has the potential to aid higher penetration of wind.
3 Sodium-Sulfur battery energy storage
3.1 Principle
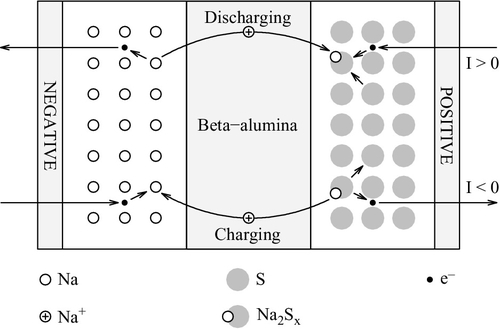
Sodium-sulfur battery operates on the principle of a reversible redox reaction between sodium and sulfur. The operating temperature of this battery is ~ 300 °C and the sodium and sulfur electrodes are molten during operation. The electrolyte is solid beta-alumina of sodium-ion conductive ceramic [25]. The chemical reaction governing the operation of the battery is:
![]()
Figure 3.2 illustrates the flow of the ions and electrons during the charging and discharging processes (illustration adapted from [25]). NGK Insulators, Ltd. is the prominent manufacturer of sodium-sulfur batters. Per NGK Insulators, the salient features of this battery technology are:
1. 3 to 5 times the energy density of lead-acid batteries
2. High pulse power capability and prompt response
3. Long calendar and cycle life: 15 years and 4500 cycles for a 90% depth of discharge
4. 85% round-trip DC efficiency
3.2 Target applications and existing installations
The superior efficiency, energy density, and cycle life of sodium sulfur-battery make it suitable for grid applications. Selected applications from [25] are summarized here:
1. Load-leveling and peak shaving
a. Smoothing the daily load profile
b. Avoiding higher tariffs at peak loads by utilizing stored energy
2. Transmission/distribution/generation asset optimization
a. Relieve transmission congestion
b. Avoid/defer transmission upgrade
c. Reduce generator cycling
3. Ancillary services
b. Frequency regulation
c. Black start
d. Volt-Ampere reactive support (using power electronic interface)
4. Renewable resource optimization
a. Short-term (second to minutes) smoothing to control ramp rates of renewable generation to comply with the grid code
b. Renewable resource generation shifting from off-peak to on-peak intervals
c. Hedging against forecast errors to avoid penalties in the market
d. Avoid output curtailment during off-peak intervals
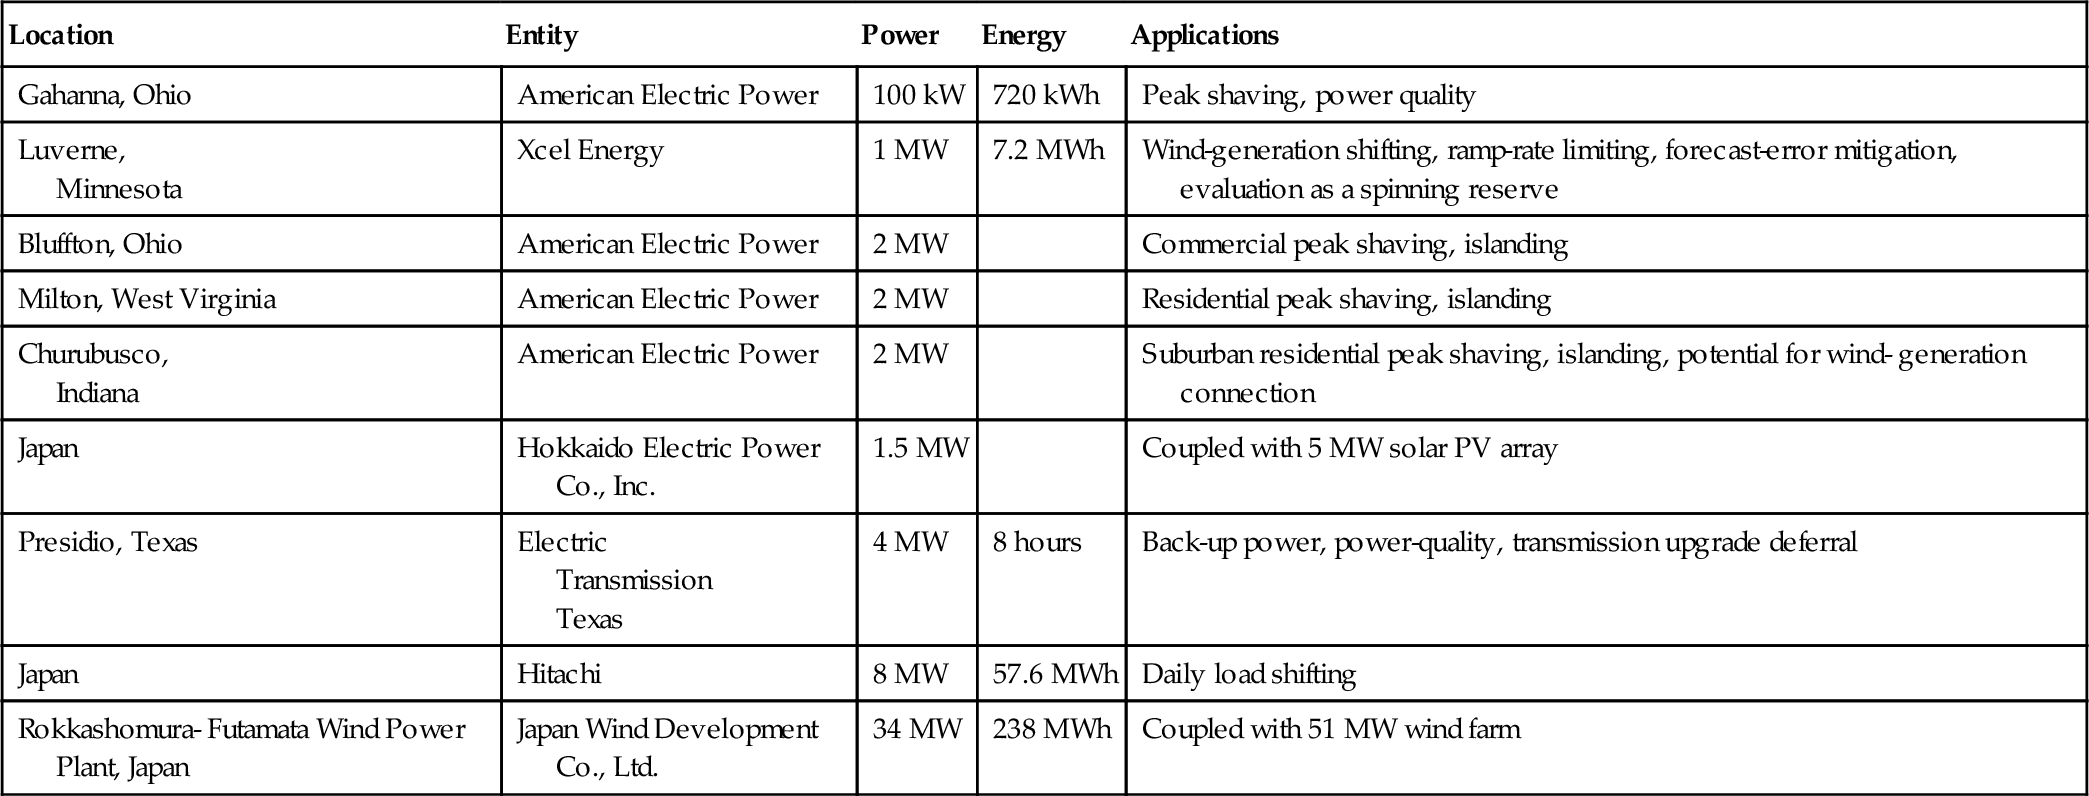
Table 3.3 lists some of the Sodium-Sulfur battery energy storage installations in the U.S. and Japan [25–29].
Table 3.3
Examples of Sodium sulfur-battery installations in the U.S. and Japan
| Location | Entity | Power | Energy | Applications |
| Gahanna, Ohio | American Electric Power | 100 kW | 720 kWh | Peak shaving, power quality |
| Luverne, Minnesota | Xcel Energy | 1 MW | 7.2 MWh | Wind-generation shifting, ramp-rate limiting, forecast-error mitigation, evaluation as a spinning reserve |
| Bluffton, Ohio | American Electric Power | 2 MW | Commercial peak shaving, islanding | |
| Milton, West Virginia | American Electric Power | 2 MW | Residential peak shaving, islanding | |
| Churubusco, Indiana | American Electric Power | 2 MW | Suburban residential peak shaving, islanding, potential for wind- generation connection | |
| Japan | Hokkaido Electric Power Co., Inc. | 1.5 MW | Coupled with 5 MW solar PV array | |
| Presidio, Texas | Electric Transmission Texas | 4 MW | 8 hours | Back-up power, power-quality, transmission upgrade deferral |
| Japan | Hitachi | 8 MW | 57.6 MWh | Daily load shifting |
| Rokkashomura- Futamata Wind Power Plant, Japan | Japan Wind Development Co., Ltd. | 34 MW | 238 MWh | Coupled with 51 MW wind farm |
3.3 The Sodium-Sulfur battery at Luverne, Minnesota
In 2008, Xcel Energy, a major U.S. utility installed a 1 MW, 7.2 MWh sodium-sulfur battery in Luverne, Minnesota next to an 11.5 MW wind farm owned by Minwind LLC. This project was titled the Wind-to-Battery (W2B) project with an aim “to evaluate the overall effectiveness of sodium-sulfur (NaS) battery technology in regards to its ability to facilitate the integration of wind energy onto the grid. As part of this demonstration project, Xcel Energy is investigating the ability of the technology to provide system benefits, the cost-effectiveness of the storage device, and methods and procedures to evaluate other types of energy storage technologies in the future” [27]. Xcel Energy’s results from this project have been published in a publicly available data collection and analysis report [27].
The University of Minnesota was a partner in this project and was provided access to the data from the wind farm and the battery. Furthermore, the initial framework for the analyses presented here was set by Xcel Energy. However, the analyses were conducted solely by the University of Minnesota and Xcel Energy neither endorses nor denounces any opinions made or information presented.
3.3.1 Emulation of different storage-to-wind ratios
Xcel Energy had a wind-scaling factor incorporated into the Power Conversion System (PCS) software to vary the amount of wind power the PCS was effectively exposed to [27]. Varying the effective wind generation for the same battery amounts to varying the storage-to-wind ratio. The field data included in this analysis had the scaling factor set by Xcel Energy. In simulations, this was replicated by multiplying the wind-generation data by a constant.
4 Generation shifting
In this section, the ability and the value of the sodium-sulfur battery in shifting wind-generated energy from off-peak hours to on-peak hours is evaluated. Results from the actual field operation are provided first to establish the ability of the battery to shift the generation from off-peak to on- peak (Figure 3.3).
Having established the generation-shifting capability of the battery, simulation using long-term data is used to draw further conclusions: the wind-farm power output is scaled to simulate scenarios with different storage-to-wind ratios, with the restriction that the battery could be charged using wind generation only. Histograms of the daily maximum state of charge (SOC) are plotted.
Finally, the revenue and the savings generated by the battery are calculated for all scenarios, followed by a discussion on the optimal storage-to-wind ratio.
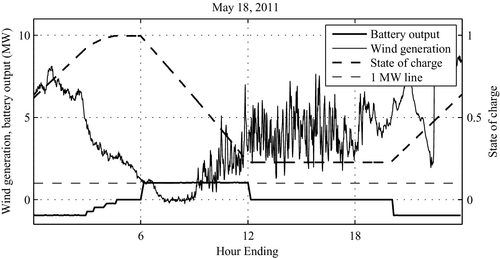
Figure 3.3 shows the wind generation at the Minwind wind farm along with the battery-power output and SOC for May 18, 2011. The wind generation varies throughout the day and is generally higher during the night. It drops to zero for approximately 2 hours (~ 8:00 AM - 10:00 AM). The battery is charged during early AM and late PM, a period typically associated with light loads and is discharged between early morning and noon, a period typically associated with load ramp-up and peak load.
While sufficient wind generation might not always exist to charge the battery, in this specific example chosen for illustration, the wind generation during the battery charging period always exceeds 1 MW, the rated power of the battery. Therefore, this example operating day proves that provided enough wind generation exists to charge the battery during off-peak hours, the battery can successfully shift off-peak energy to on-peak. Having established this, we are ready to move to simulation using long-term data to analyze how often enough wind generation is available, and to calculate the value added by shifting wind generation to on-peak intervals.
4.1 Charging/discharging simulation
The following data and parameters were used for simulating wind-generation shifting:
1. 1 MW, 7.2 MWh battery with 85% round trip efficiency: the losses were assumed to be geometric between charging and discharging and a one-way efficiency of ![]() was used.
was used.
2. Wind-generation data from the Minwind wind farm for the year 2007. The data was available for 360 days and was scaled to generate scenarios corresponding to wind farms rated at 11.55 MW, 10 MW, 5 MW, 2.5 MW, and 1 MW for the same 1 MW battery.
3. Day Ahead and Real Time Locational Marginal Prices (DALMPs, RTLMPs) for the MINN hub of Midcontinent Independent System Operator (MISO) [30] for the year 2009.
At the time of this analysis, year-long generation data was available only for the year 2007 but the price data was available for 2009 and later. Therefore, the generation data was treated as if it were from the year 2009 under the assumption that there was no significant change in the wind regime from the year 2007 to the year 2009.
4.1.1 Charging/discharging intervals
For this analysis, the minimum SOC was set at 10%, which corresponds to a cycle life of 4500 cycles. At this minimum SOC and the assumed efficiency, and the MWh/MW ratio, the battery would output its rated power for about 6 hours after being charged for a little under 8 hours.
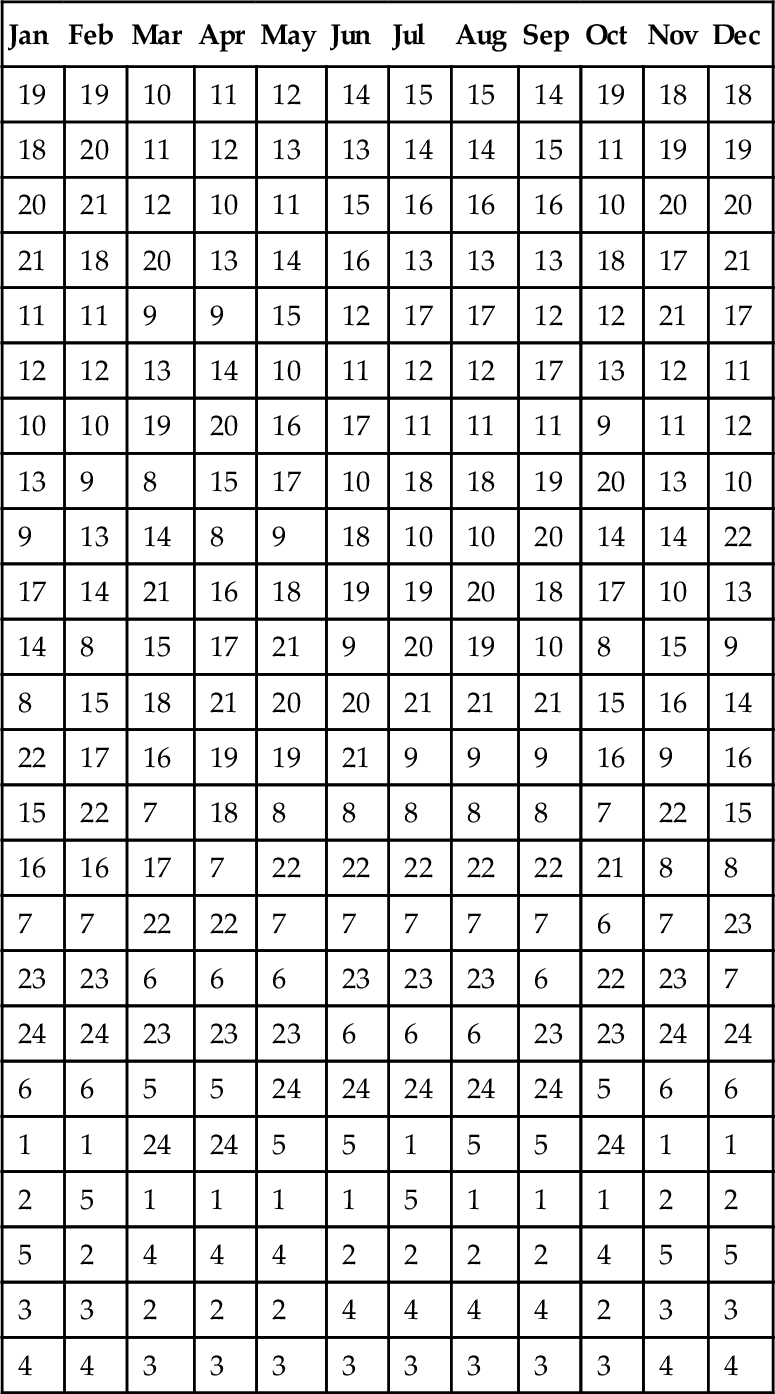
The 8 designated charging and 6 designated discharging hours were chosen on a monthly basis using the load data from Xcel Energy’s territory under MISO footprint for the year 2009. Figure 3.4 shows the monthly average load for a winter month and a summer month. Table 3.4 shows the hours arranged in descending order of demand: the designated charging and discharging hours are selected from this table.
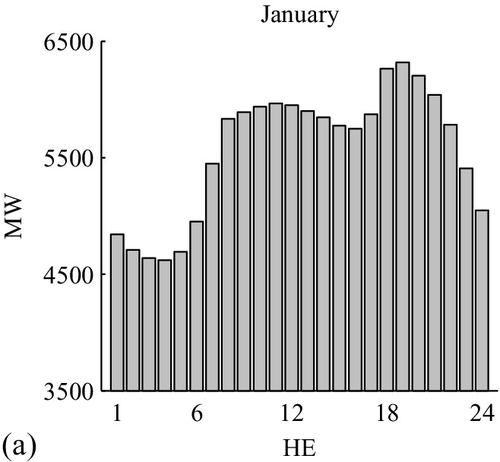
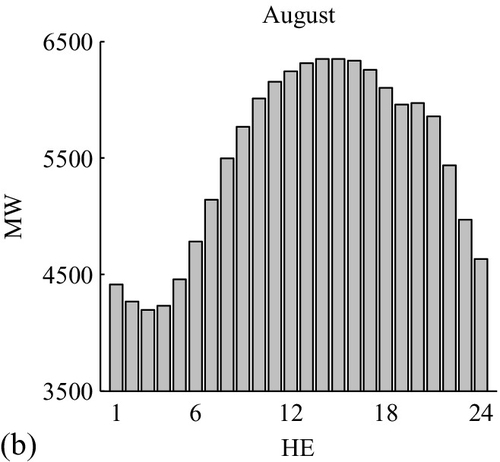
Table 3.4
Hours arranged in descending order of demand for the year 2009
| Jan | Feb | Mar | Apr | May | Jun | Jul | Aug | Sep | Oct | Nov | Dec |
| 19 | 19 | 10 | 11 | 12 | 14 | 15 | 15 | 14 | 19 | 18 | 18 |
| 18 | 20 | 11 | 12 | 13 | 13 | 14 | 14 | 15 | 11 | 19 | 19 |
| 20 | 21 | 12 | 10 | 11 | 15 | 16 | 16 | 16 | 10 | 20 | 20 |
| 21 | 18 | 20 | 13 | 14 | 16 | 13 | 13 | 13 | 18 | 17 | 21 |
| 11 | 11 | 9 | 9 | 15 | 12 | 17 | 17 | 12 | 12 | 21 | 17 |
| 12 | 12 | 13 | 14 | 10 | 11 | 12 | 12 | 17 | 13 | 12 | 11 |
| 10 | 10 | 19 | 20 | 16 | 17 | 11 | 11 | 11 | 9 | 11 | 12 |
| 13 | 9 | 8 | 15 | 17 | 10 | 18 | 18 | 19 | 20 | 13 | 10 |
| 9 | 13 | 14 | 8 | 9 | 18 | 10 | 10 | 20 | 14 | 14 | 22 |
| 17 | 14 | 21 | 16 | 18 | 19 | 19 | 20 | 18 | 17 | 10 | 13 |
| 14 | 8 | 15 | 17 | 21 | 9 | 20 | 19 | 10 | 8 | 15 | 9 |
| 8 | 15 | 18 | 21 | 20 | 20 | 21 | 21 | 21 | 15 | 16 | 14 |
| 22 | 17 | 16 | 19 | 19 | 21 | 9 | 9 | 9 | 16 | 9 | 16 |
| 15 | 22 | 7 | 18 | 8 | 8 | 8 | 8 | 8 | 7 | 22 | 15 |
| 16 | 16 | 17 | 7 | 22 | 22 | 22 | 22 | 22 | 21 | 8 | 8 |
| 7 | 7 | 22 | 22 | 7 | 7 | 7 | 7 | 7 | 6 | 7 | 23 |
| 23 | 23 | 6 | 6 | 6 | 23 | 23 | 23 | 6 | 22 | 23 | 7 |
| 24 | 24 | 23 | 23 | 23 | 6 | 6 | 6 | 23 | 23 | 24 | 24 |
| 6 | 6 | 5 | 5 | 24 | 24 | 24 | 24 | 24 | 5 | 6 | 6 |
| 1 | 1 | 24 | 24 | 5 | 5 | 1 | 5 | 5 | 24 | 1 | 1 |
| 2 | 5 | 1 | 1 | 1 | 1 | 5 | 1 | 1 | 1 | 2 | 2 |
| 5 | 2 | 4 | 4 | 4 | 2 | 2 | 2 | 2 | 4 | 5 | 5 |
| 3 | 3 | 2 | 2 | 2 | 4 | 4 | 4 | 4 | 2 | 3 | 3 |
| 4 | 4 | 3 | 3 | 3 | 3 | 3 | 3 | 3 | 3 | 4 | 4 |
4.1.2 Effect of storage-to-wind ratio on the battery SOC
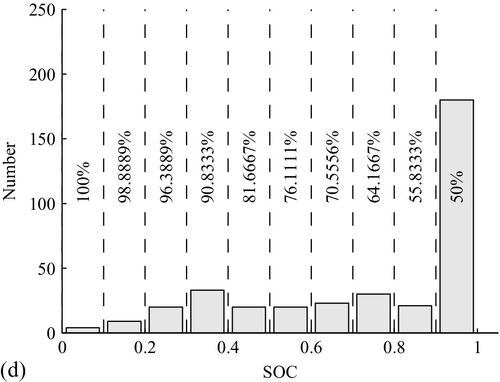
Figure 3.5 shows the histograms of daily maximum SOC attained for different scaling factors used to simulate different ratings of the wind farm for the same battery. It is seen that the percentage of time the battery attains its 100% SOC falls as the storage-to-wind ratio increases. This is expected because average wind generation during any given hour is much lower than the rated farm output: the effect is more noticeable as the storage rating approaches rated farm output (Figures 3.5(d), (e)) whereas it is less pronounced for lower storage-to-wind ratios (Figures 3.5(a), (b)).


4.2 Analysis of the value added by storage
The value in shifting wind generation is composed of several components:
1. Revenue from discharging the battery at peak load: the electricity prices tend to follow the load and it is reasonable to expect that prices would be higher at peak load.
2. Savings from avoiding costlier generation for serving peak load.
3. Inherent value in making wind generation available on-peak:
a. Avoided greenhouse emissions from fossil fuel-based peaking generators, avoided generator cycling, and earned carbon credits
b. Maximization of the returns from the investment in wind power by avoiding curtailment
c. Qualification of wind generation as a reliable system resource with guaranteed on- peak availability
4. Secondary benefits from storage: energy storage installed primarily to shift wind generation can simultaneously provide other benefits:
a. Up/down regulation capability [23,24,31]
b. Ramp-rate limiting (discussed later)
c. Wind-power forecast error mitigation [27,32,33]
It is not straightforward to attach dollar values of some of the value propositions above (e.g., environmental benefits), and some deserve independent analysis that has been reported in literature. For the purpose of this section, dollar values from the following propositions would be considered:
1. Transactions in the energy market
2. Avoided cost of peaking generation
3. Value in letting wind generators operate during low load, quantified in terms of the Production Tax Credit (PTC)
It should be noted that the type of transactions in the energy market considered in this analysis are based on maximizing the availability of wind generation on-peak. Considered on its own, energy storage might benefit from trading strategies developed specifically to maximize the revenue. A few of the strategies proposed in literature can be found in [27,34–37].
4.2.1 Procedure
The battery is offered as a load for the 8 designated charging hours and as a generator for the 6 designated discharging hours:
1. The asset owner (AO) pays the Day Ahead Locational Marginal Price (DALMP) for the charging period and receives the DALMP for the discharging period.
2. If the battery attains 100% state of charge (SOC) before the end of the designated charging period, then the energy that has been paid for at the current DALMP is sold in the spot market at the current Real Time Locational Marginal Price (RTLMP).
3. Since the battery is allowed to charge only from wind generation, in the case of a generation shortfall the energy paid for at the current DALMP is sold at the current RTLMP in the spot market similar to above.
4. In the case of a generation shortfall as described above, the battery will not reach a 100% SOC necessary to meet the commitment made for the designated discharging period: in such case, the deficit energy is purchased in the spot market at the current RTLMP.
5. For every MWh generated that goes toward charging the battery, the total value of generation shifting is augmented by a PTC for wind generation. The value of PTC available from EIA (U.S. Energy Information Administration, defined in the Introduction) at the time of this analysis was 19 $/MWh in 2003 dollars that was adjusted to 22.23 $/MWh in 2009 dollars using an inflation rate of 1.17 from the Bureau of Labor Statistics (BLS)[38].
6. Finally, it is assumed that the peak generation is served by combustion turbines in the absence of stored energy. Therefore, the savings correspond to the difference between the levelized cost of wind generation and combustion turbine-based generation for every MWh of on-peak load served.
a. At the time of this analysis, the levelized costs of generation available from EIA were 48 $/MWh for wind and 70 $/MWh for combustion turbines in 2003 dollars that were adjusted using the inflation rate from the BLS [6] should be referred to for the current estimate of these costs.
b. The levelized cost of wind generation used above does not include the PTC.
Define the following:
| MWh_WIND | Energy generated by wind during designated charging period |
| DA_VOL | Volume committed in the DA (Day Ahead) market |
| E_WIND | Energy supplied by wind generation, to the battery |
| E_PEAK | Energy served by storage at peak load |
| RT_VOL | Adjustments made in RT market |
| E_PEAKmax | Maximum possible energy that could be served by storage on-peak |
| PTC | Production tax credits in 2003 dollars |
| c_WIND | Levelized cost of wind generation in 2003 dollars |
| c_COMB | Levelized cost of combustion turbine generation in 2003 dollars |
| k2003,2009 | Inflation rate |

PTC, c_WIND, c_COMB, and k2003,2009 were taken from EIA and BLS. The rest of the quantities were calculated as follows:
Under the definitions above, the RT_VOL can be written as:

The maximum possible energy that could be served at peak load (E_PEAKmax) is simply 6 MWh for every operating day.
The revenue from the perspective of the battery asset owner can now be calculated as:

The additional savings on the system level by avoiding costlier generation would be:

The total value would be the sum of the revenue and the savings calculated above. Other quantities of interest are: the ratio of generation shifted – the ratio of energy served on-peak against the total wind generation off-peak; the ratio of storage utilized – the ratio of energy served on-peak against the maximum possible energy that could have been served on-peak; and the ratio of value against energy served on-peak. For every MWh served on-peak, the battery incurs loss in its lifetime and in that sense the ratio of value against energy served on-peak could be a measure of the return. The listed quantities can be defined as:
4.2.2 Results
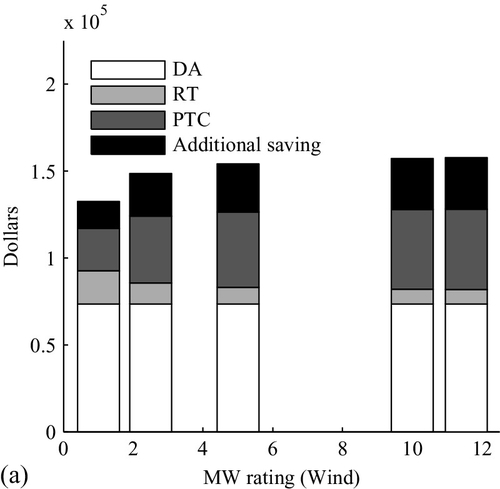
Figure 3.6 shows the positive and negative contributions to the value of generation shifting. Positive contributions are from selling the stored energy in Day Ahead (forward) market during designated discharging, selling excess energy during designated charging in the Real Time (spot) market, Production Tax Credits, and additional savings realized by avoiding costlier generation. Negative contributions are from buying the energy to charge the battery in Day Ahead market during designated charging, and from having to buy energy during designated discharging in event of deficient state of charge.

The net value is the difference between the aggregated positive contribution and aggregated negative contribution. The net value along with the $/MWh served is plotted in Figure 3.7(a). The ratio of generation shifted and the ratio of storage utilized are also plotted alongside in Figure 3.7(b)


4.2.3 Discussion on an optimal storage-to-wind ratio
In this analysis the storage is considered fixed and installed wind is simulated to increase from 1 MW to 11.55 MW. The battery is offered in the Day Ahead market as a generator or load without regard to the installed wind. Therefore, the positive and negative contributions to the value from Day Ahead market are fixed as seen in Figure 3.6. When the installed wind is low, E_WIND, the energy supplied by wind to charge the battery is also low and therefore the RT_VOL during the designated charging period is high. However, with low installed wind it also more likely that the SOC would be deficient (Figure 3.5(e)) and therefore the RT_VOL during designated discharging period is also high – the positive and negative contribution of the Real Time market towards the value of generation shifting is high with low installed wind, most prominently so in the 1:1 storage-to-wind scenario (Figure 3.6). It is not desirable to expose the asset to the Real Time market because of the volatility, and high exposure to Real Time market is a drawback for low installed wind scenarios.
Furthermore, because of low production owing to lower installed capacity, the PTC is naturally lower. So are the additional savings because less on-peak energy is displaced by stored wind energy (Figure 3.6). Consequently, the value of generation shifting is low with lower installed wind as seen in Figure 3.7(a).
Therefore, on the basis of net value addition and exposure to Real Time market it seems that a lower storage-to-wind ratio is favorable.
However, the ratio of shifted generation is significantly better at lower installed wind (Figure 3.7(b)). This is important because the objective is to enhance the on-peak availability of wind. A larger ratio of shifted generation means higher contributions from the value propositions not considered, e.g., reduced greenhouse emissions and qualification of wind as a reliable resource.
Finally, the value addition per MWh served ($/MWh served) seems to be fairly similar for all scenarios except the 1:1 case in Figure 3.7(a). If the 1:1 case is not considered any further because of a significantly lower value addition in the absolute terms and in terms of per MWh served, the comparison is between the other four scenarios.
The 5 MWh installed wind scenario is comparable to even higher wind scenarios in its low exposure to RT market and $/MWh served, with only slightly lower net value addition and approximately double the generation shifting. It seems to be a balanced choice with attractive features of both higher and lower wind scenarios.
The 2.5 MW scenario shifts a significantly higher proportion of wind than the 5 MW scenario at similar $/MWh served but at slightly higher exposure to Real Time market and somewhat lower net value addition. However, it could easily compete if the value from the other propositions is included. Therefore, the truly optimal scenario would be somewhere in the range of 2.5 MW to 5 MW installed wind per MW storage. Alternatively, the optimal ratio of storage to wind for the sole purpose of shifting wind generation is 200 to 400 kW storage per MW installed wind, under the obligation that storage should be offered as a generating resource for 6 peak load hours every day.
5 Ramp-rate limiting
In this section the ability of the sodium-sulfur battery to limit the ramp-rate of the wind farm output is evaluated: variability of wind generation is an often-cited reason for higher reserve requirements as wind penetration increases. The variations in the wind-farm output can be accommodated using other generators, which entails additional costs and pollution as argued earlier. Energy storage is an alternative toward canceling the variations that avoids any additional costs or emissions.
Energy storage could be deployed on a system level as operating reserves or it could be coupled to the wind farm. In this section energy storage is considered directly coupled to the wind-farm and it is shown how it could be used to limit the magnitude of minute-to-minute variations in the wind farm output. The algorithm for limiting the ramp-rate is justified analytically and verified by simulation. Practical considerations based on simulation results are discussed thereafter.
Results from the field operation are provided to validate the simulation model and further conclusions are drawn from simulation using long-term data.
Finally, it is shown using simulation that the two objectives discussed in this chapter, wind-generation shifting and ramp-rate limiting, can be combined for maximum benefit to the system.
5.1 Low-pass filter to limit ramp rate
Let the per-unit wind generation be represented by w:w ∈ [0,1], and the ramp rate of the filtered wind generation by r. Let the time constant of the low pass filter be T. The transfer function of the low-pass filter is:
![]()
![]() us(t) where us(t) is the unit-step function
us(t) where us(t) is the unit-step function
Also:
![]()
The filtered wind-power output is H(s)W(s). Ramp rate r(t) of the filtered output is the derivative of h(t) * w(t), or equivalently R(s) = sH (s)W(s) in the Laplace domain:

Let G(s) = s/(sT + 1). Wind-generation w is the input to the system G and the output is the desired ramp rate r:
From the theory of linear systems:
Since ||w|| ∞ = 1 pu, the absolute ramp-rate of the output is bounded by 2/T, where T is the chosen time constant.
Figure 3.8 shows the block diagram implemented for this mode. Power output equal to the low-pass filtered wind generation less the actual generation is requested from the battery such that the total output is equal to the low-pass filtered generation. In addition, a proportional controller is included to keep the battery SOC from drifting off.
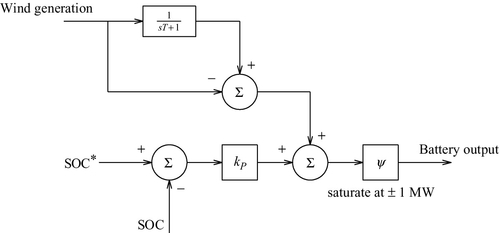
The total power requested from the battery is saturated at ± 1 MW, the rated power of the battery.
5.2 Field results and extended simulation
Figure 3.9 shows field results for ramp-rate limiting for a 16-hour interval on January 31, 2010–February 1, 2010. The "wind scaling factor" was set to ~ 43.3% to emulate a 5 MW wind farm. A time constant T = 1200s was used. It is seen that the total output is much smoother than the generation. Events in which the battery output exceeds its rated limit are also observed. During these events, the battery is unable to compensate for the extreme ramp rates.
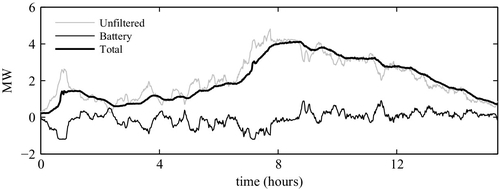
Figure 3.10 shows the minute-to-minute ramp-rates for the wind generation and total output plotted in Figure 3.9. It is seen that the algorithm can effectively limit the ramp rate of wind generation. Simulation using the same wind-generation data and controller settings was also performed and the results were found to agree with the field results.
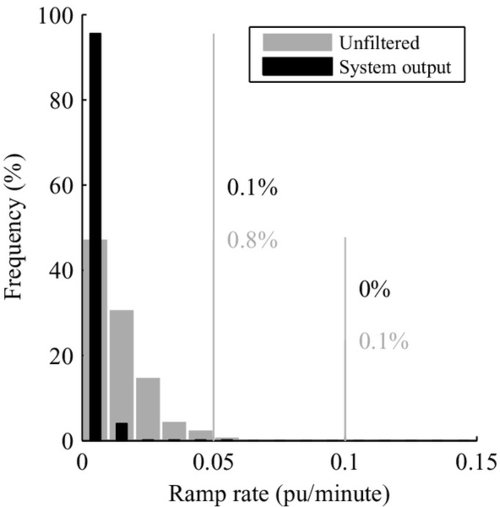
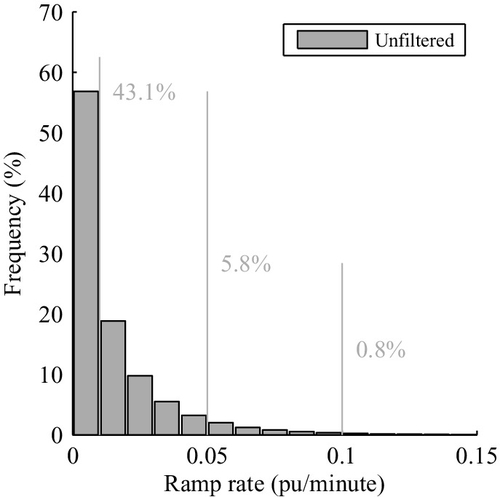
5.3 Simulation results
Having verified that the simulation results match the field results, further conclusions were drawn using year-long data from the wind farm. The unfiltered ramp-rate data is plotted in Figure 3.11. Filtered ramp rates for a 1 MW, 7.2 MWh battery compensating for wind farms rated at 1 MW, 2.5 MW, 5 MW, 10 MW, and 11.55 MW are plotted in Figure 3.12. The ramp rates in Figure 3.12 are plotted as percentage violations of 0.01 pu/min (Figure 3.12(a)), 0.05 pu/min (Figure 3.12(b)), and 0. 10 pu/min (Figure 3.12(c)).
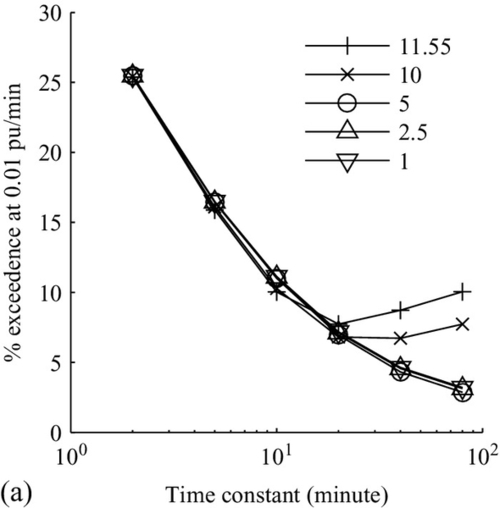


Theoretically, a time constant of 40 minutes or higher should limit the ramp rate to 0.05 pu/min or lower. However, it seems to be the case only for 1 MW and 2.5 MW installed wind cases in Figure 3.12(b). In general, it seen from Figure 3.12 that ramp rates do not decrease monotonically with the time constant; rather than decreasing, the ramp rates start rising with the time constant even though they always stay under the unfiltered ramp rates of Figure 3.11. It is also observed that the unintended behavior with increasing time constant occurs earlier for higher installed wind cases at all ramp-rate limits. The cause for this behavior is the limited MW capability of the battery: the derivation in the last section assumed a linear system, whereas in practice the limited power rating causes a saturation nonlinearity (Figure 3.8).
Therefore, the analytical bound derived earlier alone is not enough to select suitable ramp-rate limiting battery ratings. Simulation results similar to those presented above are necessary to determine the optimal power rating and the optimal time constant. The energy rating (MWh) of the battery is not an important consideration in this mode because the operation is energy neutral for the most part: only the charging/discharging losses require a net energy flow into the battery, which can be handled by the SOC controller.
6 Integrating generation shifting and ramp-rate limiting
Generation shifting, as discussed earlier, moves energy on a scale of hours. Ramp-rate limiting is largely an energy neutral task carried out on a scale of seconds to minutes. It was observed that during ramp-rate limiting, the SOC stays confined in a fairly tight band around its reference value (from ± 1% at lower time constants to ± 10% at higher time constants) for this battery (7.2 MWh/MW). If enough room is left for the SOC to vary during ramp-rate limiting without approaching its bounds, then the reference SOC in Figure 3.8 can be varied slowly to accomplish generation shifting as well. It should be noted that when the battery is charging and discharging under generation shifting, there would be competition between the two objectives and the performance could suffer.
Simulation with the reference SOC replaced by an appropriate SOC profile was carried out and the ramp rates were recorded. Figure 3.13 shows an example with the two objectives combined for a 5 MW installed wind scenario for a (simulated) day in December (the load profile for this month has two peaks similar to Figure 3.4(a), and therefore two discharging periods).


For all the time constants combining the two modes results in some loss in performance. The loss is insignificant at higher limits (0.05 pu/min, 0.1 pu/min) but is noticeable at lower limits (0.01 pu/min). The loss is also insignificant for time constants up to 10 minutes and lower. Simulations suggest that if it is desired to keep the ramp rates under 0.05 pu/min most of the time, then the two functions can easily be integrated. However, if the limit on the ramp rate is tighter, then the generation-shifting specifications need to be relaxed by lengthening the designated charging and discharging periods: for a longer designated charging, the power requirement only to charge the battery would be lower leaving more room for ramp-rate limiting. Because of the presence of a nonlinear saturation element and because of the fact that wind is stochastic as opposed to deterministic, the optimal solution can be more easily determined by simulation with the following parameters available for tuning:
2. The length of the designated charging/discharging period
3. The gain of the proportional controller
From the results of the previous section (generation shifting), it was concluded that the storage-to-wind ratio should be in the 20% to 40% range (MW/MW). If this ratio is used for ramp-rate limiting as well, simulation results indicate that the battery would be able to control the ramp rate quite effectively. This is also seen in Figure 3.12 where increasing the storage/wind ratio beyond 20% to 40% (MW/MW) results in only an insignificant increase in performance. Therefore, the optimal storage to wind ratio for generation shifting should also be suitable for limiting the ramp rate of wind generation. Moreover, these two tasks could be combined for maximum benefit to the system.
7 Concluding remarks
Use of sodium-sulfur battery directly coupled with a wind farm to provide generation shifting to serve peak demand and to limit the wind farm power output ramp rate was discussed. Results from the field operation of a 1 MW, 7.2 MWh sodium-sulfur battery coupled with an 11.55 MW wind farm were provided to validate the battery’s ability to successfully carry out both tasks. It was argued using simulation results that the tasks could be combined to achieve maximum benefit.
Value addition from shifting wind generation to on-peak was calculated. Although the storage to wind ratio was not rigorously optimized, it was inferred from the results that the optimal ratio would be in the range of 0.20 to 0.40 MW of storage for every MW of installed wind. Furthermore, this storage to wind ratio would also be ideal for integrating ramp-rate limiting as discussed above. The MWh/MW ratio of storage was kept fixed and equal to the standard module manufactured by NGK Insulators.
The value from ramp-rate limiting has not been calculated since the regulations for connection of wind-farms to the grid are still evolving. However, integrating ramp-rate limiting with wind-generation shifting will only add to the value.
Sodium sulfur battery technology has enjoyed popularity in recent years evidenced by the new and planned installations. It is expected that the price of new installations will stabilize at a lower value. Therefore, no claims are made about the potential return on investment.
This chapter only discusses storage coupled directly to wind generation. Storage could also be an independent resource and a number of analyses have been reported in literature, some of which can be found in the references.