
Decentralized Energy Storage in Residential Feeders with Photovoltaics
Francesco Marra; Guangya Yang Technical University of Denmark
Abstract
In this chapter, the role of decentralized energy storage in residential feeders with Photovoltaic (PV) is addressed. The increasing penetration of PV power generation is more and more contributing on relieving the overall loading of (low voltage) LV distribution grids by increasing the rate of local generation and consumption of houses and larger buildings. However, LV grids have been originally designed to accommodate unidirectional power flow from the distribution grid to the consumers. With high PV generation, the power flow may invert its direction going from downstream towards the medium voltage grid. Under such conditions, events of overvoltage may occur, posing new challenges to distribution system operators. Decentralized battery based energy storage can prevent such events by storing the surplus of energy which is locally generated.
1 PV generation in the power system
Solar photovoltaic is a renewable form of power generation, which uses solar panels made of photovoltaic (PV) material to produce electric power.
The installed capacity worldwide increased more than 10 times from 2007 to 2012, making solar PV the third important renewable energy source after hydro and wind power in terms of installed capacity [1]. According to the recently published report by the United Nations Environment Program (UNEP), more than 50% of the investment in renewable energy worldwide flows into solar [2].
The success of PV is mainly linked to the rapid growth of the European market. With 35 GW of installed PV capacity at the end of 2013, Germany still dominates the PV market worldwide, followed by Italy, with an installed PV capacity of 18 GW.
Other markets such as Japan and the United States have almost reached the “GW dimension,” while the market in China and India is still in expansion.
Most investments in the PV sector are still inhomogeneous among the different countries. This is not only due to the conditions of solar exposition of the countries but also to different national regulations and incentive programs.
From an energy point of view, the PV energy source is an alternative to traditional fossil fuels and like wind energy, PV is characterized by intermittent and fluctuating power generation. The increasing penetration of PV is contributing to relieving the loading of residential grids. This is a positive aspect if we consider that demand in the residential sector is continuously increasing. However, day-night cycles, weather conditions, and clouds passage are some of the natural phenomena that make PV a non-dispatchable and fluctuating energy source as wind power.
2 PV integration – benefits and challenges
Unlike wind turbines, PV systems are well suited in low voltage (LV) distribution grids, in urban or rural areas, in public places or private households. This is mainly thanks to their static operation and to a lower visual and noise impact compared to wind turbines.
If we consider the German scenario as of 2011, a total of 13 GW of installed PV capacity is in LV grids. From a power-system perspective, PV shows a good correlation between generation and demand in LV grids; in fact, PV power is generated during the day when the demand is relatively high compared to overnight. Additional benefits from PV are related to loss reduction, as a consequence of the reduced power flow from the transmission and distribution grid downstream to the consumers.
Nevertheless, because of the uncertainty of PV power generation, LV grids encounter new operational challenges nowadays. One major concern is to ensure voltage quality along LV feeders [3, 4].
If the demand is low, the power generation from decentralized PV systems can cause situations of power-flow inversion in LV feeders, which can lead to significant variations in the voltage magnitude and consequent deterioration of voltage quality.
Some areas in Germany, Italy, Belgium, and in other European countries have experienced such problems due to the high PV capacity installed. Possible solutions addressed are the curtailment of the power generated by PV systems, grid reinforcement measures, or reactive power-based options [5].
2.1 Energy Storage for PV
In Germany, the vast majority of the installed PV capacity, about 13 GW, is connected to the LV grid. Situations of overvoltage are visible throughout the year in different areas. To limit such events, since January 2012, a fixed limitation of the active power feed-in by each PV system has been mandatory [6]. At the time of writing, the limit is set to the 70% of the maximum power of a PV system; this corresponds to indirectly curtail up to 30% of the available power during periods of maximum PV generation. Alternative solutions to power curtailment may involve an increased local consumption rate that can be achieved by domestic load and energy storage.
Local consumption methods in residential networks with PV have mainly converged on demand-side management (DSM) to shape the domestic power demand during periods of high PV generation [7]. However, as the number of flexible domestic appliances is very limited and these may not necessarily be used on a daily basis (e.g., washing machines) local consumption can be significantly aided with the deployment of battery-based energy-storage systems (ESS). ESS could help to solve such problems by storing energy when PV generation is high and demand is low, and releasing it back to the grid when generation is low. Private owners of ESS and PV would have smoother and more predictable load profiles, ensuring a better network operation and allowing the LV grids to host more PV systems. ESS can also be used to facilitate the participation of PV power plants in the electricity market operation, by providing committed power during certain periods of the day or frequency regulation according to grid codes [8].
The conventional size of domestic ESS for private households with PV is in the range of 5 kWh, from which a local consumption rate of about 55% on a 12-month period can be achieved [9]. The conventional way of performing local consumption consists of activating the charging of the battery as soon as the PV-generated power is greater than the domestic power demand. However, this strategy does not guarantee that the voltage limits are not exceeded during the periods of peak PV generation (12:00–2:00 PM), because the battery gets fully charged during the morning hours.
In the near future, a significant portion of new PV installations is likely to be grid-connected to the residential LV grid, coupled with an ESS.
2.2 Energy Storage in feeders with PV
In residential feeders with a high penetration of PV, the PV-power generation sees its maximum in a time interval around noon. The PV integration should be realized by ensuring that the grid components such as the distribution transformer, lines, and cables operate within their physical limits. At the same time, the voltage profiles at the different buses should meet the power-quality requirements, as stated by the power-quality standard EN 50160. Under high-generation and low-load conditions, one of the goals is to limit the risk that the feeder voltages exceed the allowed limits at the different buses. In Figure 10.1, a simplified feeder is used to explain the case of a LV feeder with PV. When the power generated from PV becomes larger than consumption, the voltage magnitude along the feeder increases, creating potentially overvoltage problems.
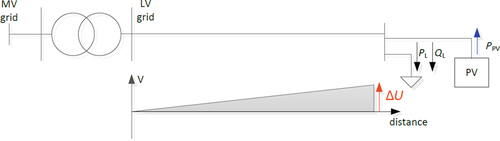
where
PPV is the active power generated from PV at the feeder bus
PL, QL is the load at the feeder bus at the feeder bus
ΔU is the voltage rise due to PV generation at the feeder bus
It is clear that the power injected into the feeder by PV should be counterbalanced by an energy-storage system that locally stores the excess energy produced. While this scenario is increasingly becoming an urgent need to preserve power quality in the feeder, private-storage strategies have in fact been developed with a different focus. The original goal for introducing residential storage systems was to increase the local consumption rate of PV energy. This conventional storage strategy prioritizes the charge of the battery as soon as the PV production exceeds the household demand, regardless of the grid power-quality needs [9]. Thus, while it allows a reduction in energy intake from the mains, the conventional strategy does not bring any advantage to the grid operation.
On the other hand, by prioritizing the charge of the battery around peak generation hours, a grid-supportive storage strategy can be enabled. With the latter, a decentralized storage concept can be put in place, so that each ESS is activated at a certain power threshold, Pth, which may be pre-determined in advance for every feeder.
In Figure 10.2, the two described storage strategies are represented. The conventional storage strategy activates battery charging as soon as power generation exceeds the demand. The grid-supportive storage strategy delays the charging activation until the maximum generation period.

The combination of the grid-supportive storage strategy with the conventional one is also possible today by the use of day-ahead solar-irradiation forecasts. This combination would be particularly useful on those days with more unpredictable solar irradiation.
3 Storage-strategy working principle
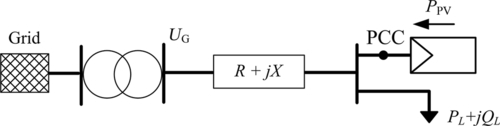
LV distribution feeders are designed and operated in a radial fashion. The purpose of the LV grid is to provide power to consumers, distributing power from the medium-voltage (MV) grid to the LV supply terminals. A typical European LV grid consists of a secondary step-down transformer to step down the voltage from the MV level to a 400 V level. In most cases, voltage regulation is passive. The LV feeders at the secondary side of the distribution transformers are lines or cable sections that distribute electric power to the different consumers. When PV systems are connected at a feeder bus, like depicted in Figure 10.3, the voltage at the point of common coupling (PCC), can be approximated according to the following expression:
where
P – the active power exchanged at the feeder bus
Q – the reactive power exchanged at the feeder bus
![]() – the substation voltage magnitude, assuming that the phase angle is zero
– the substation voltage magnitude, assuming that the phase angle is zero
PPV, QPV – are the active and reactive power fed by the PV system
PL, QL – are the active and reactive power absorbed by a generic load
R, X – are the equivalent resistance and reactance of the cable
It has to be mentioned that Equation (1) ignores the losses on the line to ease the calculation. If the losses are addressed, then the voltage drop along the feeder can be expressed by:
All domestic electric appliances are designed to operate according to the power-quality standard EN 50160. This standard states that 95% of the 10-minute average values of the supply voltage should be be within the range +/-10% of the nominal mean value of the supply voltage, which for a European network is 400 V AC, or 230 V considering only a phase-to-ground voltage.
3.1 Grid-supportive energy storage
To avoid situations of overvoltage during high-PV generation periods, the ESS at each household with PV should be activated during the maximum-generation interval, as illustrated in Figure 10.2. This can be achieved by deploying a house main controller which automatically reacts based on the actual PV generation. The house main controller controls the activation of the ESS according to a pre-defined power threshold Pth. If the PV power reaches the threshold Pth, e.g. 70% of the PV maximum power, the main controller activates the charging of the ESS battery. At the end of the PV generation period, after sunset, the main controller stops the charge and sets the ESS to perform load shading for the domestic appliances. Thus, depending on the time of day, the main controller sets the battery to charge, discharge, or idle mode. During the charging phase, the ESS battery stores the incoming PV energy with a power level PS = PPV – Pth. The charging process continues as long as PPV is greater than the preset threshold.
The safe control of the ESS battery should be ensured at all times, during charging and discharging operation. This task is achieved on the ESS state-of-charge (SOC) control, which is the innermost control loop of the storage system. The charging of the ESS battery should be limited to a safe SOC window, which for a lithium-ion battery is considered to be within 20 to 90% [10]. Other types of batteries may also be considered, requiring potentially a different usage window.
To provide voltage support in the feeder, the maximum charging power of the ESS under worst-case conditions will vary according to the preset power threshold. For LV grids with different PV-penetration levels, this power threshold can be identified according to the grid configuration.
4 Energy management in houses with PV
As discussed, the management of local consumption at houses with PV requires an electrical infrastructure with smart meters and smart sockets for realizing the load-shift of different appliances. A main controller, the “brain” of the system, realizes the load coordination within the house. The study in [9] addresses the local consumption rate of a group of households with consumption of 4000 kWh per year and 5 kW PV installed capacity. The local consumption rate amounts to about 25%. To reach higher levels of local consumption, the house should be equipped with a battery-based ESS, which operates in coordination with the PV system. By using a 5 kWh battery ESS, the local consumption rate rises to about 55%, showing an increase of about 30%.
The typical arrangement for a house with PV and an ESS is based on a PV system that is composed of a PV array and a PV inverter, whose output power is monitored by the main controller by means of a real-time meter. The ESS is connected at the same PCC of the PV inverter and its power is also real-time monitored. A wide range of battery-ESS technologies can be utilized, such as lead-acid and Li-ion batteries. However, due to better performances of Li-ion battery chemistries in terms of lifetime, energy-to-weight ratio, self-discharge rate, and charge/discharge efficiency, Li-ion technology is considered here.
A generic battery ESS can be modeled by the charge/discharge equations as expressed in (5) and (6), where Pd is the discharging power and Pc is the charging power of the ESS battery, respectively; E is the energy stored in the battery at time t; Δt is the duration time of each interval. The two coefficients ηd and ηc are the discharge and charge efficiencies, respectively.
The operation of the battery system should also take into account power and energy constraints. The maximum power limits during charging/discharging can be described by (7) and (8), respectively:
The battery power limits are also considered for sizing the ESS power converter; however, for simplicity we refer to PS to indicate the power exchanged by the ESS with the grid, thus including the phases of charging and discharging. Positive values of PS indicate charging and the provision of voltage support. The energy limits of an ESS can be described as follows:
where
Emin and Emax are the minimum and maximum energy levels of the storage, defining the usable energy window, and SOCmin and SOCmax are the minimum and maximum SOC limits that should be set in relation to the application.
4.1 A real example
The Belgian residential LV feeder presented in [11] is an interesting example of a LV grid with high penetration of PV and overvoltage issues. The feeder is composed of seven buses, with decentralized PV systems at different feeder locations as shown in Figure 10.4.
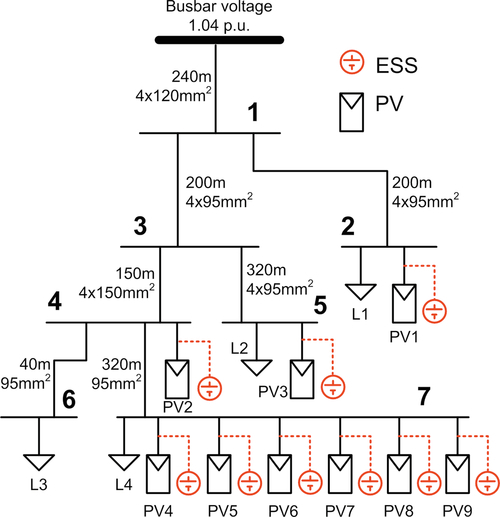
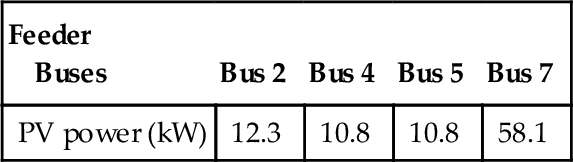
The PV installed capacity at the different buses in the feeder is distributed as indicated in Table 10.1.
Table 10.1
PV in The Feeder – 23% Penetration, Original Scenario
| Feeder buses | Bus 2 | Bus 4 | Bus 5 | Bus 7 |
| PV power (kW) | 5.7 | 5 | 5 | 26.9 |
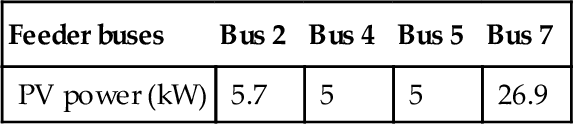
The LV feeder is part of a larger LV grid, which includes nine feeders. The feeder supplies 33 houses and it embeds nine roof-mounted PV systems, with total PV installed capacity of 42.6 kW. On buses 2, 4, and 5, the size of each PV system corresponds to the value indicated in Table 10.1. The definition of PV penetration is given as follows:

The PV penetration in the feeder is the ratio between the total PV installed capacity to the nominal feeder capacity. The feeder capacity is intended as the capacity of the first-line section of the feeder, corresponding to 185 kVA. It follows that a PV penetration of 23% is present in the Belgian LV feeder.
The measured profiles of load and generation in the feeder are represented from January 1st until December 31st in Figures 10.5 (a) and (b), respectively. The same profiles are used in the simulation model to evaluate the situations of overvoltage. The 12-month simulation performed shows that overvoltage events at bus 7 are more critical, and the maximum voltage limit of 1.1 p.u. is exceeded in 98 days.
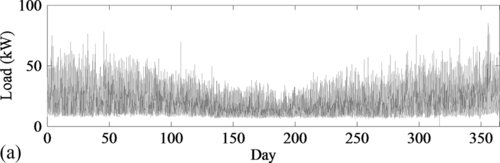
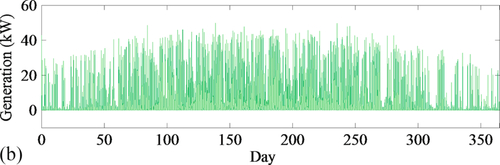
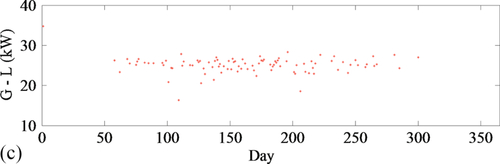
In Figure 10.5 (c), the difference “PV generation – load” in those days with voltages exceeding 1.1 p.u. is depicted. Some major findings are:
1) overvoltage events occur when G-L is positive; in the field case, this corresponds to the active power range of 15 to 35 kW;
2) the highest concentration of days with voltage above the 1.1 p.u. is observed in spring and summer.
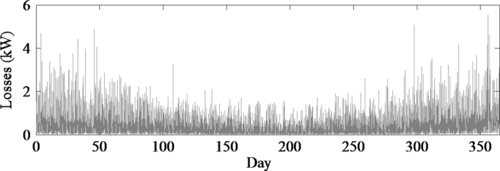
With regard to grid losses, the total energy losses in the feeder are calculated considering the losses on the single-feeder cables; the profile of total power losses in the feeder during the 12-month period is depicted in Figure 10.6. Losses are lower in spring and summer and higher in winter and autumn.
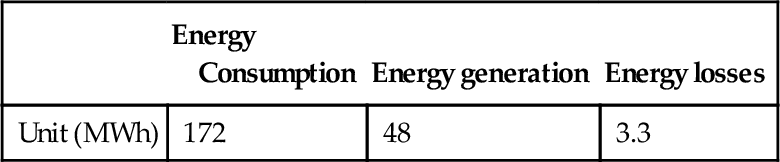
With regard to energy levels, the total energy consumption, energy production, and energy losses are calculated and summarized in Table 10.2.
Table 10.2
Energy Quantities in the LV Feeder
| Energy Consumption | Energy generation | Energy losses | |
| Unit (MWh) | 172 | 48 | 3.3 |
A worst-case scenario for overvoltage in the feeder is observed during sunny days of spring and summer, according to the measurements, and during low load conditions.
If by hypothesis 50% PV penetration is assumed, the PV installed capacity per bus would result in the one indicated in Table 10.3. With a 50% penetration level, the optimization method identifies a power threshold value of 45% of the rated PV system power capacity for each house, which corresponds to a higher charging power for each ESS in the feeder. By doubling the PV penetration in the feeder, the ESS power requirement becomes much higher. Consequently, the ESS energy requirement will be quite different in the two scenarios.
5 Application of Decentralized Energy Storage
According to the decentralized grid-supportive energy storage strategy of Figure 10.2, the power threshold Pth is the same for all PV systems in the feeder. The following cases can be adopted:
Case 1, which considers Pth = 80% based on optimization method [11]; all residential ESS are activated when PPV(t) > 80% PPVmax.
Case 2, which considers Pth = 70%; all residential ESS are activated with PPV(t) > 70% PPVmax, as required by the German Renewable Energy Sources Act, EEG 2012 [6].
Case 3, which considers Pth = 45% based on optimization method [11], with 50% PV penetration; all residential ESSs are activated with PPV(t) > 55% PPVmax.
5.1 Case 1
Under Case 1, the feed-in power by the PV system is at most the 80% of PPVmax. The charging activity of the nine ESS is depicted in Figure 10.7. The maximum charging power is about 1.1 kW, which is in line with the LP method’s results. The phase voltage profiles Va, Vb, and Vc of the most critical feeder location, bus 7, are depicted in Figure 10.8. The profiles are apparently within the maximum voltage limit.

5.2 Case 2
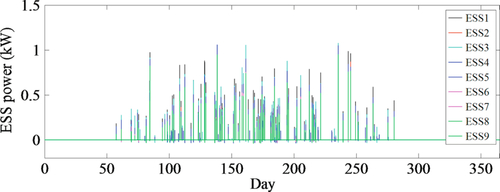
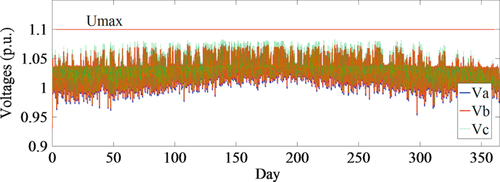
With the power threshold of the PV system set to the 70% of PPVmax, the charging activity of the residential ESSs is depicted in Figure 10.9. In this case, the maximum charging power is about 1.7 kW and all ESS operate for 147 days. The phase-voltage profiles Va, Vb, and Vc of bus 7 are depicted in Figure 10.10. Compared to the voltage profiles obtained for Pth = 80%, a wider margin from the limit of 1.1 p.u. is observable.

5.3 Case 3
With 50% PV penetration, the aggregated generated power by PV in the feeder is up to 92 kW. Such power amount leads to 231 days with overvoltage situations, which would be apparently an unacceptable power-quality scenario. A decentralized storage strategy requires in this case a power threshold of 50%, to avoid overvoltage and to comply with the power-quality standard.
5.4 Storage Energy Levels
The ESS energy levels can be obtained for the power profiles obtained for the three cases.
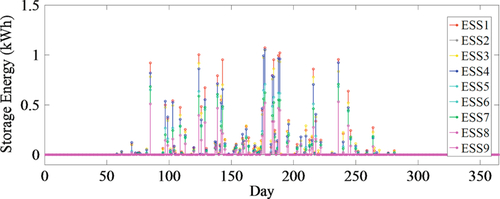
With 23% PV penetration and Pth = 80%, the required ESS energy is 1.1 kWh, as seen in Figure 10.11. This value is obtained by integration over time of the ESS power profiles and selection of the day with the highest storage-energy content, whereas, with Pth = 70%, the required ESS energy is 3.8 kWh, as seen in Figure 10.12.

With 50% PV penetration and Pth = 50%, the required ESS energy capacity with nine ESSs in the feeder is 28 kWh per unit, whereas it is 14 kWh with 18 ESSs.
It should be considered that the identified energy levels are referred to as the operative energy window (in kWh) for achieving voltage support using decentralized ESSs. To operate the ESS battery across a linear SOC region and to avoid deep discharge cycles, the battery should be oversized in relation to the operative energy window identified. For each ESS battery, a usable SOC window of 20 to 90% is imposed in this chapter, complying with common recommendations on the use of Li-ion batteries in [10]. Following the nominal battery capacity EN, the minimum and maximum energy constraints Emin and Emax are indicated in Table 10.4.
Table 10.4
ESS Operative Constraints
| Case | Nr. PV systems | EN (kWh) | Emin (kWh) | Emax (kWh) | (kW) | (kW) |
| PV penetration: 23% | ||||||
| Pth = 80% | 9 | 1.6 | 0.3 | 1.4 | 2 | -2 |
| Pth = 70% | 5.4 | 1.1 | 4.9 | 2 | -2 | |
| PV penetration: 50% | ||||||
| Pth = 50% | 9 | 40 | 8 | 36 | 6 | -6 |

With 23% PV penetration, voltage support with Pth = 80% is possible with a nominal battery capacity of about 1.6 kWh. Instead, with Pth = 70%, a battery capacity of 5.4 kWh should be used. While a smaller battery size represents a more affordable option for the user, the larger battery size gives the opportunity to achieve a higher local consumption rate. It is also evident that the maximum charging and discharging power of the ESS is not a crucial issue for the provision of voltage support; in fact, the power level of ± 2 kW is enough for both cases with 23% penetration.
Drastic differences are observed in power and energy levels with 50% PV penetration. With such penetration level, the required ESS nominal capacity is not an economically feasible option for standard households.
6 ESS battery lifetime with decentralized storage
The presented example of a real feeder with PV permits evaluating the influence of the decentralized storage strategy on the battery lifetime. The estimation of the lifetime, L, is limited to the sole voltage support operation of the ESS. This allows decoupling the battery deterioration due to grid-voltage support from other possible usage scenarios of the battery. The number of cycles performed during the 12-month period for voltage support and the declared battery lifetime at 80% retained capacity are both considered for the lifetime estimation. Considering a Li-ion battery with 1500 cycles declared at 80% retained capacity [12], L can be approximated as:

For the three different scenarios of Pth, the battery lifetime obtained is represented in the diagram of Figure 10.13.

With 15 and 10 years expected lifetime under the 23% PV-penetration scenario, it appears that voltage support using decentralized storage has a negligible impact on battery ageing. In fact, the warranty for current batteries for storage applications is in the range of 5 to 8 years. A substantially shorter lifetime is obtained with the 50% PV-penetration scenario, due to a higher number of cycles required for voltage support under such high PV-penetration scenario.
6.1 Energy losses in the feeder
It is also worth looking at power losses in the feeder with and without the decentralized energy storage strategy applied.
A comparison of energy losses in the feeder with 23% PV penetration is performed for the two cases of decentralized storage with 70% and 80% power threshold and for the case without storage. With the 80% power threshold, the losses are reduced by 6.6% compared to the case without storage. If decentralized storage is activated at 70% power threshold, losses are reduced to about 7.3%.
7 Conclusion
Decentralized storage concepts in residential grids will definitely become a recurrent need in the coming decades. Low-voltage feeders supplying households and commercial buildings will incorporate more and more distributed energy resources such as PV and small wind turbines, which will enable local consumption as opposed to increasing the capacity of centralized power plants. The intermittent generation of PV can then be handled by decentralized energy-storage systems.
The first pilot programs and studies applied to real situations of residential feeders with high PV penetration have shown the advantages of using the actual battery technologies to store the produced energy during peak-production hours for use when demand from consumers is higher. Furthermore, the deployment of private energy-storage systems in houses with PV generators appears a promising option for accommodating increased PV-penetration levels. Residential feeders were originally designed to distribute power to consumers and not to accommodate intermittent power-generation sources like PV generators; the increasing penetration level of these would require a rethinking of the overall distribution grid planning as well as the replacement of reinforcement of parts of the grid. To overcome or postpone such scenarios, decentralized storage strategies can enable an optimized use of the grid, while minimizing the burden on distribution-system operators. The strategies for operating energy-storage systems need to be adapted to the characteristics of PV generation, in a way that the traditional strategies are replaced by strategies that take into account the needs of the grid, so that, in the case of peak generation of PV on a sunny day, battery charging is activated according to a pre-determined power threshold. This storage strategy allows also a reduction of the energy losses in the feeder, as opposed to the case without storage systems.
The optimal sizing of domestic energy-storage systems will not constitute a problem for single households. Optimization methods for sizing the batteries should be put in place, which consider every LV grid case by case. The power thresholds for which all domestic ESS should be activated will vary according to the PV-penetration levels of each feeder. By applying the method of decentralized energy storage for a residential feeder with 23% PV penetration, it was found that all ESS will be activated to limit the generated power to as low as 80% of the peak-output power of each plant. This method, as opposed to a pre-defined threshold of 70%, as demanded by EEG 2012, allows the optimal sizing of the ESS batteries. At the same time, a battery life of over 10 years can be achieved, which is longer than the common warranty period of today’s batteries of about 5 to 8 years.
In a future scenario with escalation of PV-penetration level to 50%, national directives such as the 70% criterion of power limitation of EEG 2012 no longer guarantees the required power quality in the feeder. Instead, a power limitation of 50% from each PV system would be required to avoid situations of overvoltage in the feeder due to PV generation. Under a 50% PV-penetration scenario, the size of batteries in a decentralized strategy would be so large that it would become uneconomical for private households. With such high PV-penetration levels, grid reinforcement will most likely be required.
Decentralized storage strategies in feeders with PV can be applied to a specific case study. However, residential network topologies and load patterns have quite similar characteristics worldwide. It is envisioned that these aspects will enable grid planners and distribution-network operators to incentivize the use of battery-based storage strategies in future grids.