
Quantifying preconceptions
Abstract
Chapter 5, Quantifying Preconceptions, argues that we usually know things about the systems we are studying that can be used to supplement actual observations. Temperatures often lie in specific ranges governed by freezing and boiling points. Chemical gradients often vary smoothly in space, owing to the process of diffusion. Energy and momentum obey conservation laws. The methodology through which this prior information can be incorporated into the models is developed in this chapter. Called generalized least squares, it is applied to several substantial examples in which prior information is used to fill in data gaps in datasets.
5.1 When least square fails
The least-squares solution fails when [GTG] has no inverse, or equivalently, when its determinant is zero. In the straight line case, the [GTG] is 2 × 2 and the determinant, D, can readily be computed from Equation (4.29):

Two different scenarios lead to the determinant being zero. If only one observation is available (i.e., N = 1), then
This case corresponds to the problem of trying to fit a straight line to a single point. The determinant is also zero when N > 1, but the data are all measured at the same value of xi (say xi = x*). Then,
This case corresponds to the problem of trying to fit a straight line to many points, all with the same x. In both cases, the problem is that more than one choice of m has minimum error. In the first case, any line that passes through the point (x1, d1) has zero error, regardless of its slope (Figure 5.1A). In the second case, all lines that pass through the point, ![]() , where
, where ![]() is an arbitrary value of d, will have the same error, regardless of the slope, and one of these will correspond to the minimum error (
is an arbitrary value of d, will have the same error, regardless of the slope, and one of these will correspond to the minimum error (![]() , actually) (Figure 5.1B).
, actually) (Figure 5.1B).

In general, the method of least squares fails when the data do not uniquely determine the model parameters. The problem is associated with the data kernel, G, which describes the geometry or structure of the experiment, and not with the actual values of the data, d, themselves. Nor is the problem limited to the case where [GTG]−1 is exactly singular. Solutions when [GTG]−1 is almost singular are useless as well, because the covariance of the model parameters is proportional to [GTG]−1, and it has very large elements in this case. If almost no data constrains the value of a model parameter, then its value is very sensitive to measurement noise. In these cases, the matrix, GTG, is said to be ill-conditioned.
Methods are available to spot deficiencies in G that lead to GTG being ill-conditioned. However, they are usually of little practical value, because while they can identify the problem, they offer no remedy for it. We take a different approach here, which is to assume that most experiments have deficiencies that lead to at least a few model parameters being poorly determined.
We will not concern ourselves too much with which model parameters are causing the problem. Instead, we will use a modified form of the least-squares methodology that leads to a solution in all cases. This methodology will, in effect, fill in gaps in information, but without providing much insight into the nature of those gaps.
5.2 Prior information
Usually, we know something about the model parameters, even before we perform any observations. Even before we measure the density of a soil sample, we know that its density will be around 1500 kg/m3, give or take 500 or so, and that negative densities are nonsensical. Even before we measure a topographic profile across a range of hills, we know that it can contain no impossibly high and narrow peaks. Even before we measure the chemical components of an organic substance, we know that they should sum to 100%. Further, even before we measure the concentration of a pollutant in an underground reservoir, we know that its dispersion is subject to the diffusion equation.
These are, of course, just preconceptions about the world, and as such, they are more than a little dangerous. Observations might prove them to be wrong. On the other hand, most are based on experience, years of observations that have shown that, at least on Earth, most physical parameters commonly behave in well-understood ways. Furthermore, we often have a good idea of just how good a preconception is. Experience has shown that the range of plausible densities for sea water, for example, is much more restricted than, say, that for crude oil.
These preconceptions embody prior information about the results of observations. They can be used to supplement observations. In particular, they can be used to fill in the gaps in the information content of a dataset that prevent least squares from working.
We will express prior information probabilistically, using the Normal probability density function.
This choice gives us the ability to represent both the information itself, through the mean of the probability density function, and our uncertainty about the information, through its covariance matrix. The simplest case is when we know that the model parameters, m, are near the values, ![]() , where the uncertainty of the nearness is quantified by a prior covariance matrix,
, where the uncertainty of the nearness is quantified by a prior covariance matrix, ![]() . Then, the prior information can be represented as the probability density function:
. Then, the prior information can be represented as the probability density function:

Note that we interpret the argument of the exponential as depending on a function, Ep(m), which quantifies the degree to which the prior information is satisfied. It can be thought of as a measure of the error in the prior information (compare with Equation 4.24).
In the soil density case above, we would choose, ![]() = 1500 kg/m3 and
= 1500 kg/m3 and ![]() , with σm = 500 kg/m3. In this case, we view the prior information as uncorrelated, so
, with σm = 500 kg/m3. In this case, we view the prior information as uncorrelated, so ![]() .
.
Note that the prior covariance matrix, ![]() , is not the same as the covariance matrix of the estimated model parameters, Cm (which is called the posterior covariance matrix). The matrix,
, is not the same as the covariance matrix of the estimated model parameters, Cm (which is called the posterior covariance matrix). The matrix, ![]() , expresses the uncertainty in the prior information about the model parameters, before we make any observations. The matrix, Cm, expresses the uncertainty of the estimated model parameters, after we include the observations.
, expresses the uncertainty in the prior information about the model parameters, before we make any observations. The matrix, Cm, expresses the uncertainty of the estimated model parameters, after we include the observations.
A more general case is when the prior information can be represented as a linear function of the model parameters:

where H is a K × M matrix, where K is the number of rows of prior information. This more general representation can be used in the chemical component case mentioned above, where the concentrations need to sum to 100% or unity. This is a single piece of prior information, so K = 1 and the equation for the prior information has the form

The prior probability density function of the prior information is then

Here the covariance matrix, ![]() , expresses the uncertainty to which the model parameters obey the linear equation,
, expresses the uncertainty to which the model parameters obey the linear equation, ![]() . Note that the Normal probability density function contains the quantity, Ep(m), which is zero when the prior information,
. Note that the Normal probability density function contains the quantity, Ep(m), which is zero when the prior information, ![]() , is satisfied exactly, and positive otherwise. Ep(m) quantifies the error in the prior information. The probability density function for m is proportional to the probability density function for h, as the Jacobian determinant, J(m), is constant (see Note 5.1).
, is satisfied exactly, and positive otherwise. Ep(m) quantifies the error in the prior information. The probability density function for m is proportional to the probability density function for h, as the Jacobian determinant, J(m), is constant (see Note 5.1).
5.3 Bayesian inference
Our objective is to combine prior information with observations. Bayes theorem (Equation 3.25) provides the methodology through the equation

We can interpret this equation as a rule for updating our knowledge of the model parameters. Let us ignore the factor of p(d) on the right hand side, for the moment. Then the equation reads as follows:

We identify p(m) with pp(m), that is, our best estimate of the probability of the model parameters, before the observations are made.. The conditional probability density function, p(d|m), is the probability that data, d, are observed, given a particular choice for the model parameters, m. We assume, as we did in Equation (4.23), that this probability density function is Normal:

where Cd is the covariance matrix of the observations. (Previously, we assumed that Cd = σd2I, but now we allow the general case). Note that the Normal probability density function contains the quantity, E(m), which is zero when the data are exactly satisfied and positive when they are not. This quantity is the total data error, as defined in Equation (4.24), except that the factor ![]() acts to weight each of the component errors. Its significance will be discussed later in the section.
acts to weight each of the component errors. Its significance will be discussed later in the section.
We now return to the factor of p(d) on the right-hand side of Bayes theorem (Equation 5.5). It is not a function of the model parameters, and so acts only as a normalization factor. Hence, we can write

Note that p(m|d) contains the quantity, ET(m), that is the sum of two errors: the error in fitting the data; and the error in satisfying the prior information. We call it the generalized error. We do not need the overall normalization factor, because the only operation that we will perform with this probability density function is the computation of its mode (point of maximum likelihood), which (as in Equation 4.24) we will identify as the best estimate, mest, of the model parameters. An example for the very simple N = 1, M = 2 case is shown in Figure 5.2. However, before proceeding with more complex problems, we need to discuss an important issue associated with products of Normal probability density functions (as in Equation 5.8).

5.4 The product of Normal probability density distributions
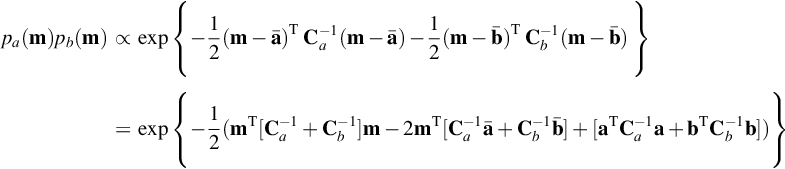
The conditional probability density function, p(m|d), in Equation (5.8) is the product of two Normal probability density functions. One of the many useful properties of Normal probability density functions is that their products are themselves Normal (Figure 5.3). To verify that this is true, we start with three Normal probability density functions, pa(m), pb(m), and pc(m):


Note that the second version of pc(m) is just the first with the expression within the braces expanded out. We now compute the product of the first two:
We now try to choose ![]() and Cc in Equation (5.9) so that pc(m) in Equation (5.9) matches pa(m)pb(m) in Equation (5.10). The choice
and Cc in Equation (5.9) so that pc(m) in Equation (5.9) matches pa(m)pb(m) in Equation (5.10). The choice
matches the first pair of terms (the ones quadratic in m) and gives, for the second pair of terms (the ones linear in m)
Solving for ![]() , we find that these terms are equal when
, we find that these terms are equal when
Superficially, these choices do make the third pair of terms (the ones that do not contain m) equal. However, as these terms do not depend on m, they just correspond to the multiplicative factors that affect the normalization of the probability density function. We can always remove the discrepancy by absorbing it into the normalization. Thus, up to a normalization factor, pc(m) = pa(m)pb(m); that is, a product of two Normal probability density functions is a Normal probability density function.
In the uncorrelated, equal variance case, these rules simplify to
Note that in the case where one of the component probability density functions, say pa(m), contains no information (i.e., when Ca−1 → 0), the multiplication has no effect on the covariance matrix or the mean (i.e., Cc−1 = Cb−1 and ![]() ). In the case where both pa(m) and pb(m) contain information, the covariance of the product will, in general, be smaller than the covariance of either probability density function (Equation 5.11), and the mean,
). In the case where both pa(m) and pb(m) contain information, the covariance of the product will, in general, be smaller than the covariance of either probability density function (Equation 5.11), and the mean, ![]() , will be somewhere on a line connecting
, will be somewhere on a line connecting ![]() (Equation 5.13).
(Equation 5.13).
Thus, p(m|d) in Equation (5.8), being the product of two Normal probability density functions, is itself a Normal probability density function.
5.5 Generalized least squares
We now return to the matter of deriving an estimate of model parameters that combines both observations and prior information by finding the peak (mode) of the Normal distribution in Equation (5.8). This Normal distribution depends on the generalized error, ET(m):

The expression for the generalized error can be simplified by defining a matrix F and a vector f such that:

Here Cd− ½ is the square root of Cd− 1 (which obeys ![]() ) and Ch− ½ is the square root of Ch− 1. In the commonly-encountered case where Cd− 1 and Ch− 1 are diagonal matrices, the square root is computed simply by taking the square root of the diagonal elements). The generalized error is then:
) and Ch− ½ is the square root of Ch− 1. In the commonly-encountered case where Cd− 1 and Ch− 1 are diagonal matrices, the square root is computed simply by taking the square root of the diagonal elements). The generalized error is then:
This equivalence can be shown by substituting Equation (5.16) into Equation (5.17) and multiplying out the expression. The generalized error has been manipulated into a form identical to the ordinary least squares error, implying that the solution is the ordinary least squares solution:
The covariance matrix Cm is computed by the usual rules of error propagation:
These results are due to Tarantola and Valette (1982) and are further discussed by Menke (1989). When we substitute Equation (5.16) into Equation (5.19), we obtain the expressions:

However, these expressions are cumbersome and almost never necessary. Instead, we construct the equation:

directly and solve it by ordinary least squares. In this equation, the rows of the data equations, ![]() and the rows of the prior information equation Hmest=
and the rows of the prior information equation Hmest=![]() are combined into a single matrix equation, Fmest=f, with the N rows of Gmest=d weighted by the certainty of the data (that is, by the factor σd− 1), and the K rows of Hmest=
are combined into a single matrix equation, Fmest=f, with the N rows of Gmest=d weighted by the certainty of the data (that is, by the factor σd− 1), and the K rows of Hmest=![]() weighted by the certainty of the prior information (that is, by the factor σh− 1). Observations and prior information play symmetrical roles in this generalized least squares solution. Provided that enough prior information is added to “fill in the gaps”, the generalized least squares solution,
weighted by the certainty of the prior information (that is, by the factor σh− 1). Observations and prior information play symmetrical roles in this generalized least squares solution. Provided that enough prior information is added to “fill in the gaps”, the generalized least squares solution, ![]() , will be well-behaved, even when the ordinary least squares solution,
, will be well-behaved, even when the ordinary least squares solution, ![]() , fails. The prior information regularizes the matrix, [FTF].
, fails. The prior information regularizes the matrix, [FTF].
One type of prior information that always regularizes a generalized least squares problem is the model parameters being close to a constant, ![]() . This is the case where K = M, H = I and
. This is the case where K = M, H = I and ![]() . The special case of
. The special case of ![]() is called damped least squares, and corresponds to the solution:
is called damped least squares, and corresponds to the solution:
The attractiveness of the damped least squares is the ease by which it can be used. One merely adds a small number, ε2, to the main diagonal of [GTG]. However, while easy, damped least squares is only warranted when there is good reason to believe that the model parameters are actually near-zero.
In the generalized least squares formulation, all model parameters are affected by the prior information, even those that are well-determined by the observations. Unfortunately, alternative methods that target prior information at only underdetermined or poorly-determined model parameters are much more cumbersome to implement and are, in general, computationally unsuited to problems with a large number of model parameters (e.g. M > 103 or so). On the other hand, by choosing the magnitude of the elements of Ch− 1 to be sufficiently small, a similar result can be achieved, though often trial-and-error is required to determine how small is small.
As an aside, we mention an interesting interpretation of the equation for the generalized least squares solution, in the special case where M = K and H− 1 exists, so we can write ![]() . Then, if we subtract
. Then, if we subtract ![]() from both sides of Equation (5.20), we obtain:
from both sides of Equation (5.20), we obtain:
which involves the deviatoric quantities ![]() and
and ![]() . In this view, the generalized least squares solution determines the deviation
. In this view, the generalized least squares solution determines the deviation ![]() of the solution away from the prior model parameters,
of the solution away from the prior model parameters, ![]() , using the deviation
, using the deviation ![]() , of the data away from the prediction
, of the data away from the prediction ![]() of the prior model parameters.
of the prior model parameters.
5.6 The role of the covariance of the data
Generalized least squares (Equation 5.21) adds an important nuance to the estimation of model parameters, even in the absence of prior information, because it weights the contribution of an observation, d, to the error, E(m), according to its certainty (the inverse of its variance):
This effect is more apparent in the special case where the data are uncorrelated with variance, σ2di. Then, Cd is a diagonal matrix and the error is

Thus, poorly determined data contribute less to the total error than well-determined data and the resulting solution better fits the data with small variance (Figure 5.4).

The special case of generalized least squares that weights the data according to its certainty but includes no prior information is called weighted least squares. In MatLab, the solution is computed as
(MatLab eda05_03)
where Cdi is the inverse of the covariance matrix of the data, Cd−1. In many cases, however, the covariance is diagonal, as in Equation (5.25). Then, defining a column vector, sigmad, with elements, σdi, Equation (5.18) can be used, as follows:
for i=[1:N]
 F(i,:)=G(i,:)./sd(i);
end
f=d./sd;
mest = (F′*F)(F’*f);
(MatLab eda05_04)
where sd is a column vector with elements, σdi.
5.7 Smoothness as prior information
An important type of prior information is the belief that the model parameter vector, m, is smooth. This notion implies some sort of natural ordering of the model parameters in time or space, because smoothness characterizes how model parameters vary from one position or time to another one nearby. The simplest case is when the model parameters vary with one coordinate, such as position, x. They are then a discrete version of a function, m(x), and their roughness (the opposite of smoothness) can be quantified by the second derivative, d2m/dx2. When the model parameters are evenly spaced in x, say with spacing Δx, the first and second derivative can be approximated with the finite differences (see Section 1.9):

The smoothness condition implies that the roughness is small. We represent roughness with the equation, ![]() , where each row of the equation corresponds to a second derivative centered at a different x-position. A typical row of H has elements proportional to
, where each row of the equation corresponds to a second derivative centered at a different x-position. A typical row of H has elements proportional to
However, a problem arises with the first and last row, because the model parameters m0 and mM+1 are unavailable. We can either omit these rows, in which case H will contain only M − 2 pieces of information, or use different prior information there. A natural choice is to require the slope (i.e., the first derivative, dm/dx) to be small at the ends (i.e., the ends are flat), which leads to

The vector, ![]() , is taken to be zero, as our intent is to make the roughness and steepness—the opposites of smoothness and flatness—as small as possible.
, is taken to be zero, as our intent is to make the roughness and steepness—the opposites of smoothness and flatness—as small as possible.
One simple application of smoothness information is the filling in of data gaps. The idea is to have the model parameters represent the values of a function on a grid, with the data representing the values on a subset of grid points whose values have been observed. The other grid points represent data gaps. The equation, Gm = d, reduces to mi = dj, which has a G as follows:

Each row of G has M − 1 zeros and a single 1, positioned to match up an observation with the model parameter corresponding to at the same value of x. In MatLab, the matrix, F, and vector, f, are created in two stages. The first stage creates the top part of F and f (i.e., the part containing G and d):
L=N+M;
F=zeros(L,M);
f=zeros(L,1);
for p = [1:N]
 F(p,rowindex(p)) = 1;
 f(p)=d(p);
end
(MatLab eda05_05)
Here, rowindex is a column vector that specifies the correspondence of observation, dp, and its corresponding model parameter. For simplicity, we assume that the observations have unit variance, and so omit factors of σd−1. The second stage creates the bottom part of F and f (i.e., the part containing H and h)
shi = 1e-6;
for p = [1:M−2]
 F(p+N,p) = shi/Dx2;
 F(p+N,p+1) = −2*shi/Dx2;
 F(p+N,p+2) = shi/Dx2;
 f(p+N)=0.0;
end
F(L−1,1)=−shi*Dx;
F(L−1,2)=shi*Dx;
f(L−1)=0;
F(L,M−1)=−shi*Dx;
F(L,M)=shi*Dx;
f(L)=0;
(MatLab eda05_05)
Here, we assume that the prior information is uncorrelated and with equal variance, so we can use a single variable shi to represent σh−1. We set it to a value much smaller than unity so that it will have much less weight in the solution than the data. This way, the solution will favor satisfying the data at points where data is available. A for loop is used to create this part of the matrix, F, which corresponds to smoothness. Finally, the flatness information is put in the last two rows of F. The estimated model parameters are then calculated by solving Fm = f in the least squares sense:
(MatLab eda05_05)
An example is shown in Figure 5.5.

Crib Sheet 5.1
Generalized least squares
Step 1: State the problem in words
How are the data related to the model
Step 2: Organize the problem in standard form
identify the data d (length N) the model parameters m (length ![]()
define the data kernel G so that ![]()
make plots of the data
Step 4: Establish the accuracy of the data
state a prior variance σd2 based on accuracy of the measurement technique
Step 5: State the prior information in words, for example:
the model parameters are close to a known values, hpri
the mean of the model parameters is close to a known value
the model parameters vary smoothly with space and time
Step 6: Organize the prior information in standard form:
Step 7: Establish the accuracy of the prior information
state a prior variance σh2 based on the accuracy of the prior information
Step 8: Estimate model parameter mest and their covariance Cm

Step 9: State estimates and their 95% confidence intervals
Step 10: Examine the individual errors
plot ei vs. i and plot epi vs. i
scatter plot of dipre vs. diobs and scatter plot of hipre vs. hipri
any unusually large errors?
Step 11: Examine the total error ET
use a chi-squared test on ET to assess the likelihood of the Null Hypothesis that ET is different than expected only because of random variation
Step 12: Two different models?
use an F-test on the E’s of the two models to assess the likelihood
of the Null Hypothesis that the E’s are
different from each other only because of random variation
5.8 Sparse matrices
Many perfectly reasonable problems have large number of model parameters—hundreds of thousands or even more. The gap-filling scenario discussed in the previous section is one such example. If, for instance, we were to use it to fill in the gaps in the Black Rock Forest dataset (see Chapter 2), we would have ![]() . The L × M matrix, F, where L = M + N, would then have about
. The L × M matrix, F, where L = M + N, would then have about ![]() elements—enough to tax the memory of a notebook computer, at least! On the other hand, only about
elements—enough to tax the memory of a notebook computer, at least! On the other hand, only about ![]() of these elements are nonzero. Such a matrix is said to be sparse. A computer's memory is wasted storing the zero elements and its processing power is wasted multiplying other quantities by them (as the result is a foregone conclusion—zero). An obvious solution is to omit storing the zero elements of sparse matrices and to omit any multiplications involving them. However, such a solution requires special software support to properly organize the matrix's elements and to optimize arithmetic operations involving them.
of these elements are nonzero. Such a matrix is said to be sparse. A computer's memory is wasted storing the zero elements and its processing power is wasted multiplying other quantities by them (as the result is a foregone conclusion—zero). An obvious solution is to omit storing the zero elements of sparse matrices and to omit any multiplications involving them. However, such a solution requires special software support to properly organize the matrix's elements and to optimize arithmetic operations involving them.
In MatLab, a matrix needs to be defined as sparse, but once defined, MatLab more or less transparently handles all array-element access and arithmetic operations. The command
L=M+N;
F=spalloc(L,M,4*N);
(MatLab eda05_06)
creates a L × M sparse matrix, F, capable of holding 4N nonzero elements. MatLab will properly process the command:
(MatLab eda05_05)
Nevertheless, we do not recommend solving for mest this way, except when M is very small, because it does not utilize all the inherent efficiencies of the generalized least-squares equation, FTFm = FTf. Our preferred technique is to use MatLab's bicg()function, which solves the matrix equation by the biconjugate gradient method. The simplest way to use this function is
mest=bicg(F′*F,F′*f,1e−10,3*L);
(MatLab eda05_06)
As you can see, two extra argument are present, in addition to the matrix, F′*F, and the vector, F′*f. They are a tolerance (set here to 1e−10) and a maximum number of iterations (set here to 3*L). The bicg() function works by iteratively improving an initial guess for the solution, with the tolerance specifying when the error is small enough for the solution to be considered done, and the maximum number of iterations specifying that the method should terminate after this limit is reached, regardless of whether or not the error is smaller than the tolerance. The actual choice of these two parameters needs to be adjusted by trial and error to suit a particular problem. Each time it is used, the bicg()function displays a line of information that can be useful in determining the accuracy of the solution.
This simple way of calling bicg()has one defect—it requires the computation of the quantity, FTF. This is undesirable, for while FTF is sparse, it is typically not nearly as sparse as F, itself. Fortunately, the biconjugate gradient method utilizes FTF in only one simple way: it multiplies various internally constructed vectors to form products such as FTFv. However, this product can be performed as FT(Fv), that is, v is first premultiplied by F and the resulting vector is then premultiplied by FT so that the matrix FTF is never actually calculated. MatLab provides a way to modify the bicg()function to perform the multiplication in this very efficient fashion. However, in order to use it, we must first write a MatLab function, stored in a separate file that performs the two multiplications (see Note 5.2). We call this function, afun, and the corresponding file, afun.m:
function y = afun(v,transp_flag)
global F;
temp = F*v;
y = F′*temp;
return
(MatLab afun.m)
We have not said anything about the MatLab function command so far, and will say little about it here (however, see Note 5.2). Briefly, MatLab provides a mechanism for a user to define functions of his or her own devising that act in analogous fashion to built-in functions such a sin() and cos(). However, as the afun() function will not need to be modified, the user is free to consider it a black box. In order to use this function, the two commands
clear F;
global F;
(MatLab eda05_06)
need to be placed at the top of the script that uses the bicg() function. They ensure that MatLab understands that the matrix, F, in the main script and in the function refers to the same variable. Then the bicg() function is called as follows:
mest=bicg(@afun,F′*f,1e−10,3*L);
(MatLab eda05_06)
Note that only the first argument is different than in the previous version, and that this argument is a reference (a function handle) to the afun() function, indicated with the syntax, @afun. Incidentally, we gave the function the name, afun(), to match the example in the MatLab help page for bicg() (which you should read). A more descriptive name might have been better.
5.9 Reorganizing grids of model parameters
Sometimes, the model parameters have a natural organization that is more complicated than can be represented naturally with a column vector, m. For example, the model parameters may represent the values of a function, m(x, y), on a two-dimensional (x, y) grid, in which case they are more naturally ordered into a matrix, A, whose elements are Aij = m(xi, yj). Unfortunately, the model parameters must still be arranged into a column vector, m, in order to use the formulas of least squares, at least as they have been developed in this book. One possible solution is to unwrap (reorganize) the matrix into a column vector as follows:

Here, A is assumed to be an I × J matrix so that m is of length, M = IJ. In MatLab, the conversions from k to (i,j) and back to k are given by
k = (i−1)*J+j;
i = floor((k−1)/J)+1;
j = k−(i−1)*J;
(MatLab eda05_07)
The floor() function rounds down to the nearest integer. See Note 5.3 for a discussion of several advanced MatLab functions that can be used as alternatives to these formulas.
As an example, we consider a scenario in which spatial variations of pore pressure cause fluid flow in aquifer (Figure 5.6). The aquifer is a thin layer, so pressure, p(x, y), varies only in the (x, y) plane. The pressure is measured in N wells, each located at (xi, yi). These measurements constitute the data, d. The problem is to fill in the data gaps, that is, to estimate the pressure on an evenly spaced grid, Aij, of (xi, yj) points. These gridded pressure values constitute an I × J matrix, A, which can be unwrapped into a column vector of model parameters, m, as described above. The prior information is the belief that the pressure satisfied a known differential equation, in this case, the diffusion equation ∂2p/∂x2 + ∂2p/∂y2 = 0. This equation is appropriate when the fluid flow obeys Darcy's law and the hydraulic properties of the aquifer are spatially uniform.

The problem is structured in a manner similar to the previous one-dimensional gap-filling problem. Once again, the equation, Gm = d, reduces to di = mj, where index, j, matches up the location, (xi, yi), of the i-th data to the location, (xj, yj), of the j-th model parameter. The differential equation contains only second derivatives, which have been discussed earlier (Equation 5.26). The only nuance is that one derivative is taken in the x-direction and the other in the y-direction so that the value of pressure at five neighboring grid points is needed. (Figure 5.7):


Note that the central point, Aij, is common to the two derivatives, so five, and not six, grid points are involved. While these five points are neighboring elements of A, they do not correspond to neighboring elements of m, once A is unwrapped.
Once again, a decision needs to be made about what to do on the edges of the grid. One possibility is to assume that the pressure derivative in the direction perpendicular to the edge of the grid is zero (which is the two-dimensional analog to the previously discussed one-dimensional case). This corresponds to the choice, ∂p/∂y = 0, on the left and right edges of the grid, and ∂p/∂x = 0 on the top and bottom edges. Physically, these equations imply that the pore fluid is not flowing across the edges of the grid (an assumption that may or may not be sensible, depending on the circumstances). The four corners of the grid require special handling, as two edges are coincident at these points. One possibility is to compute the first derivative along the grid's diagonals at these four points.
In the exemplary MatLab script, eda05_08, the equation, Fm = f, is built up row-wise, in a series of steps: (1) the N “data” rows; (2) the (I − 2)(J − 2) Laplace's equation rows; (3) the (J − 2) rows of first derivatives top-of-the-grid rows; (4) the (J − 2) rows of first derivatives bottom-of-the-grid rows; (5) the (I − 2) rows of first derivatives left-of-the-grid rows; (6) the (I − 2) rows of first derivatives right-of-the-grid rows; and (7) the four rows of first derivatives at grid-corners. When debugging a script such as this, a few exemplary rows of, F and f, from each section should be displayed and carefully examined, to ensure correctness.
The script, eda05_08, is set up to work on a file of test data, pressure.txt, that is created with a separate script, eda05_09. The data are simulated or synthetic data, meaning that they are calculated from a formula and that no actual measurements are involved. The test script evaluates a known solution of Laplace's equation
on N randomly selected grid points and adds a random noise to them to simulate measurement error. Random grid points can be selected and utilized as follows:
rowindex=unidrnd(I,N,1);
xobs = x(rowindex);
colindex=unidrnd(J,N,1);
yobs = y(colindex);
kappa = 0.1;
dtrue = 10*sin(kappa*xobs).*exp(−kappa*yobs);
(MatLab eda05_09)
Here, the function, unidrnd(), returns an N × 1 array, rowindex, of random integers in the range (1, I). A column vector, xobs, of the x-coordinates of the data is then created from the grid coordinate vector, x, with the expression, xobs = x(rowindex). A similar pair of expressions creates a column vector, yobs, of the y-coordinates of the data. Finally, the (x, y) coordinates of the data are used to evaluate Equation (5.31) to construct the “true” synthetic data, dtrue.
Normally distributed random noise can be added to the true data to simulate measurement error:
sigmad = 0.1;
dobs = dtrue + random(‘normal’,0.0,sigmad,N,1);
(MatLab eda05_09)
Here, the random() function returns an N × 1 column vector of random numbers with zero mean and variance, σd2.
Results of the eda05_08 script are shown in Figure 5.8. Note that the predicted pressure is a good match to the synthetic data, as it should be, for the data are, except for noise, exactly a solution of Laplace's equation. This step of testing a script on synthetic data should never be omitted. A series of tests with synthetic data are more likely to reveal problems with a script than a single application to real data. Such a series of tests should vary a variety of parameters, including the grid spacing, the parameter, κ, and the noise level.

Problems
5.1 The first paragraph of Section 5.2 mentions one type of prior information that cannot be implemented by a linear equation of the form, ![]() . What is it?
. What is it?
5.2 What happens in the eda05_05 script if it is applied to an inconsistent dataset (meaning a dataset containing multiple points with the same xs but different ds)? Modify the script to implement a test of this scenario. Comment on the results.
5.3 Modify the eda05_05 script to fill in the gaps of the cleaned version of the Black Rock Forest temperature dataset. Make plots of selected data gaps and comment on how well the method filled them in. Suggestions: First create a short version of the dataset for test purposes. It should contain a few thousand data points that bracket one of the data gaps. Do not run your script on the complete dataset until it works on the short version. Only the top part of the script needs to be changed. First, the data must be read using the load() function. Second, you must check whether all the times are equally spaced. Missing times must be inserted and the corresponding data set to zero. Third, a vector, rowindex, that gives the row index of the good data but excludes the zero data, hot spikes, and cold spikes must be computed with the find() function.
5.4 Run the eda05_07 script in a series of tests in which you vary the parameter, κ, and the noise level, σd. You will need to edit the eda05_08 script to produce the appropriate file, pressure.txt, of synthetic data. Comment on your results.
5.5 Suppose that the water in a shallow lake flows only horizontally (i.e., in the (x, y) plane) and that the two components of fluid velocity, vx and vy are measured at a set of N observation points, (xi, yi). Water is approximately incompressible, so a reasonable type of prior information is that the divergence of the fluid velocity is zero; that is ∂vx/∂x + ∂vy/∂y = 0. Furthermore, if the grid covers the whole lake, then the condition that no water flows across the edges is a reasonable one, implying that the perpendicular component of velocity is zero at the edges. (A) Sketch out how scripts eda05_07 and eda05_08 might be modified to fill in the gaps of fluid velocity data.
5.6 In the example shown in Fig. 5.8, a two-dimensional pressure field p(x, y) is reconstructed using sparse data and the prior information that the field satisfies Laplace’s equation. Consider an alternative scenario in which the pressure is believed to vary smoothly but the equation that it satisfies is unknown. In that case, we might opt to use a combination of flatness:

(say with variance σs2) and smallness ![]() (say with variance σm2) to create a smooth solution. Modify eda05_06.m to solve this problem and adjust σs2 and σm2 by trial and error to produce a solution that is a reasonable compromise between smoothness and goodness of fit. How much worse is the error, compared to the solution that employs Laplace’s equation?
(say with variance σm2) to create a smooth solution. Modify eda05_06.m to solve this problem and adjust σs2 and σm2 by trial and error to produce a solution that is a reasonable compromise between smoothness and goodness of fit. How much worse is the error, compared to the solution that employs Laplace’s equation?