Modeling business processes
Keywords
Activities; As-Is, Could-Be, To-Be diagrams; Case management; Customer process; Decision; Events; Flows; Process flow problems; Process management problems
In Chapter 4 we considered how we might model all the high-level processes in an organization and store that information as a business process architecture. Once an organization has created a business process architecture, then any specific process change project becomes a matter of redefining or elaborating on a well-defined portion of the business process architecture. If a company has not created a business process architecture it often needs to model specific processes from scratch. In Chapter 8 we considered how you might begin such an effort by creating an informal model of a process to determine the scope of a business process. In essence, we treated the process itself as a kind of “black box.” We didn’t ask how it worked, but focused instead on how it reacted with people, systems, and processes that lay outside the process we were focusing on. In this chapter we are going to consider how one creates a formal model of a business process. We will consider techniques that can be used to model anything from a small process to a complex value chain.
In essence, at this point we are going to look “inside” the process that we pictured in our scope diagram in the previous chapter. Before we turn to formal flow diagramming, however, let us consider the other two types of process problems that we are interested in analyzing.
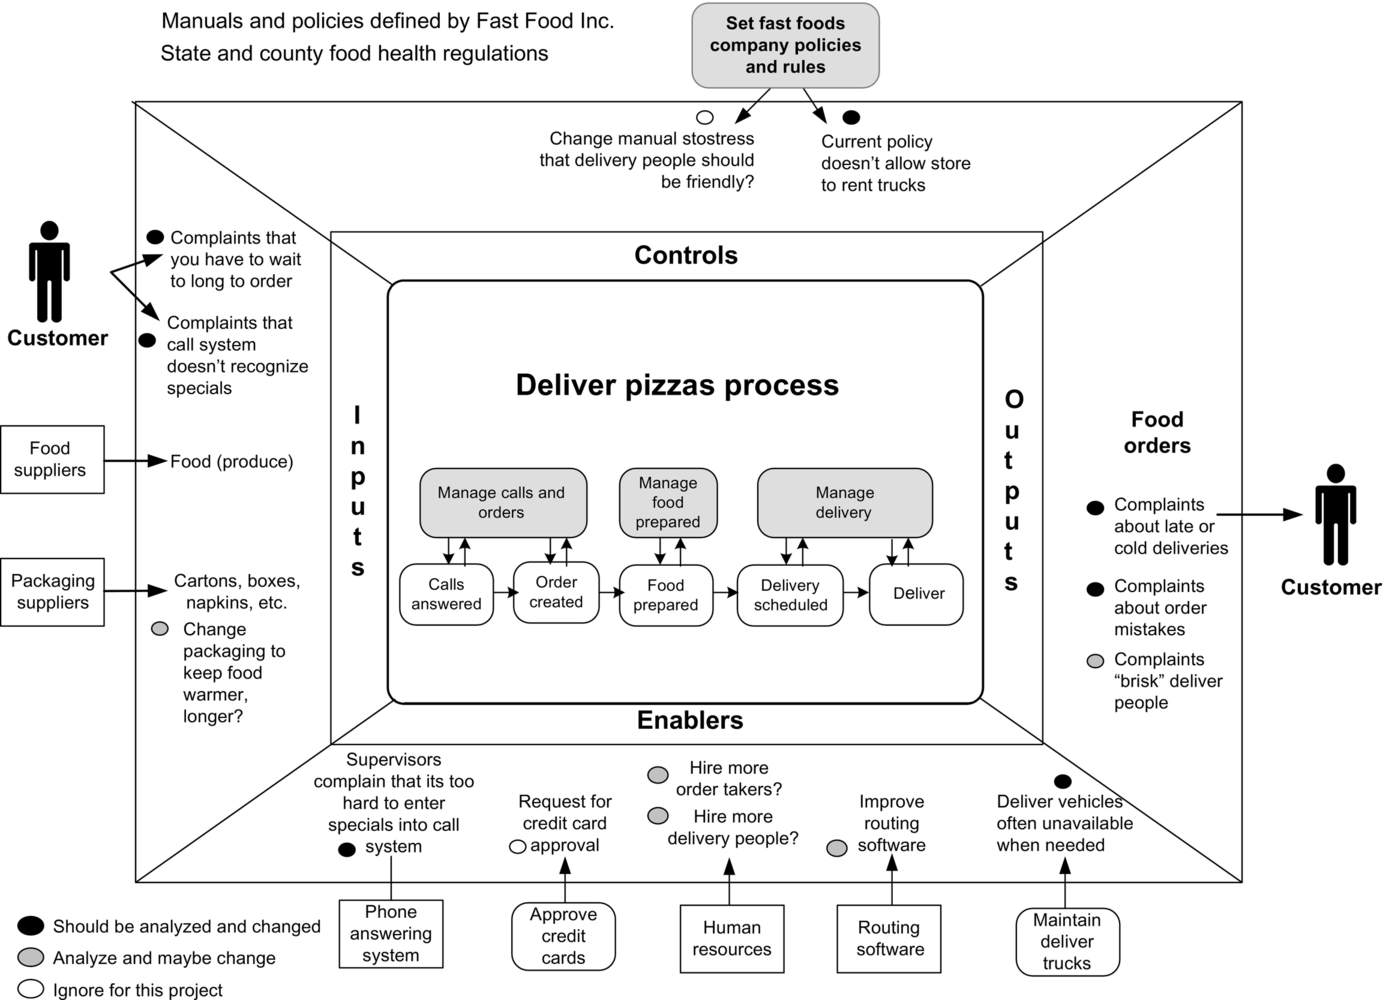
Figure 9.1 shows a process scope diagram with the five subprocesses we initially identified as those contained within the deliver pizzas process. We have connected the five processes into a flow diagram. Flow problems occur because some of these subprocesses are poorly designed or because the flow is not the best possible sequence. In addition, each of the processes has a manager or supervisor who is responsible for the work that goes on within that subprocess. Process management problems occur because one or more of the managers assigned to plan, organize, monitor, and control the subprocesses is not doing his or her job as well as possible.
In essence, every process or activity should have someone who is responsible for ensuring that the process or activity is accomplished. This process manager may be a team leader, a supervisor, or a manager who is responsible for several other activities, including this one. It is the manager who is responsible for ensuring that the process has the resources it needs, that employees know and perform their jobs, and that employees get feedback when they succeed or when they fail to perform correctly. It is just as likely that a process is broken because the manager is not doing his or her job as it is that the process is broken because of the flow of activities or the work of the employees.
Process Flow and Process Management Problems
We considered four of the six process problem types in Chapter 8. Here we begin with the fifth type of problem and consider the flow of the subprocesses or activities of the process. We typically develop a flow diagram to ensure we understand the subprocesses and the flow between them, and we ask everyone involved in the process several questions to explore the following possibilities.
- 5.1 Problems with Logical Completeness
- • Some activities are not connected to other, related activities.
- • Some outputs have no place to go.
- • Some inputs have no place to go.
- 5.2 Sequencing and Duplication Problems
- • Some activities are performed in the wrong order.
- • Some activities are performed sequentially that could be performed in parallel.
- • Work is done and then put into inventory until needed.
- • Some activities are performed more than once.
- • There are no rules for determining or prioritizing flows between certain activities or individuals.
- 5.3 Subprocess Inputs and Outputs
- • The inputs and outputs of subprocesses are wrong or inadequately specified.
- • Subprocess inputs or outputs can be of inadequate quality, insufficient quantity, or untimely.
- • Subprocesses get inputs or make outputs that are unnecessary.
- • Some subprocesses do things that make for more work for other subprocesses.
- 5.4 Process Decision Making
- • The process-in-scope, or one of its subprocesses, is called on to make decisions without adequate or necessary information.
- • The process-in-scope, or one of its subprocesses, is required to make decisions without adequate or complete guidance from the value chain or organization (e.g., decisions are being made without stated policies or without specific business rules).
- 5.5 Subprocess Measures
- • There are inadequate or no measures for the quality, quantity, or timeliness of subprocess outputs.
Subprocess measures are lagging measures and do not provide the process manager or other employees with the ability to anticipate or plan for changes in pace or flow volume. Keep in mind that we will explore all these issues in greater detail as we proceed with our process analysis effort. During the initial scoping phase we are simply trying to get an overview of what could be wrong with the process. At this point we are looking for problems that stand out and that will clearly have to be addressed if we are to eliminate the gap between the existing process and the process that management wants. Figure 9.1 shows our process scope diagram with the provide delivery service process, subdivided into five subprocesses, pictured in the process area. It also shows the three management processes that control those activities.
Day-to-Day Management Problems
We also consider how the process, as a whole, and each of its subprocesses or activities are managed. Some of the questions we ask when we consider if there are problems with the day-to-day management processes include the following:
- 6.1 Planning and Resource Allocation Problems
- • The process manager working on the process-in-scope is given lagging data, but no leading data that he or she can use to anticipate work, plans, or schedule.
- 6.2 Monitoring, Feedback, and Control Problems
- • The employees working on the process-in-scope are not held responsible for achieving one or more key process goals.
- • The employees working on the process-in-scope are punished for pursuing one or more key process goals.
- • The employees working on the process-in-scope are not given adequate information about the performance of the process he/she is responsible for managing.
- • The employees working on the process-in-scope are given lagging data, but no leading data that they can use to anticipate work, plans, or schedule.
- • The employees working on the process-in-scope are either not rewarded for achieving key process goals or are punished for achieving key process goals (e.g., the employee who works the hardest to ensure that the process-in-scope meets a deadline is given more work to do).
- 6.3 Manager’s Goals and Incentives Conflicted
- • The process manager is trying to achieve functional/departmental goals that are incompatible with the goals of the process-in-scope.
- • The process manager does not have the authority, budget, or resources required to effectively manage the process-in-scope.
- 6.4 Manager Accountability
- • The process manager is not held responsible for achieving one or more key process goals.
- • The process manager is punished for pursuing one or more key process goals.
- • The process manager is not given adequate information about the performance of the process he/she is responsible for managing.
There is an important distinction between day-to-day process management and the more generic, higher level management processes that are included under controls. Thus, for example, a day-to-day manager is responsible for ensuring that employees know and apply the business rules that apply to a given process. In most cases that manager is not responsible for creating, maintaining, or changing the business rules. If the business rules are not being applied we focus on the day-to-day process manager. If the business rules are wrong or should be changed we are probably going to have to look at the higher level management process that sets policy and defines business rules.
Stepping back from our analysis of process problems, however, it is easy to see that the process scope diagram is fine for identifying external problems, but would rapidly become too complex if we tried to show the internal subprocesses and the flow in a single diagram. Thus we use a process scope diagram to define the relationships between a process and its external surroundings, and we use process flow diagrams to define internal relations.
Process Flow Diagrams
Formal process flow diagrams are often called process maps, activity diagrams, or workflow diagrams. Historically, process analysts have used a wide variety of different diagramming notations to describe processes. This is not surprising when you consider all the different groups that do process diagramming. In some cases business managers create diagrams just to figure out how a complex process works. In other cases a Six Sigma team will create a diagram as they prepare to focus on improving a specific process. In still other cases an IT group will create a process diagram as the first step in a project to automate a process.
The most important practical distinction in process modeling is between the relatively informal diagrams that business managers use to help them understand processes and the relatively formal diagrams that IT software developers use to specify exactly how a software program might implement the process. IT software diagrams can be complex and include details that business people are not interested in. At the same time IT people rarely consider large processes, like a corporate supply chain, that include many tasks that employees perform. We believe that companies that are serious about business process change need to create architectures and store information about processes in business process repositories. To do this everyone in the organization needs to adopt a standard notation and use it consistently. Most companies adopt the notation of the business process modeling tool that they use to manage their business process repository. Business process modeling tools can support a variety of different notations, including tailored variations to accommodate the special needs or preferences of individual companies. It is not so important what notation is used, but it is important that whatever notation is used is used consistently.
In the past few years a consensus on business process notation has begun to emerge. It began with diagrams introduced by Geary Rummler and Alan Brache in their popular 1990 book Improving Performance. The notation introduced in Improving Performance is usually called Rummler-Brache notation. The Rummler-Brache notation was further formalized in an IBM notation called Line of Vision Enterprise Methodology (LOVEM). Then some Rummler-Brache concepts were incorporated into the Object Management Group’s (OMG) unified modeling language (UML) activity diagrams. In 2004 the Business Process Management Initiative (BPMI) group brought most of the major business process modeling tool vendors together to create a new notation—the Business Process Model and Notation (BPMN)—which is close to the OMG’s activity diagram notation. In 2005 the BPMI organization merged with the OMG and the OMG is now working to ensure that BPMN and UML activity diagrams work smoothly together. Both UML activity diagrams and BPMN diagrams have large sets of symbols and can represent complex processes so precisely that the diagrams can be used to generate software code. This level of detail would overwhelm most business process modelers. BPMN diagrams, however, support a core set of diagramming elements and these core elements represent the emerging consensus and are rapidly becoming the standard notation supported by business process tools and by business process authors. We use the core BPMN notation throughout this book whenever we diagram complex processes, as we do in this chapter. In Appendix 1 we describe the core BPMN notation, and show some of the extensions that one can use with the core elements to create more complex diagrams.
The only major alternative to the approach we use herein is represented by the event-driven process chain (EPC) diagrams popularized by SAP and ARIS software tools. EPC diagrams are widely used by those who model processes in conjunction with enterprise resource planning efforts. Most business people find EPC diagrams difficult to understand, because they rely too heavily on concepts that are relevant for software development but irrelevant for most process redesign or improvement efforts.
Business people model to simplify, highlight, clarify, and communicate. Thus, any notation that makes things too complex is counterproductive. At the same time we want to enable different individuals within the same organization to read common process diagrams; thus we need to agree on a minimum set of conventions. We believe that the core set of BPMN notational elements provides the best that is currently available. On the other hand, when we find we want to express something that is not easily expressed in BPMN we feel free to informally extend BPMN to be sure we make our point as clearly as possible.
Flow Diagramming Basics
Figure 9.2 illustrates the basic elements in any process notation. A process is a set of activities that receives and transforms one or more inputs and generates one or more outputs. For the purposes of this discussion we are using process, subprocess, and activity almost as if they were synonyms. In creating diagrams we commonly decompose a process into its subprocesses. Then we refer to those subprocesses in turn as processes when we undertake further decomposition. And, informally, we speak of the processes making up any larger process as the activities of the larger process.
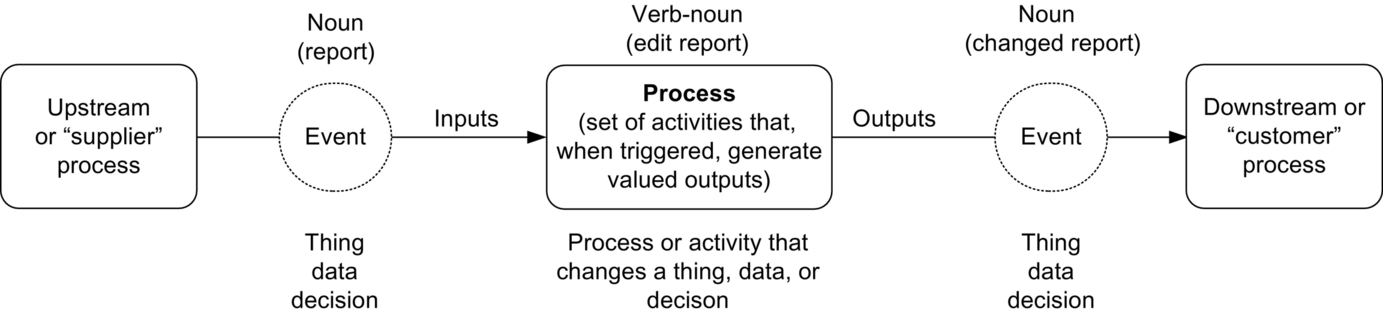
In BPMN a process or an activity is represented by a rectangular box with rounded corners. To simplify our explanations we will refer to this as a “process rectangle” or an “activity rectangle,” which is a little simpler than always saying a “rectangle with rounded corners.” In Figure 9.2 we show three process rectangles: one in the center; one upstream, which generates the inputs for the center process; and one downstream, which receives the outputs of the center process.
A process takes time. An event, on the other hand, is simply a point in time. Specifically, it is the moment in time when one process has concluded and generated an output. Or, looked at from downstream, it is the point in time at which an input becomes available for use by the downstream process. In some cases we say that events “trigger processes”—as when a customer calls to request service. Events are represented by circles. We often represent the initial event that triggers a process as a circle, and we usually include another circle to show that a process has concluded. We usually do not include events between activities within a process flow, although some analysts do.
In the real world, processes are occasionally arranged so that a series of processes follow one another without any time elapsing between them. In other situations one process will conclude and place its output in a bin, where it may wait for hours or days until it is removed by the subsequent process. Events are often described with names that describe the artifact that passes between two processes. Imagine the upstream process in Figure 9.2 assembles a set of documents, puts them in a tray, and places them where the center process can get them. We might term the upstream process “assemble documents.” And we might term the output of that process “assembled documents.” By the same token the inputs of the center process would be “assembled documents.” Assume the center process reviewed the assembled documents and determined to make a loan or to refuse a loan. The output of the center process in this case would be “approved/disapproved loan.” Another output might be “documents to file.” We represent the flow of artifacts and decisions between processes with arrows. If we need to describe the artifacts or decisions we can write labels above or below the arrows. If we really needed to record a lot of data about the artifacts or decisions that occurred in a particular process we could insert an event circle between two process rectangles, although this is an uncommon convention.
Software systems that monitor human or other software processes usually store data when events occur. Thus if the people working in the upstream process are using computers they will most likely assemble the documents into a software file, and hit some key to “pass” the file to the next process. The software system monitoring the work will update its records as a file is moved from one process to another. Most business managers create models to understand processes. For their purposes process rectangles and arrows are important. Similarly, the nature of the artifact or decision being made may be important. Events are more important to software modelers who need to know when databases will be updated.
Figure 9.3 represents a simple BPMN diagram. Let’s assume we have a process that does nothing but send brochures to customers who telephoned in and requested them. We picture two swimlanes: one for the customer and a second for the process. Within the customer swimlane we show two events: a circle that represents the telephone call that triggers the process and a second, thicker circle that represents the termination of the process (when the brochure arrives at the customer’s mail box).
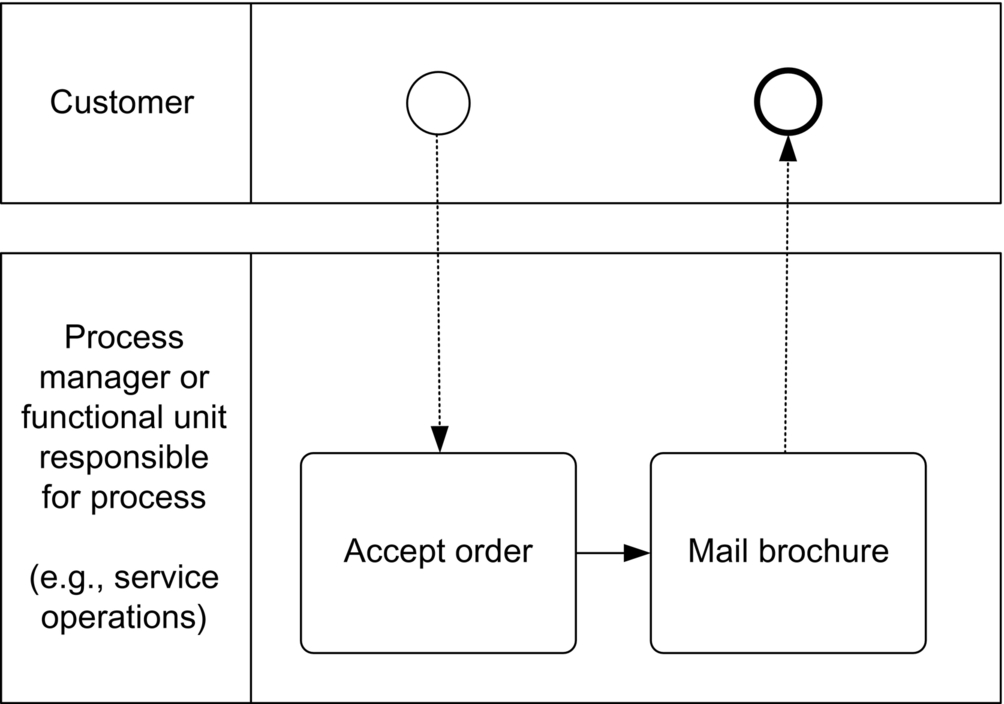
The second swimlane represents the process itself, which has two subprocesses (or activities): one that takes telephone orders and a second that addresses and mails brochures. Notice that when flow arrows cross the gap between the process and the customer swimlanes they are dotted lines. When they connect activities within the same process they are solid lines. In both cases we label the swimlanes on the left side to show who owns or is responsible for managing the activities that occur within the swimlanes. The customer is obviously responsible for the telephone call that triggers the process, and according to the diagram a functional group called service operations is responsible for the two activities that make up the process.
Figure 9.4 illustrates a slightly more complicated BPMN process diagram. In this instance we are focusing on a single, high-level order fulfillment process that begins when a customer places an order and ends when the product is delivered. In this case we have a customer swimlane, a pool of swimlanes that represent the core process, and a separate supplier swimlane. The fact that the supplier is separate simply reflects the fact that the company that manages the core process does not control the supplier. In this case several operational units are responsible for different activities that make up the core process and each, presumably, is managed by a different supervisor. In one case we have an activity that spans two units, and were it decomposed would presumably have activities managed by two different supervisors.
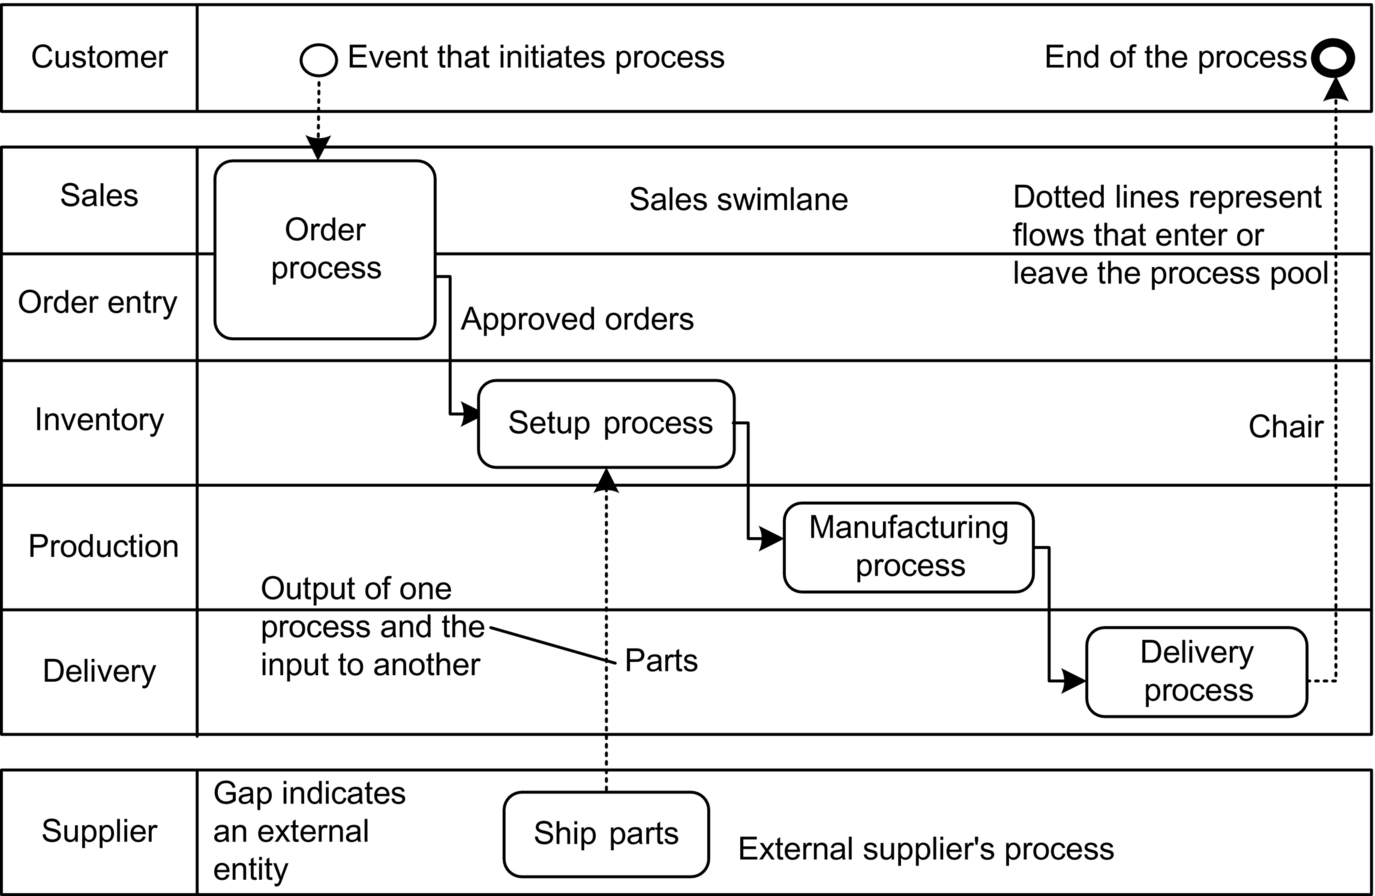
Let’s consider the notation used in Figure 9.4. We already know that we can represent the core order fulfillment process by a pool of swimlanes. Within the various swimlanes the subprocesses of the order fulfillment process are represented by process rectangles. Processes are either labeled with abstract titles, like manufacturing process, or given specific names that normally begin with a verb, such as manage leads, determine needs, or ship product.
In our figures all the text that would normally appear on a BPMN process diagram is printed in Arial. We put explanatory notes in Times Roman to make it clear that they are only notes.
The order fulfillment process shown in Figure 9.4 is represented by a pool divided into a series of horizontal rows, which are called swimlanes. Although there are exceptions, as a strong generalization as you move from left to right on a diagram you move through time. Thus a process begins on the left side of the diagram and proceeds to the right, and activities on the left take place before activities on the right.
The top swimlane is always reserved for the customer of the process being described. If the process links to the outside world, then the customer is a real, external customer of the company. Otherwise, the top lane is reserved for whatever entity or process initiates the processes shown on the diagram. In most cases this will be the downstream or “customer” process. If there is more than one customer you can insert multiple customer swimlanes at the top of the diagram. Or you may want to show a “supplier” and a “customer” as the two top swimlanes. If the diagram pictures a lower level process it is common to omit the customer swimlane and simply insert a circle to represent the trigger that initiates the process in the same swimlane as the first activity.
Sometimes we represent the initial event that starts the process as an activity performed by the customer. At other times we simply represent the initial event as a circle, as we do in Figure 9.4. We use activity rectangles whenever we want to be more specific about what the customer does. We will return to this later when we consider another diagram.
All of the activities that occur within the same organization are represented as adjacent swimlanes. If the process being described is linked to an external activity, like the ship parts activity that is performed by a supplier in Figure 9.4, the external activity is placed in its own swimlane, which is separated from the company’s process. In this case we refer to company activities as all occurring in the same pool of swimlanes, whereas the supplier’s activity occurs in a single swimlane in a separate pool. Pools generally represent organizations that share control and data. Since the order-processing organization and the supplier do not share control and may or may not share data we create two pools, one with several swimlanes and one with a single swimlane.
In some organizations a diagram similar to the one shown in Figure 9.4 might be called a workflow diagram. In a typical workflow diagram, however, we would simply represent all the activities, connected by arrows, but without swimlanes. In Figure 9.4, however, we want to show the functional or organizational units responsible for each of the activities. Thus the organizational departments or functional units are represented as pools or swimlanes. In some cases a swimlane will represent a department, in some cases it will represent a subsidiary unit within a department, and in some cases it will represent the process manager who is responsible for the activities within the given swimlane. Figure 9.3 shows that there is an inventory department and that the inventory department is responsible for the setup process. Put a different way some manager or supervisor within the reporting hierarchy of the inventory department is responsible for the setup process. If the process being described is a high-level process we usually just show departments. As we drill down and focus on more specific processes or even on specific activities we tend to get more specific about who is responsible for the subprocess or activity.
A formal process flow diagram, as we will use the term, is a workflow diagram with swimlanes. As far as we know this approach to process diagramming was originated by Geary Rummler and Alan Brache, but it has since been adopted by a wide variety of business process modelers, including the OMG, which uses swimlanes with both UML activity diagrams and BPMN diagrams.
If we analyze large-scale processes, as we are doing in Figure 9.4, it is possible that a process will be the responsibility of more than one functional group. Thus both sales and order entry are responsible for activities that occur within the order process. If we analyze the order process in more detail, however, we will need to determine just which activities sales is responsible for and which activities the order entry group performs. We allow ourselves to spread a given activity across more than one swimlane when we create high-level diagrams, but confine activities to a single lane as we refine our understanding of the process.
As you can see by glancing at Figure 9.4 we can either label arrows or not, depending on whether we think the information useful.
We usually do not represent three levels of processes on the same diagram. The diagram itself is one process, and we use process rectangles to show the major subprocesses of the single process represented by the diagram itself. In other words, we do not include process rectangles inside other process rectangles. It can certainly be done, and it is sometimes useful when you are trying to analyze processes at a high level of abstraction, but it is usually too confusing. Instead, we represent several processes or activities that are all at more or less the same level of granularity. We usually analyze high-level processes on an organization diagram and then create a diagram, like Figure 9.3, to define the major subprocesses within one process we identified on the organization diagram. The key point, however, is that if you want to know what goes on inside the order process you create a second process diagram with the order process on the title line and subprocesses within the swimlanes.
As we drill down the functional groups listed on the swimlanes keep getting more specific. In effect, we are moving down the organizational chart. Initially, we label swimlanes with department names. At a finer level of detail we may only show two departments, but subdivide each of the departments into several functional units. If we continue to drill down we ultimately arrive at swimlanes that represent specific managers or specific employee roles.
Figure 9.5 provides an overview of the way in which someone might drill down into a process. This figure shows how we use organization diagrams and charts as a way of gathering the information that we later use when we create process diagrams. In effect, the departments identified in the organization chart become the swimlanes for a process diagram, whereas the organization diagram suggests which processes we might want to analyze further.
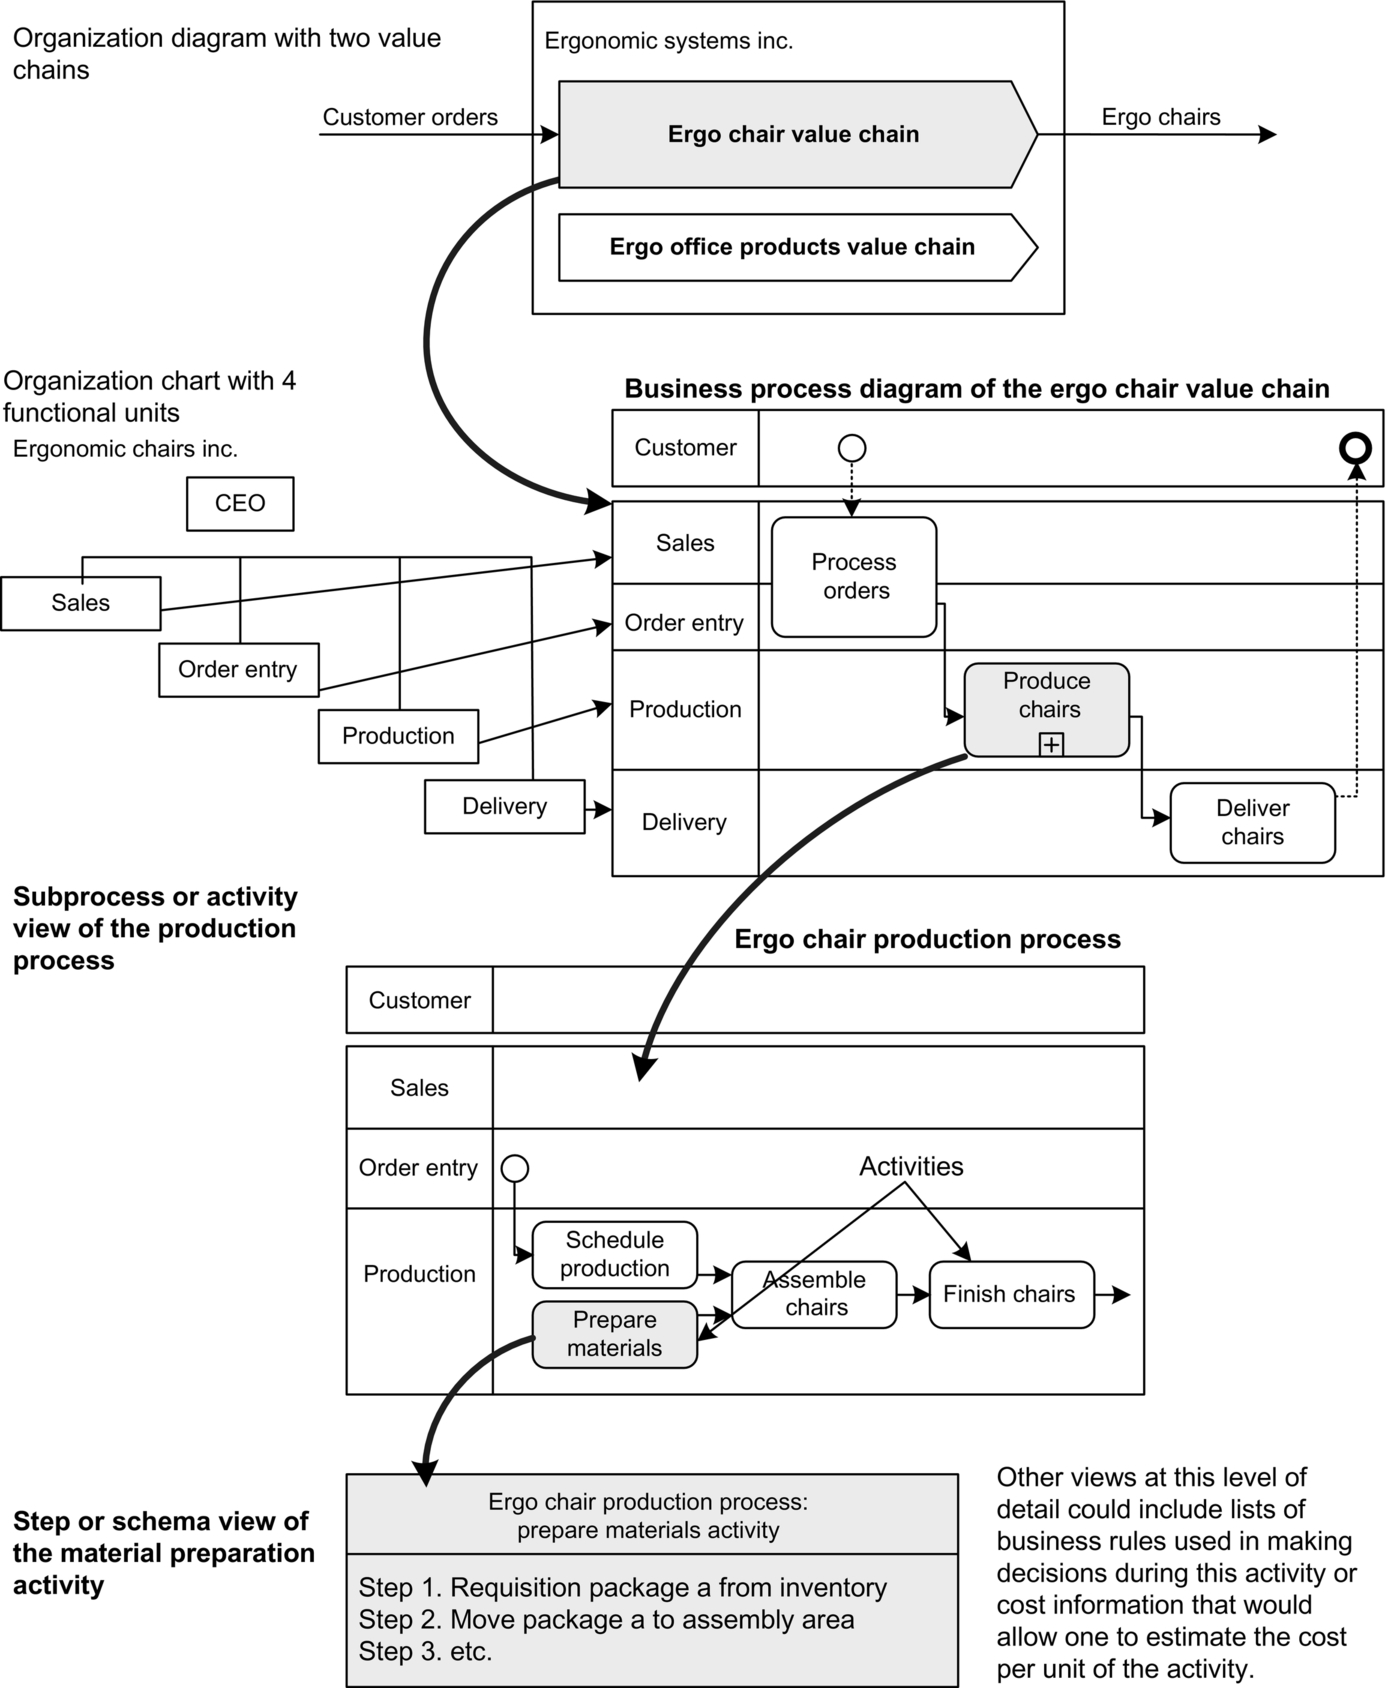
On the initial organization diagram we show two processes: two value chains. We decompose one of the value chains into three major subprocesses, which we subsequently define in more detail. The plus in a box at the bottom center of the produce chairs process rectangle is placed there to remind viewers that a more detailed subprocess diagram is available for that process.
In Figure 9.5 we assume that prepare materials is an atomic activity. In other words, for the purposes of our analysis we are not going to diagram anything that occurs within the activity box labeled prepare materials. That is not to say that we will not gather additional information about that activity. We simply are not going to create a diagram to describe the sequence of steps that occur within prepare materials. Instead, we might create a textual description of the activity involved in materials preparation. If we want a finer definition of the process we might type out a list of steps that occur during accomplishment of the activity. We will certainly want to know if the activity is performed by humans or by computers or machines, or some combination of them. Similarly, if we are planning on doing simulation we might accumulate information on the type and number of units processed in the activity, the costs per unit, and the time required per unit. If you are doing this by hand you could simply write down the information on a sheet of paper and attach it to the diagram.
Later, we will provide an activity worksheet that you can use to prompt yourself in accumulating data you might need to record for an activity. If you are using a sophisticated software tool, when you click on an activity box it opens and provides you with a worksheet in a window, and you can type in the information on your computer.
More Process Notation
In addition to the symbols we have already introduced, there are a few more a manager must know to read process diagrams. Figure 9.6 illustrates another simple process. In this figure we are looking at a process that describes how a retail book company receives orders by telephone and ships books to customers. This company does not manufacture books; it simply takes them from its inventory and sends them to customers.
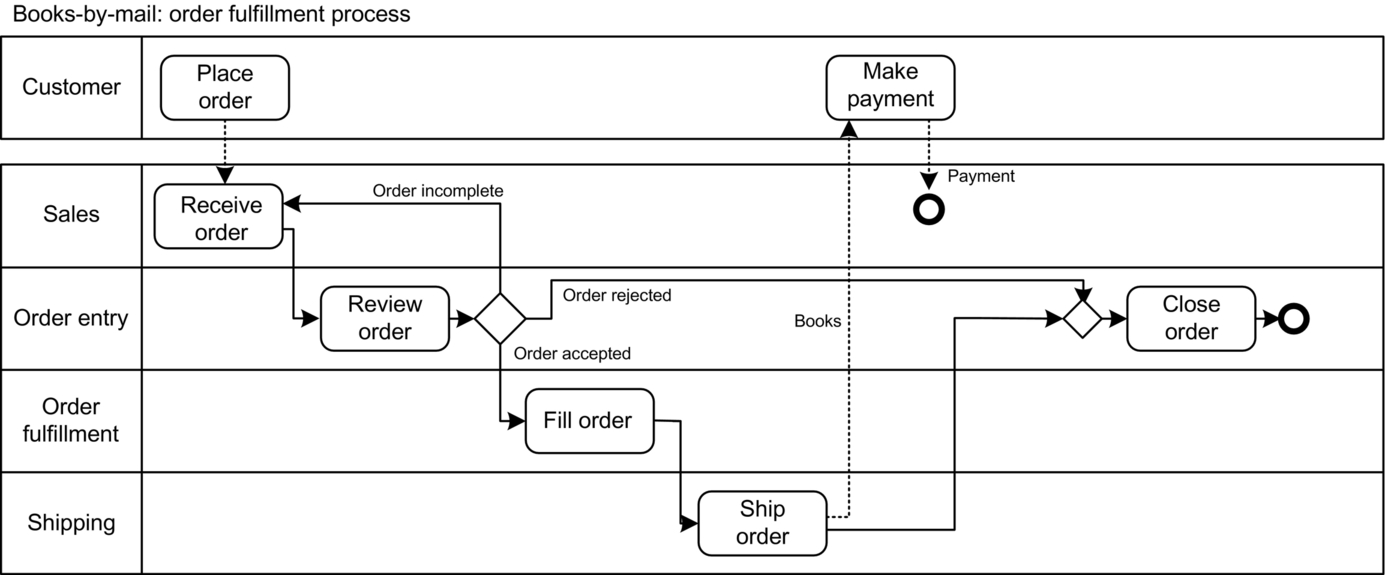
Some of the symbols in Figure 9.6 are new and others are simply variations. For example, instead of starting with a circle, we placed information inside a box that indicates that the customer placed an order. We are not concerned with what process the customer goes through in deciding to order the book, although we might be and will return to the concept of a customer process in a bit. From our perspective the placement of the order is an event or stimulus that triggers the book order fulfillment process. Hence the customer’s action is handled in a special way.
Some activities are well-defined procedures, whereas others involve the application of rules and decisions. Review order is an example of a process or activity that requires a decision. If the decision process is complex we record the decision criteria as one or more business rules and write the rules on a separate piece of paper, or record them in a software tool that associates them with the activity.
Business rules take this generic form:
- IF < something is the case >
- AND < something else is also the case >
- THEN < do this >
- ELSE < do something else >
For example, we might have a rule that said:
- IF the order is from a customer we do not know.
- AND the order is over $50.
- THEN check the credit card number for approval.
- OR wait until the check clears our bank.
Complex decision processes can involve many rules. In extreme cases there are too many rules to analyze, and we rely on human experts who understand how to solve the problem. We will consider this entire topic in more detail when we discuss how activities are analyzed in Chapter 10.
In some cases, as in the example shown in Figure 9.6, the decision is relatively simple and different activities follow, depending on the decision. We often place a diamond or gateway after the activity that leads to the decision. We indicate the alternative outcomes as arrows leading from the diamond to other activities. In the example shown in Figure 9.6 the order can be either:
- • rejected, in which case the order is terminated; or
- • accepted, in which case the order is passed on to shipping and invoicing.
In most cases a small diamond is sufficient, and outcomes are simply written by the arrows leading from the decision point.
In some cases you may want to describe the decision point in more detail. In that case you can expand the diamond into a hexagon. This is done as shown in Figure 9.7, which is a slightly more complex version of Figure 9.6. Here we have three arrows coming from the first gateway. Notice that we show one arrow running backward in time in Figure 9.7 as it goes from the decision point back to the receive order activity. This should not happen too often because it runs counter to the basic idea that a process diagram flows from left to right. On the other hand, it is sometimes useful to show loops or iterations like this rather than making the diagram much larger. We refer to it as a “loop,” because we assume that once the salesperson has called the customer and completed the order it will proceed back to the review order activity just as it did in the first instance. Most business analysts ignore the “exceptions” when they prepare their initial diagrams. Most business people do not need this level of detail, although software systems analysts do need to understand all possible outcomes. Some analysts prepare tables to describe decision situations and list all the possible outcomes. For example, what if an order form arrives and the company name is misspelled or a signature is left off?
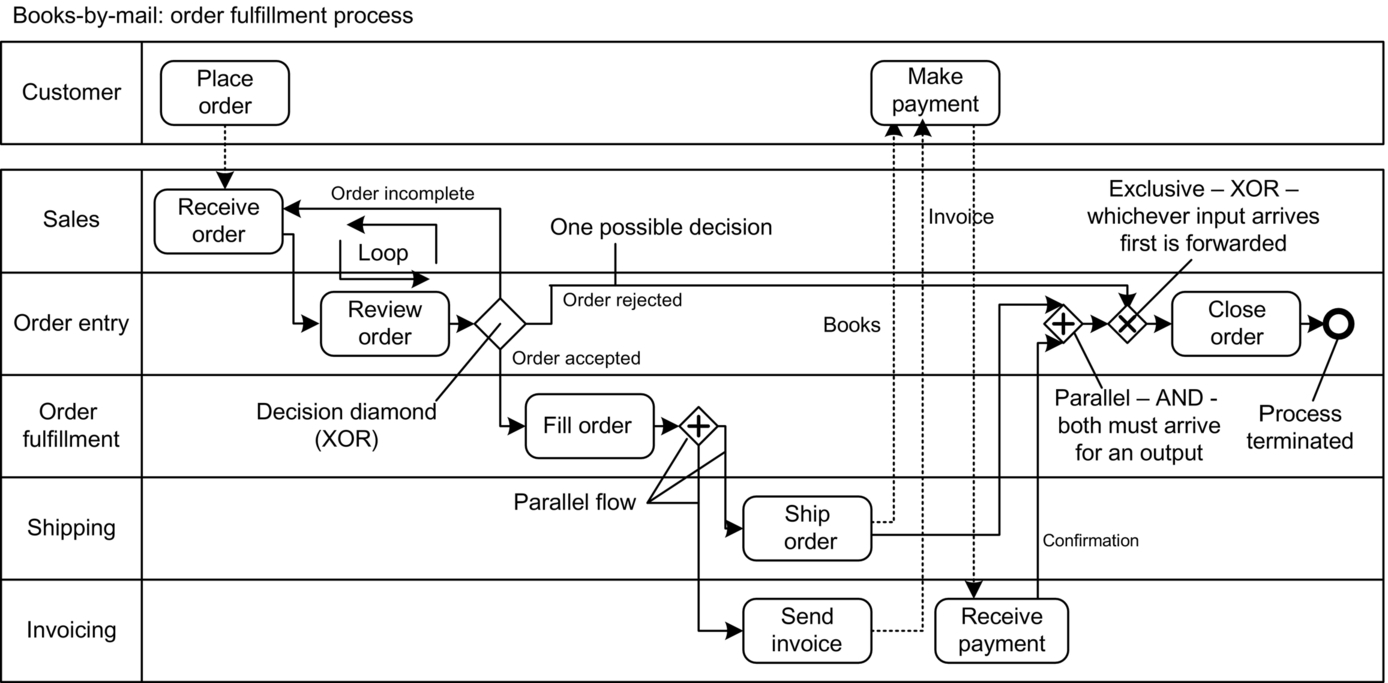
Notice the second use of a decision diamond on the right side of Figure 9.7. In this case the diamond has two inputs and only one output. In effect, the diamond says in this instance that the order is going to be closed because EITHER the order was rejected OR the order was shipped and paid for. The diamond in this second case is simply a graphical way of saying there are two different possible inputs that can trigger close order. The close order activity takes place whenever either one of the inputs arrives.
At this point we need to decide just how much information we need to record in this diagram. BPMN defines a core set of symbols, and then defines elaborations. To make it possible to use the same diagram to show either a simple overview or to include more complex information BPMN extends its core symbols. Thus, for example, any event can be represented by a circle. A circle drawn with a line of average width that appears at the beginning of a sequence, however, represents a trigger that starts a process. A circle drawn with a bold line represents the end of a process. By putting various symbols inside the circle it can be refined to represent a variety of different event types. Similarly, we can use a simple diamond to represent any of several different gateway or decision situations. Without any special notation the diamond simply shows that the flow is diverging or converging. With adornments the diamond can represent different flow conditions.
Some analysts will find these refinements useful and we may use them later in special cases, but in general we stick with the core notation and simply use a diamond. In Figure 9.7 we use two parallel diamonds and two decision diamonds, but only mark the parallel diamonds.
In effect, diamonds allow analysts to indicate the basic logic of business flows. In most cases, when you are creating an early draft of a workflow, you avoid such logical subtitles. Thus, for example, we could have shown the flow from fill order to ship order and send invoice, as shown in Figure 9.7.
These two alternatives do not tell us anything about the logic of the flow. It might be sufficient if the information from fill order only arrived at ship order, for example. It might be that different forms were sent to ship order and to send invoice. If the second we would probably label the arrows to tell us what went where. The point, however, is that you can define processes informally at first and then refine the flow to capture business rules or procedural logic as you refine the diagram.
Consider the two arrows leaving ship order in Figure 9.7. In one case the arrow represents an object or thing—books. In the second case the arrow represents information—a confirmation—sent to the person responsible for closing orders. Some analysts use different arrows to denote the flow of information and things. We do not and prefer to simply label the arrows. This usually works well enough for simple business diagrams.
Finally, from the close order activity an arrow leads to a terminal event: a bold circle. This symbol indicates that the process ends at this point. Sometimes, we also use the end point to indicate that we do not want to pursue a given workflow any further. Thus, for example, rather than use the second diamond and create that complex bit of logic just before the close order activity we might have simply let the arrow labeled “order rejected” lead to an end point. If we did it would be because we thought that what happened next was obvious and we did not want to clutter the diagram by showing the flow of that output of Review Order. (BPMN uses a double circle, one inside the other, to indicate that a flow is incomplete and continued elsewhere.)
Figure 9.8 introduces some additional symbols that you may find useful. In this case we are considering a simple process that involves letting customers order books via the Web. Thus, the two swimlanes below the customer swimlane describe an automated process. In this case other than clearly labeling them as software applications there is no essential difference between activities performed by an employee and activities performed by a software application. Indeed, in initially analyzing a process it is best to ignore how the process will be performed and focus instead on defining what needs to be done. Later, as you focus on how specific processes will be done, you will probably introduce variations to better accommodate the employees or the system, but at a high level of abstraction; it is simply work that needs to be done to satisfy customers.
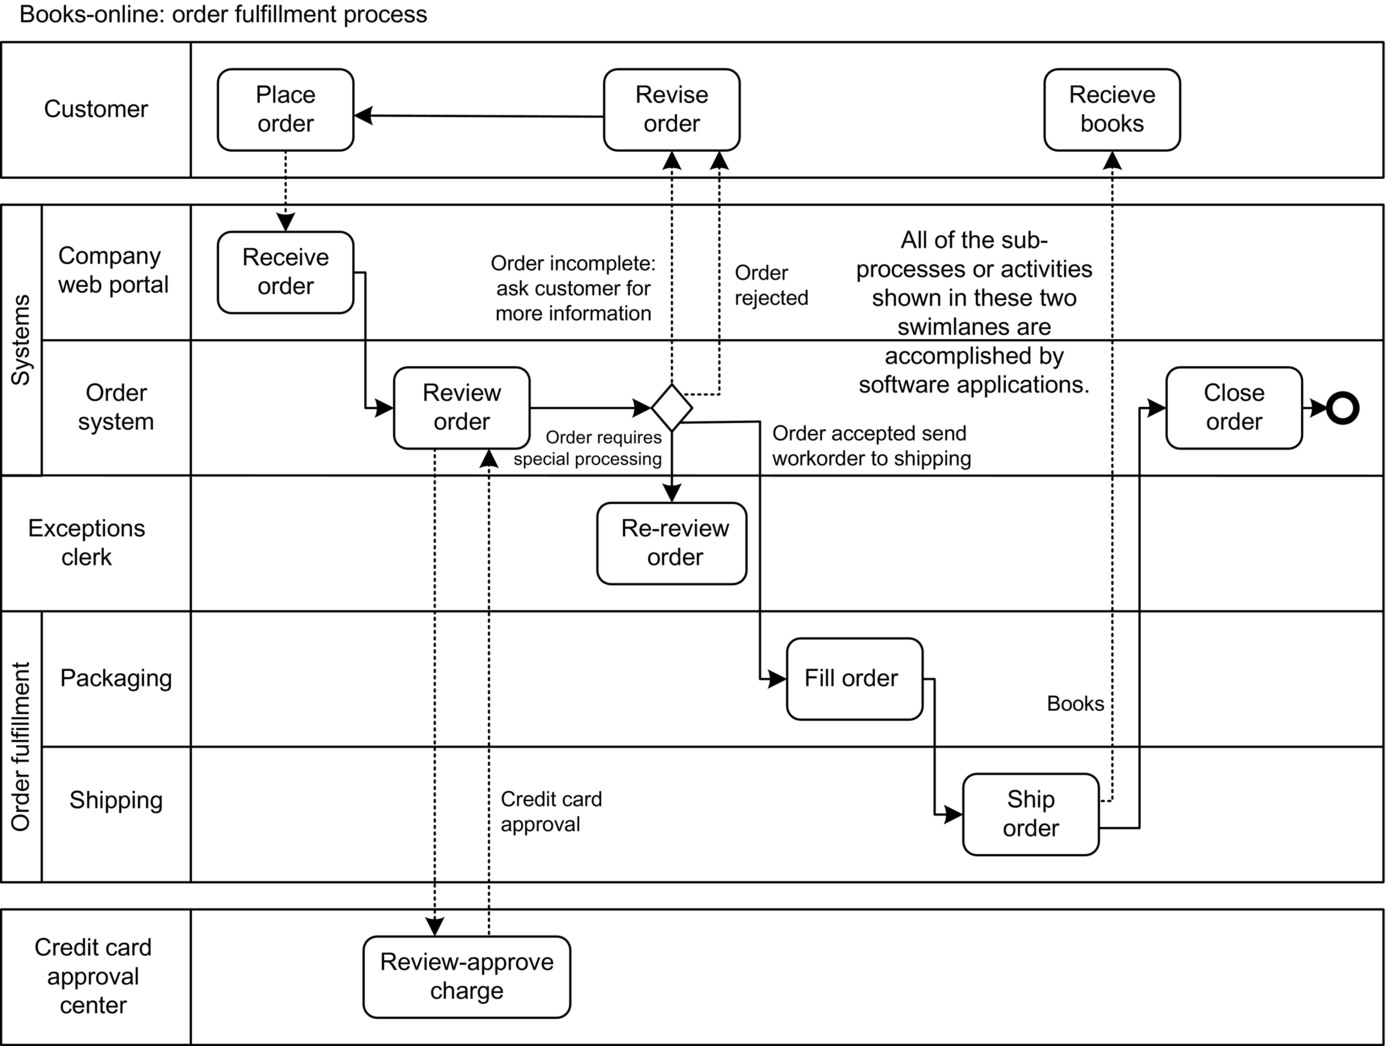
We have also used two types of labels to identify some of the swimlanes. Both the web portal and the order system are systems. (We are avoiding the issue of whether this is a departmental-based IT group or the enterprise IT organization at this point.) Both the packaging group and the shipping group report to the order fulfillment department at Books-OnLine. By representing it as we have we show some of the departmental structure or the management reporting relationships.
Most analysts make distinctions between individuals, jobs, and roles. In most cases when we speak of an activity we speak of a role. It is something one or more people do. It may or may not be a complete job. Imagine that there are six exception clerks. There is one job description for exception clerk and six individuals have been hired to do the job. Next, imagine that there are 10 different activities, or roles, that are included in the exception clerk job description. One of the activities, or roles, is to rereview orders that are listed on the special processing report generated by the order system in conjunction with the web orders. Another role might be to handle errors generated by an accounting system. In other words, the job of the exception clerk is larger than the rereview order activity. Thus, we speak of the abstract unit of work required by the rereview order activity, which could be done by any one of the six exception clerks, as a role.
Similarly, we might have a process that includes an activity that requires the approval of the VP of marketing. We might show the VP of marketing on a swimlane. Again, we would not be referring to an individual because the person holding the job might change. We would simply be referring to the job or role.
Notice that Figure 9.8 shows that the exception clerk handles orders that require special processing. In this case we did not want to follow the various flows that might come from the rereview order box. If we did we would have inserted a small box with a plus in the activity rectangle and then developed another process diagram to capture the details. You can ignore this in some cases, but it is often useful to remind readers that they can go to another diagram to obtain more detail.
Figure 9.9 provides a few more variations. In this case we are looking at a small part of an auto claims process. Here we do not show the customer, but simply begin with a claims agent submitting a claim.
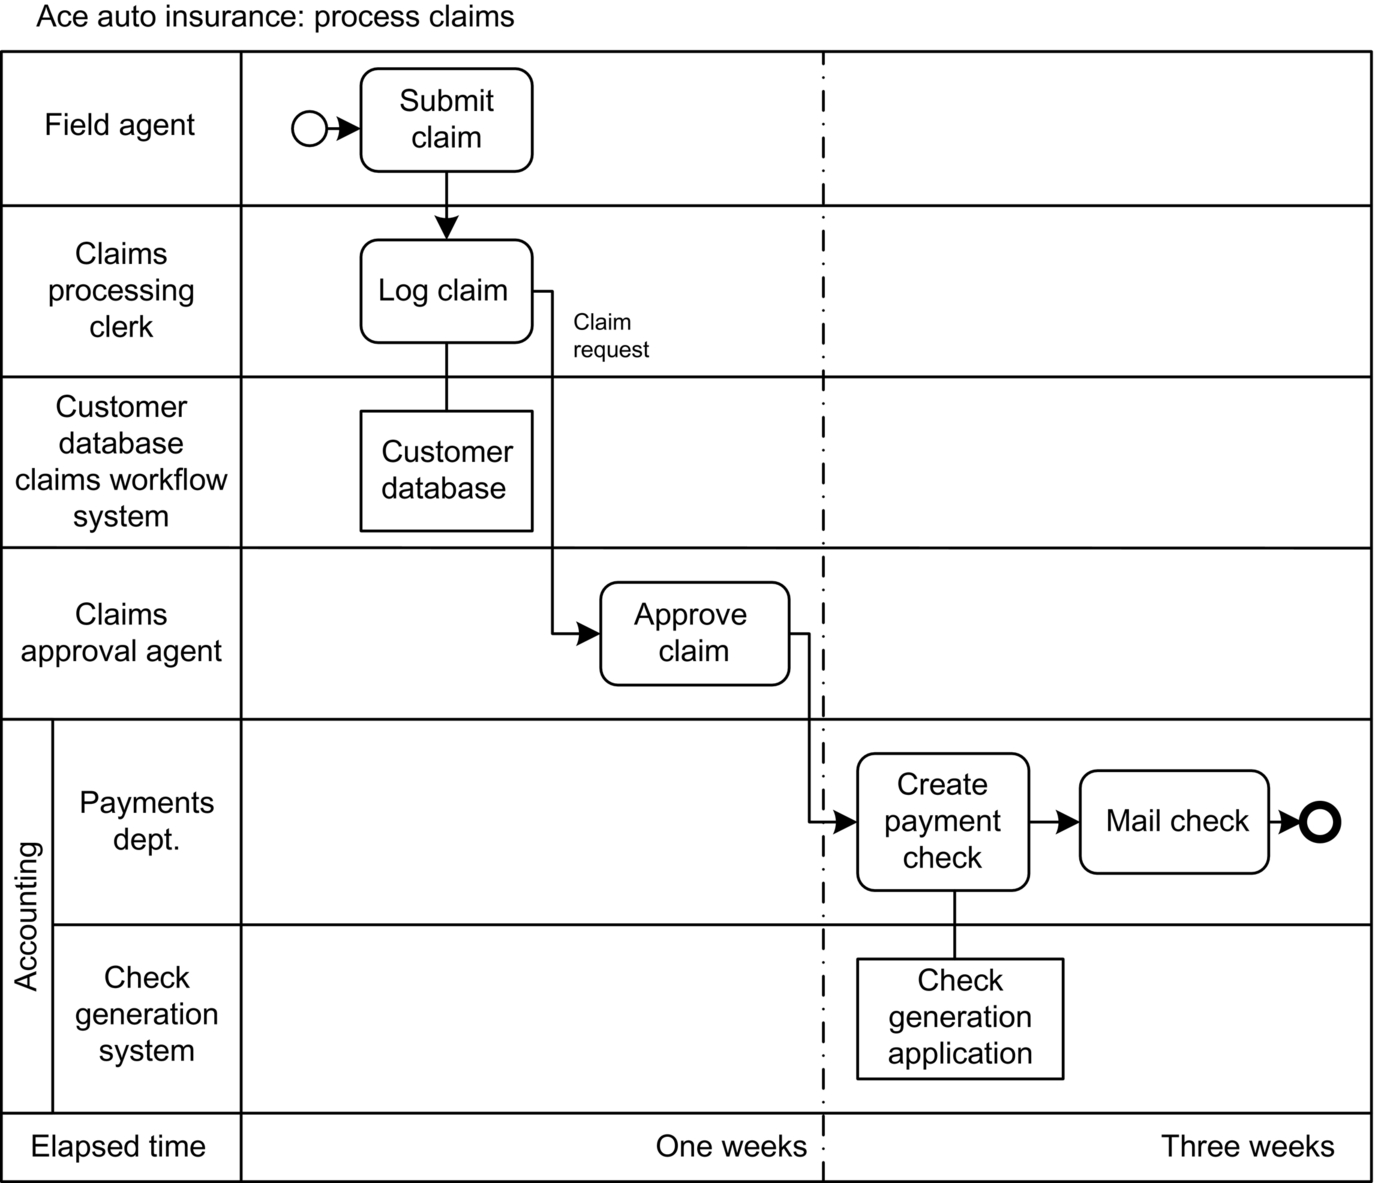
When the claim arrives a claims processing clerk enters the claim into the customer database. We show a software application/database in a swimlane, representing the unit that owns or maintains the database—probably the IT group. We picture the software application itself as a square-cornered box and connect it to the activity box with a line without an arrowhead. The application is not an activity as such, but a tool—like a file cabinet—used by the log claim activity. Because it is often important to keep track of software applications and databases, however, we frequently represent them on our process diagrams. In a similar way, the employees in the payments department use a check generation application to actually generate the checks they mail to customers.
We added a special row at the bottom of the process diagram shown in Figure 9.9 to indicate the time involved. In this example we assume that the company wants to get all claims processed within 1 week of receipt and that it wants to pay accepted claims within 3 weeks of claim acceptance. We usually do not indicate times for specific processes or activities, but it is occasionally useful to provide elapsed times for groups of activities, especially when the project is focused on reducing the time the process takes.
So far we have always shown process diagrams whose swimlanes run horizontally across the page. Some analysts prefer to have the swimlanes run vertically. If you do this, then the customer lane should be the leftmost lane and noncompany functions should be shown on the right side of the page. In Figure 9.10 we show the same information we pictured in Figure 9.9, arranged with vertical swimlanes. Obviously, in this case time will accumulate from the top downward.
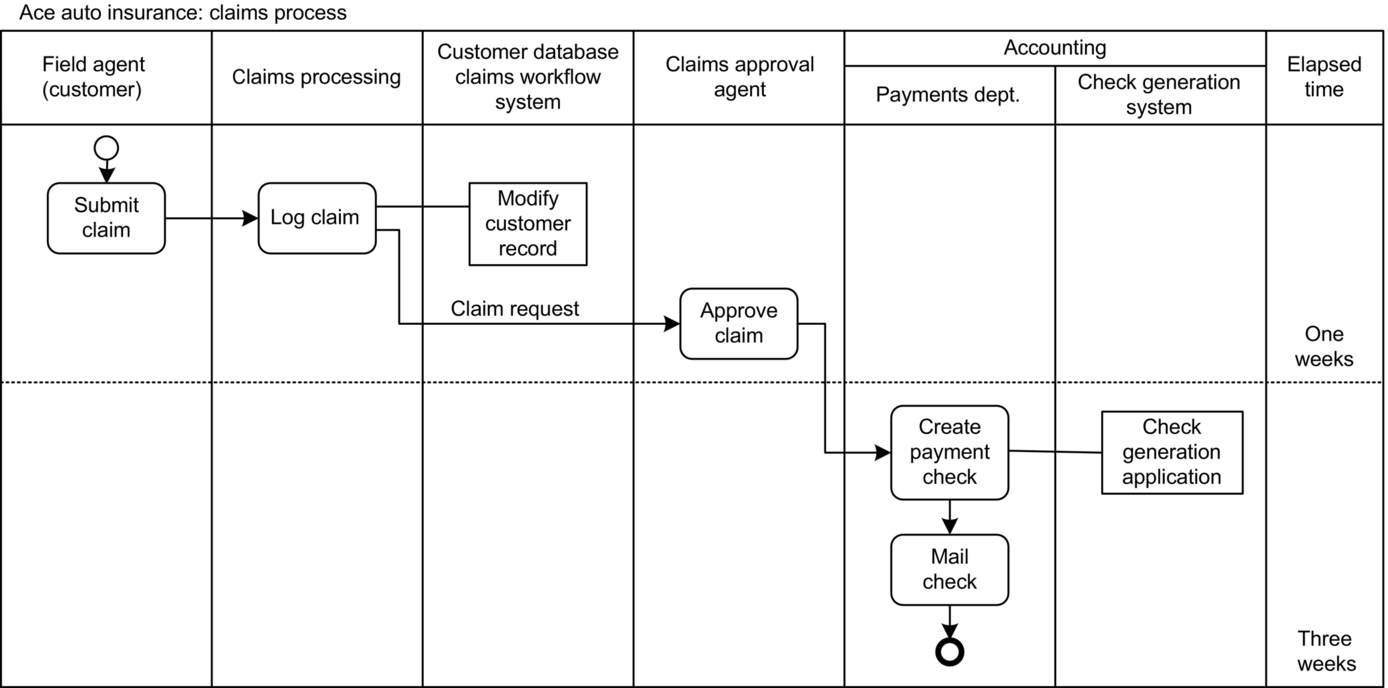
We have always found it much easier to picture the flow of activities and to fit the information into process diagrams with horizontal swimlanes, and we will use them throughout this book. But, ultimately, this is just a matter of personal preference, and readers can just as well draw process diagrams with vertical swimlanes if that orientation works better for them.
As-Is, Could-Be, and To-Be Process Diagrams
In analyzing a specific business process we usually begin with an analysis of what is currently being done. We usually refer to the process diagram that documents the existing process as the As-Is process diagram. Once we understand what is currently being done we often generate alternative workflows and compare them. When we are creating speculative alternative diagrams we usually call them Could-Be process diagrams. When we finally arrive at the new process we term that a To-Be process diagram.
Figure 9.11 provides an example of a typical As-Is process diagram. In this case we actually are showing three layers of process. The entire diagram represents the product launch process. The three labels across the top—the R&D process, the sales and marketing process, and the manufacturing and order fulfillment process—define Level 2 decomposition. We’ve also inserted bold event circles to show where each secondary process ends. The process rectangles shown in the swimlanes represent a third level of decomposition.
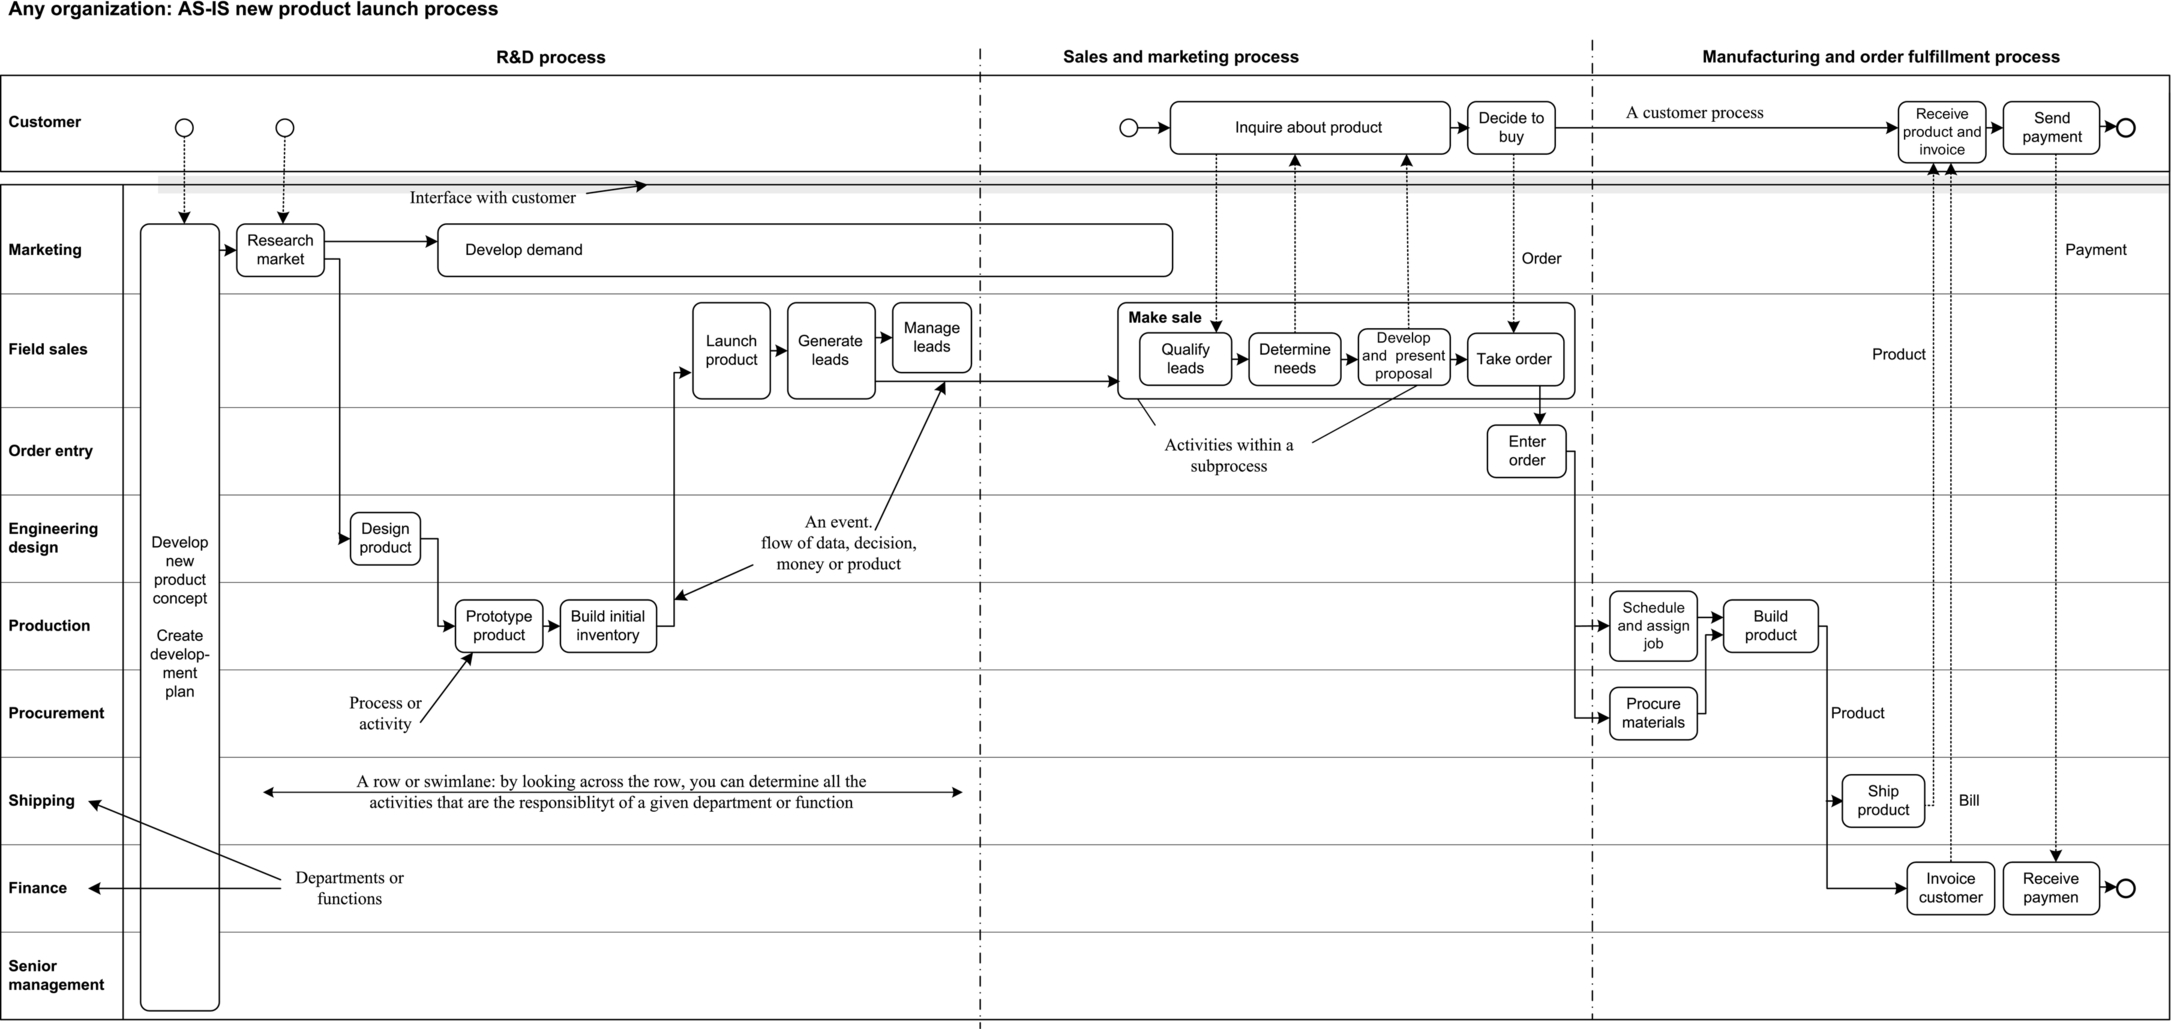
In addition, we have introduced something else that is new in Figure 9.11: a customer swimlane with customer processes. Notice that the customer processes shown in the customer swimlane are connected and begin with a trigger event and end with an end-of-process event. In most diagrams we simply represent customer activities and do not link them together, simply because we are normally focused on the company’s process. In some cases, however, it is useful to think about what a customer goes through to interact with your company. In effect, you create a customer process and then ask how you could improve it. If you can improve it, in essence, you are creating a better experience for your customer. Keep in mind when you study the customer process that the customer does not care about any processes that he or she does not interact with. The customer only cares about the steps he or she has to go through to accomplish the goals of his or her process. Imagine that you bought a laptop and now find that you need to replace a battery. You do not care what is going on inside the vendor’s company—you only focus on the specific activities you have to go through to get the battery replaced. If your company makes it a lot harder and more complex to buy a product than your competitors don’t be surprised to find that you are losing customers.
In the mid-1990s IBM promoted a business process method called LOVEM that used diagrams much like the ones used in this book. The “line of vision” referred to in the IBM method was the line between the organization and the customer, which we have highlighted in gray. Swimlane diagrams with the customer swimlane at the top provide everyone with a quick way of checking how and when your organization is interacting with its customers.
Figure 9.12 illustrates a To-Be diagram. It suggests how a team has decided to improve the new product launch process. In essence, the team decided to create a website and let the customers interact with the company via the Web. Thus when the customer interacts with the company now, he or she is interacting with a software application and information is going directly into the customer database. The customer can now access online, in the course of a single sitting, a variety of information that would otherwise have required separate inquiries. Similarly, if the customer decides to purchase the product the company now asks the customer to provide his or her credit card information, thereby arranging payment before the product is shipped. Notice how much these changes in the company’s processes have simplified the customer’s process.
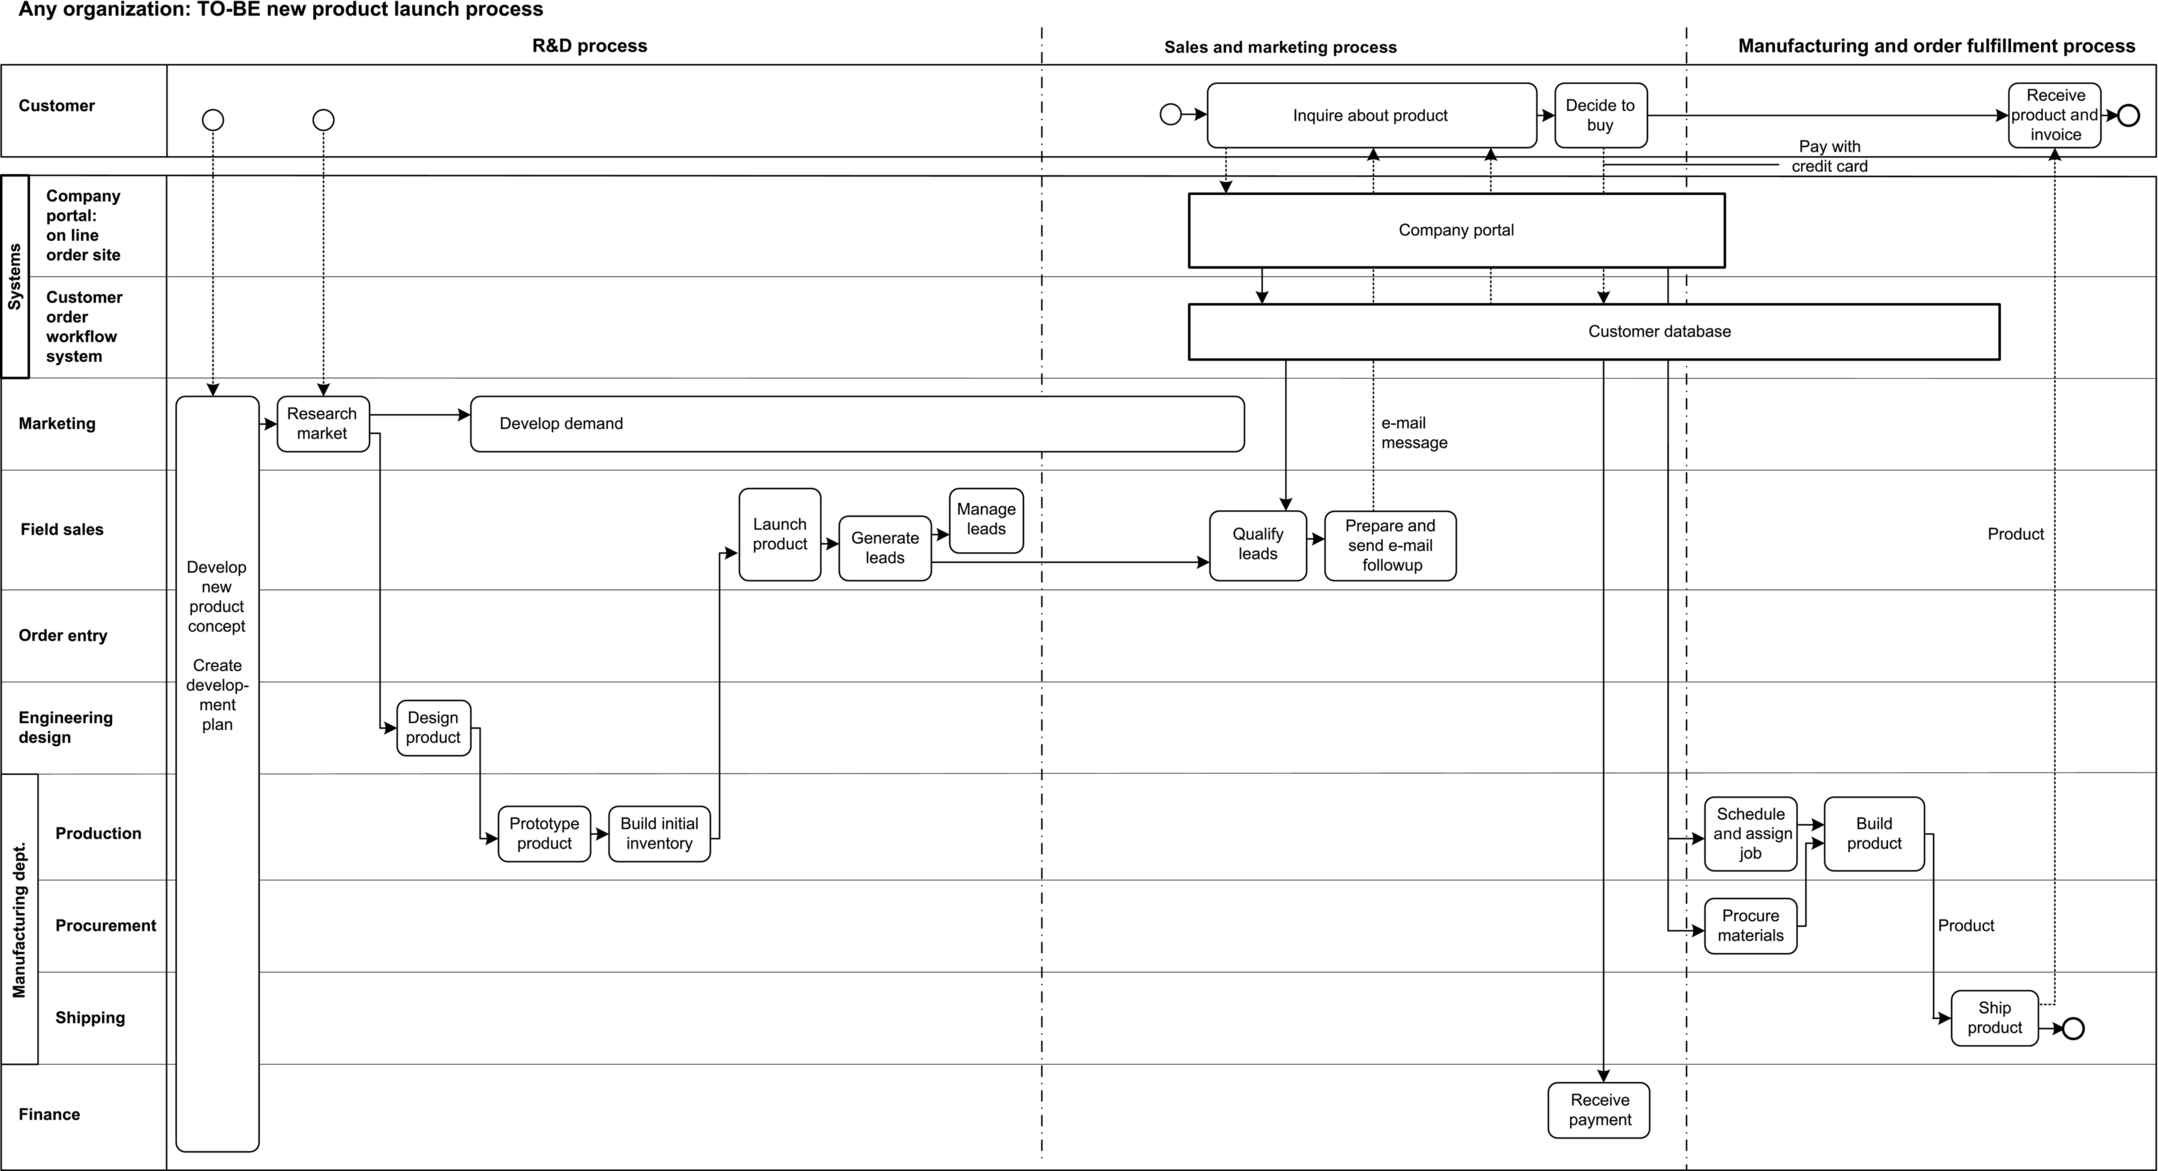
A quick glance back at Figure 9.11 will indicate that we have removed sales activities and an order entry activity. When software is introduced into business processes lots of specific activities that were formerly done by individuals at specific points in time are done on a continuous basis by the software system. It usually is not worth maintaining the information on the process diagram. What is important is that you show when information is put into the software process and when information is given to workers by the software application. If you need to track what goes on within the software process box, it is usually best to prepare a separate process diagram that just shows what happens within the software process. And since that gets technical and depends on the company’s hardware and software architecture it is usually best to leave that diagramming effort to software specialists.
In other words, in most cases you should focus on inputs and outputs to software processes and ignore the internal workings. If you want to ensure that everyone knows that the customer database is expected to maintain all information on customer contacts and orders you can write that and other system requirements on a separate note and attach it to the diagram.
We have represented some processes with long rectangles to suggest that they run while other processes are taking place. This occurs because, in effect, a workflow application or a database runs constantly, taking outputs from the processes shown on the diagram and using them to update the database, from which it subsequently withdraws the data to pass to subsequent activities.
If we were really going to try to automate the new product launch process there are many additional things we could do. We could add a production system, for example, to automatically handle scheduling and job assignments. We might also outsource the shipping operation, for example. An accounting system could automatically prepare bills. In addition, there are many activities we did not show. For example, we would probably add a third major software system to automate and control most of the accounting. New orders could be checked against the customer database as soon as they were entered, and credit checks could be handled before the order was ever transmitted to finance. An accounting system could automatically prepare invoices when it was notified that the order was shipped. Better, because it is an online system we could ask the customer to pay in advance, or provide information on an account that could be automatically debited when the product was shipped. In this case the customer database system would probably automatically contact an external financial institution to check the source of funds or the credit line to be debited later. In other words, we could automate this process a bit more. For our purposes here, however, it is enough that we have introduced the basic concepts and notation we will use when we discuss organizations, functions, and processes later in this book.
Case Management
We spoke earlier of the growing interest in modeling complex, dynamic processes. Keep in mind that just a few companies are doing this kind of modeling. Indeed, in the 2017 BPTrends Business Process Management survey we asked how many companies were currently engaged in analyzing and developing this type of process, and only a few said they were. Nevertheless, more will be doing so in the future, and vendors are already working on software features that will make the analysis, modeling, and development of a dynamic process a bit easier. So now is the time to begin to think about the nature of these processes and whether your organization ought to consider investing in dynamic technology when it becomes available.
The term case management, which is probably the most popular term for dynamic processes, comes from medical practice, so let us use a medical example. A patient calls at an emergency reception area, or drops in at his or her physician’s office, with a problem. The patient becomes a “case.” If you imagine that there was an established process—diagnose and treat patients—then, in essence, the hospital creates an instance (or case) of that process for the individual patient.
It is easy to imagine the high-level process, which we have pictured in Figure 9.13, using BPMN.
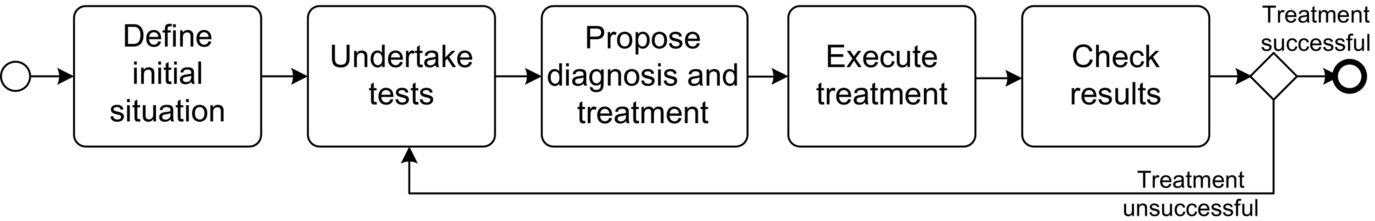
Obviously, we could refine the model shown in Figure 9.13. We could show a swimlane for the patient, and perhaps another for the laboratory when tests required specialists, or we could add adornments to indicate that each of the subprocesses shown in Figure 9.12 was undertaken by a person (a manual process), rather than being automated. Overall, however, for a variety of purposes Figure 9.13 would give us a good overview of the process.
It is hard to imagine that anyone would think the process shown in Figure 9.13 is rigid or lockstep, despite it being rendered in BPMN notation. It is at such a high level of abstraction, and each subprocess could cover such a wide range of activities, ranging from those appropriate for treating a heart attack to those used to deal with a broken arm to still others for treating the flu. If anything, surely the major complaint would simply be that it is vague. The process describes a generic approach to treating all medical problems.
So let’s think about how we might refine the process in Figure 9.13. One way might be to introduce a branching point between subprocesses 1 and 2. Something similar to what we show in Figure 9.14.
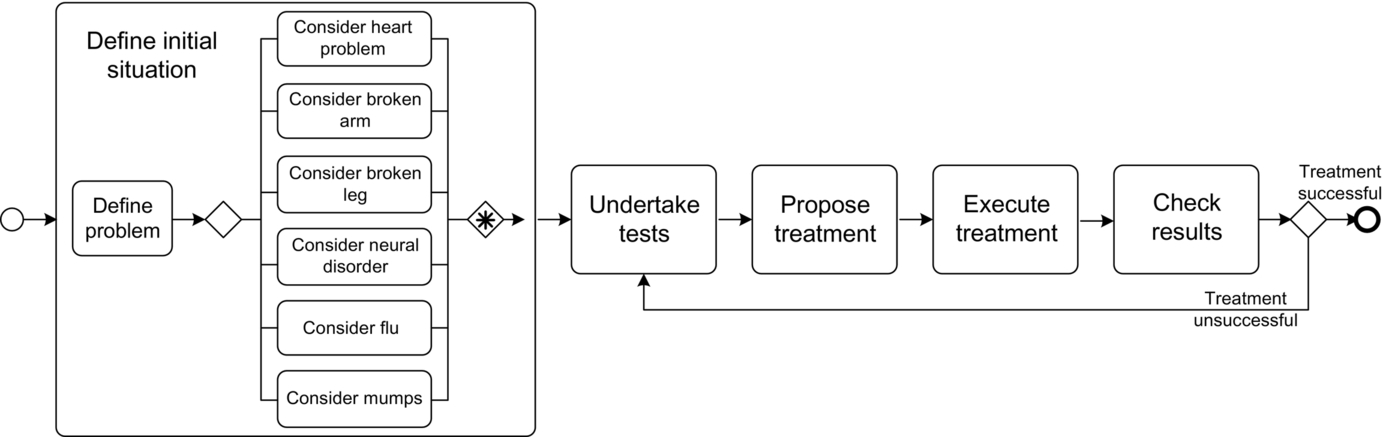
Everyone can see what is wrong with the solution in Figure 9.14. We do not begin to identify the thousands of problems that an emergency care facility or a physician might confront when a patient comes in for help. We could obviously create a hierarchy of problems, and do the diagnosis in a long series of binary decisions, as a botanist does when he or she tries to identify a plant. Still, it would be very complex.
Figure 9.15 represents a more elegant solution, but hardly improves on Figure 9.14. In essence, in Figure 9.15 we indicate that we will use business rules to make the decision during the define initial situation subprocess. As shown, however, this is almost as vague as Figure 9.13. It would only become more concrete if we showed the thousands of knowledge rules that we would need to actually make the diagnosis. Still, it could be done and it does represent a kind of solution.
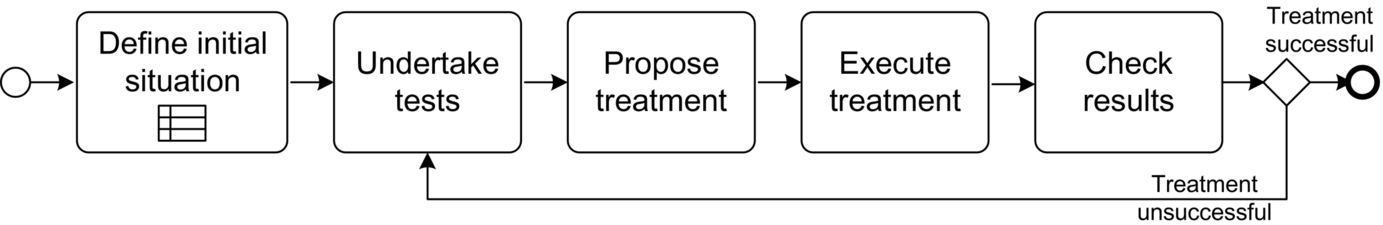
Unfortunately, even if we could handle the decision in the define initial situation subprocess, we would face another task, even more daunting, when we tried to describe all the tests we would undertake, depending on the possible problems we identified in define initial situation.
This is similar to the situation faced by analysts in the 1980s when they began to try to develop systems that could handle problems that human experts handled. They found that branching models with activities and flow arrows were inadequate. The number of branches required were simply overwhelming.
A few years ago the OMG created a task force to see what could be done to establish some standards in the case management area. The companies represented on the task force include several major Business Process Management Software vendors. In 2013 the task force released Case Management Model and Notation (CMMN).
The task force has suggested that the existing BPMN (2.0) is appropriate for defining lockstep processes and contrasted it with their CMMN approach that is appropriate for dynamic, complex processes, which they prefer to term cases. A case is represented by a file folder, with the name of a type of case on it. This makes a case diagnosis much more specific than the example we looked at in Figures 9.13–9.15. The OMG team assumes someone walks into a physician’s office and announces that he or she has a broken arm, and the physician needs to analyze that problem. Next, the OMG team assumes that a case involves several tasks, which are represented by rectangles with rounded corners (the same graphic that BPMN uses to represent a process or activity). And, although we will not go into so much detail in this chapter, the team assumes that one type of task could be a process.
Tasks are not connected by flow arrows. It is assumed that a given case includes many tasks, only a small subset of which might be used to deal with a specific instance of a case. (Imagine that the first subprocess in Figure 9.16 was a case, and each of the alternative possible problems was a task.) Some tasks do depend on others, and a light dotted line is used to link tasks. When you see the notation you are to assume that the left or upper of the two boxes must be done before the right or lower box. (No arrowheads are used to show which is prior or subsequent.)
Some rectangles are bordered with a solid line, and some are bordered with a dotted line. Those with a dotted line are discretionary and can be invoked at any time.
In addition, a diamond placed on the border of a box indicates that the task can be “triggered” by some set of circumstances. If you imagine this as being done by rules, then the diamond, which is termed an entry criterion, describes the situation that would trigger the task.
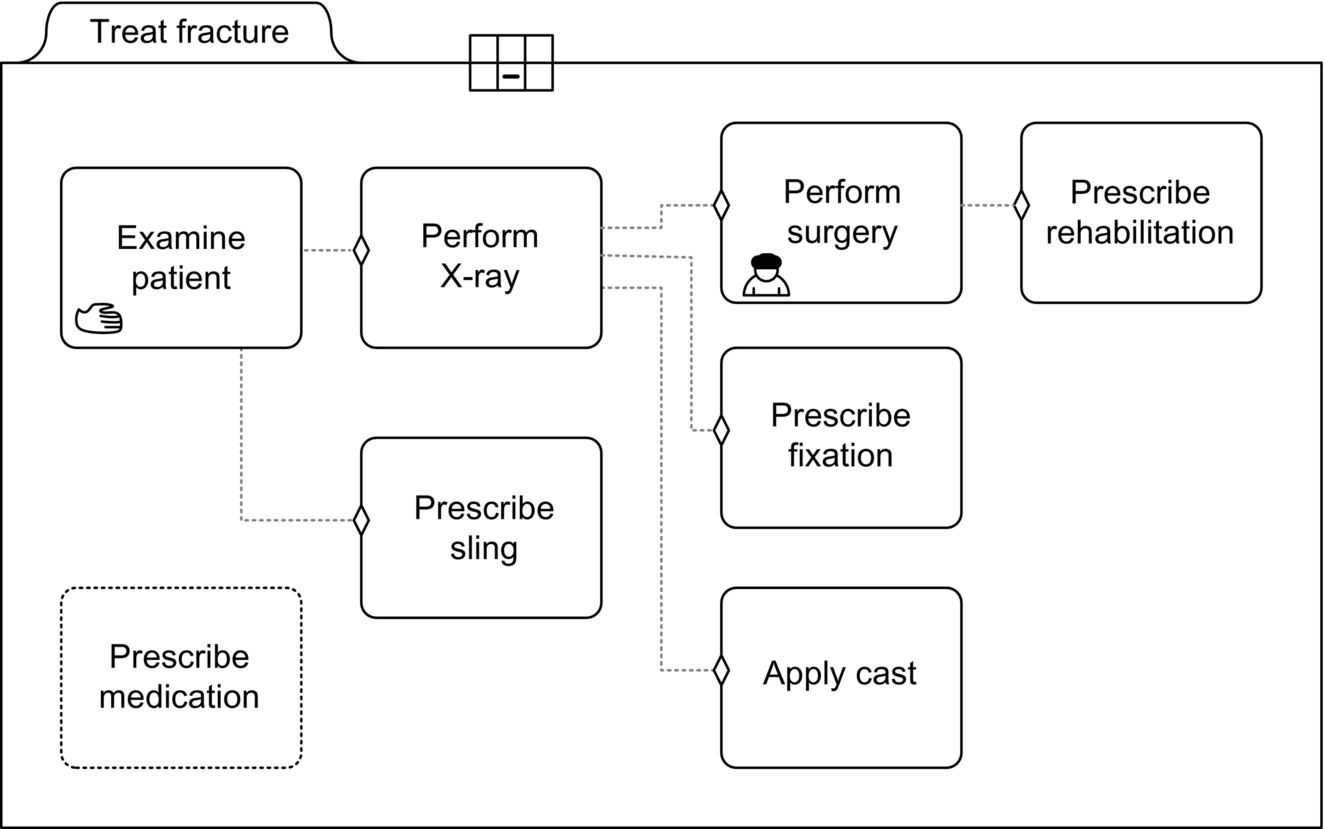
Figure 9.15 pictures what is currently termed a case plan model. Specifically, it is a case plan model for treat fracture. We assume someone has arrived at a hospital with a fracture and the diagram below describes what the hospital might do. The small adornment on the top of the folder line with a grid and a minus sign is termed a planning table. The negative indicates that it is optional, but assuming it is used it defines possible relationships among the tasks. In this case a patient could begin either at the examine patient task or at the prescribe medication task. Assume he or she began at the examine patient task. Depending on the diagnosis (resulting decision) the patient could be given a sling, asked to get an X-ray, or discharged.
There are two symbols for manual in CMMN. The hand is referred to as “nonblocking” and means that another task could take place simultaneously—the physician could examine and pause to administer a pain-killing drug. The little person’s head and shoulders is a blocking manual task. When that task is underway no other tasks can be applied to that patient. There are many other adornments, and we only mention a few. Obviously, readers interested in the detailed notation will have to be members of the OMG to get the complete Beta at this time, but we are only interested at giving a flavor at this point.
Let’s step back and see where the CMMN notation is at this point. Clearly, the CMMN team assumes that some tasks will be automated, but that many will be performed by human performers.
Rules (or decision management if you prefer) will be heavily relied on to define moves among tasks—in most cases to document the logic, but probably not to automate the process. This leaves the information and in most cases the semantic networks that underlie the use of the rules. So far the CMMN team seems to be trying to ignore this. We do not think that will prove successful. We suspect that, as they evolve this notation, members of the OMG task force will find that they want to treat most tasks as a semantic net that captures knowledge about the task (or they may keep the tasks as a nod to the procedural flow and associate a semantic net to each task). (There is already an icon for a CaseFileItem—a page with the top right corner turned down—which could serve this purpose if it was developed.) Developers are going to have to specify the semantic networks anyway to formally define all the objects and attributes to be used in the knowledge rules, and we suspect in the long run it will be worthwhile including it in the notation and storing it in whatever software product is developed to support CMMN.
As we suggested, to date few companies are using CMMN and it’s possible the notation will never be widely adopted. We personally prefer using an extension of BPMN, and simply including CMMN-type tasks with BPMN diagrams. We created Figures 9.12 and 9.14 to highlight that overview of the process could be developed using BPMN notation. We would rather include tasks within BPMN processes because we would prefer to go from a high-level abstract overview to specific subprocesses following a single, consistent notation. In any case, whatever notation is adopted, readers will see more articles on the analysis of complex processes in the years ahead.
Notes and References
This chapter relies on a loose interpretation of BPMN. We have used the notation, but added extensions occasionally to clarify things. We have included a formal description of the core BPMN notation as Appendix 1.
The official source of the BPMN specification is the OMG. You can go to their website and download the complete specification. Similarly, you can obtain the UML activity diagram notation at the OMG site as well.
By far the best introduction to BPMN is provided by two articles written by Stephen White, which can be found at the BPTrends website. White was the chair of the BPMN task force that created the notation. The articles are available at http://www.bptrends.com (search for Stephen White). In “Introduction to BPMN” (July 2004) White presents the basic BPMN notation. In “Process Modeling Notations and Workflow Patterns” (March, 2004) White shows how BPMN and UML could each model the workflow patterns that were described by Wil van der Aalst in Workflow Management: Models, Methods, and Systems (MIT Press, 2002). The patterns van der Aalst describes provide a good benchmark to the kinds of software situations that any comprehensive workflow tool should be able to model, and thus provide the process notation with a reasonable workout.
There has been a lot of discussion in the business and IT communities about the nature of business rules. Some business rules only specify policy actions. If X happens, then do Y. Other rules specify actions in more detail, so that the rules can be programmed into software. For our purposes, in this book we suggest that managers only focus on high-level rules that define policies and specify how decisions should be handled. Leave more precise rules for those that develop software. We’ll consider the business rules literature in more detail in the notes after Chapter 10.
Throughout this chapter we have focused on the kind of simple BPMN diagrams that business managers or analysts might draw to help them examine and improve business processes. Thus we have primarily examined fairly large and complex processes. In some cases analysts might want to proceed to using the full set of BPMN notation so that they could specify a process so complete that it could be entirely automated. In this case they will likely be looking at what we would term a Level 4 or Level 5 process, something more narrowly prescribed than the processes we have looked at. There are two books we can highly recommend to provide help for readers who want to consider how to use BPMN in this more precise manner:
Silver, Bruce, BPMN Method and Style, Cody-Cassidy Press, 2009.
Dumas, Marlon, et al., Fundamentals of Business Process Management, Springer, 2013.
The existing CMMN notation is available from the OMG as a draft specification: Case Management Model and Notation (CMMN) (OMG Specification, FTF Beta 1, Document Number dtc/2013-01-01).
To examine an expert system with thousands of rules that solved medical diagnosis problems see:
Buchanan, Bruce G., and Edward H. Shortliffe, Rule-Based Expert Systems: The Mycin Experiments of the Stanford Heuristic Programming Project, Addison-Wesley, 1984.