Appendix E. Geometry Reference
In Silverlight, a geometry is the simplest possible abstract representation of a shape or path. Geometries are used in two places—the value for Path.Data and the value for UIElement.Clip. These properties are of type Geometry, an abstract base class with several subclasses.
Basic Geometries
The four basic geometries are as follows:
→ RectangleGeometry—Has a Rect property for defining its dimensions and RadiusX and RadiusY properties for defining rounded corners
→ EllipseGeometry—Has RadiusX and RadiusY properties, plus a Center property
→ LineGeometry—Has StartPoint and EndPoint properties to define a line segment
→ PathGeometry—Contains a collection of PathFigure objects in its Figures content property; a general-purpose geometry
The first three geometries are really just special cases of PathGeometry, provided for convenience. You can express any rectangle, ellipse, or line segment in terms of a PathGeometry. So, let’s dig a little more into the components of the powerful PathGeometry class.
Path Figures and Path Segments
Each PathFigure in a PathGeometry contains one or more connected PathSegments in its Segments content property. A PathSegment is simply a straight or curvy line segment, represented by one of seven derived classes:
→ LineSegment—A class for representing a line segment (of course!)
→ PolyLineSegment—A shortcut for representing a connected sequence of LineSegments
→ ArcSegment—A class for representing a segment that curves along the circumference of an imaginary ellipse
→ BezierSegment—A class for representing a cubic Bézier curve
→ PolyBezierSegment—A shortcut for representing a connected sequence of BezierSegments
→ QuadraticBezierSegment—A class for representing a quadratic Bézier curve
→ PolyQuadraticBezierSegment—A shortcut for representing a connected sequence of QuadraticBezierSegments
Bézier curves are described in Chapter 14, “Love Meter.” Despite the scarier-sounding name, QuadraticBezierSegment is actually simpler than BezierSegment and computationally cheaper. A quadratic Bézier curve has only one control point, whereas a cubic Bézier curve has two. Therefore, a quadratic Bézier curve can only form a U-like shape (or a straight line), but a cubic Bézier curve can also take the form of an S-like shape.
The following path uses a PathGeometry with two simple LineSegments that create the L shape in Figure E.1:
<Path Stroke="Black" StrokeThickness="10">
<Path.Data>
<PathGeometry>
<PathFigure>
<LineSegment Point="0,100"/>
<LineSegment Point="100,100"/>
</PathFigure>
</PathGeometry>
</Path.Data>
</Path>
Figure E.1 A path that consists of a pair of LineSegments.

Notice that the definition for each LineSegment includes only a single Point. That’s because it implicitly connects the previous point to the current one. The first LineSegment connects the default starting point of (0,0) to (0,100), and the second LineSegment connects (0,100) to (100,100). (The other six PathSegments act the same way.) If you want to provide a custom starting point, you can simply set PathFigure’s StartPoint property to a Point other than (0,0).
You might expect that applying a fill to this path is meaningless, but Figure E.2 shows that it actually fills it as a polygon, pretending that a line segment exists to connect the last point back to the starting point. Figure E.2 was created as follows:
<Path Stroke="Black" StrokeThickness="10" Fill="Orange">
<Path.Data>
<PathGeometry>
<PathFigure>
<LineSegment Point="0,100"/>
<LineSegment Point="100,100"/>
</PathFigure>
</PathGeometry>
</Path.Data>
</Path>
Figure E.2 The path from Figure E.1 filled with an orange brush.

To turn the imaginary line segment into a real one, you could add a third LineSegment to the PathFigure explicitly, or you could simply set PathFigure’s IsClosed property to true. The result of doing either is shown in Figure E.3.
Figure E.3 The path from Figure E.2, but with IsClosed="True".

Although all PathSegments within a PathFigure must be connected, you can place multiple PathFigures in a PathGeometry if you want disjoint shapes or paths in the same geometry. You could also overlap PathFigures to create results that would be complicated to replicate in a single PathFigure. For example, the following XAML overlaps the triangle from Figure E.3 with a triangle that is given a different StartPoint but is otherwise identical:
<Path Stroke="Black" StrokeThickness="10" Fill="Orange">
<Path.Data>
<PathGeometry>
<!-- Triangle #1 -->
<PathFigure IsClosed="True">
<LineSegment Point="0,100"/>
<LineSegment Point="100,100"/>
</PathFigure>
<!-- Triangle #2 -->
<PathFigure StartPoint="70,0" IsClosed="True">
<LineSegment Point="0,100"/>
<LineSegment Point="100,100"/>
</PathFigure>
</PathGeometry>
</Path.Data>
</Path>
This dual-PathFigure path is displayed in Figure E.4.
Figure E.4 Overlapping triangles created by using two PathFigures.

The behavior of the orange fill might not be what you expected to see. PathGeometry enables you to control this fill behavior with its FillRule property.
FillRule
Whenever you have a geometry with intersecting points, whether via multiple overlapping PathFigures or overlapping PathSegments in a single PathFigure, there can be multiple interpretations of which area is inside a shape (and can, therefore, be filled) and which area is outside a shape.
With PathGeometry’s FillRule property (which can be set to a FillRule enumeration), you have two choices on how filling is done:
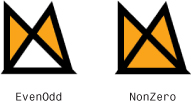
→ EvenOdd—Fills a region only if you would cross an odd number of segments to travel from that region to the area outside the entire shape. This is the default.
→ NonZero—Is a more complicated algorithm that takes into consideration the direction of the segments you would have to cross to get outside the entire shape. For many shapes, it is likely to fill all enclosed areas.
The difference between EvenOdd and NonZero is illustrated in Figure E.5, with the same overlapping triangles from Figure E.4.
Figure E.5 Overlapping triangles with different values for PathGeometry.FillRule.
Geometry Group
GeometryGroup composes one or more Geometry instances together. It derives from Geometry, so a geometry group can be used wherever a geometry is used. For example, the previously shown XAML for creating the overlapping triangles in Figure E.4 could be rewritten to use two geometries (each with a single PathFigure) rather than one:
<Path Stroke="Black" StrokeThickness="10" Fill="Orange">
<Path.Data>
<GeometryGroup>
<!-- Triangle #1 -->
<PathGeometry>
<PathFigure IsClosed="True">
<LineSegment Point="0,100"/>
<LineSegment Point="100,100"/>
</PathFigure>
</PathGeometry>
<!-- Triangle #2 -->
<PathGeometry>
<PathFigure StartPoint="70,0" IsClosed="True">
<LineSegment Point="0,100"/>
<LineSegment Point="100,100"/>
</PathFigure>
</PathGeometry>
</GeometryGroup>
</Path.Data>
</Path>
GeometryGroup, like PathGeometry, has a FillRule property that is set to EvenOdd by default. It takes precedence over any FillRule settings of its children.
This, of course, begs the question, “Why would I create a GeometryGroup when I can just as easily create a single PathGeometry with multiple PathFigures?” One minor advantage of doing this is that GeometryGroup enables you to aggregate other geometries such as RectangleGeometry and EllipseGeometry, which can be easier to use. But the major advantage of using GeometryGroup is that you can set various Geometry properties independently on each child.
For example, the following GeometryGroup composes two identical triangles but sets the Transform on one of them to rotate it 25°:
<Path Stroke="Black" StrokeThickness="10" Fill="Orange">
<Path.Data>
<GeometryGroup>
<!-- Triangle #1 -->
<PathGeometry>
<PathFigure IsClosed="True">
<LineSegment Point="0,100"/>
<LineSegment Point="100,100"/>
</PathFigure>
</PathGeometry>
<!-- Triangle #2 -->
<PathGeometry>
<PathGeometry.Transform>
<RotateTransform Angle="25"/>
</PathGeometry.Transform>
<PathFigure IsClosed="True">
<LineSegment Point="0,100"/>
<LineSegment Point="100,100"/>
</PathFigure>
</PathGeometry>
</GeometryGroup>
</Path.Data>
</Path>
The result of this is shown in Figure E.6. Creating such a geometry with a single PathGeometry and a single PathFigure would be difficult. Creating it with a single PathGeometry containing two PathFigures would be easier but would still require manually doing the math to perform the rotation. With GeometryGroup, however, creating it is very straightforward.
Figure E.6 A GeometryGroup with two identical triangles, except that one is rotated.

![]()
Representing Geometries as Strings
Representing each segment in a geometry with a separate element is fine for simple shapes and paths, but for complicated artwork, it can get very verbose. Although most people use a design tool to emit XAML-based geometries rather than craft them by hand, it makes sense to keep the resultant file size as small as reasonably possible.
Therefore, Silverlight supports a flexible syntax for representing just about any PathGeometry as a string. For example, the PathGeometry representing the simple triangle displayed in Figure E.3:
<Path Stroke="Black" StrokeThickness="10" Fill="Orange">
<Path.Data>
<PathGeometry>
<PathFigure IsClosed="True">
<LineSegment Point="0,100"/>
<LineSegment Point="100,100"/>
</PathFigure>
</PathGeometry>
</Path.Data>
</Path>
can be represented with the following compact syntax:
<Path Stroke="Black" StrokeThickness="10" Fill="Orange"
Data="M 0,0 L 0,100 L 100,100 Z"/>
Representing the overlapping triangles from Figure E.4 requires a slightly longer string:
<Path Stroke="Black" StrokeThickness="10" Fill="Orange"
Data="M 0,0 L 0,100 L 100,100 Z M 70,0 L 0,100 L 100,100 Z"/>
These strings contain a series of commands that control properties of PathGeometry and its PathFigures, plus commands that fill one or more PathFigures with PathSegments. The syntax is pretty simple but very powerful. Table E.1 describes all the available commands.
Table E.1 Geometry String Commands

