
Hour 21. Advanced: Analyzing Code with Instruments
What You’ll Learn in This Hour:
• How to use the Instruments feature to trace the operations of your program
• How to repeatedly automate user interface actions with instruments
The Instruments application is Apple’s Xcode-like interface to a collection of tools that enable you to observe the status of a process, or of numerous processes on a running system. They also provide reports about things such as open files, memory usage, network usage, or user interface events.
Instruments operate primarily by observing method invocations and messages within the system at a very deep level, mostly via a command-line tool (although this is hidden when using the Instruments interface) called dtrace. dtrace itself can report on essentially every byte allocated or deallocated, every memory location changed, every process register, every command that runs through the CPU, the status of all the files on the disk, the status of all the network connections, and numerous other pieces of information. dtrace’s output, however, is voluminous and not particularly easy to read. Instruments take this output, parse portions of it that are useful to you, and display them in easy-to-read graphs and detailed summaries.
By the Way
Whereas some of the features of the Instruments application are easy enough to use productively right away, others require a deep understanding of the underpinnings of the OS X kernel, interprocess communications, network technologies, and so on. The examples in this hour barely scratch the surface of what is possible. In fact, an entire book this size would probably barely make a dent in the available options.
By the Way
Don’t be shy about using the tremendously valuable features, such as leak detection, that can be used without much study, but be prepared to get your hands dirty and to spend a lot of time deep in the man pages if you want to make full use of the profiling power that the Instruments application provides.
The Instruments Interface
The Instruments interface is designed much like the Xcode interface, layering all features into a single window. Shown in Figure 21.1, the Instruments window contains several areas. Like most Mac OS applications, it has a toolbar and a main window area. The main window is broken up into an Instruments pane, a Track pane, a Detail pane, and an Extended Detail pane, with functions as detailed here.
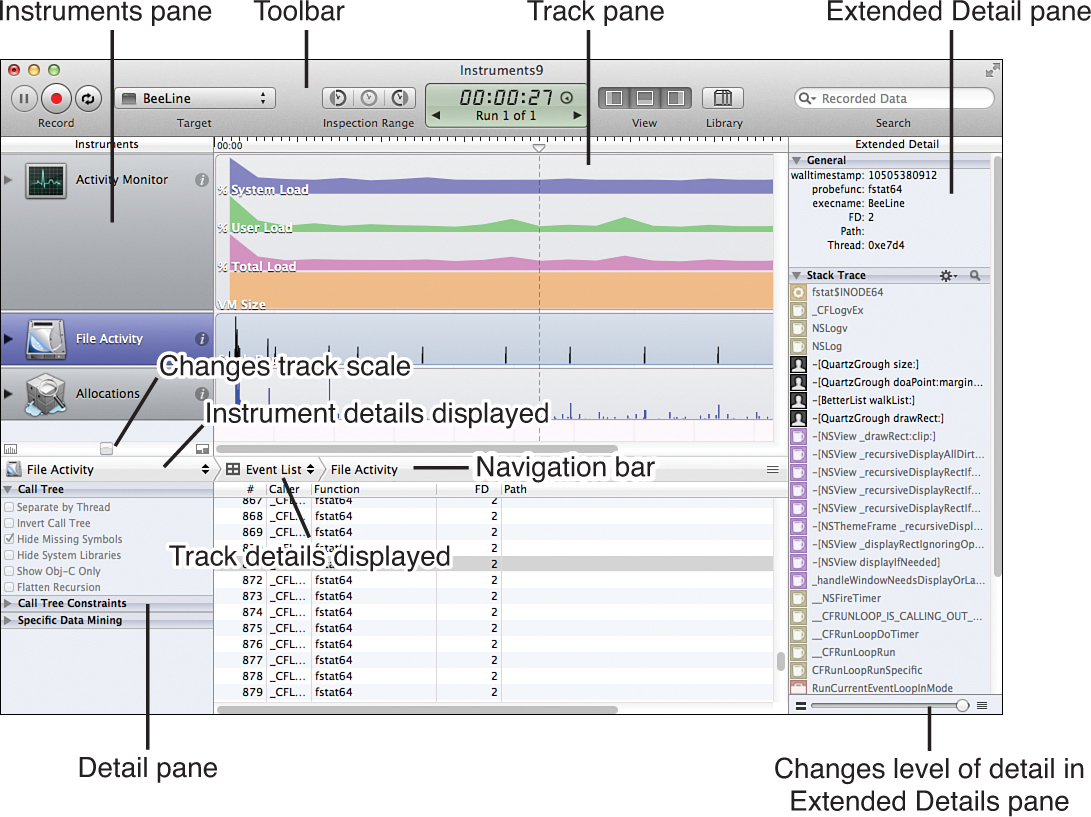
Figure 21.1. The Instruments window has an Instruments pane, a Track pane, a Detail pane, and an Extended Detail pane.
• Instruments pane: The Instruments pane contains a list of the currently active instruments, enabling the control of the features that each instrument captures, and some parameters that affect how results display.
• Track pane: For each instrument in the Instruments pane, the Track pane displays a tickertape-like or chart-recorder-like graph of the events that the instrument captured while an application or applications were running. Multiple runs of the application can be carried out, creating multiple parallel tracks for an instrument.
• Detail pane: The Detail pane displays details about the currently selected instrument in the currently selected run and, when possible, about the currently selected portion of the currently selected track. The details are generally contextually appropriate for the track selected, and you can configure the variety of details shown by selecting different options for the details from a navigation bar (which falls between the Detail pane at the bottom of the window and the Instruments pane and Track pane above it). At the left of the Detail pane, you can configure some additional features and capture options for the selected instrument.
• Navigation bar: The Navigation bar extends horizontally across the top of the Detail pane and controls the type of details shown for the selected track. The detail options range from different presentation styles for the details to overall details for the application run, such as its console output. The leftmost field in the Navigation bar, falling directly under the Instruments pane, enables the selection of the different instruments in the Instrument pane (and has the same effect as clicking on the instrument in the Instruments pane). The next field to the right enables selection of the types of details to be displayed in the Detail pane. Additional navigation selections are contextually available depending on the selected instrument and details displayed.
• Extended Detail pane: The Extended Detail pane shows fine-grained detail about one detail line selected from the Detail pane. It may show this as a single collection of information or in a number of group summary areas like the inspectors in the Utility area in Xcode.
At the right side of each instrument in the Instruments pane is a small round i button (of the style typically used for information dialogs) that opens a pop-up configuration dialog where you can configure data-capture features of the instrument and data-display features of the track.
Within the toolbar itself, you can select the target to which you want to apply the instruments, run the Instruments (by clicking the Record button), and customize the layout and features of the Instruments application itself, by adjusting the inspection time range, the panes within the application that should be shown or hidden, and the run to examine. There is also a button that displays the library of available instruments, and a Search field from which you can search for features of interest within your recorded data.
At the top of the track pane is a timeline. By clicking in the timeline, you can drag an indicator called a thumb to select the precise point in the timeline that you want to examine. As you scrub the thumb back and forth across the timeline, the details in the Detail pane will update to reflect those appropriate for the point in time that you’re indicating, and small detail notification flags will appear in the track graphs, indicating the nearest, or most salient, events in that track to the time point you have selected, as shown in Figure 21.2.
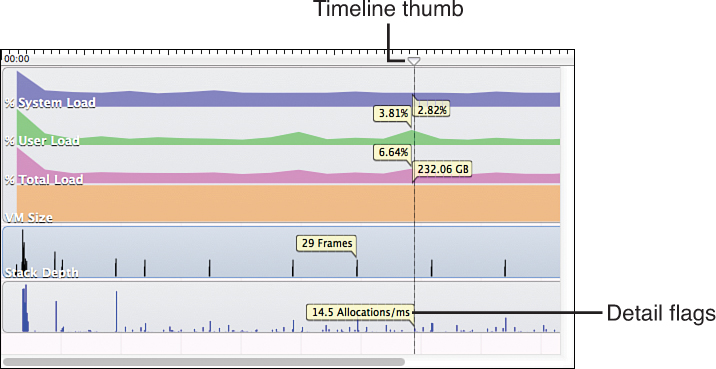
Figure 21.2. Small detail notification flags appear when you select a point in the timeline to examine.
Did You Know?
I have written “will update” in the preceding paragraph, but perhaps I should have written “should update.” The Instruments application seems to be in a state of transition. As of Xcode 4.2, and in Xcode 4.3, this feature is unreliable. As a matter of fact, many features of the Instruments application are unreliable at this point. This is unfortunate because instruments are tremendously powerful way to understand how your program operates and how it interoperates with the rest of the system, and they are an indispensable tool for identifying problems in a program that are practically impossible to find by any other means outside of guesswork.
Using Instruments
Using instruments on applications you are developing in Xcode is quite simple. You access this functionality by clicking and holding the Run button on the Xcode toolbar until the Profile option appears. Then you select it. When you do so, a dialog opens in which you can choose the type of instrument to use for profiling your application. To get some practice using instruments, let’s returned to the BeeLine application and find out if I’ve left any memory leaks.
Checking for Memory Leaks
Memory leaks occur when all the pointers that point to a block of memory that is allocated during execution (for example, in response to a malloc() call) lose track of the address of that block of memory. For example, if foo is the only pointer to a block of malloc() ed memory, and you assign foo=0, there is no longer any way to access the malloc() ed block of memory because nothing knows where it is. Because you cannot access it, you cannot free() it, and it will hang around, still taking up space until your program ends. This is no big deal if it is one leaked block of memory, but if that kind of leak happens in a loop or in response to user interaction with the program, the amount of memory your application will require will continually grow as long as it is running. This is not a recipe for happy users or a stable system.
To check BeeLine for memory leaks, follow these steps:
1. Locate the BsNees workspace you created in Hour 20, “Keeping Things Organized : Shared Workspaces,” or retrieve a new version from the Hour 21 folder of the source downloadable from http://teachyourselfxcode.com/.
2. Open the BsNees workspace in Xcode. Select the BeeLine project in the Project Navigator and the BeeLine target in the sidebar of the Editor area.
3. In the scheme drop-down in the Xcode toolbar, select the BeeLine scheme and the appropriate architecture.
4. Click and hold the Run button at the upper left of the Xcode toolbar until the available Run options appear, and then drag down to the Profile option and release. The button should change from Run to Profile so that you only have to click it the next time.
5. In the dialog that appears, choose the Leaks instrument, as shown in Figure 21.3, and click Profile.
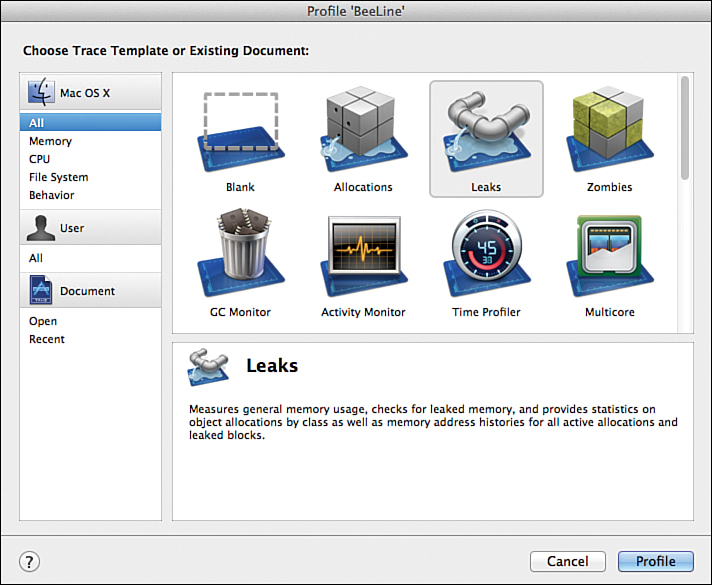
Figure 21.3. Choosing the Leaks instrument.
6. BeeLine launches, as does the Instruments interface. It is collecting information as soon as it launches. Add some points to BeeLine.
7. Continue adding points for 40 seconds or so.
8. Then click the Stop button on the Instruments toolbar, or quit BeeLine by choosing Quit from BeeLine’s File menu.
After you quit BeeLine, you should be greeted with an Instruments window that looks much like Figure 21.4. It should come preconfigured with an Allocations instrument and a Leaks instrument. The Allocations instrument shows you all the memory that has been allocated by the process and when the allocations occurred. The Leaks instrument shows you times when, as far as the instrument can tell, memory that was allocated by BeeLine became unreferenced. When you click the Allocations instrument, details for it are shown in the Detail pane. When you click the Leaks instrument, likewise, its details appear.
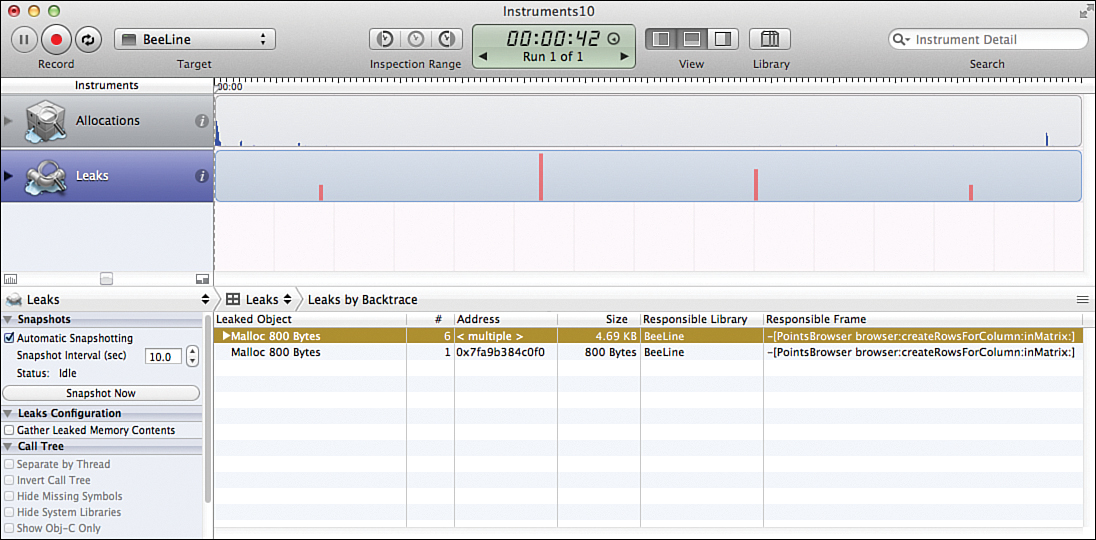
Figure 21.4. The Allocations instrument shows all the memory allocated by a process and when the allocations occurred. The Leaks instrument shows when memory allocations became unreferenced.
If you want to adjust the granularity of the information display (for example, if all your data is bunched up at the left side of the track pane, or if the track pane is showing only a few milliseconds in the middle of your 40-second run), you can try to do this using a small horizontal scrollbar that appears directly under the Instruments pane. Dragging this to the left zooms out, making more time fit within the Track pane. Dragging it to the right zooms in, expanding the tracks within the pane so that you can see finer detail than if all the events were compressed into your available window or screen space.
If you want to make the entire duration of your run fit exactly within the Track pane, you can do this by selecting Snap Track to Fit from the View menu in Instruments.
Watch Out!: Gentle Touch Required
The Track Scale slider is incredibly sensitive (almost uselessly so). The difference between 20 seconds and 20 milliseconds on the slider is a matter of only a few pixels on the screen. When you try to use it, pay attention to the current value that it is displaying and make very small moves with your mouse. Otherwise, you will find the track display zipping back and forth from too compressed to be useful to too wide to be useful at an uncontrollable rate. We hope this is a bug.
Within the Detail pane for the Leaks instrument, you can see that there have been multiple leaks of 800 bytes from memory allocated by malloc. In the rightmost column of the Detail pane, you will see a list of the methods where the memory was leaked from these mallocs.
Did You Know?
You probably should be able to double-click the method indicated in the responsible frame column and have Instruments take you straight to the guilty bit of code. Unfortunately, this doesn’t currently work. Peculiarly, while double-clicking the method currently does nothing, double-clicking the allocation size attempts to take you to the code. However, it fails to do so correctly, and induces erratic behavior in the Instruments application.
Getting Additional Information About Leaks
To find out where in the method calling stack the offending method was called, and to gain the ability to jump to that code, reveal the Extended Detail pane by clicking its icon in the View options on the toolbar.
In the Extended Detail pane, you will see a bottom-up trace of the call stack, ending at the top in the allocation that eventually was leaked. Immediately below the allocation is the method that invoked the allocation, as shown in Figure 21.5. If you double-click the calling method in the Extended Detail pane, Instruments will successfully find the source and display the offending line in the Detail pane, as shown in figure 21.6.
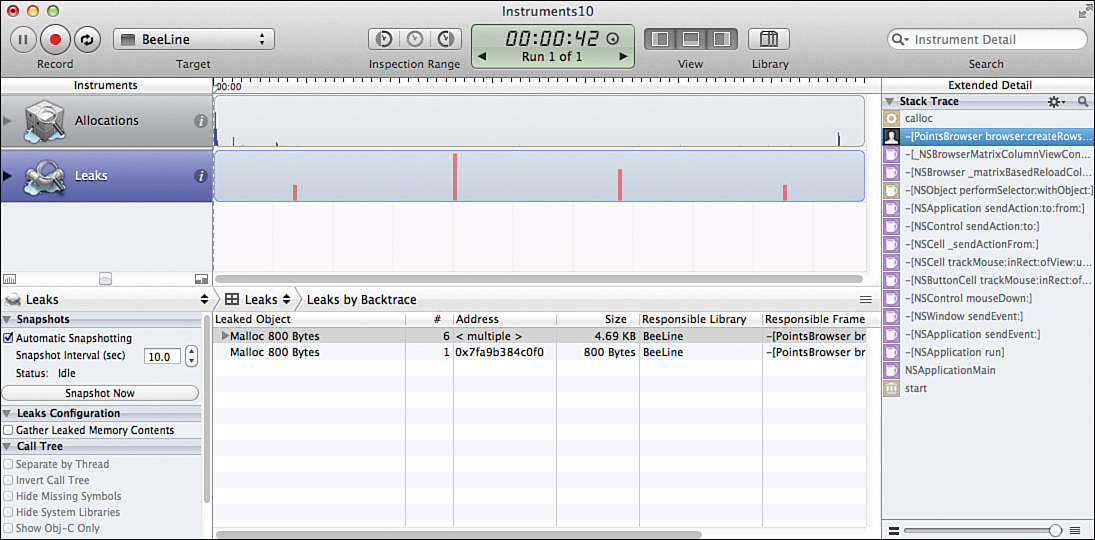
Figure 21.5. In the Extended Detail pane, we can see which method leaked the allocation.
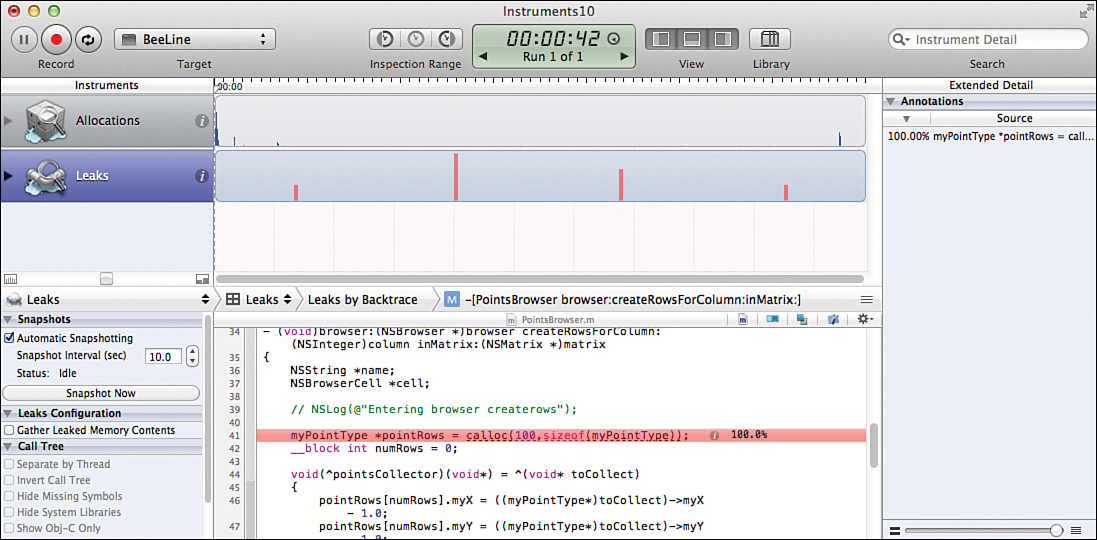
Figure 21.6. Double-clicking the calling method takes us to the offending line of code in the Detail pane.
Watch Out!: Don’t Squash the Bug
Although the error I’ve left here is fairly obvious, don’t fix it just yet. You need it for the rest of this hour.
Additional Runs
Instruments can also collect multiple runs from the same application so that you can compare those runs and determine whether there are commonalities or differences in the behavior of your program. To add additional runs of your program to the Instruments display so that you can compare them to the first run, just click the Record button and interact with BeeLine again. Try to keep your run about the same duration as your first run, and then click the Stop button again. Do this two or three times. Try to have add lot of points in one run, and only add a few in another run with some long pauses between points. When you have finished, click the disclosure triangle on the Leaks instrument in the Instruments pane. Instruments should show you an Instruments pane and a Track pane that look much like those shown in Figure 21.7.
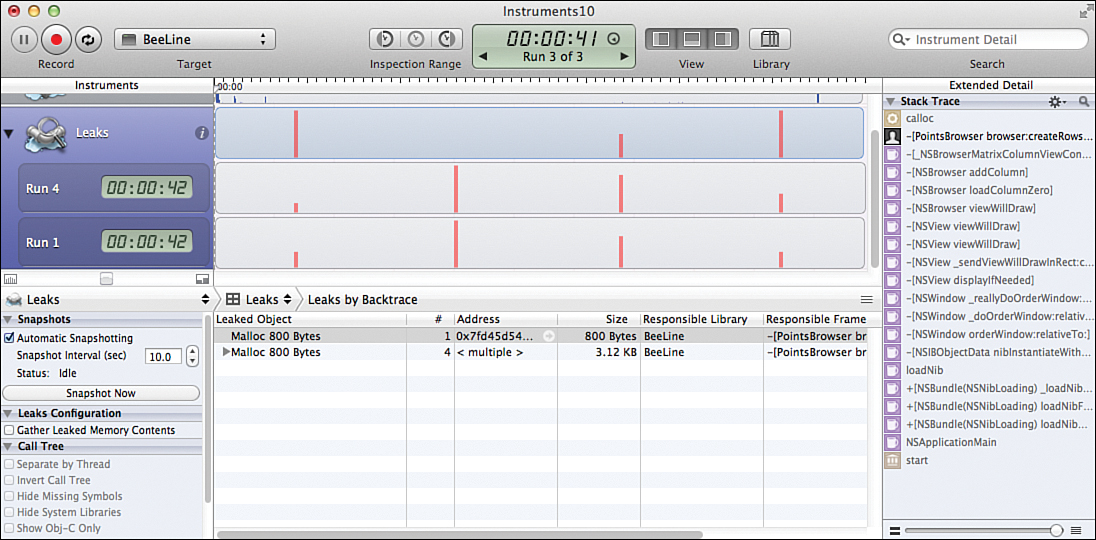
Figure 21.7. Collecting multiple runs to compare.
As you can see, although there are some distinct similarities in the leaked memory pattern, some differences also exist. The similarities are primarily due to the granularity of sampling in how Instruments look for leaked memory. The differences are because of the differences in timing of how I interacted with BeeLine when I was adding points.
By the Way
You can adjust the granularity of sampling by changing the snapshot interval for the Leaks instrument. Select the Leaks instrument from the leftmost field in the navigation bar, and a parameter group for Snapshots will appear beneath it. The snapshot interval controls how often the Instruments application collects data from the running process being profiled and provides it to the Leaks instrument for analysis. So, setting this field to smaller values causes the Leaks instrument to check for leaks more frequently. Different instruments have different ways of configuring their snapshot interval or sampling rate.
Memory leaks like this, which depend on what you do and when you do it, can be particularly hard to diagnose. This is especially true if it requires a lot of time interacting with the user interface before the error occurs. Thankfully, the Instruments feature has a powerful tool for replicating interactions with the user interface: the Interface Recorder. In essence, it can record a series of interactions with the interface of a program, including where the mouse moved, what text was entered, and what buttons were clicked and when. It can then play those events back to a freshly started copy of the program as though you were pressing the buttons and entering the text yourself. Using this tool lets you consistently replicate user interactions so that you can consistently replicate problems for debugging.
To use the Interface Recorder instrument, follow these steps:
1. Quit Instruments and return to Xcode.
2. Click the Profile button on the Xcode toolbar. In the dialog that appears, find the UI recorder trace template, and click Profile.
3. The Instruments application will launch and again begin recording a trace of BeeLine. This time it is recording actions that you take in the user interface. Begin entering point values. Again enter four or five values for different points, clicking Add after each one.
4. When you have finished, wait a few seconds, and then choose Quit from BeeLine’s File menu.
The BeeLine interface will disappear, and the Instruments interface will display a track similar to that shown in Figure 21.8. In the Track pane, a series of overlapping thumbnails showing the various actions is presented. Each thumbnail is a mini screenshot of the region of the interface where the action occurred. The Detail pane will display, line by line, each of the thumbnails and also what type of event was recorded for the thumbnail and any value parameters that were entered. The Record button on the Instruments toolbar changes from Record to Drive & Record. This indicates that it is ready to play back the collection of events that it just recorded and record new data.
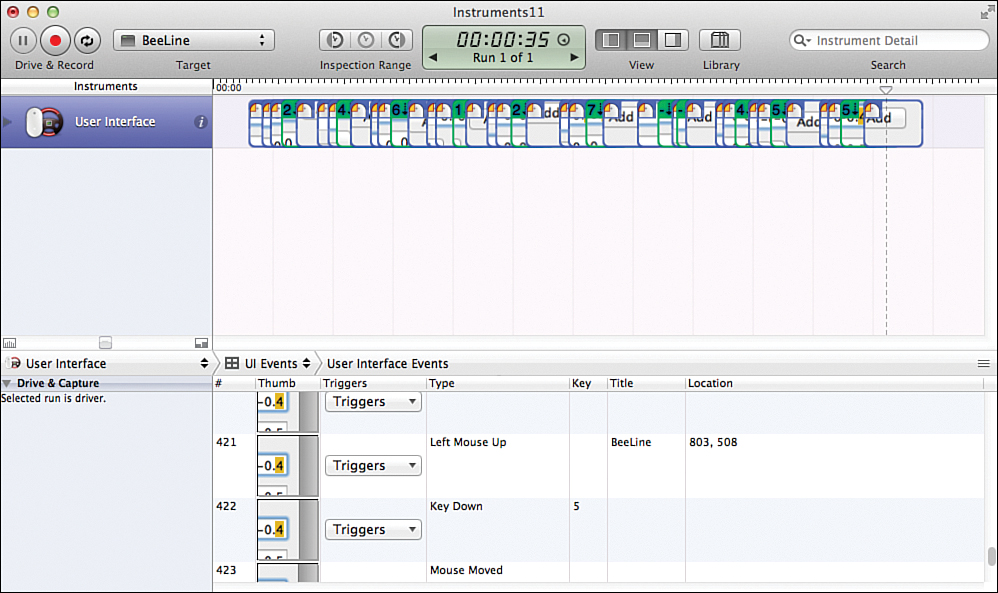
Figure 21.8. The Interface Recorder instrument recorded actions taken in the user interface and is displaying thumbnails of the actions in the Track pane. In addition, the Record button has changed to Drive & Record.
Collecting Data from Additional Instruments Simultaneously
You can add additional instruments to the Instruments pane. All of them will record data simultaneously. To use our recorded user interface interaction to look for leaks, we can add a Leaks instrument to the Instruments pane and let the User Interface instrument drive BeeLine for us, while the Leaks instrument records data and reports leaks. To do this, follow these steps:
1. Click the Library button on the Instruments toolbar to reveal the Library browser.
2. Find the Leaks instrument in the Library browser. You can do this by scrolling through the list or by using the Search field at the bottom of the Library browser to filter the instruments shown.
3. Click the Leaks instrument in the Library browser and drag it to the Instruments pane. Release it where you want it in the list of instruments, as shown in Figure 21.9. Alternatively, if you’re happy with it at the bottom of the list, just double-click it.
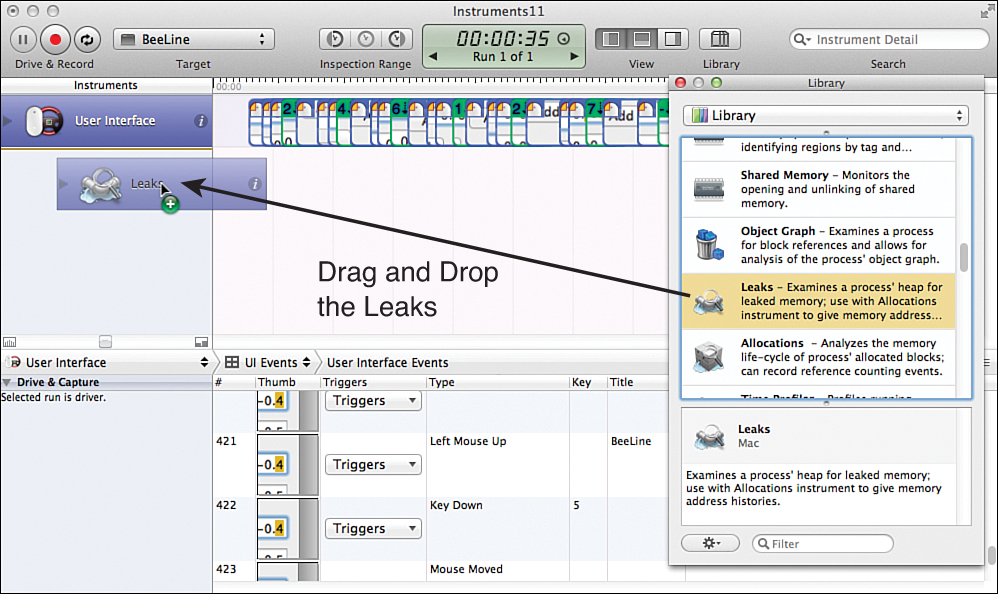
Figure 21.9. Adding the Leaks instrument to the Instruments pane.
4. Now click the Drive & Record button on the Instruments toolbar. The BeeLine interface will appear, and the User Interface instrument will proceed to drive your cursor and attempt to carry out the exact same user interface actions that you took when you recorded the session.
Watch Out!: Don’t Touch Anything
Don’t move your window, or the Instruments window, or move other windows on the screen between recording the user interface session and using it to drive the interface in Drive & Record mode. The Instruments application tries to reproduce your actions literally, but its idea of literal involves “the same place” rather than “the same thing.” If you’ve rearranged windows, Instruments will happily click on, and interact with, whatever is in the same place on the screen as your target program was previously.
5. If you need additional duplicate runs, you can continue to click Drive & Record as many times as you need. Additional tracks of data from the Leaks instrument and from the User Interface instrument will be collected for each run.
By the Way
At this point, we cannot recommend using the loop option for the Drive & Record action. The loop option, enabled by a button found next to the Drive & Record button, is supposed to run your user interface action track over and over and over. Unfortunately, there seem to be a number of bugs in this function at the moment. Not only is it almost impossible to make it stop properly, it also has a bad habit of losing its focus on the application it is supposed to be interacting with, and spamming your user interface events into other applications that you have running. The outcome is rarely healthy for your blood pressure or your computer.
Did You Know?
As of Xcode 4.2 and 4.3, the User Interface instrument is unlikely to function as described here. This is the way it is supposed to work. However, as shown in Figure 21.10, it does not produce perfect replicates of the user interface actions that were originally carried out. It does not even produce identical erroneous runs.
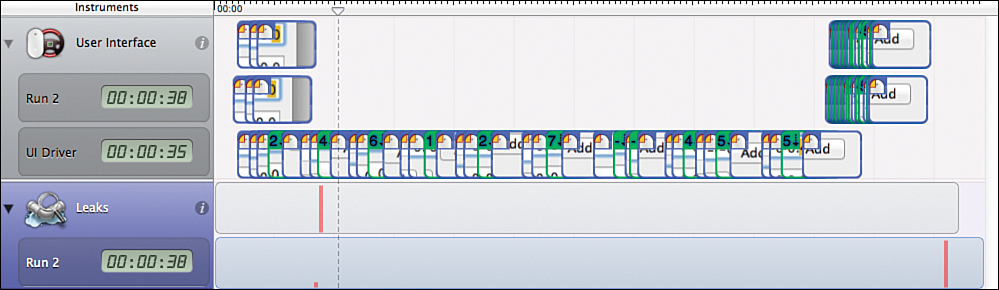
Figure 21.10. Unfortunately, the User Interface instrument does not produce perfect replicates of the actions that were originally carried out.
This is not simply a matter of user interface timing, as examination of the console output from BeeLine (viewable by selecting a track in the Track pane, and the Console output details from the navigation bar) demonstrates that BeeLine is in fact receiving different values. It appears as though a significant portion of this problem is due to the user interface actions not being properly indexed spatially to the program interface, even if nothing is moved. This is a critical failure on the part of the Instruments application and one that we expect Apple will address soon. Perhaps (we at least hope) it will be working properly by the time you read this.
Summary
In this hour, you got a brief introduction to the Instruments application and learned how to use two of the most immediately powerful instruments together, to augment your ability to debug your code. The instruments within this feature are so much more than we have space to cover here. They can inform you of just about every change that takes place in your machine, almost on an instruction-by-instruction basis.
By using the full panoply of instruments that are available, as well as leveraging the ability to easily create custom instruments by wrapping Apple’s provided interface around custom dtrace scripts, you can take your programs and programming to a whole new level. Start slowly, use the tools that are easy to use, and one day when you think “I wonder if there’s some way that I could find out what the system does when...,” turn to the Instruments feature. They’ll do that for you.
Q&A
Q. Can you save the traces from instruments for additional analysis later?
A. Yes. You can also pare down what is saved by picking unneeded traces in the Trace pane and selecting Delete Run from the Instruments menu. Saved user interface tracks can be reloaded for later playback. However, remember that they are quite literal about the location of features on the screen, so you need to position your application exactly identically if you want user interface playback to work from a saved run.
Q. Is the Instruments application limited to working with Xcode projects?
A. No. The Instruments application is actually a completely separate tool kit from Xcode. Xcode and Instruments simply interoperate fairly easily, making it a useful tool to use along Xcode for diagnosing problems with your projects. Instruments can actually profile the operation of any program (that your userid has permission to peek into) on the system, including the kernel. In addition, it can profile multiple programs simultaneously, enabling the debugging of situations where multiple intercommunicating programs are involved. You can access this additional functionality through the Attach to Process selection in the Target drop-down menu on the Instruments toolbar.
Workshop
Quiz
1. How can you get a better idea of the connection between user interface actions and memory leaks?
2. Where do the additional runs appear when you make several recordings in the same Instruments session?
Answers
1. Create an Instruments setup with a UI recorder instrument. Stop the run and delete it to get back to the initial Record mode. Then add a Leaks instrument. Set the Leaks snapshot interval to a small value, 1 second or less. Record a session, and use the timeline thumb to identify the UI recorder thumbnail frames that correspond to the reported leaks.
2. They are initially hidden, but can be revealed by clicking the disclosure triangle on the instruments in the Instruments pane.
Activities
1. Correct the memory leak in BeeLine. Profile it again to make certain that the leak is really gone.
2. Profile iBLine and determine whether it has any leaks. If it does, see if you can fix them. Remember that there is still a bug in the BetterList code, if you haven’t fixed it already, that causes a crash if you delete every point in the list and then try to add another.