
Human Resource Management and Productivity
Nicholas Bloom*, *Stanford, Centre for Economic Performance and NBER
John Van Reenen**, **London School of Economics, Centre for Economic Performance, NBER and CEPR
Abstract
In this chapter we examine the relationship between Human Resource Management (HRM) and productivity. HRM includes incentive pay (individual and group) as well as many non-pay aspects of the employment relationship such as matching (hiring and firing) and work organization (e.g. teams, autonomy). We place HRM more generally within the literature on management practices and productivity. We start with some facts on levels and trends of both HRM and productivity and the main economic theories of HRM. We look at some of the determinants of HRM—risk, competition, ownership and regulation. The largest section analyzes the impact of HRM on productivity emphasizing issues of methodology, data and results (from micro-econometric studies). We conclude briefly with suggestions of avenues for future frontier work.
Keywords
Human resource management; Productivity; Personnel Economics
E-mail addresses: [email protected] (Nicholas Bloom), [email protected] (John Van Reenen).
JEL classification: L2; M2; O32; O33
1 Introduction
Traditionally, labor economics focused on the labor market rather than looking inside the “black box” of firms. Industrial sociologists and psychologists made the running in Human Resource Management (HRM). This has changed dramatically in last two decades. Human Resource Management (HRM) is now a major field in labor economics. The hallmark of this work is to use standard economic tools applied to the special circumstances of managing employees within companies. HRM economics has a major effect on the world through teaching in business schools and universities, and ultimately what gets practiced in many organizations.
HRM covers a wide range of activities. The main area we will focus on will be incentives and work organization. Incentives include remuneration systems (e.g. individuals or group incentive/contingent pay) and also the system of appraisal, promotion and career advancement. By work organization we mean the distribution of decision rights (autonomy/decentralization) between managers and workers, job design (e.g. flexibility of working, job rotation), team-working (e.g. who works with whom) and information provision.
Space limitations mean we do not cover matching (see Oyer and Schaefer, 2010) or skill development/training. Second, we will only devote a small amount of space to employee representation such as labor unions. Third, we should also mention that we focus on empirical work rather than theory (for recent theory surveys see Gibbons and Roberts, forthcoming, and in particular Lazear and Oyer, forthcoming) and micro-econometric work rather than macro or qualitative studies. Fourth, we focus on HRM over employees rather than CEOs, which is the subject of a vast literature (see Murphy, 1999, or Edmans et al., 2008, for surveys).
Where we depart from several of the existing surveys is to put HRM more broadly in the context of the economics of management. To do this we also look in detail at the literature on productivity dispersion.
The structure of the chapter is as follows. In Section 2 we detail some facts about HRM and productivity both in the cross sectional and time series dimension. In Section 3 we look at the impact of HRM on productivity with an emphasis on methodologies and mechanisms. In Section 4 we discuss some theoretical perspectives, contrasting the usual “Design” approach to our concept of HRM as one example of “management as a technology”. In Section 5 we discuss some of the factors determining HRM, focusing on risk, competition, ownership, trade and regulation. Section 6 concludes.
2 Some facts on hrm and productivity
2.1 HRM practices
In the 1970s the general assumption was that incentive pay would continue to decline in importance. This opinion was based on the fact that traditional unskilled jobs with piece-rate incentives were declining, and white collar jobs with stable salaries and promotion based incentives were increasing. Surprisingly, however, it appears that over the last three decades a greater proportion of jobs have become rewarded with contingent pay, and this is in fact particularly true for salaried workers.
There are two broad methods of assessing the importance of incentive pay: Direct and Indirect methods. Direct methods use data on the incidence of HRM, often drawn from specialist surveys. Indirect methods use various forms of statistical inference, ideally from matched worker-firm data, to assess the extent to which pay is contingent on performance. We deal mainly with the direct evidence and then discuss more briefly the indirect evidence.
2.1.1 HRM measured using direct methods
Incentive Pay
Individual incentive pay information is available from a variety of sources. Using the Panel Study of Income Dynamic (PSID) Lemieux et al. (2009) estimate that about 14% of US prime age men in 1998 received performance pay (see Fig. 2.1). They define a worker as receiving performance pay if any part of compensation includes bonus, commission or piece rate1 (data on stock options and shares is not included). They find a much higher incidence of performance pay jobs (37% on average between 1976–1998) defined as ajob where a worker ever received some kind of performance pay2.
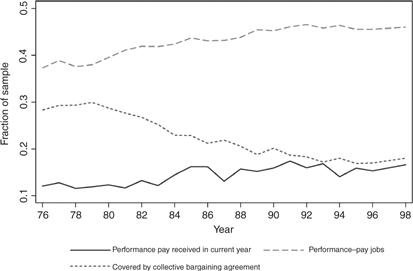
Figura 2.1 Incidence of performance pay, US men in PSID, 1976–1998. Notes: Male heads of household earning between $1 and $100 per hour. Self employed and public sector excluded. 30,424 observations on 3181 workers. Performance pay in current year = 1 if any part of compensation includes bonus, commission or piece rate. Stock options and shares are not included. A performance pay job is one where the worker ever receives some performance pay over the life of the job-match. (Source: Lemieux et al. (2009))
Other papers deliver similar estimates of around 40% to 50% of US employees being covered by some form of performance pay. For example, using the US General Social Survey Kruse et al. (2009) estimate that 47% of American workers were covered by some group incentive scheme in 2006. Of this 38% of employees were covered by profit sharing, 27% by gain-sharing, 18% by stock ownership (9% by stock options) and 4.6% by all three types. Lawler and Mohrman (2003) surveyed Fortune 1000 corporations between 1987 and 2002 asking detailed questions on their HRM3. Using midpoints of their results (which are in bands) Lemieux et al. (2009) calculate that 44% of workers were covered by incentive pay in 2002.
It is also interesting to look at the trends in incentive pay over time. In US data, Lemieux et al. (2009) find that for the wider definition of performance pay (if the worker was eligible for any performance related pay) the incidence rises from 38% in the 1970s to 45% in the 1990s (see Fig. 2.1). Interestingly, this rise in performance pay was mostly driven by increases in performance pay for salaried workers, for whom this rose from 45% in the 1970s to 60% in the 1990s. In contrast hourly paid workers have both lower levels and growth rates in performance pay. Lawler and Mohrman (2003) show similar rises in performance pay, increasing from 21% (1987) to 27% (1990) to 35% (1996) to 45% (2002). Lazear and Shaw (2008) also show some trends reproduced in Table 2.1, showing again that performance pay increased over time in the US.
Table 2.1
Increases in incentive pay in large publicly listed US firms.
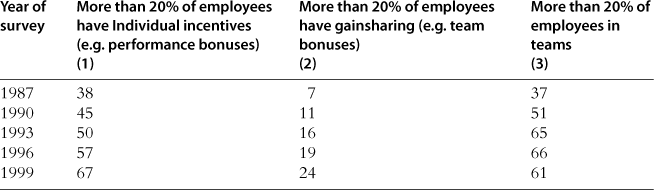
Source: Lawler et al. (1995, 2001), Lawler and Mohrman (2003).
In the UK the British Workplace Employment Relations Surveys (WERS) contains a cross section of all establishments with 25 or more employees in the UK (over 2000 observations in each year). There are consistent questions in 1984, 1990 and 2004 on whether the firm used any form of performance/contingent pay for workers both individually and collectively (e.g. team bonuses, Profit-related pay or Employee Share Ownership Schemes). Figure 2.2 shows that 41% of UK establishments had contingent pay in 1984, and this rose to 55% twenty years later. Two other points are noteworthy. First, this time series change is driven by the private sector: not only was the incidence of incentive pay very low in the public sector 10% or less, it actually fell over time (Lemieux et al., 2009 exclude the public sector in their US analysis). Second, the growth of incentive pay in the UK is primarily in the 1980s with no growth in the 1990s, similar to the US results shown in Fig. 2.1.
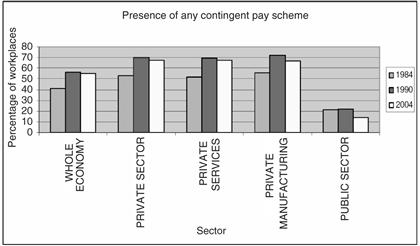
Figura 2.2 Trends in performance Pay 1984–2004, UK. Notes: This data is derived from the UK Workplace Employment Relations Surveys (WERS) in 1984, 1990 and 2004. This is a representative sample of all UK establishments with over 25 employees. Although there were other WERS in 1980 and 1998 the questions are not consistent. The consistent question relates to the incidence of any form of contingent pay for workers (Individual, Collective—such as team bonuses, Profit-related payor Employee Share Ownership Schemes). The incidence of contingent pay grewfrom 41% to 56% by 1990, but fell to 55% in 2004. The data relates to whether there was any incidence of this type of pay—we do not know how many workers were covered or what proportion of their remuneration was contingent. (Source: Pendleton et al. (2009))
So in summary, the evidence is that overall performance pay related covers about 40% to 50% of US workers by the 2000s, has been increasing over the last three decades, particularly over the 1970s and 1980s and particularly in the private sector salaried jobs. A number of reasons have been suggested for the increase in performance related pay which we will examine in detail in Section 5 below.
Other HRM practices
Turning to more general forms of HRM than pay, like self-managed teams, performance feedback, job rotation, regular meetings, and training it becomes rather harder to summarize the existing information. In the cross section there are a number of surveys, with different sampling bases, response rates and questions making them hard to compare. Perhaps the most representative example for the US is Black and Lynch (2001, 2004) who collected information from a survey backed by the US Department of Labor (used also by Capelli and Neumark, 2001). In 1996, for example, about 17% of US establishments had self-managed teams, 49% in formal meetings and 25% in job rotation. Lawler and Mohrman (2003)’s data of larger firms unsurprisingly shows a greater incidence of “innovative” HRM practices. In their data for 1996, 78% of firms had self-managed teams and this covered at least 20% of the workforce for just under a third of all corporations.
Bryson and Wood (2009) present an analysis of “high involvement” HRM using the UK WERS data (see Table 2.2). About half of all UK establishments had “team-working” in 1998. More interestingly, the WERS data allows an analysis of changes over time. The incidence of teamwork (as indicated by “team briefings”) has grown from 31% in 1984 to 70% in 2004 and “suggestion schemes” has grown from 22% in 1984 to 36% 20 years later. Most other forms of innovative HRM look stable, however, with the exception of incentive pay that has already been discussed.
Table 2.2
Trends in general HRM using British WERS survey.
The following variables relate to practices as they pertain to the core non-managerial occupation at the workplace; team-working (equals 1 if 80%+ core employees in teams); functional flexibility; appraisals (equals 1 if all core employees appraised); work enrichment. Single status is if core workers are treated the same as managers in terms of benefits such as pensions.
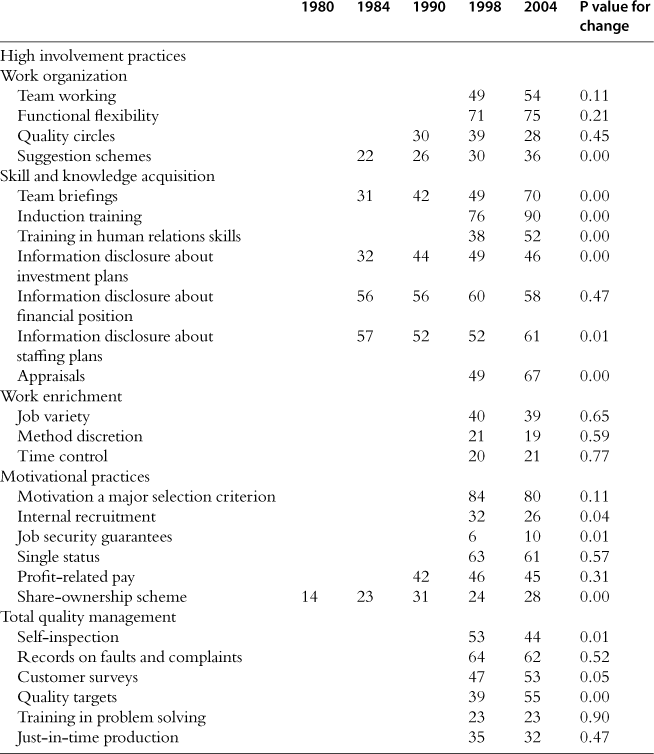
Source: Bryson and Wood (2009) based on UK WIRS/WERS data.
Wider international comparisons
To compare a wider basket of countries beyond the UK and US the best source of information is probably the Bloom and Van Reenen (2007) surveys on general management practices. These have some specific questions on HRM or “people management”, which have been collected from 17 countries. Since we will refer to this work at several points we describe the methodology in a little detail as it is somewhat different than the standard HRM surveys described above. The essential method was to start with a grid of “best practices” in HR and non-HR management and then score firms along each of the eighteen dimensions of this grid following an in-depth telephone interview with the plant manager. These eighteen dimensions covered three broad areas: monitoring, target setting and people management (see Bloom and Van Reenen, 2007, Appendix Table A1 for details). The people management section covers a range of HR practices including whether companies are promoting and rewarding employees based on worker ability and effort; whether firms have systems to hire and retain their most productive employees; and whether they deal with underperformers through retraining and effective sanctions. For example, we examine whether employees that perform well, work hard and display high ability are promoted faster than others.
To obtain accurate responses from firms the survey targeted production plant managers using a “double-blind” technique. One part of this double-blind technique is that managers are not told they are being scored or shown the scoring grid. They are only told they are being “interviewed about management practices for a piece of work”. To run this blind scoring we used “open” questions since these do not tend to lead respondents to a particular answer. For example, the first people management question starts by asking respondents “tell me how does your promotion system work” rather than a closed question such as “do you promote on ability (yes/no)”. Interviewers also probed for examples to support assertions, for example asking “tell me about your most recent promotion round”. The other side of the double-blind technique is interviewers are not told in advance anything about the firm’s performance to avoid prejudice. They are only provided with the company name, telephone number and industry. Since the survey covers medium-sized firms (defined as those employing between 100 and 5000 workers) these would not be usually known ex ante by the interviewers.
These management practices were strongly correlated with firm’s performance data from their company accounts (total factor productivity, profitability, growth rates, and Tobin’s Q and survival rates). These correlations are not causal but do suggest that HR practices that reward effort and performance are associated with better firm performance, implying that these “good” management practice measures do contain some useful information and are not just arbitrary noise. Other research shows that these practices are also associated with better patient outcomes in hospitals (Bloom et al., 2010c) and improved work-life balance indicators (Bloom et al., 2009c).
Figure 2.3 shows the distribution of these people management practices across countries. The US clearly has the highest average scores for people management. Bloom et al. (2009b) show that this appears to be due to a combination of the US being absolutely good at managing firms across all 18 questions on average, and also having a particular advantage in people (HR) management. Other countries with light labor regulation like Canada, Great Britain and Northern Ireland also display relatively strong HR management practices. Interestingly Germany and Japan also fare well, in large part reflecting the fact that these countries have generally well managed manufacturing firms.
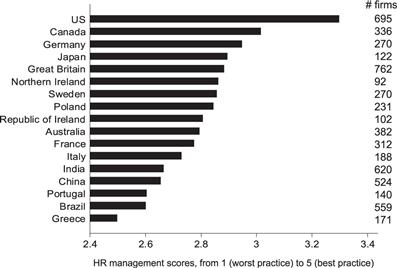
Figura 2.3 HR management practices across countries. Notes: Averages taken across a random sample of the population of medium sized (100 to 5000 employees) manufacturing firms within each country. 5850 observations in total. Firms per country in the right column. Scores firms on seven practices around pay, promotions, retention and hiring, where high scores denote strongerassociation with employee performance. (Source: Authors’ calculations from Bloom et al. (2009b) data)
Figure 2.4 breaks out the people management score into three of the key areas in the overall people management score, which are promotions, fixing/firing underperformers and rewards. What is clear is that US firms have the globally highest scored practices across all three dimensions, but are particularly strong on “fixing/firing” practices. That is, in the US employees who underperform are most likely to be rapidly “fixed” (dealt with through re-training or rotated to another part of the firm where they can succeed), or if this fails fired. In contrast in countries like Greece and Brazil underperforming employees are typically left in post for several months or even years before any action is taken to address them. In Section 4.1 we discuss reasons for these patterns. Broadly speaking, the high levels of competition and low incidence of family firms are the main contributing factors to the leading position of the US in overall management. On top of this, high levels of education and weaker labor regulations give American firms a particular advantage in the HR aspect of management.
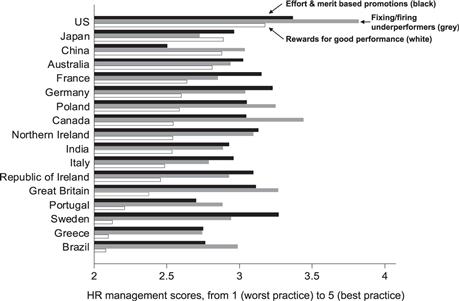
Figura 2.4 Promotions, fixing/firing, and rewards practices by country. Note: Averages taken across a random sample of medium (100 to 5000 employees) manufacturing firms within each country. 5850 observations in total. (Source: Bloom et al. (2009b))
Figure 2.5 displays the firm level distributions within each country for these management practices, showing there is a wide dispersion of practices within every country. The US average score is the highest because it has almost no firms with weak HR management practices, while Brazil and Greece has a large tail of firms with poor HR management practices. This wide variation within each country is what most of the prior micro literature has focused on, with Fig. 2.5 showing this variation is common across every country we have investigated.
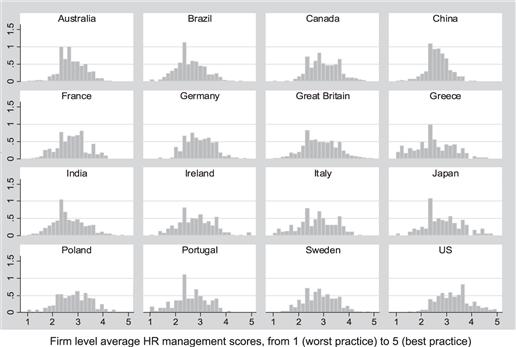
Figura 2.5 Firm level distribution of HR management by country. Notes: Bars are the histogram of the density at the firm level on a country by country basis. Randomly sampled from all medium sized (100 to 5000 employee) manufacturing firms in each country. (Source: Bloom et al. (2009b))
2.1.2 Measuring incentive pay through indirect methods
The indirect method has been common in labor economics mainly due to data constraints. Essentially this method examines the correlation of workers’ remuneration with firm-specific characteristics that should be important if pay is contingent on performance such as profitability, market value, etc. For example, if there are profit-related pay schemes, increases in firm profits should cause increases in worker pay. If pay was set solely on the external labor market, it should be unrelated to idiosyncratic changes in the firm’s financial position. An advantage of this approach over the direct approach is that many of the incentive schemes may not be explicitly written down as contracts. A disadvantage is that the correlations between firm performance and pay we observe may be unrelated to incentive schemes for econometric reasons—e.g. a positive demand shock may simultaneously raise a firm’s profitability and mean it hires workers of an unobservably higher skill level. Further, to the extent we do credibly identify a causal effect of firm performance on worker pay we cannot discern easily whether this is due to explicit contracts, implicit contracts, union bargaining4 or some other model.
Having said this, there is substantial evidence that firm performance does matter a lot for worker remuneration. This is clearest in the many studies of matched worker firm data, which generally shows an important role for firm characteristics in determining worker wages (e.g. Abowd et al., 1999). Simple OLS regressions of changes of wages on changes of firm’s profitability tend to find a positive effect (e.g. Blanchflower et al., 1996), but these are likely to be downward biased as shocks to wages will tend to reduce profitability. Using trade-based (Abowd and Lemieux, 1993) or technology-based (Van Reenen, 1996) instrumental variables tends to significantly increase the effect of firm performance on wages as we would expect. Matched worker-firm data is now commonly available in a large number of countries (see the collection of papers in Lazear and Shaw, 2008, for example). In the US, for example, Abowd et al. (2008) use the LEHD (Longitudinal Employer- Household Dynamics Program) covering about 80% of all employees. They show that about one half of all individual wage variance is associated with individual characteristics and about a half due to firm effects.
Although the focus of the literature has mainly been on explaining the distribution of wages at a point in time Dunne et al. (2004) show that between firm effects are important in understanding the growing inequality of wages over time in the US. Faggio et al. (2007) also find this for the UK and furthermore, offer evidence that the association of firm performance with wages has grown stronger over time. This is consistent with the more direct evidence discussed above that performance pay (explicit or implicit) may be more prevalent in recent years.
2.2 Productivity dispersion
Research on firm heterogeneity has a long history in social science. Systematic empirical analysis first focused on the firm size distribution measured by employment, sales or assets. Most famously, Gibrat (1931), characterized the size distribution as approximately log normal and sought to explain this with reference to simple statistical models of growth (i.e. Gibrat’s Law that firm growth is independent of size). In the 1970s as data became available by firm and line of business, attention focused on profitability as an indicator of performance (e.g. Kwoka and Ravenscraft, 1986). Accounting profitability can differ substantially from economic profitability, however, and may rise due to market power rather than efficiency.
In recent decades the development of larger databases has enabled researchers to look more directly at productivity. The growing availability of plant-level data from the Census Bureau in the US and other nations, combined with rapid increases in computer power has facilitated this development. Bartelsman et al. (2008) offer many examples of the cross country micro-datasets now being used for productivity analysis.
One of the robust facts emerging from these analyses is the very high degree of heterogeneity between business units (see Bartelsman and Doms, 2000). For example, Syverson (2004a) analyzes labor productivity (output per worker) in US manufacturing establishments in the 1997 Economic Census and shows that on average, a plant at the 90th percentile of the labor productivity distribution is over four times as productive as a plant at the 10th percentile in the same four digit sector. Similarly, Criscuolo et al. (2003) show that in the UK in 2000 there is a fivefold difference in productivity between these deciles.
What could explain these differences in productivity, and how can they persist in a competitive industry? One explanation is that if we accounted properly for the different inputs in the production function there would be little residual productivity differences5. It is certainly true that moving from labor productivity to total factor productivity (TFP) reduces the scale of the difference. For example, in Syverson (2004a) the 90–10 productivity difference falls from a factor of 4 to a factor of 1.9, but it does not disappear.
These differences show up clearly even for quite homogeneous goods. An early example is Salter (1960) who studied the British pig iron industry between 1911 and 1926. He showed that the best practice factory produced nearly twice as many tons per hour as the average factory. More recently, Syverson (2004b) shows TFP (and size) is very dispersed in the US ready mix concrete industry. Interestingly, the mean level of productivity was higher in more competitive markets (as indicated by a measure of spatial demand density) and this seemed to be mainly due to a lower mass in the left tail in the more competitive sector consistent with the thin tail of bad management in Fig. 2.5 for US firms compared to those of other countries. Studies of large changes in product market competition such as trade liberalization (e.g. Pavcnik, 2002), foreign entry into domestic markets (Schmitz, 2005) or deregulation (e.g. Olley and Pakes, 1996) suggest that the subsequent increase in aggregate productivity has a substantial reallocation element6.
A major problem in measuring productivity is the fact that researchers rarely observe plant level prices so an industry price deflator is usually used. Consequently, measured TFP typically includes an element of the firm-specific price-cost margin (e.g. Klette and Griliches, 1996). Foster et al. (2009) study 11 seven-digit homogeneous goods (including block ice, white pan bread, cardboard boxes and carbon black) where they have access to plant specific output (and input) prices. They find that conventionally measured revenue based TFP (“TFPR”) numbers actually understate the degree of true productivity dispersion (“TFPQ”), especially for newer firms as the more productive firms typically have lower prices and are relatively larger7.
Higher TFP is positively related to firm size, growth and survival probabilities. Bartelsman and Dhrymes, (1998, Table A.7) show that over a five year period around one third of plants stay in their productivity quintile. This suggests that productivity differences are not purely transitory, but partially persist.
Analysis of changes in aggregate productivity over time has shown that this productivity dispersion is also important in explaining economic growth. For example, Baily et al. (1992) find that half of the change in US industry-level productivity is due to the reallocation of output from lower productivity plants to those with higher productivity. This reallocation effect is partly due to the shift in market share between incumbents and partly due to the effects of exit and entry. Bartelsman et al. (2008) show that the speed of reallocation is much stronger in some countries (like the US) than others. There is also significant sectoral variation. For example, Foster et al. (2006), show that reallocation between stores accounts for almost all aggregate productivity growth in the US retail sector.
In summary, there is a substantial body of evidence of persistent firm-level heterogeneity in firm productivity (and other dimensions of performance) in narrow industries in many countries and time periods. Differential observable inputs, heterogeneous prices and idiosyncratic stochastic shocks are not able to adequately account for the remarkable dispersion of productivity. So what could account for this? One long suggested factor is management practices, with authors going back at least to Walker (1887) suggesting that management practices play an essential role in explaining differences in performance across firms8.
3 The effects of hrm on productivity
Do variations in variations in HRM practices play a role in driving differences in productivity? We find that the answer is “probably, yes”, although the empirical basis for this is surprisingly weak given the importance of the topic. In fact, as Syverson (forthcoming) notes in discussing management as a driver of productivity “no potential driving factor of productivity has seen a higher ratio of speculation to empirical study”.
We should also state in advance that in this section we focus on productivity as the key outcome. Many studies look at other outcomes such as worker turnover, absenteeism, worker perceptions, etc. These are useful, but if they have no effect on productivity then in our view they are second order—generally studies use them because they have no direct evidence on productivity (e.g. Blasi et al., 2009:4). We do not focus on measures of worker wellbeing such as job satisfaction or wages. Lazear and Shaw (2008) suggest that some of the dramatic increase in wage inequality in the US, UK and other country since the late 1970s is due to HRM practices. Lemieux et al. (2009) and Guadalupe and Cunat (forthcoming) also take this position, although the current state of the evidence is still limited. These are interesting outcomes in their own right, and may also feed through into productivity, but we are space constrained and refer the reader to the wider literature where relevant.
An important issue is the correct way to econometrically estimate production functions and TFP. Ackerberg et al. (2007) have surveyed such methods in a recent Handbook chapter, and this is a lively (but still unsettled) area of research. Many of the issues on econometric identification of the parameters of conventional factors of production (such as labor or capital) are the same as those that will be discussed in Section 3.2 below. There is also a growing literature on examining the impact of worker characteristics (or “human resources” such as skills, gender, race, seniority and age) on productivity through direct estimation in production functions rather than the traditional approach of looking at these indirectly through including them in wage equations. Interested readers are referred to recent examples of this approach in Moretti (2004), Hellerstein et al. (1999) and Dearden et al. (2006).
3.1 Why should we expect to see an impact of HRM on productivity?
Before discussing issues of identification and the results from these studies, it is worth asking some basic questions: (a) why is this an interesting empirical question? and (b) why would we expect to see any positive average effect of HRM practices on productivity? Note that the answer to this question is not specific to human resources, but any endogenously chosen organizational feature of the firm.
One response is that we should not expect to see any effects. The design perspective on HRM (discussed more fully in Section 4 below) assumes that all firms are continuously optimizing their HRM practices. This may vary between firms because of different environments—for example, variations in technologies across industries—but each firm is still optimizing. Externally manipulating the firm to “force” it to do something sub-optimal (e.g. adopt incentive pay schemes) can only harm the firm’s performance. By contrast, using actual changes in the firm’s choices of HRM (such as Lazear’s (2000) Safelite Glass example discussed below) will show that firms improve productivity as they will be optimizing so we expect any change to produce a positive outcome on average.
An important rejoinder to this is that firms maximize discounted profits, not productivity. It may increase productivity to introduce a given HRM practice, but this may still reduce profits, which is why firms have chosen not to adopt. One example is (Freeman and Kleiner, 2005), who found that the abolition of piece rates reduced productivity but increased profits as quality rose in the absence of piece rates. This is analogous to any factor input such as capital—increasing capital per hour will increase output per hour, but the firm already takes this into account in its maximization program. Thus, just as we are interested in estimating the parameters of a conventional production function for capital and labor, we may be interested in the parameters associated with an HRM augmented production function even if all management practices are chosen optimally.
A second reason for studying the effect of HRM on productivity is that if we do see any effect, we are interested in the mechanisms through which this effect is working. For example, we expect the introduction of incentive pay to affect the type of workers who want to join and leave the firm. How important are these sorting and selections effect relatively to the pure incentive effect? Moreover, even if we expect a positive effect, we may not be so interested in the average effect but rather how this varies with observable characteristics of sub-groups of workers, or of the firm or of its environment. Theory suggests that changing HRM will have heterogeneous effects in this way, so this places some more testable restrictions on the data.
Finally, we describe below in Section 4, theories that regard some management practices partially as a technology. In this case the investigation of the productivity effects of HRM is analogous to examining the effects of the diffusion of any “hard” technology such as computers or hybrid corn. With a new technology we generally expect to see slow and staggered diffusion across firms. Some of this is due to firms optimizing given heterogeneous costs and benefits in a full information world. But slow diffusion may also be due to the differential arrival rate of information about the new technology. More subtly, the optimal HRM type may have changed over time. For example, performance pay may now be optimal in many sectors where previously it was unprofitable due to rapid falls in the cost of Electronic Resource Planning systems (such as SAP) that measure worker output (but not effort) more accurately and rapidly. If the “management as technology” perspective is correct, we would expect to see positive productivity effects from the adoption of these new HRM practices.
3.2 HRM and productivity: the identification problem
The typical study in the HRM and productivity literature in Personnel Economics examines the change in HR policy (typically an incentive pay reform) in a single firm, and a key concern is the effect on worker productivity. As Shaw (2009) points out, this set-up looks extremely similar to the literature on policy evaluation and its concern with correctly identifying treatment effects. Of course, in standard policy evaluation the arena is usually larger than a single firm—a country or state; and the policy maker the government rather than the CEO. Nevertheless, all the many issues germane to identifying treatment effects are present and we discuss these links in this subsection. For a longer discussion on different treatment effects (Local Average Treatment Effects, Marginal Treatment Effects, etc.) and estimation strategies (IV, control function, regression discontinuity design, matching, etc.) see DiNardo and Lee (2011) orBlundell
and Costa-Diaz (2009).
To be precise, let dit represent the treatment status of individual i at time t. Potential outcomes (productivity) are ![]() and
and ![]() under the treated and non-treated scenarios. These are specified as
under the treated and non-treated scenarios. These are specified as ![]() for the treated and
for the treated and ![]() for the non-treated, where ai is the effect of the policy on individual i, c the common intercept and un the unobservable error. We assume that the policy effects are heterogeneous over individuals. This allows us to write the potential outcome equation as:
for the non-treated, where ai is the effect of the policy on individual i, c the common intercept and un the unobservable error. We assume that the policy effects are heterogeneous over individuals. This allows us to write the potential outcome equation as:
yit = c + αidit + uit.
There are a variety of treatment effects that we may be interested in. The traditional one in the homogenous treatment case is the average treatment effect (ATE), defined as the average outcome if an individual was assigned at random to the treatment group, E(αi). More commonly, we can only identify the Average Treatment on the Treated effect (ATT), which is the average effect for the individuals who went through the program at some point, E(αi|di = 1), where di indicates an individual who is assigned to treatment, even if they are not currently being treated.
Consider the model where each individual i is observed before and after the policy change at times to < k and t1 > k respectively. The popular Difference in Differences (DD) estimator makes the assumption that the error term, uit, takes a variance components form: uit = ηi + τt + εit, where ηi is correlated with di, τt is a common time effect, but εit is orthogonal to the other right hand side variables.
![]() (1)
(1)
Sequential differencing eliminates the fixed effect and the time effect so that
![]()
where ![]() is the average outcome in group d at time t. Under the difference in difference assumptions we recover the average effect of treatment on the treated. This is equivalent to adding in time dummies and individual fixed effects in estimating Eq. (1).
is the average outcome in group d at time t. Under the difference in difference assumptions we recover the average effect of treatment on the treated. This is equivalent to adding in time dummies and individual fixed effects in estimating Eq. (1).
Most of the HR studies have longitudinal data so they are able to do the first difference ![]() . However, many studies do not have a control group in the firm who are not treated, thus there is no second difference. This is a drawback because the second difference controls for unobservable time shocks that are common to the two groups but unobserved to the econometrician. In other words, a major concern is that the supposed effect of the HRM policy is actually just some other event simultaneously dated with the introduction of the program.
. However, many studies do not have a control group in the firm who are not treated, thus there is no second difference. This is a drawback because the second difference controls for unobservable time shocks that are common to the two groups but unobserved to the econometrician. In other words, a major concern is that the supposed effect of the HRM policy is actually just some other event simultaneously dated with the introduction of the program.
In fact, many of the studies discussed below do have some more variance than just before and after for a single organization. First, the object of study may be a few firms in a narrowly defined industry (which is the usual strategy in Industrial Organization). Second, there may be variation in the introduction of the policy across different sub-units within the firm (e.g. different plants, different geographical regions9, different production lines, different teams, etc.). Exploiting this form of variation, however, highlights the classical assignment problem—even if the macro time shock is common between the two groups, the decision to adopt the policy for plant A and not to adopt it for plant B is unlikely to be exogenous.
To see this, consider an assignment rule which is dit = 1 if ![]() and dit = 0 otherwise, where
and dit = 0 otherwise, where ![]() is a latent index defined by the linear rule:
is a latent index defined by the linear rule:
![]() (2)
(2)
In other words, plants that introduce the HRM policy may also be those that the CEO thinks are most likely to benefit from it. If this could all be captured by observables then we would be able to control for this bias. But we are unlikely in most datasets to have such a rich set of controls.
The credibility of the identification of treatment effects from cross-plant variation will hinge on the assignment rule of Eq. (2), which is of course a selection equation. Lazear (2000), for example, argues that the rollout of the policy across regions within Safelite Glass was essentially unrelated to differential potential benefits being determined by geography. Bandiera et al. (2007) examine whether similar productivity increases occurred at the same time in the season in a previous year when the policy experiment was not in place (a placebo test).
Having information on productivity prior to the policy is clearly helpful in considering selection. Lazear (2000) and Bandiera et al. (2007) can show that workers who ex ante had lower productivity were less likely to be selected into employment ex post. Since the selection mechanism in both papers means the more able workers are more likely to be employed, the ATT effect will be an upper bound of the effect on the compliers.
What is the advantage of single firm studies? Single firm studies are now the dominant form of methodology in Personnel Economics, but given the problem of the absence of an obvious control group, one might wonder whether this is such a good idea. Usually it is thought that focusing on a single firm enables researchers to control for many aspects that would be impossible to deal with in a larger cross-firm study. But what does this exactly mean?
Consider the possibility that we have multiple firms j = 1,..., J as well as multiple workers, i = 1,..., I, and the difference in difference assumptions hold. Further, let us assume that there is some exogenous within firm variation that enables us to identify the ATT from a single firm estimation strategy.
![]() (3)
(3)
If each firm j is “different” in the sense it has different time shocks (τjt), then estimating Eq. (3) by including a common time shock τt, as is typically done in the cross firm literature (e.g. Black and Lynch, 2004), will generally produce inconsistent estimates of the ATT effect. However, one could include firm dummies interacted with time dummies in Eq. (3) and recover the ATT in each firm j if the treatment randomly varied by worker within each firm. This would clearly be more informative than just recovering the ATT for one firm alone.
As second possible advantage of single firm strategies is that we may simply not have comparable policies across firms, in the sense that the policy changes dijt are not measured in the same units. To some extent this is true, but there are ways in which different policies can be made comparable. In the work on tax policies for example, we need to calculate what effect a tax reform has on the incentives facing individuals. If policies are incomparable then the generalizability of such studies is severely limited.
A third possible advantage of single firm studies is sheer institutional detail. Knowing a single firm well may make it possible to collect more detailed information and rule out many of the alternative explanations that might explain the results.
All three possible advantages of confining attention to a single firm strike us as differences in degree rather than in kind. The future of the field may be to move away from purely single firm studies to consider larger numbers of firms who are subject to HRM policy interventions where we have better ways of measuring the relevant management policy in a comparable way. One way to do this is to explicitly run experiments on firms, for example Karlan and Valdivia (2009) randomize the provision of training for the owners of micro-enterprises in Peru, including some HRM training, and find some significant positive impact of sales and growth. Bruhn et al. (2010) provide management training for small firms in Mexico, and again find some evidence for significant improvements on a range of performance metrics. Bloom et al. (2009a) run experiments on large Indian firms to introduce a modern management practices, including modern HR practices around piece-rate pay for workers and pay for performance for managers, and find large effects on productivity and profitability. While this literature is at an early stage, the broad results are that introducing modern HRM practice into firms in developing countries leads to significant improvements in performance. It would clearly be helpful to have more such studies, and particularly in developed countries.
3.3 Econometric studies of the productivity impact of HRM
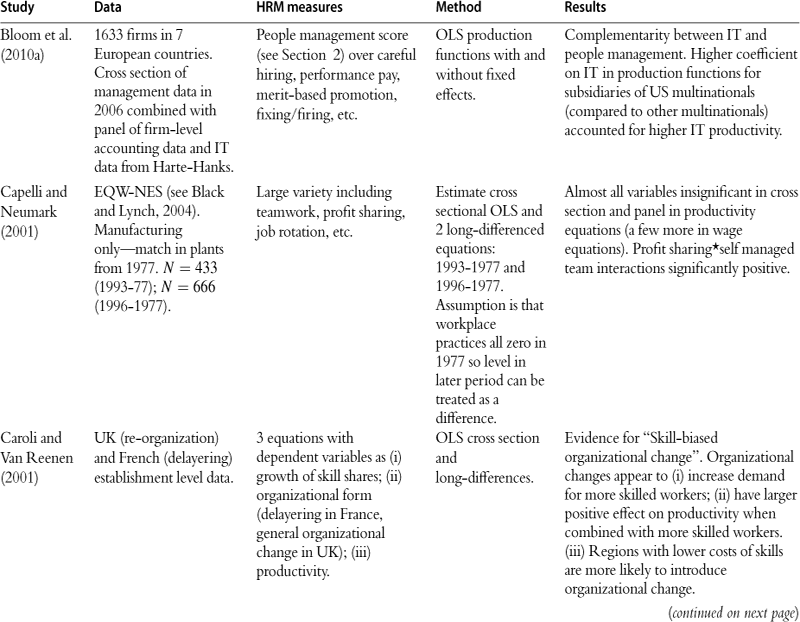
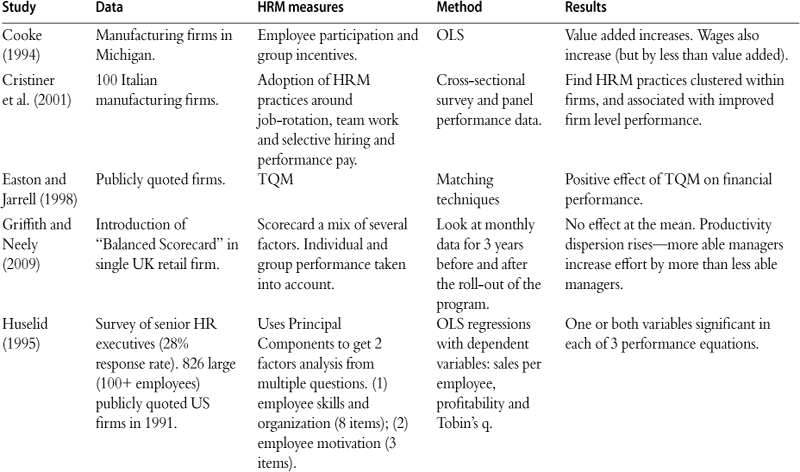
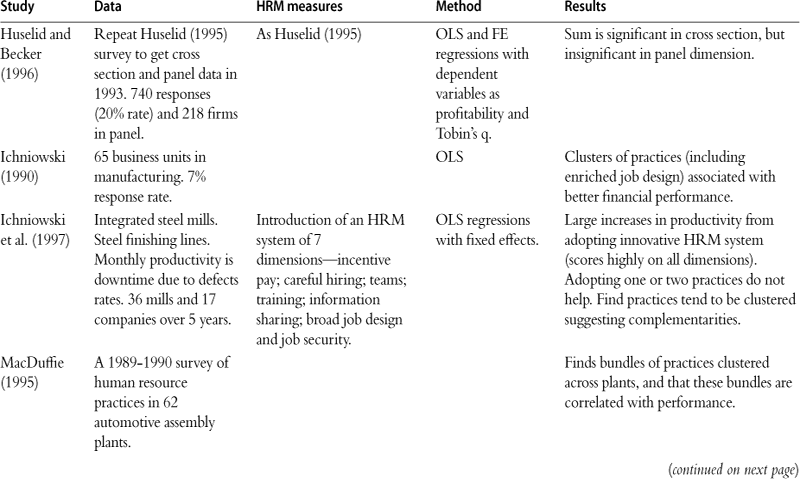
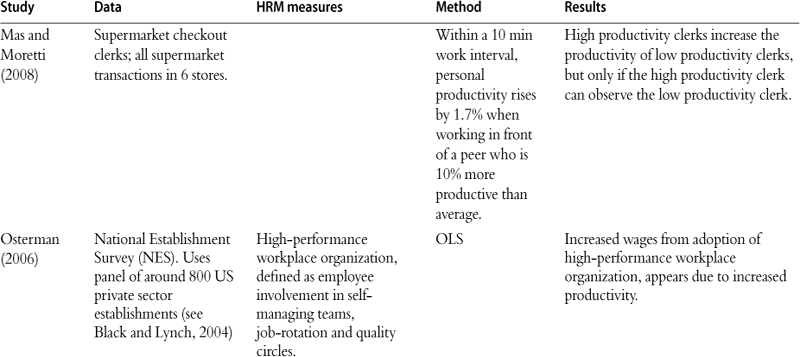
Having discussed the caveats in the previous sub-section, we now turn to the huge number of empirical studies on HRM and productivity which we attempt to summarize in Table 3.1. Before discussing these in detail, here is our four point summary.
1. First, high quality studies generally show that there is a positive effect on productivity of incentive pay, both individual bonuses and (more surprisingly) group bonuses. This seems true across many sectors, including the public sector (see, for example, the Prentice et al., 2007 survey).
2. Second, in addition to a pure incentives effect, there is usually also an important selection effect generating higher productivity—productivity increases because high ability workers are attracted to organizations offering higher powered incentives.
3. Third, the introduction of new forms of incentive pay is generally more effective when combined with other “complementary” factors. There are complements within the bundles of HRM practices (e.g. team work and group bonuses), and between some HRM practices and other firm characteristics (e.g. decentralization and information technology).
4. Fourth, there are many examples of perverse incentives, for example, when rewards are tied to specific periods of time (such as quarters) so that workers manipulate commissions to hit quarterly targets.
5. Fifth, incentive pay schemes tend to be associated with greater dispersion of productivity, as the effects are stronger on the more able workers, and this is stronger than the selection effect (which pushes towards reduced dispersion).
We divide this sub-section into general HRM studies (Panel A), individual incentive pay (Panel B), group incentive pay (Panel C) and distortions (Panel D).
3.3.1 General HRM studies
There are a huge number of studies that have correlated various aspects of the firm’s performance on various aspects of its HRM (recall Table 3.1 for some of the measures used). There is generally a strong and positive correlation between HRM and productivity.
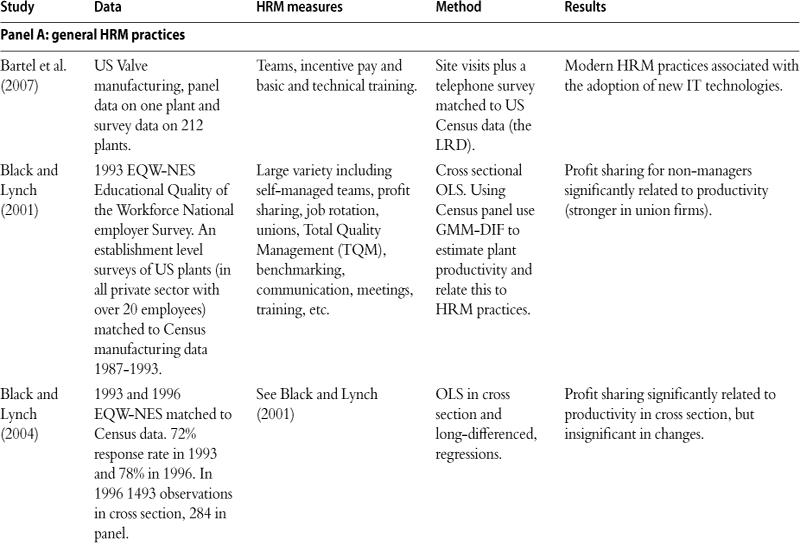
The better studies use micro data and pay careful attention to the measurement issues and need to control for many covariates. Black and Lynch (2001) examine various aspects of “high performance” workplaces including profit related pay, but also Total Quality Management, benchmarking, self managed teams, recruitment strategies, etc. This was from a rich cross sectional survey that they helped design (the EQW-NES) that could be matched to plant-level panel data from the Census Bureau. They estimated production functions controlling for conventional inputs such as labor, capital and materials, but also included a large number of these HRM practices. They found relatively few practices were significantly related to total factor productivity—profit sharing for non-managers and benchmarking were two of the stronger ones. The Bloom and Van Reenen (2007) management scores also show high correlations of HR management scores with labor productivity, as illustrated in the regressions in Table 3.2. A significant correlation is also apparent when other controls are added (columns (2) and (3)) or alternative measures of performance are used such as profitability, sales growth and firm survival (columns (4) through (6)). Of course none of these results are causal in the sense that cross-sectional correlations between HR and productivity may be driven by reverse causality, or correlations with other omitted factors as discussed above.
Table 3.2
Performance and people management practices.
All columns estimated by OLS with standard errors are in parentheses under coefficient estimates clustered by firm, except for column (6) which is estimated by Probit (we report marginal effects at the sample mean). Survival is defined as firms who are still in operation in Spring 2009 (including if they have been taken over by another firm). Sample of all firms with available accounts data at some point between 2000 and 2008. Management score has a mean of 2.973 and a standard-deviation of 0.664. “Country and industry dummies” includes a full set of 17 country and 162 SIC 3-digit dummies. “General controls” comprise of firm-level controls forln (average hours worked) and ln (firm age). “Noise controls” are 78 interviewer dummies, the seniority and tenure of the manager who responded, the day of the week the interview was conducted, the time of the day the interview was conducted, the duration of the interviews and an indicator of the reliability of the information as coded by the interviewer. All regressions include a full set of time dummies. “People Management” is the firm-level people management score covering pay, promotion, hiring, firing, retaining employees, consequence management and human capital targets. “% College Degree” is the share of employees with a college degree (collected from the survey). “Profitability” is ROCE which is “Return on Capital Employed” and “Sales growth” is the 5-year growth of sales. Survival is equal to zero if a firm exited due to bankruptcy/liquidation by the end of 2008 and one otherwise.
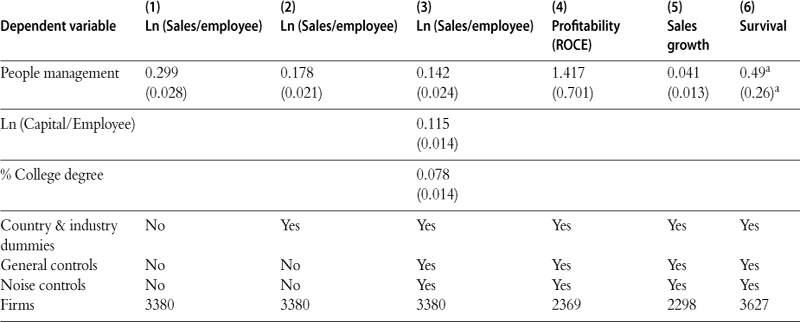
amarginal effect and standard error multiplied by 100. The sample mean of non-survival is 2.1% so the marginal effect of −0.49 implies one management point is associated with 23.5% (=0.49/2.1) lower exit rate.
Source: Authors’ calculations using Bloom et al. (2009b) data.
Some studies have tried to get a better handle on causation by using panel data on management practices to try and control for fixed cross-sectional differences between firms. In Black and Lynch (2004) the authors analyzed a second wave of the EQW-NES data so they could examine changes between 1996 and 1993. Again, some practices (such as profit related pay) showed up as informative in the cross section, but HRM practices were usually insignificant after controlling for fixed effects (only “re-engineering was significant). Capelli and Neumark (2001) come to a similar conclusion also examining the same data.
Since many of these practices appear to be highly correlated some researchers have aggregated them into a smaller number of summary measures. Huselid (1995) and Huselid and Becker (1996) did this in combining questions of his survey of HR managers into two principal components—”employee skills and organization” and “employee motivation”. They found that in the cross section one or other of these factors was positively and significantly related to productivity, profitability and Tobin’s Q. However, like Black and Lynch (2004), once fixed effects were included these factors were not significant.
The disappointing results for the absence of any “effect” in the time series dimension could be due to the fact that there genuinely is no relationship between productivity and HRM practices. Under this interpretation the cross sectional results are due to a spurious correlation with a time-invariant unobservable. Alternatively, there may be a downward endogeneity bias in the time-series, for example, because negative productivity shocks are positively correlated with the introduction of new practices. Nickell et al. (2001) argue that firms organizationally innovate when they are doing badly and this would cause such a downward bias. Another factor is measurement error, which if it is of the classical form can cause attenuation bias towards zero. This is likely to be particularly problematic for HRM practices if they do not change much over time and are measured with substantial error.
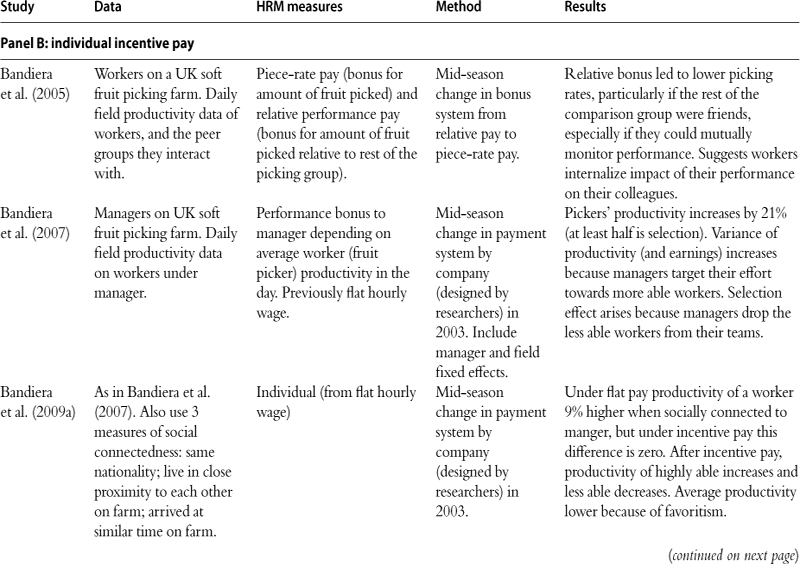
3.3.2 Individual incentive pay
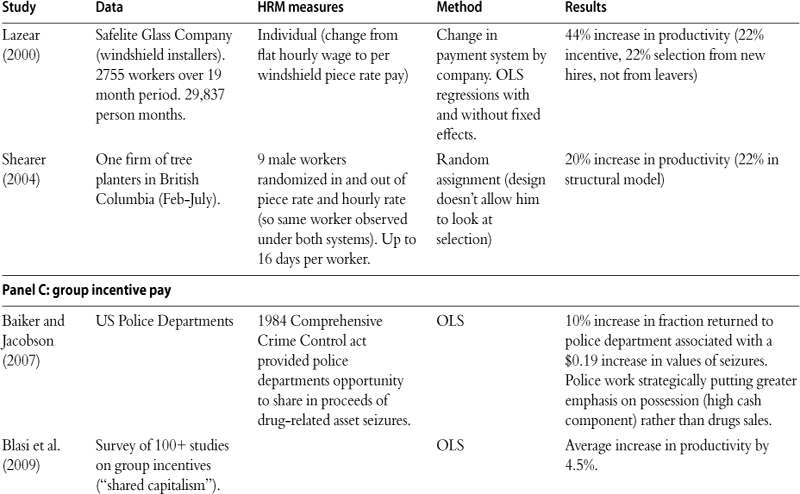
A pioneering study is Lazear (2000) who looked at the replacement of a flat rate hourly pay system by a piece rate pay system for windshield installers in the Safelite Glass Company. In this firm each employee has a truck and drives to the homes of people who have broken car windshields and installs a new one. Looking 19 months before and after the introduction of the incentive pay plan, Lazear found that productivity increased by around 44% after the policy change, with about half of this due to selection effects and half from the same individuals changing their behavior. The selection effects are because less productive workers left the company and more productive workers joined, presumably attracted by the higher powered incentives.
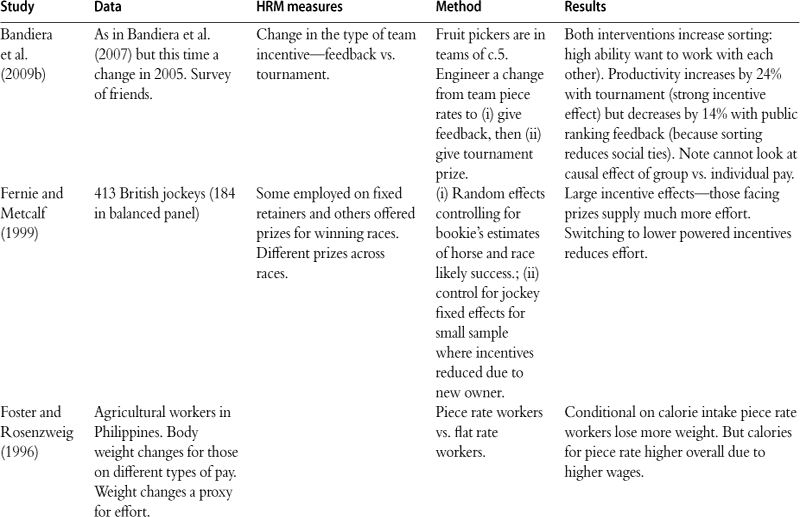
More recently, Bandiera et al. (2007) engineered a change in the incentive pay system for managers in a UK fruit farm. All the workers (fruit pickers) were on piece rate pay, but prior to the policy change the managers were paid a flat rate, whereas afterwards there was a strong element of pay tied to the performance of the workers they managed. The average picker’s productivity rose by 21% after the introduction of performance related pay and at least half of this was due to improved selection. The remainder of the effect is due to managers focusing their efforts more on the workers where it had the greatest marginal effect. Examining the mechanism through which this happened, Bandiera et al. (2009a) gathered information on social connections from their survey. They found that prior to the introduction of incentive pay managers favored workers to whom they were socially connected, irrespective of the workers’ ability. After the introduction of performance bonuses they targeted their efforts towards high ability workers, regardless of whether they were socially connected or not. This had the effect of increasing the dispersion of productivity (as well as the level).
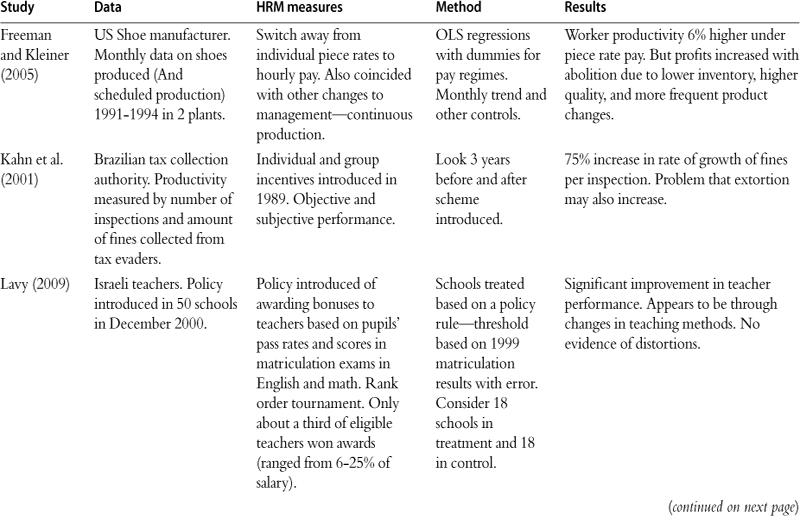
Freeman and Kleiner (2005) examine the elimination of piece rates for a US shoe manufacturer. They focused on two plants of the same firm who switched at different times and focused on what happened to productivity (monthly shoes produced per worker) and profits before and after the change in the pay scheme. Consistent with the other “insider” studies, productivity fell after the workers were put on a flat hourly rate. Interestingly, the authors show that profits rose after the change, which they attribute in part to improved quality with flat pay, plus a variety of other managerial changes complementary to flat rate pay.
A criticism of these studies is that the workers who are treated are not random. The firm who introduced the policy presumably believed there would be some benefits from doing so, thus it is hard to rule out the idea that there may have been some other contemporaneous change that affected worker productivity. Shearer (2004) addresses this problem in his study of tree planters in British Columbia. He worked with the company employing the planters and designed an experiment where all workers were randomly assigned to the incentive pay group for some days and flat hourly time rates for others (so the same worker is observed under both systems). He cannot look at selection effects, but found that the pure incentive effect was to increase productivity by around 22%, very similar to Lazear (2000).
Another example of cleaner identification is Lavy (2009), who exploits a quasiexperiment in Israeli schools where teachers were offered individual bonuses based on their relative performance as indicated by pupil scores in math and English exams. School assignment was based on a rule determined by past matriculation results, and this gives several identification methods including a regression discontinuity design around the threshold. He finds significant improvements in teacher performance and no evidence of distortions. Interestingly, the improvement in performance appeared to be due to changes in teaching methods and management. Not all evaluations of performance pay for teachers are so positive, although Lavy’s (2007) survey does suggest that the weight of evidence is in favor, and more so for individual incentive pay than for group incentives, which we turn to in the next sub-section.
In summary, these studies do suggest that individual incentive pay increases productivity. Other studies also show evidence that incentives affect employee behavior, but the precise “incentive effect” on productivity is not so easy to interpret10.
3.3.3 Group incentive pay
In Section 2 we saw that collective payment by results (such as team bonuses) has become much more important over the last 30 years or so. In the US almost half of employees participate in such schemes (see Section 2). There has been a recent review of the effects of such schemes in Blasi et al. (2009), who consider over 100 studies. In general a positive association is revealed between group incentive schemes and company performance, but with substantial diversity in results. The average estimated increase in productivity associated with employee ownership and profit sharing is 4.5%11. A survey of UK schemes by the UK Treasury (Oxera, 2007) found a mean effect across studies of 2.5% and larger effects for share ownership schemes12. Combinations of such schemes with other HRM practices were found to be particularly effective—e.g. employee involvement in teams.
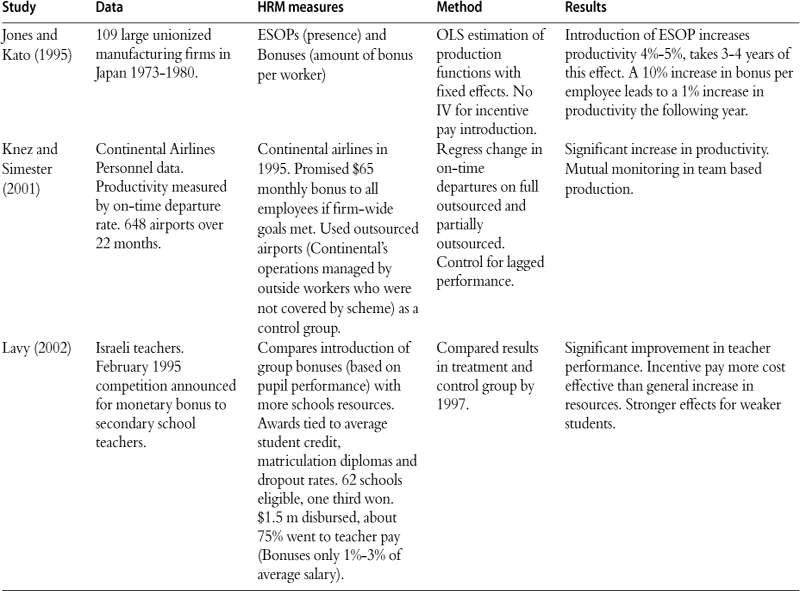
A recent example of this literature would be Bryson and Freeman (2009), who use the 2004 UK WERS survey discussed in Section 2 to relate various measures of company performance to the presence of incentive pay. They find that employee share ownership schemes are associated with 3.3% high value added per worker compared to no other form of incentive pay, but other forms of group incentive pay are insignificant. As with most of the other studies, the problem is that there are many potential omitted variables that are not controlled for, so we are concerned whether this is a causal effect or simply an association with an unobservable13. Jones and Kato (1995) go one step further as they have panel data on ESOPs and bonuses in Japanese firms. Switches to ESOPS were associated with 4%-5% higher productivity after 3–4 years. Although panel data is an improvement, there is still the problem that the adopting firms are non-random, as discussed in Section 3.2.
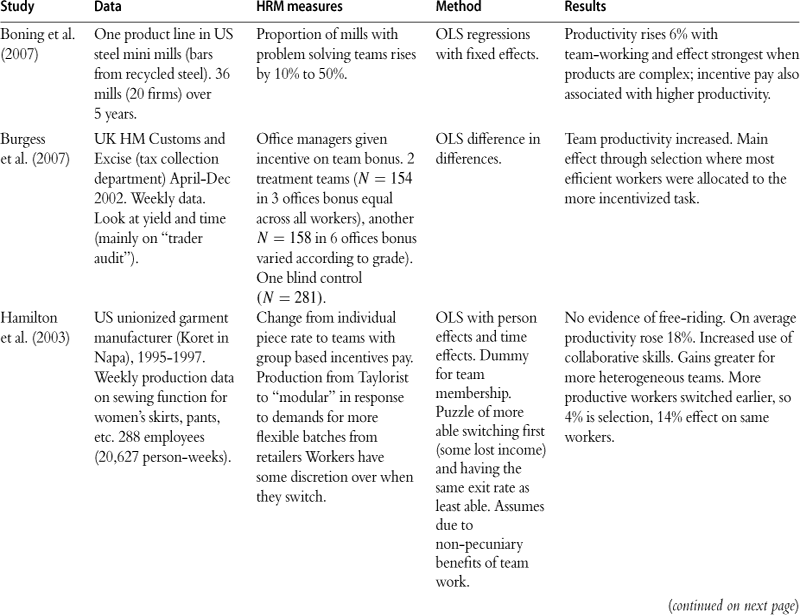
Boning et al. (2007) examine the introduction of team-based systems (including group incentive pay) in a distinct product line across 36 mini-mills. These mini-mills take scrap metal and recycle it into steel bars used, for example, in freeways. They find team-based work (including team bonuses) are associated with 6% higher productivity, especially in more complex products, which indicates the importance of the complementarity between HRM and the wider strategy of the firm (see Section 3.4).
Hamilton et al. (2003) study the shift by a US garments manufacturer from individual pay towards group pay (“gain-sharing”). This coincided with a more general change in the firm’s production strategy to produce smaller more custom-made batches (reflecting demand from their major customer—retail clothing stores). This “modular” approach required more team work, so group bonuses were more appropriate incentives. Productivity rose by about 18%, and this increase was stronger for more heterogeneous teams. The authors suggest that this came from exploiting unused collaborative skills of workers. Surprisingly given the free rider problem, the more productive workers were earlier to switch. This suggests some non-pecuniary benefits and also positive peer effects (see below)14.
Boning et al. (2007) and Hamilton et al. (2003) have the advantage that some of the unobservable shocks are controlled for by focusing on a narrower group of individuals (working in a single industry or a single firm). Although they still face the issue of endogeneity, as there is no random assignment, their intimate knowledge of the change enables them to examine the mechanisms through which group pay influences productivity in a richer manner. Bloom et al. (2009a) do randomly assign firms to interventions including the introducing performance related pay and find a 10% improvement in productivity.
Burgess et al. (2007) obtain something that is closer to random assignment by examining the introduction of a group incentive system in the UK tax collection agency. The preliminary results from this work suggest that group bonuses were effective in significantly raising productivity. Also in the public sector, Lavy (2002) finds that group bonuses for Israeli school teachers were highly effective in raising performance (compared to simply increasing school resources). Schools were given awards for improvements in dropout rates, matriculation rates and credits. The effects were stronger for weak students. Finally, Baiker and Jacobson (2007) find that group incentives in the form of keeping a greater share of the value of seized assets caused police productivity to rise in catching drug offences.
In summary, there does then, appear to be evidence that group incentive schemes also raise productivity, which is surprising given the free rider problem. Overall, in our opinion, however the evidence is weaker here than that for individual incentive pay.
3.3.4 Distortions due to incentive pay
The studies in the previous sub-sections suggested that individuals do respond to pay incentives and generally in a way that usually increases productivity. The theoretical literature has emphasized many ways in which incentive pay can cause distortions which could reduce productivity. First, employees are more risk averse than firms and incentive pay increases the risks faced by workers. Thus it may discourage some high ability (but risk averse) workers from joining the firm and encourage excessive risk taking15. Second, firms cannot always credibly commit to reward performance ex post. For example, Gibbons (1987) details a model where only the worker knows the difficulty of job and the true action. He shows how this generates a “ratchet effect” where workers will restrict output unless the employer can commit not to use the information it obtains from learning the difficulty of the task. Third, measures of the worker’s productivity are imperfectly related to inputs (worker effort). Baker (1992) shows how incentive pay tied to a measurable output will cause workers to increase effort to improve the measured output and reduce effort on the unmeasured output (e.g. quantity instead of quality in Lazear, 1986)16.
Given the difficulty with tying incentives to objective measures what about the common practice of using supervisors’ subjective measures of performance? Several papers have modeled the optimal mix of incentives based on imperfect objective measures and perfect (but unverifiable) subjective measures17. The problem with subjective measures is that, although they provide stronger incentives, workers have to trust that the firm does not renege ex post, which is a particular danger with unverifiable information. Furthermore, there will still be the problem of the gap between actual and measured effort. This can mean (i) employees engage in “influence activity” to alter supervisors’ decisions in their favor (e.g. Milgrom and Roberts, 1988)18; (ii) there may be favoritism on the behalf of supervisors for particular workers (Prendergast and Topel, 1996)19; (iii) the supervisor and employee may hold different opinions about employee’s performance (MacLeod, 2003).
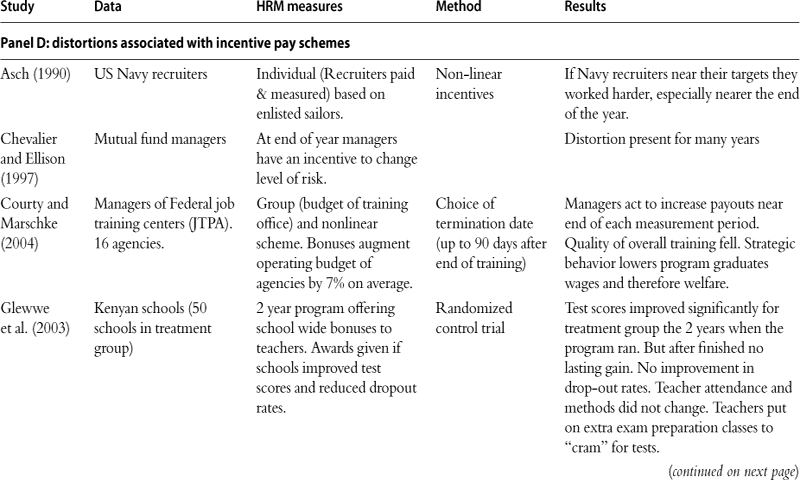
Empirical work has tended to focus on the potential distortions in explicit incentive schemes. One key distortion that occurs is the measurement period. Asch (1990) examines US Navy recruiters who were incentivized based on their ability to enlist sailors (partly through measurement and some also through explicit payments). This was based on annual quotas, so only affected those who were close to missing their quota. In addition, the effect was extremely strong near year end, but weak afterwards, causing inconsistent efforts over time. Courty and Marschke (2004) analyze managers of job training centers and show that managers work very hard at the end of the measurement period, but generated some costs in the form of lower training quality. Glewwe et al. (2003) examined a school-wide incentives program in Kenya. The program randomly assigned fifty elementary schools to a treatment group eligible for monetary incentives (21%-43% of monthly salary). All teachers in winning schools received rewards based on average test score performance and dropout rates. Student scores improved significantly in the treatment schools for the two years the program was in place. But this appeared to be due solely to teachers conducting test preparation outside of regular class and there were no long-run effects on pupil performance. This appeared to be a classic case of incentives simply causing “teaching to the test”.
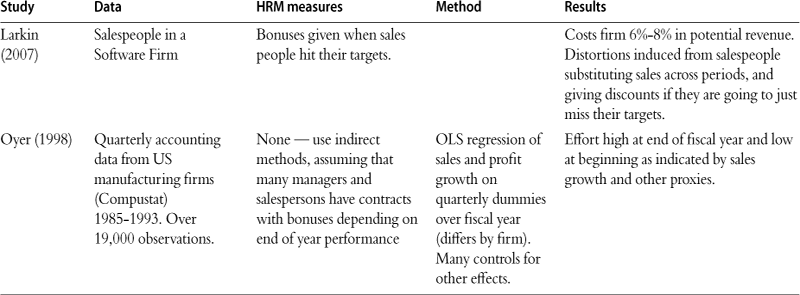
One might think that since these are examples from the public sector it is no surprise that incentives are poorly designed. Yet there are also many private sector examples. Oyer (1998) shows that firms typically build incentives around fiscal years. Consequently, firms sell more (at lower margins) near the end of the fiscal year compared to the middle of the year, and even less just at the start of the accounting year. Larkin (2007) looks at a large software company and shows that salesmen acted on their incentives to shift effort towards the end of their measurement period. Compared to the counterfactual of no incentive contracts it is unclear whether these imperfect incentive contracts reduce overall productivity (although Larkin argues that there is a 6%-8% cost in potential revenue)20.
A more subtle form of distortion can occur between types of individual incentive pay systems when workers have social preferences. Many economists (e.g. Lazear, 1989) have puzzled over why relative performance benchmarks are not used more commonly in pay systems given their desirable properties (i.e. common time specific shocks outside the employees’ control are removed). Bandiera et al. (2005) examined a change of incentive pay among workers in their firm from a system based on relative performance to piece rates based on absolute performance. They found that productivity increased by 50% as a result of the experiment and attributed this to the fact that workers have social preferences (using their measures of friendship networks). Under a relative performance system a worker who increases his effort puts a negative externality on other workers under a relative system, but has no such affect under a piece rate system.
Overall, there is clear evidence that distortions often occur in response to incentive pay schemes, especially when badly designed. Nevertheless, the evidence that many performance pay schemes—whether individual or group—can raise productivity suggests that these distortions are not generally overwhelming.
3.3.5 Labor unions
A related literature is on the productivity impact of labor unions, an important human resource policy choice (see Freeman and Medoff, 1984). One recent attempt at an identification strategy here is DiNardo and Lee (2004), who exploit a regression discontinuity design. In the US a union must win a National Labor Relations Board election to obtain representation, so one can compare plants just above the 50% cut-off to plants just below the 50% cut-off to identify the causal effects of unions. In contrast to the rest of the literature, DiNardo and Lee (2004) find no effect of unions on productivity, wages and most other outcomes. The problem, of course, is that union effects may only “bite” when the union has more solid support from the workforce.
More generally, there is the question of whether unions inhibit incentive pay. Arguments can be made both ways. Although Fig. 2.1 is suggestive of the rise in incentive pay moving in the opposite way to the fall in union power, and unions are certainly associated with lower pay dispersion within firms, Brown (1990) found no relationship with performance pay.
3.4 Complementarities
One of the key reasons why firms may find it difficult to adjust their organizational form is that there are important complementarities between sets of organizational practices. Milgrom and Roberts (1990) build a theoretical structure where such complementarities (or more precisely, super-additivities) mean that firms optimally choose clusters of practices that “fit together”. When the environment change so that an entrant firm would use this group of optimal practices, incumbent firms will find it harder—they will either switch a large number together or none at all.
This has important implications for productivity analysis. The effects of introducing a single practice will be heterogeneous between firms and depend on what practices they currently use. This implies linear regressions of the form of Eq. (1) may be misleading. To see this, consider that rather than a single HRM practice (dit) there are two management practices, m1 and m2 and their relationship with productivity is such that TFP (the yu considered here) increases by more when they are used together.
![]() (4)
(4)
A simple version of the complementary hypothesis is βi2 > 0. A stronger form is that the disruption caused by just using one practice alone actually reduced productivity, βl < 0, β2 < 0. In this case a regression which omits the interaction term may actually only find only a zero coefficient on the linear terms.
The case study literature emphasizes the importance of complementarities. Econometrically, testing for their existence poses some challenges, however, as pointed out most clearly by Athey and Stern (1998). A common approach is a regression of practice 1 on practice 2 (and more) with a positive covariance (conditional on other factors) indicating complementarity. It is true that complements will tend to co-vary positively, but this is a very weak test. There could be many other unobservables causing the two practices to move together. Essentially, we need instrumental variables for at least one of the practices (e.g. Van Biesebroeck, 2007), but this is hard to obtain as it is unclear what such an instrument would be—how could it be legitimately excluded from the second stage equation? In classical factor demand analysis we would examine the cross price effects to gauge the existence of Hicks-Allen complements versus substitutes, i. e. does demand for practice 1 fall when the price of practice 2 rises (all else equal). Analogously, we would like to observe some cost shock to the adoption of practice 1 that is uncorrelated with the error term in the practice 2 adoption equation. Unfortunately, such tests are particularly hard to implement because there are generally no market prices for the organizational factors we are considering.
An alternative strategy is to work straight from the production function (or performance equation more generally). In an influential paper Ichniowski et al. (1997) estimate a version of Eq. (4) using very disaggregate panel data on finishing lines in integrated US steel mills using eleven human resource practices (including incentive pay, recruitment, teamwork, job flexibility and rotation). Their measure of productivity is based on downtime—the less productive lines were idle for longer. They find that introducing one or two practices has no effect, but introducing a large number together significantly raises productivity. Although the endogeneity problem is not eliminated, the controls for fixed effects, looking at very disaggregated data and a performance measure suited to the sector (downtime) helps reduce some of the more obvious sources of bias. Gant et al. (2002) show that the productivity benefits of team working in steel plants appear to be due to faster problem solving because of tighter horizontal interactions and networks between workers. They use detailed surveys of who is talking to who to show that plants involved with innovative HRM systems have this feature.
In addition to endogeneity concerns, there is a further problem with interpreting a positive estimate of βi2 in Eq. (1) as evidence of complementarities. The true model may be one where there is a single latent factor for “good HRM management” and the many individual HRM measures may be (noisy) signals of this latent factor. This will generate positive covariance between the practices and could also cause the interaction to be positive. Thus, some care is required in the interpretation of the production function coefficients.
We have focused on complementarities between types of HR practices. New technology is often discussed in this context and we turn to this next (see also Section 5).
3.5 The role of information and communication technologies (ICT)
One of the key productivity puzzles of recent years has been why the returns to the use of information and communication technologies appear to be so high and so heterogeneous between firms and between countries. For example, Brynjolfsson and Hitt (2003) find that the elasticity of output with respect to ICT capital is far higher than its share in gross output (see also Stiroh, 2004). This reversed the well known Solow Paradox that one could find computers everywhere except the productivity figures. Not only was there evidence for large and significant returns at the micro-level, US productivity growth accelerated at the macro level from 1995 onwards. A substantial fraction of this appears to be linked to the production and use of ICT (e.g. Jorgenson et al., 2008), and the greater pay-off to ICT usage seems to be a reason why European productivity growth was much slower than that in the US since the mid 1990s (ending the catching up process).
One explanation for these phenomena was that effective use of ICT also requires significant changes in firm organization. Changing the notation of (5) slightly we could write
![]() (5)
(5)
where c is ln(ICT capital) and m is an HRM practice. The hypothesis that βcm > 0 would be consistent with complementarity between some HRM practices and ICT. Bresnahan et al. (2002) try to test this directly by surveying the organizations of large US firms on decentralization and team work (for a cross section) and combining this with data on ICT (from a private company Harte-Hanks) and productivity from Compustat. They find evidence that βcm > 0. Bloom et al. (2010a) broaden the sample to cover firms in seven European countries and find evidence of complementarity of ICT with the Bloom-Van Reenen measure of HR management discussed in Section 2. They also show that their results are robust to controlling for firm fixed effects. Careful econometric case studies (e.g. Baker and Hubbard, 2004; Bartel et al., 2007) also identify differential productivity effects of ICT depending on organization form. We will return to the issues of complementarity between HRM, technology and human capital in Section 5.
4 Two perspectives on hrm and productivity: design and technology
In thinking about the reasons for variations in HRM and productivity a contrast can be drawn between two possible approaches. The first is the now classic approach of Personnel Economics, which we label the “design” approach. The view here is that the HRM practices we observe are chosen and continuously optimized by a profit maximizing firm: they are explicit strategic choices of the firm, and observable variations in HRM reflect variations in the firm’s environment.
A second approach is becoming more common, but has not been closely linked to labor economics. We label this the “managerial technology” approach because of the recent stress in diverse fields of economics, such as trade, public and macro, but above all Industrial Organization, that there are large and persistent differences in firm productivity (see Section 2.2 above). In this view some aspects of HRM could be considered as a technology or “best practice” in the jargon. Adopting these forms of HRM would improve productivity in a typical firm. This leads on naturally to the question of why all firms have not adopted such practices. We discuss this below, but one immediate explanation is that all technologies have some diffusion curve whereby not all firms immediately adopt them. For example, it took American car manufacturers decades to accept and then implement Japanese style “lean manufacturing” techniques pioneered by Toyota. Informational constraints (and other factors we discuss below) could be an explanation for the slow diffusion of major managerial innovations.
The firm heterogeneity inherent in the managerial technology perspective mirrors the traditional labor economist’s emphasis on heterogeneity amongst workers. Interestingly, the many recent contributions in labor economics have found that fundamental features of the labor market such as the persistent dispersion in equilibrium wage distribution for similar workers cannot be easily understood without appealing to some sort of firm heterogeneity (e.g. Postel-Vinay and Robin, 2002; Cahuc et al., 2006). Such models are generally silent on how this firm heterogeneity comes about, but their existence seems important in quantitatively matching features of wage dispersion in real labor markets.
The Design and Technology perspectives are not mutually exclusive, of course. As economists, we believe that there is always some element of maximization. The managerial technology perspective highlights, however, that some firms are constrained by being less productive than others. We believe that this is an important empirical phenomenon which can explain many puzzling facts and requires integration into the dominant design paradigm. We overview both perspectives and refer readers who want more depth to the surveys in Gibbons and Waldman (1999), Malcomson (1999), Prendergast (1999), Lazear (1999) and especially Lazear and Oyer (forthcoming) which summarizes the most recent theory and some more recent empirical evidence.
4.1 The design perspective
The economics of contracts (see Bolton and Dewatripont, 2005, for an overview) and the economics of organizations (see Gibbons and Roberts, forthcoming) have made huge strides in recent decades. HRM or Personnel Economics is a sub-class of this broader field with a focus on explaining the type of institutions we observe in real employment contracts and organization.
Prior to the emergence of Personnel Economics, the study of HRM was dominated by industrial psychologists and sociologists, who emphasized institutions and culture as determining the internal organization of firms. Generalizations were eschewed. Traditionally labor economists focused on labor demand and supply, unemployment and investment in education, issues that saw the firm as a single unit rather than a complex organization and so had little to directly say on the structure of pay, promotions and design of work within firms. This started changing in the 1970s, partly as new techniques of agency and contract theory allowed a more systematic treatment of activity inside companies.
The design perspective borrows three key principles from economics. First, firms and workers are rational maximizing agents (profits and utility respectively). Secondly, it is assumed that labor and product markets must reach some sort of price-quantity equilibrium, which provides some discipline for the models. Finally, the stress is very much on private efficiency, with an emphasis on why some employment practices which may look to be perplexing and inefficient on the surface (e.g. mandatory retirement and huge pay disparities for CEOs) may actually be (at least privately) optimal.
The key feature of the design approach is that the HRM practices we observe are chosen by firms to maximize profits in an environment that departs from perfectly competitive spot markets. Unlike the standard Personnel Management texts, Personnel Economics leads to sharper predictions and generalizations: it is not the case that “every workplace is fundamentally different”. However, the design approach puts the reason for heterogeneity in the adoption of different practices as mainly due to the different environments firms face—say in the industry’s technology, rather than inefficiencies. The managerial technology view, described next, sees a large role for inefficiencies.
4.2 The managerial technology perspective
4.2.1 What are HRM best practices?
The large dispersion in firm productivity discussed in Section 2.2 motivates an alternative perspective that some types of HRM (or bundles of HRM practices) are better than others for firms in the same environment. There are three types of these best practices. First, there are some practices that have always been better throughout time and space (e.g. not promoting gross incompetents to senior positions) or collecting some information before making decisions. Second, there may be genuine managerial innovations (Taylor’s Scientific Management; Toyota’s Lean Manufacturing System; Demming’s Quality movement, etc.) in the same way there are technological innovations. There are likely to be arguments over the extent to which an innovation is real technical progress or just a fad or fashion. It is worth recalling that this debate historically occurred for many of the “hard” technological innovations which we take for granted now such as computers and the Internet. Thirdly, many practices may have become optimal due to changes in the economic environment over time, as the design perspective highlights. Incentive pay may be an example of this: piece rates declined in the late 19th Century, but incentive pay appears to be making somewhat of a comeback (see Section 2.1.1). Lemieux et al. (2009) suggest that this may be due to advances in ICT— companies like SAP make it much easier to measure output in a timely and robust fashion, making effective incentive pay schemes easier to design21.In these circumstances, some firms may be faster than others in switching to the new best practice. The differential speed of adjustment to the new equilibrium can be due to information differences, complementarities (see sub-section 3.4) and agency issues.
Notice that there is nothing in what we have said that is specifically tied to HR in this description. If productivity dispersion is due (at least in part) to differential managerial quality then this applies both to the HR and non-HR aspects of management. We next examine some of the theories of management that could help account for productivity dispersion (of which HRM is a subset).
4.2.2 Theories of management quality
The large-scale productivity dispersion described in Section 2 poses serious challenges to the representative firm approach. It has always been germane to Industrial Organization, but there has been a wholesale re-evaluation of theoretical approaches in several fields. For example, in international trade the dominant paradigm has already started to shift towards heterogeneous firm models. This is due to the increasing weight of empirical evidence documenting the persistent heterogeneity in firm export patterns (exporters tend to be larger and more productive). Melitz (2003) follows Hopenhayn (1992) in assuming that firms do not know their productivity before they pay a sunk cost to enter an industry, but when they enter they receive a draw from a known distribution. Productivity does not change over time and firms optimize subject to their constraint of having high or low productivity. Firms who draw a very low level of productivity will immediately exit, as there is some fixed cost of production they cannot profitably cover. Those who produce will have a mixture of productivity levels, however. A natural interpretation of this set-up is that entrepreneurs found firms with a distinct managerial culture which is imprinted on them until they exit, so some firms are permanently “better” or “worse” managed. Over time, the low productivity firms are selected out and the better ones survive and prosper. There is some stochastic element to this, however, so in the steady state there will always be some dispersion of productivity.
Identifying the permanent productivity advantage in this model as “managerial quality” is consistent with the tradition in the panel data econometric literature. Indeed, Mundlak’s (1961) introduction of the original fixed effects panel data model was designed to control for this unmeasured managerial ability (the title of his paper was “Empirical Production Function Free of Management Bias”). Rather than just treat this as a nuisance parameter, however, more recent attempts have tried to measure management directly.
Imperfect competition is one obvious ingredient for these models. With imperfect competition firms can have differential efficiency and still survive in equilibrium. With perfect competition inefficient firms should be rapidly driven out of the market as the more efficient firms undercut them on price. In Syverson (2004b), for example, there is horizontal product differentiation based on transport costs so firms have local market power. He shows theoretically and empirically that increases in competition will increase average productivity by reducing the mass of less productive plants in an area.
Another important element is “frictions”. Costs of adjustment are ubiquitous in capital investment and have usually been found for labor, especially skilled labor (see Bond and Van Reenen, 2007 and Bloom, 2009, for surveys). Thus, firms facing asymmetric shocks will adjust differentially to their new conditions only slowly over time even if they all have identical adjustment cost technologies. In such an environment, low TFP firms will not immediately vanish as there is an option value to remaining active in the sector. The Melitz model could be regarded as a limiting case of introducing frictions where the TFP draw cannot be altered over time by say investing in improving management. The managerial factor is “trapped” as there is no direct market for it as it cannot be transferred between firms. When the firm exits, so does the productivity advantage—entrepreneurs take a new draw if they enter again. In reality, adjustment costs can take more general forms and are likely to be important as management practices and organizational forms can adjust.
The management quality measures in Bloom and Van Reenen (2007) can be interpreted as the permanent draw from the productivity distribution when firms are born. Alternatively, it may reflect that some individuals have superior managerial skill and can maintain a larger span of control as in Lucas (1978). A drawback of the Lucas and Melitz approaches is the assumption that management capacities are static and nontransferable. More generally management practices can be allowed to evolve over time through investments in training, consultancy etc. The “organizational capital” approach allows for this (see Prescott and Visscher, 1980; Atkeson and Kehoe, 2005; Corrado et al., 2006).
A common feature of these models is that management is partially like a technology, so there are distinctly good (and bad) practices that would raise (or lower) productivity. We believe that this is an important element in management quality, and the traditional models that seek to understand technological diffusion (e.g. Hall, 2003) are relevant for understanding the spread of managerial techniques.
4.2.3 “Behavioral” explanations of management
None of the exposition of the Managerial Technology perspective has relied on any “Behavioral economics”, in the sense of non-optimizing agents. Ofcourse, one potential explanation for the non adoption of seemingly profitable HRM practices could be behaviorally based. One line of the literature focuses on managerial over-confidence, in which managers are excessively optimistic about their own abilities and the investment returns of their firms. In the case of HRM they may believe their current policies are optimal and so no changes are needed. The other focuses on managerial faults like procrastination towards undertaking profitable activities, so they may believe they need to adopt more modern HRM practices but repeatedly defer actually doing this.
Managerial overconfidence
This builds on the well known result from the psychology literature showing routine overconfidence in individuals over their abilities. For example, Svenson (1981) showed that 82% of students placed their driving ability in the top 30%. Exacerbating this is attribution bias, whereby managers attribute good performance to their own ability, despite this often being due to luck, leading to more senior managers to become increasing overconfident. Since senior managers often have few peers to correct them, this type of over-confidence can persist. Malmendier and Tate (2005) show that overconfident managers—defined as those who hold excessively high portfolios of their company’s shares (failing to diversify)—undertake excessively high investments that are less profitable on average, less well regarded by stock-markets and more internally financed22.
Procrastination
Another literature has pointed out the procrastination—or failure to take known optimal actions—by individuals and managers. For example, Duflo et al. (2009) show how Kenyan maize farmers do not use fertilizer despite returns of over 100% to the investment, unless they are provided with some form of commitment mechanism like advanced buying of the fertilizer. Similarly, Conley and Udry (2010) show how pineapple farmers in Ghana also under-use fertilizer in their farms, again despite having the resources to purchase this and without any superior savings mechanism. This type of behavior is certainly not limited to developing countries—for example, Choi et al. (2008) show that many employees of US firms are directly losing money from not making investments in 401K plans which have matching top-ups by employers and permit instant withdrawal.
In all cases the behavior is irrational from a standard optimizing framework in that agents are aware of utility maximizing actions but do not take them. One framework for explaining these actions goes back to O’Donoghue and Rabin (1999), who propose a model in which agents are present-biased and as least partially naïve, systematically underestimating the odds they will be impatient in the future. Hence, agents defer taking improving actions today under the belief they will take them in future, but never do. As a result agents repeatedly procrastinate on taking profitable actions, like introducing modern HRM practices into their firms.
4.3 The two perspectives: summary
In the Design approach firms at every point are choosing their optimal set of management practices and no firm is more efficient than another based on these. In management science, “contingency theory” (e.g. Woodward, 1958) is akin to this. Any coherent theory of management has firms choosing different practices in different environments, so there will always be some element of contingency. For example, Bloom and Van Reenen (2007) show that firms appear to specialize more in investing in “people management” (practices over promotion, rewards, hiring and firing) when they operate in a more skill-intensive industry. If we examine the relative scores by country for monitoring and target setting practices compared to people management, the US, India and China have the largest relative advantage in people management, and Japan, Sweden and Germany the largest relative advantage in monitoring and target setting management. The systematic difference in the relative scores of different types of management across countries also suggests that there may be some specialization in areas of comparative advantage, perhaps due to labor market regulation. Figure 4.1 shows some evidence for this. The cross country differences in people management are related to the degree of labor market regulation (lightly regulated countries such as the US and Canada do better than heavily regulated countries such as France, Brazil and Greece).
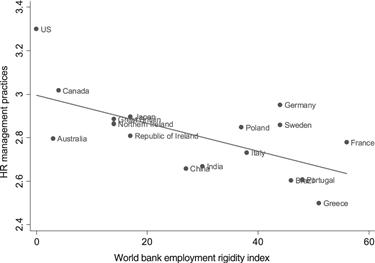
Figure 4.1 Labor market regulation and HR management practices. Notes: World Bank indexfrom the Doing Business database, http://www.doingbusiness.org/ExploreTopics/EmployingWorkers/. (Source: Bloom et al. (2009b))
The interesting question is whether there really are any “universals”, i.e. some practices that would be unambiguously better for the majority of firms? If this is so, why are these firms not adopting them? The answer to this question is identical to that of the adoption of any new technology—there are costs to adoption in the form of information, incentives, regulatory constraints, externalities, etc. These will vary somewhat by time and place and we turn to some of these factors next.
5 Some determinants of hrm practices
Given the dispersion in HRM practices and productivity outlined in Section 2 we naturally turn to the question of why such variations exist. The large span of theories and empirical work makes it impossible to discuss all areas of the determinants of HRM, so we focus on some key themes: insurance, competition, ownership and work organization.
5.1 Insurance and incentive pay
One of the most basic features of performance pay from the design perspective is the incentive vs. insurance trade-off. A first best contract could be written on effort, but the essence of the principal agent problem is that the agent’s effort is not perfectly observable. An obvious way to solve the principal agent problem is for the principal to sell the firm to the agent whose incentives would then be aligned with value maximization. This does sometimes happen in market stalls and some other contexts, but it is the exception in the modern economy.
A fundamental reason for this is that individuals are more risk averse than firms. A flat salary provides insurance to an employee because when the firm experiences a negative shock his wage will remain constant (assuming that he is not laid off). Consider a contract that is partially base salary and partially tied to a measure of employee output (a signal of effort). The observable measure of worker output is a function of effort and stochastic factors: these might be measurement error in the signal or truly exogenous shocks to output. The greater the variance of the noise relative to the signal, the greater is the risk that the employee is forced to bear. Thus, in order to attract the employee to supply his labor to the firm (the participation constraint), the lower will be the weight attached to the employee’s measured output in the optimal contract. Thus, there is a trade-off between insurance and incentives.
Prendergast (1999) analyzed this in detail and lamented that the evidence here did not really give great support to the basic insurance-incentive trade off. For example, Garen (1994) examines the degree to which CEO compensation is linked to performance (the “β “ in a linear contract). The relationship between β and the noisiness of performance measures should be negative, but appeared to be statistically zero in his data. Brown (1990), examining a wider range of occupations, also finds little relationship between incentive pay and the riskiness of the environment.
Prendergast (2000, 2002a,b) looks at this evidence in more detail and offers several possible explanations. In Prendergast (2002a) risky environments will be ones where the manager’s private information is more valuable. This is because the uncertainty in this environment will make it much more likely that the agent knows what the “right” thing is to do rather than the principal. In such circumstances delegating decisions to the agent become more attractive. In other words, the increased cost of incentive pay in terms of lower insurance to an employee in a risky environment has also to be set against the higher value of employee’s information. Thus, uncertain environments increase the value of giving more decision rights to employees, which will increase the probability of incentive pay even though the insurance mechanism leans in the opposite way. Prendergast (2002a) hypothesizes that because the degree of delegation is hard to control for at the same time as environmental uncertainty, this is why the effects of uncertainty on incentive pay have been empirically ambiguous.
Prendergast’s point is a specific example of a more general principle in terms of the incentives to decentralize when it is hard for the principal to learn about the “right action” in a noisy environment. We describe this model in more detail in Section 5.4 below and show that there is string of empirical evidence that more uncertain/heterogeneous environments do cause greater decentralization as Prendergast suggests (Acemoglu et al., 2007). Whether this resolves the empirical problem of insurance vs. incentive pay is still unclear, however23.
5.2 Product market competition
From the “management technology” perspective, it is clearer why competition has a positive effect on best practice HRM. Adam Smith, for example, wrote that “Monopoly... is a great enemy to good management.”24 Higher product market competition, as indexed by say an increase in consumer price sensitivity, will tend to drive the less productive firms out of the market. Firms that have failed to adopt better HR management practices will tend to exit, so this should improve the HR management quality and productivity in the average firm. To the extent that incentive pay and some of the other Bloom and Van Reenen HR practices really do increase productivity, the time series trends identified in Section 2 might be due to increases in global competition caused by deregulation and globalization.
Effort to improve managerial practices may also increase through incentive effects on incumbent firms. Schmidt (1997) formalizes the intuition that tougher competition will bring the interests of the managerial agent more into line with the firm’s owners. In his model, managers have borrowing constraints, so lose wealth when their firm goes bankrupt. High levels of competition increase bankruptcy risk and increase managerial effort.
Theoretically, however, the effects of competition on the form of incentive pay is ambiguous from the design perspective. The analysis in Vives (2008) is very useful, as he shows that higher powered incentives can be considered in some respects as an investment in non-tournament R&D. The firm invests in an HR system that has a fixed cost but lowers marginal costs as the improved management increases productivity of all factors. Consider again an increase in consumer price sensitivity as an index of product market competition. The “stakes” are now higher: through greater managerial effort a firm can reduce marginal costs and this will have a larger effect on relative market share or relative profitability than when competition is lower. On the other hand, higher competition means that profits are lower in the industry, so any given performance contract will generate lower expected benefits because for a given effort level the profit related part of pay will be lower. This is the standard Schumpeterian reason for expecting lower innovative effort in high competition industries.
Vives (2008) shows that there are other forces at play when we allow endogenous entry and exit even for symmetric firms. In general, the average firm will be larger in equilibrium as the more intense competition induces exit, and the larger firms will have a greater incentive to introduce productivity increasing HR practices, with the fixed costs of introducing them over a large sales base. Thus, allowing for entry will tend to strengthen the positive effect of competition, as firms will in equilibrium be larger and so have higher sales to spread fixed costs.
What about the empirical evidence? The evidence from Fig. 2.4 suggested that HR management practices were better in the US, where competitive selection forces are likely to be very strong. More formally, we can look at the conditional correlation between the HR management score and indicators of competitive intensity. Whether measured by trade openness, the industry inverse Lerner Index or simply the number of perceived rivals, competition is robustly and positively associated with higher management practice scores both with and without firm fixed effects (see Bloom et al., 2009b). Note that the obvious endogeneity bias here is to underestimate the importance of competition, as better managed firms are likely to have higher profit margins, lower import penetration ratios and drive out their rivals25. Bloom et al. (2010c) use political competition as an instrumental variable to account for unusually high numbers of hospitals in some areas of the country in the UK public healthcare system (hospitals are rarely closed down in politically marginal constituencies). They find that the positive effects of competition grow stronger when endogeneity is taken explicitly into account.
Consistent with these general results on the positive association of competition on explicit measures of HR management, there is other evidence which also gets closer to causal effects when focusing explicitly on incentive pay. Guadalupe and Cunat (forthcoming) show that the pay-performance sensitivity for US CEOs is stronger when import competition is stronger (as measured by tariffs). Guadalupe and Cunat (2009) they show a similar result using US banking deregulation as an exogenous shift to competition. And in Guadalupe and Cunat (2005) they also find that the correlation between pay and firm performance (for UK workers and executives) strengthens with competition, using the exchange rate appreciation in 1996 which differentially affected traded and non-traded sectors.
5.3 Ownership and governance
The managerial technology perspective suggests that organizations with poor governance are less likely to use appropriate HR management techniques. In particular, there has been a lively debate on the performance effects of family firms (e.g. Bertrand and Schoar, 2006). Firms which are both family owned and family run (typically by the eldest son— primogeniture) are very common, especially in developing countries. Figure 5.1 plots the averages of the Bloom-Van Reenen HR management scores by ownership category. Firms that are family owned and family managed (“Family, family CEO”) tend to be badly managed on average, while the family owned but externally managed (“Family, external CEO”) look very similar to dispersed shareholders. Government-owned firms also have low management scores, while firms owned by Private Equity score well.
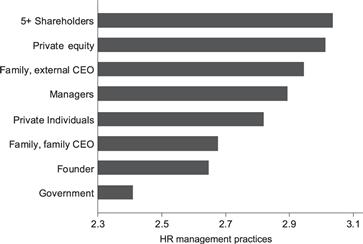
Figure 5.1 Ownership, governance and HR management. Note: Averages taken across a random sample of medium (100 to 5000 employee) manufacturing firms within each country. 5850 observations in total. (Source: Bloom et al. (2009b))
This finding is robust to more systematic controls for other covariates (see Bloom and Van Reenen (2007)). Family ownership per se is not correlated with worse HR management practices, it is when family ownership is combined with the CEO being chosen as the eldest son that the quality of management appears to be very poor. This is consistent with the idea that limiting the talent pool to a single individual is not the optimal form of CEO selection. It is also consistent with Perez-Gonzales (2006) and Bennesden et al. (2007), who find that inherited family control appears to cause worse performance. This result is strengthened by using the gender of the eldest child as an instrumental variable for family management, as families usually only relinquish control and bring in external managers when faced with a severe crisis.
Another dimension of ownership is whether the firm is domestic or multinational. Bloom et al. (2009b) found that there is a “pecking order” in management scores, with purely domestic firms at the bottom, firms that export but do not produce overseas next and multinational firms at the top26. This is broadly consistent with Helpman et al. (2004). In fact, multinational subsidiaries tend to have better HR management in every country (see Fig. 5.2), consistent with the idea that they can “transplant” some of their HR practices overseas. This is important, as it suggests that a mechanism for management practices to diffuse internationally is through the investments of overseas firms.
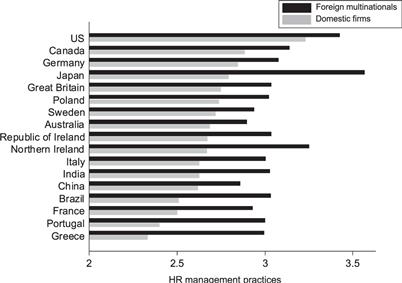
Figure 5.2 Multinationals take good HR management practices abroad. Note: Averages taken across a random sample of medium (100 to 5000 employee) manufacturing firms within each country. 5850 observations in total. (Source: Bloom et al. (2009b))
Some direct evidence on the importance of this mechanism is presented in Bloom et al. (2010a). As noted in Section 3.5 they found that US firms appear to be much more effective in using IT to improve their productivity, and this in turn is related to American firms’ greater use of modern HRM practices (incentive pay, careful hiring, rigorous appraisals and promotions, etc.). They show that the subsidiaries of US multinationals in Europe have higher IT productivity than comparable multinational affiliates, use more of these HRM practices and have higher productivity, primarily from their superior use of IT. The authors argue that the US advantage in HRM practices could account for about half of the faster productivity growth in the US (over Europe) post 1995.
5.4 Work organization: the example of decentralization
An important aspect of HRM is work design—how are roles ascribed to different jobs? In this sub-section we focus on one aspect of design which we label “decentralization”. For example, how many decision rights are delegated from the CEO to the plant manager? How much control over the pace of work is delegated from the plant manager to the production worker? This is perhaps the most widely studied theoretical aspect of the workplace after pay incentives and there is a smaller, but growing empirical literature.
Note that decentralization is different from managerial spans of control. These are distinct concepts as the span and depth (number of levels) of a hierarchy are compatible with different power relationships between the levels. Nevertheless there is some evidence that the move towards delayering over the last twenty years has been associated with decentralization (see Rajan and Wulf, 2006), and we will touch on this below.
5.4.1 Measurement of decentralization
A key factor in any organization is who makes the decisions? A centralized firm is one where these are all taken at the top of the hierarchy and a decentralized firm is where decision-making is more evenly dispersed throughout the hierarchy. An extreme case Multinationals take good HR management practices abroad. Note: Averages taken across a random sample of medium (100 to 5000 employee) manufacturing firms within each country. 5850 observations in total. (Source: Bloom et al. (2009b)) of decentralized organization is a market economy where atomistic individuals make all the decisions and spot contract with each other. The origin of many of the debates on decentralization has their origins in the 1930s over the relative merits of a market economy relative to a centrally planned one.
How can this concept be operationalized empirically? One way is to look at the organization charts of firms (“organogram”) as graphical representations of the formal authority structure. One of the best studies in this area is Rajan and Wulf(2006) who use the charts of over 300 large US corporations 1987–1998 to examine the evolution of organizations (e.g. how many people directly report to the CEO as a measure of the span of control). They find that the number of people reporting to the CEO has been rising over the period because intermediate managers—particularly the COO (Chief Operations Offices)—have been removed. Whether the lower levels have obtained more power because their immediate bosses (the COOs) have gone, or less power because they are now dealing directly with the CEOs is not so clear. What is clear is that these large US corporations have been delayering systematically over time by removing senior managerial layers, leading to more junior managers reporting directly in to the CEO. Hence, this highlights the differences between measuring organizational shape (the number of layers in an organization) and real power (where the actual decisions are made).
Observing whether a firm is decentralized into profit centers is useful, as this is a formal delegation of power—the head of such a business unit will be performance managed on profitability. If the firm is composed of cost (or revenue) centers this indicates less decentralization. If the firm does not even delegate responsibility at all, this is more centralized. Acemoglu et al. (2007, henceforth AALVZ) use this distinction.
Unfortunately, as Max Weber and (more recently) Aghion and Tirole (1997) stressed, formal authority is not the same as real authority as the company organogram may not reflect where real power lies. A criticism of AALVZ is that just using profit centers as an indicator is rather crude and a better way is directly survey the firms themselves. Bloom et al. (2009d) measure decentralization from the central headquarters (CHQ) to the plant manager over investment, hiring, marketing and product introduction, and combine these four indictors into one (mean-zero) decentralization index. As with management quality, decentralization displays considerable variation across firms. There is also a large difference across countries as shown in Fig. 5.3. Interestingly, the US, UK and Northern European countries are the most decentralized and Southern Europe and the Asian countries the most centralized.
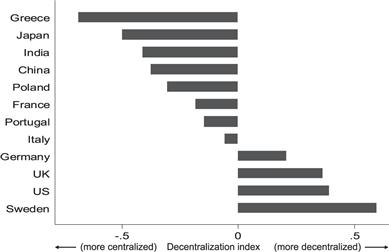
Figure 5.3 Decentralization of firm decision making by country. Note: High (positive) scores means plant managers have more autonomy of plant level investment, hiring, new products and marketing from the corporate head-quarters. Low (negative) scores means plant managers have little autonomy and mainly follow instructions from their corporate head-quarters. Averages taken across a random sample of medium (100 to 5000 employee) manufacturing firms within each country. 5850 observations in total. (Source: Bloom et al. (2009a))
5.4.2 Theories of decentralization
The basic trade off in the decentralization decisions is between the efficient use of local information (see Radner, 1993) favoring delegation and the principal-agent problem where the agent has weaker incentives to maximize the value of the firm than the principal (on the trade-off see Aghion and Tirole, 1997).
The benefits from decentralization arise from at least three sources. First, decentralizing decision-making reduces the costs of information transfer and communication. In a hierarchical organization, information that has been processed at lower levels of the hierarchy has to be transferred upstream. This induces a cost due to the need that information be codified and then received and analyzed at various levels (Bolton and Dewatripont, 1994). When decision-making is decentralized, information is processed at the level where it is used so that the cost of communication is lower. Second, decentralization increases firms’ speed of response to market changes (Thesmar and Thoenig, 1999). One reason for this is that hierarchical organizations are characterized by a high degree of specialization of workers. Any response to market changes involves the coordination of a great number of activities so that overall firm’s reaction speed is low. When responsibility is transferred downstream, it is most often delegated to teams of workers, generally involved in multi-tasking. This allows a swifter reaction to market changes given that coordination involves a limited number of multi-skilled workers. Finally, decentralization of decision-making may increase productivity through rising job satisfaction. Delegation of responsibility goes along with more employee involvement, greater information sharing and a greater participation of lower level staff.
Turning to the costs of decentralization, we highlight four of them. First, costs arise from the risk of duplication of information in the absence of centralized management. Workers are now in charge of analyzing new pieces of information. With decentralization the risk of replication in information processing increases, both across individuals and across teams. A related risk is that of an increase in the occurrence of “mistakes” as there is less co-ordination. A second standard cost is the loss of co-ordination efficiencies as externalities between units are not internalized (e.g. plants producing substitutable products will tend to price too low)—see Alonso et al. (2008) for a general discussion. A third cost is that decentralization makes it more difficult to exploit returns to scale (Thesmar and Thoenig, 2000). The reason for this is that as multi-tasking develops returns to specialization decreases so that large-scale production becomes less beneficial. Finally, decentralization may reduce workers’ efficiency if the increase in responsibility that it implies induces rising stress (Askenazy, 2001). In this case, productivity may be directly affected and/or reduced through lower job satisfaction.
5.4.3 What influences decentralization?
We divide our analysis into the examination of three groups of factors that influence decentralization: technological (complexity, ICT and heterogeneity), economic (human capital and competition) and cultural.
Complexity
Some basic factors determine decentralization. All else equal a larger firm will require more decentralization than a small firm. A sole entrepreneur does not need to delegate because he is his own boss, but as more workers are added, doing everything by himself is no longer feasible. Penrose (1959) and Chandler (1962) stressed that decentralization was a necessary feature of larger firms, because CEOs do not have the time to take every decision in large firms. Similarly as firms expand in their scope both geographically and in product space, local information will become more costly to transmit so this will also favor decentralization. Bloom et al. (2009d) find that larger firms and plants owned by foreign multinationals are significantly more likely to be decentralized. This is likely to be because of increased complexity27.
Information and communication technology
Garicano (2000) formalizes the idea of the firm as a cognitive hierarchy. There are a number of problems to be solved and the task is how to solve them in the most efficient manner. The simplest tasks are performed by those at the lowest level of the hierarchy and the “exceptional” problems are passed upwards to an expert. The cost of passing problems upwards is that communication costs are non-trivial. The benefit of passing the problem upwards is that it economizes on the cognitive burden of lower level employees.
This framework was designed to address the impacts of ICT. Interestingly, information technologies have different implications for decentralization than communication technologies. Consider again the decentralization decision between the central headquarters and plant manager. When communication costs fall through (for example) the introduction of a company intranet, it is cheaper for the plant manager to refer more decisions to the corporate officers. So communication technologies should cause centralization. By contrast, technologies that make it easier for the plant manager to acquire information (e.g. Enterprise Resource Planning software, ERP like SAP) means that decentralization should increase. An example in law firms would be Lexus Nexus that enables junior lawyers to quickly find relevant cases without consulting a more senior associate or partner.
Bloom et al. (2009e) test this theory and find considerable empirical support. Computer networks (reducing communication costs) significantly increase centralization, whereas tools to help managers access more information significantly increase decentralization. The magnitude of the effect is substantial. An increase in the use of Enterprise Resource Planning usage by 60% (the average difference in ICT between Europe and the US) is associated with an increase of the index of their plant manager’s autonomy index by 0.025, which is equivalent to a large increase in the supply of human capital (roughly the same as the increase in US college graduates between 1990 and 2000). The finding that information technology is a complement with a particular form of HRM (decentralization) is consistent the productivity evidence discussed in Section 3.5.
Heterogeneity
AALVZ present a model of decentralization in which firms learn about how to implement a new technology from other firms in their industry. The new technology on average improves productivity, but there is heterogeneity in the benefits from introducing it, so not all firms should do things in the same way. The set-up is of a principal (central headquarters) deciding whether or not to delegate to a local agent (plant manager) who is better informed about the technology but has imperfectly aligned incentives. As more firms experiment with the technology in the same industry the principal has a better public history of information about the right way to implement the new technology, so has less need to decentralize to the agent.
One key result follows: the greater the heterogeneity of the industry the more decentralized will be the average firm. Heterogeneity here means that “right” way to implement the technology has a larger variance, so the opportunity to learn from other firms is circumscribed because what is good for my neighbor is less likely to be what is good for me. As discussed earlier, this is akin to Prendergast (2002a)—the more uncertain the environment the greater the relative value of local knowledge. Two other implications are that, first, the more innovative the technology (i.e. closer to the frontier), the less will be known about how to use it so the greater will be the likelihood of decentralization. Second, if a firm can learn from its past experience, older firms will be less likely to delegate than younger firms.
AALVZ measure decentralization using both formal measures of whether firms are organized into profit centers and “real” survey measures of the power managers have over hiring decisions. Their results are illustrated in Fig. 5.4, where Panel A shows there is a positive relationship between decentralization and heterogeneity28, Panel B shows decentralization is higher among firms closer to the technological frontier, and Panel C shows older firms appear more centralized than younger firms. These are all consistent with the theory.
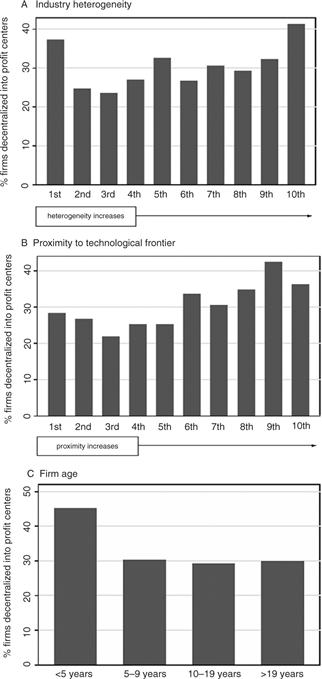
Figure 5.4 Factors associated with decentralization. Notes: Decentralization defined in terms of percentage of firms that are profit centers (rather than cost centers). Data from 3570 firms in French COI national survey. (Source: Acemoglu et al. (2007))
Human capital
One of the reasons for the renewed interest in organizational change by labor economists was the attempt to understand why technology seemed to increase the demand for human capital, and thus contribute to the rise in wage inequality experiences by the US, UK and other countries since the late 1970s (e.g. Machin and Van Reenen, 1998, 2008). Many theories have been proposed (see Autor et al., 2003, for a review), but one hypothesis is that lower IT prices increased decentralization incentives for the reasons outlined in Garicano (2000)’s model discussed above. Further, decentralization could be complementary with skills because more educated workers are better able to analyze and synthesize new pieces of knowledge so that the benefits of the local processing of information are enhanced. Second, the cost of training them for multi-tasking is lower and they are more autonomous and less likely to make mistakes.
This has three main implications: (i) Decentralization leads to skill upgrading within firms. This is due to the fact that the return to new work practices is greater when the skill level of the workforce is higher; (ii) a lower price of skilled labor relative to unskilled labor will accelerate decentralization; (iii) skill intensive firms will experience greater productivity growth when decentralizing.
Caroli and Van Reenen (2001) find support for all three predictions. They estimate production functions (with the relevant interactions), skill share equations and organizational design equations. A novel feature of this approach is that because labor is traded in a market, it is possible to use local skill price variation to examine the complementarity issues. They find that higher skill prices make decentralization less likely, consistent with “skill biased organizational change”29.
Product Market Competition
If competition has made swift decisions more important then this will have increased the salience of local knowledge, leading to greater decentralization under the framework discussed above. Similarly if competition reduces the agency problem then decentralization is more likely. There are countervailing forces however. For example, a larger number of firms help learning, which in the AALVZ framework will reduce the need to decentralize.
The empirical evidence is clearer cut. Bloom et al. (2010b) find a robust positive association between competition and decentralization. A similar positive correlation was reported in AALVZ and Marin and Verdier (2008). All of these are cross sectional studies. Guadalupe and Wulf (forthcoming) use the Rajan and Wulf (2006) panel data on the changing organizational structure of firms over time. They argue that the Canadian-US Free Trade Agreement in 1989 constitutes an exogenous increase in competition for US firms in the industries where tariffs were removed. Exploiting this policy experiment they find that competition is associated with delayering (increasing span for CEO) and that this is likely to also reflect increased delegation.
Culture
In recent years, economists have started to take cultural factors more seriously in determining economic outcomes (e.g. Guiso et al., 2006; Greif, 1994). Part of this is due to the influence of Putnam (1993) on the importance of social capital and the finding that trust is important in a number of economic dimensions (e.g. see Knack and Keefer, 1997, on economic growth or Guiso et al., 2009, on foreign trade).
Trust is an obvious candidate from improving delegation incentives as it will relieve the agency problem that the delegated agent will steal from the principal. Bloom et al. (2009d) observe more delegation in countries where rule of law is strong. However, contracts are never perfectly enforceable and this leaves a role for trust to help generate more delegation. And indeed trust also appears important—they also find a higher level of trust in the region where a firm is located is associated with a significantly greater degree of decentralization. They also exploit the fact that they have many subsidiaries of multinational firms so they can construct measures of trust in the country of origin (the multinational’s headquarters) and location (country were affiliate is set up), and find that both of these seem to matter for decentralization. Further, using the bilateral trust between countries they find that when trust between pairs of countries is high, decentralization is more likely (even after controlling for region of location and country of origin fixed effects). This suggests that trust can affect the structures of global firms and that some aspects of organization are transplanted abroad, as suggested by recent theories of international trade.
6 Conclusions
Human Resource Management (HRM) has changed dramatically in the last two decades, with Personnel Economics now a major field in labor economics. The mark of this work is to use standard economic tools applied to the special circumstances of managing labor within companies. In surveying the literature we have detected several broad themes:
First, although there have been significant improvements in measuring management in general and HRM in particular, we are struck by the scarcity of high quality data. This is especially true in the time series dimension, where our basic understanding of trends, even in the more easily measured dimensions of HRM such as incentive pay, is remarkably poor. This reflects a general paucity of data on the internal structures of firms which needs to be addressed by researchers and statistical agencies.
Second, data concerns notwithstanding, there do appear to be some facts emerging. There is a discernible trend towards the incidence of more incentive pay in recent decades (at least in the US and the UK). More aggressive use of high powered-incentives on pay, promotions, hiring and firing is more prevalent in the US and Northern Europe than Southern Europe and Asia. The data on productivity is much better: we have shown wide distributions of productivity within and between countries and HRM appears to mirror these patterns.
Third, there is suggestive evidence that certain types of HRM raise productivity. There is certainly a robust positive cross sectional association between bundles of “modern” HRM practices and productivity, but with some exceptions (e.g. Ichniowski et al., 1997) these are not robust in the time series dimension. Studies of single or small groups of firms have been more successful in identifying a positive association of changes in HRM policies (in particular individual and group incentive pay) and productivity. But hard causal evidence of the type common in program evaluation elsewhere in labor economics is rare, and a major future research challenge is to generate better designs to test the causal relationship.
Fourth, causality issue apart, there is suggestive evidence of widespread complementarities both between different types of HRM practices and between HRM and other aspects of firm organization (Milgrom and Roberts, 1990). Information and Communication Technology appears particularly important, with several pieces of evidence that combining ICT with the right fit of HRM practices makes a large difference for productivity.
Fifth, although the “Design” perspective of Personal Economics has led to powerful insights, we have argued that some types of HRM (and management in general) has technological aspects in the sense that they are likely to raise profitability in a firm, on average, are likely to be the right ones for all firms to adopt. Under this view, the productivity dispersion we observe is partially linked to the fact that some firms that been slower to adopt these than others. Weak competition and poor governance in family run firms are both associated with sub-optimal HRM practices, consistent with this “Managerial Technology” perspective.
Finally, we have made substantial theoretical and empirical progress in one aspect of work organization—the decentralization of decisions. Technological complexity, ICT, skill supply and social capital all seem to foster more decentralization (although causality remains an issue again). It would be good to see more efforts to drill down on other forms of work organization.
HRM and productivity is an exciting and lively field and has made great strides in the last two decades. We see its future as being integrated in the general research programs of the economics of organization and management, which are becoming a major part of modern labor economics.
Acknowledgements
We would like to thank the Economic and Social Research Council for their financial support through the Center for Economic Performance. This survey draws substantially on joint work with Daron Acemoglu, Philippe Aghion, Eve Caroli, Luis Garicano, Christos Genakos, Claire Lelarge, Ralf Martin, Raffaella Sadun and Fabrizio Zilibotti. We would like to thank Orley Ashenfelter, Oriana Bandiera, Alex Bryson, David Card, Edward Lazear, Paul Oyer, John Roberts, Kathy Shaw and participants in conferences in Berkeley and the LSE for helpful comments.
References
1. Abowd John M. The effect of wage bargains on the stock market value of the firm. American Economic Review. 1989;79(4):774–800.
2. Abowd John M, Kramarz Francis, Margolis David. High wage workers and high wage firms. Econometrica. 1999;67(2):251–333.
3. Abowd John M, Lemieux Thomas. The effects of product market competition on collective bargaining agreements: the case of foreign competition in Canada. Quarterly Journal of Economics. 1993;108(4):983–1014.
4. Abowd John H, Haltiwanger John, Lane Julia. Wage structure and labor mobility in the United States. In: Lazear Edward, Shaw Kathryn, eds. An International Comparison of the Structure of Wages within and Across Firms. Chicago: University of Chicago; 2008.
5. Acemoglu Daron, Aghion Philippe, Lelarge Claire, Van Reenen John, Zilibotti Fabrizio. Technology, information and the decentralization of the firm. Quarterly Journal of Economics. 2007;122(4):1759–1799.
6. Ackerberg Daniel, Benkard Lanier, Berry Steven, Pakes Ariel. Econometric tools for analyzing market outcomes. In: Heckman James, Leamer Edward, eds. Handbook of Econometrics. Amsterdam: North-Holland; 2007; vol. 6A.
7. Ackerberg Daniel, Botticini Maristella. Endogenous matching and the empirical determinants of contract form. Journal of Political Economy. 2002;110:564–591.
8. Adams Christopher. Agent discretion, adverse selection and the risk-incentive trade-off. Federal Trade Commission: Working Paper; 2005.
9. Aggarwal Rajesh K, Samwick Andrew A. The other side of the trade-off: the impact of risk on executive compensation. Journal of Political Economy. 1999;107(1):65–105.
10. Aghion Philippe, Tirole Jean. Formal and real authority in organizations. Journal of Political Economy. 1997;105(1):1–29.
11. Alonso Ricardo, Dessein Wouter, Matouschek Niko. When does coordination require centralization? American Economic Review. 2008;98(1):145–179.
12. Asch Beth. Do incentives matter? the case of navy recruiters. Industrial and Labor Relations Review. 1990;43(3):89–107.
13. Askenazy Philippe. Innovative workplace practices and occupational injuries and illnesses in the United States. Economic and Industrial Democracy. 2001;22(4):485–516.
14. Athey, Susan, Stern, Scott, 1998. An empirical framework for testing theories about complementarity in organizational design. NBER Working Paper 6600.
15. Atkeson Andrew, Kehoe Patrick J. Modeling and measuring organization capital. Journal of Political Economy. 2005;113(5):1026–1053.
16. Autor David, Levy Frank, Murnane Richard. The skill content of recent technological change: an empirical exploration. Quarterly Journal of Economics. 2003;118(4):1279–1334.
17. Aw Bee Yan, Roberts Mark J, Xu Daniel. R&D Investments, exporting, and the evolution of firm productivity. American Economic Review. 2008;98(2):451–456.
18. Baily Martin, Hulten Charles, Campbell David. Productivity dynamics in manufacturing plants. Brookings Papers on Economic Activity, Microeconomics 1992;187–249.
19. Baiker Katherine, Jacobson Mireille. Finders keepers: for feiture laws, policing, and local budgets. Journal of Public Economics. 2007;91(11—12):2113–2136.
20. Baker George. Incentive measures and performance measurement. Journal of Political Economy. 1992;100:598–614.
21. Baker George, Gibbons Robert, Murphy Kevin. Subjective performance measures in optimal incentive contracts. Quarterly Journal of Economics. 1994;109:1125–1156.
22. Baker George, Hubbard Thomas. Contractibility and asset ownership: on board computers and governance in US trucking. Quarterly Journal of Economics. 2004;119(4):1443–1479.
23. Bandiera Oriana, Barankay Iwan, Rasul Imran. Social preferences and the response to incentives:evidence from personnel data. Quarterly Journal of Economics. 2005;120(3):917–962.
24. Bandiera Oriana, Barankay Iwan, Rasul Imran. Incentives for managers and inequality among workers: evidence from a firm-level experiment. Quarterly Journal of Economics 2007.
25. Bandiera Oriana, Barankay Iwan, Rasul Imran. Social connections and incentives in the workplace:evidence from personnel data. Econometrica. 2009a;77:1047–1094.
26. Bandiera Oriana, Barankay Iwan, Rasul Imran. Team incentives: evidence from a field experiment. LSE mimeo 2009b.
27. Bandiera Oriana, Guiso Luigi, Prat Andrea, Sadun Raffaella. Matching firms, managers and incentives. LSE mimeo 2010.
28. Bartel Ann, Ichniowski Casey, Shaw Kathryn. How does information technology really affect productivity? Plant-level comparisons of product innovation, process improvement and worker skills. Quarterly Journal of Economics. 2007;122(4):1721–1758.
29. Bartelsman Eric, Dhrymes Phoebus. Productivity dynamics US manufacturing plants 1972–1986. Journal of Productivity Analysis. 1998;9(1):5–33.
30. Bartelsman Eric, Doms Mark. Understanding productivity: lessons from longitudinal microdata. Journal of Economic Literature. 2000;38(3):569–594.
31. Bartelsman Eric, Haltiwanger John, Scarpetta Stefano. Cross country differences in productivity: the role of allocative efficiency. University of Maryland mimeo 2008.
32. Bennesden Morten, Nielsen Kasper, Perez-Gonzales Francisco, Wolfenzon Daniel. Inside the family firm: the role of families in succession decisions and performance. Quarterly Journal of Economics. 2007;122(2):647–691.
33. Bertrand Marianne, Schoar Antoinette. The role of family in family firms. Journal of Economic Perspectives. 2006;20(2):73–96.
34. Black Sandra, Lynch Lisa. What’s driving the new economy? The benefits of workplace innovation. Economic Journal. 2004;114(493):97–116.
35. Black Sandra, Lynch Lisa. How to compete: the impact of workplace practices and information technology on productivity. Review of Economics and Statistics. 2001;83(3):434–445.
36. Blanchflower David, Oswald Andrew, Sanfrey Peter. Wages, profits and rent sharing. Quarterly Journal of Economics. 1996;111(1):227–251.
37. Blasi Joseph, Freeman Richard, Mackin Christopher, Kruse Douglas. Creating a bigger pie? The effects of employee ownership, profit sharing, and stock options on workplace performance. In: Kruse Douglas, Blasi Joseph, Freeman Richard, eds. Shared Capitalism at Work: Employee Ownership, Profit and Gain Sharing, and Broad-based Stock Options. University of Chicago Press 2009.
38. Bloom N. The impact of uncertainty shocks. Econometrica. 2009;77(3):623–685.
39. Bloom Nick, Van Reenen John. Measuring and explaining management practices across firms and countries. Quarterly Journal of Economics. 2007;122(4):1341–1408.
40. Bloom N, Eifert B, Mahajan A, McKenzie D, Roberts J. Does management matter: evidence from India. Stanford mimeo 2009a;.
41. Bloom Nick, Genakos Christos, Sadun Raffaella, Van Reenen John. Does Management Matter? New empirics and old theory. LSE/Stanford mimeo 2009b.
42. Bloom Nick, Kretschmer Tobias, Van Reenen John. Work-life balance, management practices and productivity. In: Freeman Richard, Shaw Kathy, eds. International Differences in the Business Practice and Productivity of Firms. Chicago: University of Chicago Press; 2009c.
43. Bloom, Nick, Sadun, Raffaella, Van Reenen, John, 2009d. The organization of firms across countries. Centre for Economic Performance Discussion Paper No 937.
44. Bloom, Nick, Garicano, Luis, Sadun, Raffaella, Van Reenen, John, 2009e. The distinct effects of information technology and communication technology on firm organization. Centre for Economic Performance Discussion Paper No. 927.
45. Bloom, Nick, Sadun, Raffaella, Van Reenen, John, 2010a. Americans do IT better: American multinationals and the productivity miracle. LSE/Stanford mimeo (revision of NBER Working Paper 13085). American Economic Review (forthcoming).
46. Bloom Nick, Sadun Raffaella, Van Reenen John. Does product market competition lead firms to decentralize? American Economic Review Papers and Proceedings. 2010b;100:434–438.
47. Bloom, Nick, Propper, Carol, Seiler, Stephan, Van Reenen, John, 2010c. The impact of competition on management quality: evidence from public hospitals. Centre for Economic Performance Discussion Paper 983.
48. Bolton Patrick, Dewatripont Mathias. The firm as a communication network. Quarterly Journal of Economics. 1994;109(4):809–839.
49. Bolton Patrick, Dewatripont Mathias. Contract Theory. Cambridge: MIT Press; 2005.
50. Boning Brent, Ichniowski Casey, Shaw Kathryn. Opportunity counts: teams and the effectiveness of production incentives. Journal of Labor Economics. 2007;25(4):613–650.
51. Blundell Richard, Costa-Diaz Monica. Alternative approaches to evaluation in empirical microeconomics. Journal of Human Resources. 2009;44(3):565–640.
52. Micro-econometric models of investment and employment. In: Heckman, James, Leamer, Edward (Eds.), Handbook of Econometrics, vol. 6A. pp. 4417–4498 (Chapter 65).
53. Bresnahan Timothy, Brynjolfsson Erik, Hitt Lorin. Information technology, workplace organization and the demand for skilled labor: firm-level evidence. Quarterly Journal of Economics. 2002;117(1):339–376.
54. Brown Charles. Firms’ choice of method of pay. Industrial and Labor Relations Review. 1990;43:165–182.
55. Bruhn M, Karlan D, Schoar A. The effect of mentorship on SME growth in Mexico. mimeo: University of Chicago; 2010.
56. Brynjolfsson Erik, Hitt Lorin. Computing productivity: firm-level evidence. Review of Economics and Statistics. 2003;85(4):793–808.
57. Bryson Alex, Freeman Richard. Work and wellbeing. National Institute Economic Review. 2009;209:70–71.
58. Bryson Alex, Wood Stephen. High involvement management. In: Brown W, Bryson Alex, Forth John, Whitfield K, eds. The Evolution of the Modern Workplace. Cambridge: Cambridge University Press; 2009.
59. Bull Clive. The existence of self-enforcing implicit contracts. Quarterly Journal of Economics. 1987;102(1):147–159.
60. Burgess Simon, Propper Carol, Ratto Marisa, von Hinke Vanessa, Scholder Kessler, Tominey Emma. Smarter task assignment or greater effort: the impact of incentives on team performance. Economic Journal 2007.
61. Capelli Peter, Neumark David. Do ‘high-performance’ work practices improve establishment-level outcomes? Industrial and Labor Relations Review. 2001;54(4):737–775.
62. Caroli Eve, Van Reenen John. Skill biased organizational change. Quarterly Journal of Economics. 2001;116(4):1449–1492.
63. Caselli Francesco. Accounting for cross country income differences. In: Aghion Philppe, Durlauf S, eds. Handbook of Economic Growth. North-Holland: Elsevier; 2005.
64. Cahuc Pierre, Postel-Vinay Fabienne, Robin Jean-Marc. Wage bargaining and on-the-job search. Econometrica 2006;323–364.
65. Chandler Alfred. Strategy and Structure: Chapters in the History of the Industrial Enterprise. Cambridge: MIT Press; 1962.
66. Chevalier Judith, Ellison Glenn. Risk taking by mutual funds as a response to incentives. Journal of Political Economy. 1997;105(6):1167–1200.
67. Choi, James, Laibson, David, Madrian, Brigitte, 2008. $100 Bills on the sidewalk: suboptimal investment in 401 (k) Plans. NBER Working Paper #11554.
68. Cristiner Annalisa, Leoni Riccardo, Sandrine Labory, Gai Alessandro. New work practices in Italy Adoption and performance effects. mimeo: University of Bergamo; 2001.
69. Colombo Massimo, Delmastro Marco. Delegation of authority in business organizations: an empirical test. Journal of Industrial Economics. 2004;52(1):53–80.
70. Conley Timothy G, Udry Christophe. Learning about a new technology: pineapple in Ghana. American Economic Review. 2010;100(1):35–69.
71. Cooke William. Employee participation programs, group-based incentives, and company performance: a union-nonunion comparison. Industrial and Labor Relations Review. 1994;47(4):594–609.
72. Corrado, C., Hulten, C., Sichel, D., 2006. Intangible capital and economic growth. NBER Working Paper No. 11948.
73. Courty Pascal, Marschke Gerald. An empirical investigation of gaming responses to performance incentives. Journal of Labor Economics. 2004;22(1):23–56.
74. Criscuolo Chiara, Haskel Jonathan, Martin Ralf. Building the evidence base for productivity policy using business data linking. Economic Trends. 2003;600:39–51.
75. Duflo Esther, Kremer Michael, Robinson Jonathan. Nudging farmers to use fertilizer: theory and experimental evidence from Kenya. Harvard mimeo 2009.
76. Dearden Lorraine, Reed Howard, Van Reenen John. Training and corporate productivity: evidence from a panel of UK industries. Oxford Bulletin of Economic and Social Research. 2006;68(4):397–421.
77. DeVaro Jed, Kurtulus Fidan A. An empirical analysis of risk, incentives, and the delegation of worker authority. University of Massachusetts at Amherst: Working Paper; 2007.
78. DiNardo John, Lee David. Economic impacts of new unionization on private sector employers:1984—2001. Quarterly Journal of Economics. 2004;119:1383–1441.
79. DiNardo John, Lee David. Program evaluation and research designs. In: Card David, ed. Handbook of Labor Economics. Elsevier 2011;463–536. vol. 4a.
80. Dunne Timothy, Foster Lucia, Haltiwanger John, Troske Kenneth. Wage and productivity dispersion in US manufacturing: the role of computer investments. Journal of Labour Economics. 2004;22(2):397–429.
81. Easton George, Jarrell Sherry. The effects of total quality management on corporate performance:an empirical investigation. Journal of Business. 1998;71(2):253–307.
82. Edmans Alex, Gabaix Xavier, Landier Augustin. A multiplicative model of optimal CEO incentives in market equilibrium. Review of Financial Studies 2008.
83. Faggio, Giulia, Salvanes, Kjell, Van Reenen, John, 2007. The evolution of inequality in productivity and wages: panel data evidence. Centre for Economic Performance Discussion Paper No. 821.
84. Fernie Sue, Metcalf David. It’s not what you pay it’s the way that you pay it and that’s what gets results: jockeys’ pay and performance. Labour. 1999;13(2):385–411.
85. Foster Lucia, Krizan CJ, Haltiwanger John. Market selection, reallocation and restructuring in the US retail trade sector in the 1990s. Review of Economics and Statistics. 2006;88(4):748–758.
86. Foster Lucia, Haltiwanger John, Syverson Chad. Reallocation, firm turnover and efficiency: selection on productivity or profitability. American Economic Review. 2009;98(1):394–425.
87. Foster Andrew, Rosenzweig Mark. Comparative advantage, information and the allocation of workers to tasks: evidence from an agricultural labor market. Review of Economic Studies. 1996;63(3):347–374.
88. Freeman Richard, Kleiner Morris. The last American shoe manufacturers: decreasing productivity and increasing profits in the shift from piece rates to continuous flow production. Journal of Industrial Relations. 2005;44(2):307–330.
89. Freeman Richard, Medoff James. What Do Unions Do? New York: Basic Books; 1984.
90. Gant Jon, Ichniowski Casey, Shaw Kathryn. Social capital and organizational change in high-involvement and traditional work organizations. Journal of Economics & Management Strategy. 2002;11(2):289–328.
91. Garicano Luis. Hierarchies and the organization of knowledge in production. Journal of Political Economy. 2000;108(5):874–904.
92. Gibbons Robert. Piece-rate incentive schemes. Journal of Labor Economics. 1987;5(4):413–429.
93. Gibbons Robert, Roberts J. The Handbook of Organizational Economics. Princeton (forthcoming): Princeton University Press; 2009.
94. Gibbons Robert, Waldman Michael. Careers in organizations: theory and evidence. In: Ashenfel-ter Orley C, Card David, eds. Handbook of Labor Economics. Amsterdam: North Holland; 1999; vol. III.
95. Gibrat Robert. Les Inegalites Economiques. Paris: Sirey; 1931.
96. Garen John. Executive compensation and principal-agent theory. Journal of Political Economy. 1994;102(6):1175–1199.
97. Gaynor Martin, Rebitzer James, Taylor Lowell. Physician incentives in health maintenance organizations. Journal of Political Economy. 2004;112:915–931.
98. Glewwe, Paul, Ilias, Nauman, Kremer, Michael, 2003. Teacher incentives. NBER Working Paper 9671.
99. Greif Avner. Cultural beliefs and the organization of society: a historical and theoretical reflection on collectivist and individualistic societies. Journal of Political Economy. 1994;102(5):912–950.
100. Griffith Rachel, Neely Andrew. Incentives and managerial experience in multi-task teams: evidence from within a firm. Journal of Labor Economics. 2009;27(1):49–82.
101. Griliches Zvi. The discovery of the residual: a historical note. Journal of Economic Literature. 1996;34(3):1324–1330.
102. Groves Theodore, Hong Yongmiao, McMillan John, Naughton Barry. Autonomy and incentives in Chinese state enterprises. Quarterly Journal of Economics. 1994;109:183–209.
103. Guadalupe Maria, Cunat Vicente. How does product market competition shape incentive contracts? Journal of the European Economic Association MIT Press. 2005;3(5):1058–1082.
104. Guadalupe Maria, Cunat Vicente. Globalization and the provision of incentives inside the firm. Journal of Labor Economics 2009.
105. Guadalupe Maria, Cunat Vicente. Executive compensation and competition in the banking and financial sectors. Journal of Banking and Finance. 2009;33:439–474.
106. Guadalupe Maria, Wulf Julie. The flattening firm and product market competition: the effects of trade costs and liberalization. American Economic Journal: Applied 2007.
107. Guiso Luigi, Sapienza Paola, Zingales Luigi. Does culture affect economic outcomes? The Journal of Economic Perspectives. 2006;20(2):23–48.
108. Guiso Luigi, Sapienza Paola, Zingales Luigi. Cultural biases in economic exchange. Quarterly Journal of Economics. 2009;124(3):1095–1131.
109. Hall Bronwyn. Innovation and diffusion. In: Fagerberg Jan, Mowery Davis, Nelson Richard, eds. Handbook of Innovation. Oxford: Oxford University Press; 2003.
110. Hamilton Barton H, Nickerson Jack A, Owan Hideo. Team incentives and worker heterogeneity: an empirical analysis of the impact of teams on productivity and participation. Journal of Political Economy. 2003;111(3):465–497.
111. Hellerstein Judith, Neumark David, Troske Ken. Wages, productivity and worker characteristics:evidence from plant level production functions and wage equations. Journal of Labor Economics. 1999;17:409–446.
112. Helpman Elhanhan, Melitz Marc, Yeaple Stephen. Export versus FDI with heterogeneous firms. American Economic Review. 2004;94(1):300–316.
113. Holmstrom Bengt, Milgrom Paul. Multitask principal-agent analyses: incentive contracts, asset ownership, and job design. Journal of Law, Economics, and Organization. 1991;7:24–52.
114. Hopenhayn Hugo. Entry, exit, and firm dynamics in long run equilibrium. Econometrica. 1992;60:1127–1150.
115. Hsieh, Chang-Tai, Klenow, Peter, 2007. Misallocation and manufacturing TFP in China and India. NBER Working Paper 13290.
116. Huselid Mark. The impact of human resource management practices on turnover, productivity and corporate financial performance. Academy of Management Journal. 1995;38:635–672.
117. Huselid Mark, Becker Brian. Methodological issues in cross-sectional and panel estimates of the human resource-firm performance link. Industrial Relations. 1996;35:400–422.
118. Ichniowski, Casey, 1990. Human resource management systems and the performance of US manufacturing businesses. NBER Working Paper 3449.
119. Ichniowski Casey, Shaw Kathryn, Prennushi Giovanna. The effects of human resource management practices on productivity: a study of steel finishing lines. American Economic Review. 1997;87(3):291–313.
120. Jones Derek, Kato Takao. The productivity effects of employee stock ownership plans and bonuses:evidence from Japanese panel data. American Economic Review. 1995;85(3):391–414.
121. Jorgenson Dale, Ho Mun, Stiroh Kevin. A retrospective look at the US productivity growth resurgence. Journal of Economic Perspectives. 2008;22(1):3–24.
122. Karlan Dean, Valdivia Martin. Teaching entrepreneurship: impact of business training on microfinance clients and institutions. Yale mimeo 2009.
123. Kastl Jacob, Martimort David, Piccolo Salvatore. Delegation and R&D incentives: theory and evidence from Italy. Stanford mimeo 2008.
124. Kahn Charles, Silva Emilson, Ziliak James. Performance-based wages in tax collection: the Brazilian tax collection reform and its effects. Economic Journal. 2001;111(468):188–205.
125. Keane Michael, Feinberg Susan. Advances in logistics and the growth of intra-firm trade: the case of Canadian affiliates of US multinationals. Journal of Industrial Economics. 2008;LV(4):571–632.
126. Klette Tor, Griliches Zvi. The inconsistency of common scale estimators when output prices are unobserved and endogenous. Journal of Applied Econometrics. 1996;11:343–361.
127. Knack Stephen, Keefer Philip. Does social capital have an economy payoff? A cross-country investigation Quarterly Journal of Economics. 1997;12(4):1251–1288.
128. Knez Marc, Simester Duncan. Firm-wide incentives and mutual monitoring at Continental Airlines. Journal of Labor Economics. 2001;19(4):743–772.
129. Kruse Douglas, Blasi Joseph. Employee ownership, employee attitudes, and firm performance. In: Mitchell Daniel JB, Lewin David, Zaidi Mahumdad, eds. Handbook of Resource Management. Greenwich, CT: JAI; 1997.
130. Kruse Douglas, Blasi Joseph, Park Rhokuen. Shared capitalism in the US economy: prevalence, characteristics, and employee views of financial participation in enterprises. In: Kruse Douglas, Blasi Joseph, Freeman Richard, eds. Shared Capitalism at Work: Employee Ownership, Profit and Gain Sharing, and Broad-based Stock Options. University of Chicago Press 2009.
131. Kwoka John, Ravenscraft David. Cooperation versus rivalry: price-cost margins by line of business. Economica. 1986;53:351–364.
132. Lafontaine Francine, Srinivasan Jagadeesh. Within firm labor productivity across countries: a case study. In: Freeman Richard, Shaw Katheryn, eds. International Differences in Business Practices and Productivity of Multinational Firms: A Case Based Approach. University of Chicago Press 2009.
133. Larkin Ian. The cost of high-powered incentives: employee gaming in enterprise software sales. Harvard University: Working Paper; 2007.
134. Lavy Victor. Evaluating the effect of teachers’ performance incentives on pupils’ achievement. Journal of Political Economy. 2002;110(6):1283–1317.
135. Lavy Victor. Using performance-based pay to improve the quality of teachers. The Future of Children. 2007;7(1):87–109.
136. Lavy Victor. Performance pay and teachers’ effort, productivity and grading ethics. American Economic Review. 2009;99(5):1979–2011.
137. Lawler Edward, Mohrman Susan, Ledford Jr. Gerald E. Creating High Performance Organizations: Practices and Results of Employee Involvement and TQM in Fortune 1000 Companies. San Francisco: Jossey-Bass; 1995.
138. Lawler Edward, Mohrman Susan, Benson George. Organizing for High Performance: Employee Involvement, TQM, Reengineering, and Knowledge Management in the Fortune 1000. San Francisco: Jossey-Bass; 2001.
139. Lawler Edward, Mohrman Susan. Creating a Strategic Human Resources Organization: An Assessment of Trends and New Directions. Stanford University Press 2003.
140. Lazear E. Salaries and piece rates. Journal of Business. 1986;9(3):405–431.
141. Lazear Edward. Pay equality and industrial politics. Journal of Political Economy. 1989;97:561–580.
142. Lazear Edward. Personnel economics: past lessons and future directions. Journal of Labor Economics. 1999;17(2):199–236.
143. Lazear Edward. Performance pay and productivity. American Economic Review. 2000;90(5):1346–1361.
144. Lazear Edward, Oyer Paul. Personnel economics. In: Gibbons E, Roberts DJ, eds. Handbook of Organizational Economics. Princeton: Princeton University Press; 2009; (forthcoming).
145. Lazear Edward, Shaw Kathryn. An International Comparison of the Structure of Wages within and across Firms. University of Chicago 2008.
146. Lemieux Thomas, MacLeod W Bentley, Parent Daniel. Performance pay and wage inequalitysuper. Quarterly Journal of Economics. 2009;124(1):1–49.
147. Lucas Robert. On the size distribution of business firms. Bell Journal of Economics. 1978;9:508–523.
148. Machin Stephen, Van Reenen John. Technology and changes in the skill structure: evidence from seven OECD countries. Quarterly Journal of Economics CXI. 1998;4(113):1215–1244.
149. Machin Stephen, Van Reenen John. Changes in wage inequality. In: Weinberg Bruce, Taber Chris, eds. New Palgrave Dictionary of Economics. 2008.
150. MacLeod W Bentley. On optimal contracting with subjective evaluation. American Economic Review. 2003;93(1):216–240.
151. MacLeod W Bentley, Malcomson James M. Implicit contracts, inventive compatibility, and involuntary unemployment. Econometrica. 1989;57(2):447–480.
152. Malcomson James. Individual employment contracts. In: Ashenfelter Orley C, Card David, eds. Handbook of Labor Economics. Amsterdam: North Holland; 1999; vol. III.
153. Marin Dalia, Verdier Thierry. Corporate hierarchies and the size of nations: theory and evidence. Paris School of Economics mimeo 2008.
154. Mas Alexandre, Moretti Enrico. Peers at work. American Economic Review. 2008;99(1):112–145.
155. MacDuffie John. Human resource bundles and manufacturing performance: organizational logic and flexible production systems in the world auto industry. Industrial and Labor Relations Review. 1995;48(2):197–221.
156. Malmendier Ulrike, Tate Geoffrey. Does overconfidence affect corporate investment? CEO overconfidence measures revisited (with G. Tate) European Financial Management. 2005;11(5):649–659.
157. Melitz Mark. The impact of trade on intra-industry reallocations and aggregate industry productivity. Econometrica. 2003;71(6):1695–1725.
158. Milgrom Paul, Roberts John. An economic approach to influence activities in organizations. American Journal of Sociology. 1988;94(Suppl.):S154–S179.
159. Milgrom Paul, Roberts John. The economics of modern manufacturing: technology, strategy, and organization. American Economic Review. 1990;80(3):511–528.
160. Moretti Enrico. Workers’ education, spillovers and productivity: evidence from plant level production functions. American Economic Review. 2004;94:656–690.
161. Mundlak Yair. Empirical production function free of management bias. Journal of Farm Economics. 1961;43:44–56.
162. Murphy Kevin. Executive compensation. In: Ashenfelter Orley C, Card David, eds. Handbook of Labor Economics. Amsterdam: North Holland; 1999; vol. III.
163. Nickell Steve, Nicolistsas D, Patterson M. Does doing badly encourage innovation? Oxford Bulletin of Economics and Statistics. 2001;63(1):5–28.
164. O’Donoghue Ted, Rabin Matthew. Doing it now or doing it later. American Economic Review. 1999;89(1):103–124.
165. Olley Steven, Pakes Ariel. The dynamics of productivity in the telecommunications equipment industry. Econometrica. 1996;64(6):1263–1298.
166. Osterman Paul. How common is workplace transformation and who adopts it? Industrial and Labor Relations Review. 1994;47(2):173–188.
167. Osterman Paul. The wage effects of high performance work organizations in manufacturing. Industrial and Labor Relations Review. 2006;59(2):187–204.
168. Oxera, 2007. Tax-advantaged employee share schemes: analysis of productivity effects. HM Revenue and Customs Research Report No. 33.
169. Oyer Paul. Fiscal year ends and nonlinear incentive contracts: the effect on business seasonality. Quarterly Journal of Economics. 1998;113(1):149–185.
170. Oyer Paul, Schaefer Scott. Personal economics: hiring and incentives. Stanford mimeo 2010.
171. Pavcnik Nina. Trade liberalization, exit, and productivity improvement: evidence from Chilean plants. Review of Economic Studies. 2002;69:245–276.
172. Pendleton Andrew, Whitfield Keith, Bryson Alex. The changing use of contingent pay in the modern British workplace. In: Brown William, Bryson Alex, Forth John, Whitfield. Keith, eds. The Evolution of the Modern Workplace. Cambridge University Press 2009.
173. Penrose Edith. Theory of the Growth of the Firm. New York: J. Wiley & Sons; 1959.
174. Perez-Gonzales Francisco. Inherited control and firm performance. American Economic Review. 2006;96(5):1559–1588.
175. Postel-Vinay Fabienne, Robin Jean-Marc. Equilibrium search with heterogeneous workers and firms. Econometrica. 2002;70:1295–1350.
176. Prendergast Canice. What happens within firms? A survey of empirical evidence on compensation policies. Journal of Economic Literature. 1999;37:7–63.
177. Prendergast Canice. What trade-off of risk and incentives? American Economic Review. 2000;90(2):421–425.
178. Prendergast Canice. The tenuous trade-off between risk and incentives. Journal of Political Economy. 2002a;110(5):1071–1102.
179. Prendergast Canice. Uncertainty and incentives. Journal of Labor Economics. 2002b;20(2):S115–S137.
180. Prendergast Canice, Topel Robert. Favoritism in organizations. Journal of Political Economy. 1996;104(5):958–978.
181. Prentice Graham, Burgess Simon, Propper Carol. Performance-pay in the public sector: a review of the issues and evidence. Office of Manpower Economics 2007.
182. Prescott Edward, Visscher Michael. Organization capital. Journal of Political Economy. 1980;88(3):446–461.
183. Putnam Robert. Making Democracy Work: Civic Traditions in Modern Italy. Princeton, NJ: Princeton University Press; 1993.
184. Radner Roy. The organization of decentralized information processing. Econometrica. 1993;61(5):1109–1146.
185. Rajan Raghuram, Wulf Julie. The flattening firm: evidence from panel data on the changing nature of corporate hierarchies. Review of Economics and Statistics. 2006;88(4):759–773.
186. Salter WG. Productivity and Technical Change. Cambridge: Cambridge University Press; 1960.
187. Schmidt K. Managerial incentives and product market competition. Review of Economic Studies. 1997;64(2):191–213.
188. Schmitz James. What determines productivity? Lessons from the dramatic recovery of the US and Canadian iron ore industries following their early 1980s crisis. Journal of Political Economy. 2005;113(3):582–625.
189. Shaw K. Insider econometrics: a roadmap with stops along the way. Labor Economics 2009.
190. Shearer Bruce. Piece rates, fixed wages and incentives: evidence from a field experiment. Review of Economic Studies. 2004;71(2):513–534.
191. Stiroh Kevin. Reassessing the role of IT in the production function: a meta analysis. Federal Reserve Bank of New York mimeo 2004.
192. Svenson Ola. Are we all less risky and more skillful than our fellow drivers? Acta Psychologica. 1981;47:143–148.
193. Syverson Chad. Product substitutability and productivity dispersion. Review of Economics and Statistics. 2004a;86(2):534–550.
194. Syverson Chad. Market structure and productivity: a concrete example. Journal of Political Economy. 2004b;112(6):1181–1222.
195. Syverson. What determines productivity. Journal of Economic Literature 2010.
196. Thesmar David, Thoenig Mathias. From flexibility to insecurity: how vertical separation amplifies firm-level uncertainty. Journal of the European Economic Association. 1999;5(6):1161–1202.
197. Thesmar David, Thoenig Mathias. Creative destruction and organization change. The Quarterly Journal of Economics. 2000;115(4):1201–1237.
198. Van Biesebroeck Johannes. Complementarities in automobile production. Journal of Applied Econometrics. 2007;22:1315–1345.
199. Van Reenen John. The creation and capture of economic rents: wages and innovation in a panel of UK companies. Quarterly Journal of Economics. 1996;CXI(443):195–226.
200. Vives Xavier. Innovation and competitive pressure. Journal of Industrial Economics. 2008;56(3):419–469.
201. Walker Francis A. The source of business profits. Quarterly Journal of Economics. 1887;1(3):265–288.
202. Weitzman Martin, Kruse Douglas. Profit sharing and productivity. In: Blinder A, ed. Paying for Productivity: A Look at the Evidence. Washington, DC: The Brookings Institution; 1990.
203. Wulf Julie. Authority, risk and performance incentives: evidence from division manager positions insider firms. Journal of Industrial Economics. 2007;LV(1):169–186.
204. Woodward J. Management and Technology. Cambridge: Cambridge University Press; 1958.
1Overtime is removed, but the question is imperfect pre-1993 which could lead to undercounting performance pay.
2The difference is somewhat surprising as it suggests that performance pay jobs only pay out infrequently, which does not comply with casual observation (e.g. piece rates will almost always pay something). This may be because of measurement error where an individual has received an in-year bonus but does not state this. By looking over a longer period on the same “performance payjob”, a more accurate figure is recorded.
3The problem with the Lawler surveys is that the sampling frame is only larger companies compared to the more representative individual level PSID. Furthermore, the response rate to the survey has declined rapidly from over 50% in 1987 to only 15% by 1999. This poses a serious concern that the time series trends are not representative even of larger firms.
4Abowd (1989) looks at unexpected changes to wages and finds that shareholders wealth falls by an equal and opposite amount. He interprets this as consistent with strongly efficient bargaining over the rents between unions and firms.
5This is analogous to the historical debate in the macro time series of productivity between Solow, who claimed that TFP was a large component of aggregate growth and various critics who claimed that there was little role for TFP when all inputs were properly measured (see Griliches, 1996). A similar debate is active in “levels accounting” of cross-country TFP (e.g. Caselli, 2005).
6There is also a significant effect of such policy changes on the productivity of incumbent firms. Modeling the changing incentives to invest in productivity enhancing activities, such as R&D, is more difficult in heterogeneous firm models, but some recent progress has been made (e. g. Aw et al., 2008).
7Foster et al. (2009) show that measured revenue TFP will in general be correlated with true TFP but also with the firm specific price shocks. Hsieh and Klenow (2007) detail a model where heterogeneous TFPQ produces no difference in TFPR because the more productive firms grow larger and have lower prices, thus equalizing TFPR. In their model intra-industry variation in TFPR is due to distortions as firms face different input prices.
8Walker was an important character in the early years of the economics discipline as the founding president of the American Economics Association, the second president of MIT, and the Director of the 1870 Economic Census.
9Examining the branches of a multinational firm across different countries is an attractive strategy—e.g. Lafontaine and Srinivasan (2009).
10For example see Gaynor et al. (2004), Groves et al. (1994) and Fernie and Metcalf (1999).
11On employee ownership see Kruse and Blasi (1997). On profit-sharing and gain-sharing see Weitzman and Kruse (1990).
1210 of the 13 studies of profit related pay were positive and 7 out of the 10 studies of share ownership.
13The study does not control for capital inputs or fixed effects, although some of the other studies do.
14Knez and Simester (2001) also found productivity increases following the promise of a company-wide bonus for improvements in on-time takeoffs in Continental Airways.
15Much of the remuneration of many financial workers, such as traders is based on an annual bonus. Since this can never be less than zero it may encourage excessively risky positions.
16Holmstrom and Milgrom (1991) have a similar finding in the context of a multi-tasking model where incentive contracts can cause agents to under or over invest sub-optimally in different tasks. This could explain the well-known phenomenon of “teaching to the test”. This what led performance related pay to increase productivity but reduce productivity in Freeman and Kleiner (2005), as workers measured increased output of shoes but at the expense of unmeasured quality.
17For example see Baker et al. (1994), Bull (1987) and MacLeod and Malcomson (1989).
18This may be a reason why some firms commit to promoting based on seniority rather than subjective assessments of performance.
19MacLeod (2003) shows how this will act as a multiplier effect on discrimination, making the discriminated group suffer further from lower effort.
20Chevalier and Ellison (1997) show that calendar year non-linearities lead to persistent distortions for mutual fund managers risk profiles. These are not chosen by the firm, however. We have even personally exploited year end incentives to buy cheap data in the past by agreeing with a salesman that he can choose each year which quarter we buy data from him (so he can use this to hit a quarterly target he would otherwise narrowly miss) in return for a 50% reduction in price.
21Hard technological advances have also facilitated managerial innovations such as Just in Time. Keane and Feinberg (2008) stress the importance of these improved logistics for the growth of intra-firm trade between the US and Canada
22Likewise the Bloom and Van Reenen (2007) survey asked managers the question “Excluding yourself, please score your firms management practices on a scale of 1 to 10, where 1 is worst practice, 10 is best practice and 5 is average”. The average response from managers was 7.1, and was correlated at only 0.035 with each firm’s actual labor productivity. This suggests that to the extent that managers are reporting their self assessment accurately, they are substantially over rating their managerial ability, and also struggling to benchmark this against their actual management ability.
23There have been attempts to combine information on delegation and incentive pay (e.g. Adams, 2005 and DeVaro and Kurtulus, 2007, but both incentive pay and delegation are exogenous variables so some additional exogenous variation is needed to be conclusive. Wulf (2007) finds that, for managers at the same level, incentive pay is less prevalent when there is more volatility. More recent work has found some support for the incentives-risk trade off by gathering more direct measures of risk aversion (Bandiera et al., 2010) or modeling the matching process between principals and agents (Ackerberg and Botticini, 2002).
24The Wealth of Nations, Book I Chapter XI Part I, p. 148.
25There is a literature examining how incentive pay contracts can be used as commitment devices to tougher competition (e.g. Aggarwal and Samwick, 1999). They find evidence of lower pay-performance sensitivity in firms with more volatile stock prices.
26Osterman (1994) also finds that firms who sell in international markets are more likely to have adopted an “innovative work practice (teams, job rotation, TQM or Quality Circles).
27Colombo and Delmastro (2004) also find that complexity related variables are associated with decentralization in their Italian firms.
28The authors show that the anomalous first decile is due to the disproportionate number of older and less productive firms in this decile (this is controlled for in the regressions). Kastl et al. (2008) also find more innovative firms (as measured by R&D intensity) are more decentralized.
29Bloom et al. (2009d) also find robust empirical evidence that firms with more skilled employees are more decentralized. Bartel et al. (2007) also find human capital complementary with “innovative” HR practices.