
4.2.1 Infections
Insofar as specific health shocks are considered, infections are the most commonly studied. In epidemiology, long-term health effects of infections—and the inflammation response they trigger—has been explored extensively, e.g. Crimmins and Finch (2006). Outcomes analyzed by economists include height, health status, educational attainment, test scores, and labor market outcomes. The estimated impacts tend to be large. Using geographic differences in hookworm infection rates across the US South, Bleakley (2007) found that eradication after 1910 increased literacy rates but did not increase the amount of completed schooling, except for Black children. The literacy improvement was much larger among Blacks than Whites, and stronger among women then men. The return to education increased substantially, and Bleakley (2007) estimated that hookworm infection throughout childhood reduced wages in adulthood by as much as 40%. Case and Paxson (2009) focussed on reductions in US childhood mortality from typhoid, malaria, measles, influenza, and diarrhea during the first half of the 20th Century. They found that improvements in the disease environment in one’s state of birth were mirrored by improved cognitive performance at older ages, but like Bleakley (2007), this effect did not seem to operate through increased years of schooling. However, the estimated cognitive impacts in Case and Paxson (2009) were not robust to the inclusion of state-specific time trends in their models.
Chay et al. (2009) found that reduced exposure to pneumonia and diarrhea in early childhood among Blacks during the late 1960s raised subsequent AFQT and NAEP scores towards those of Whites. Changes in postneonatal mortality rates (dominated by infections) explained between 50% and 80% of the (large) reduction in the Black-White AFQT gap. Finally, Bozzoli et al. (forthcoming) highlight that in developing countries, high average mortality rates cause the selection effect of early childhood mortality to overwhelm the “scarring” effect. Thus, the positive relationship between early childhood health and subsequent human capital may be absent in analyses that do not account for selective attrition in high mortality settings.
4.2.2 Health status
Many of the studies reviewed in Table 5 investigate the link between health in childhood and future cognitive or labor market outcomes. These studies can be viewed as a subset of a broader literature asking whether income affects health, and how health affects income. For example, using cross-sectional US data, Case et al. (2002) find a striking relationship between family income and a child’s reported health status, which becomes stronger as children age. Their motivation for looking at children is that the child’s health is unlikely to have a large direct effect on family income, so that the direction of causality is relatively clear. Currie and Stabile (2003) investigate this relationship using Canadian panel data and argue that one reason the relationship between income and child health increases over time is that poorer children are subject to many more negative health shocks. In fact, in Canada, this is the dominant mechanism driving the relationship (which is not surprising given that all Canadian children have public health insurance so that gaps in treatment rates are small).14
The question we focus on here is how much poor health in childhood, in turn, affects future outcomes. One of the chief ambiguities in answering this question is what we mean by health in childhood. While it has become conventional to measure fetal health using birth weight (though there may be better measures, see Almond, Chay and Lee, 2005) there are a wide variety of different possible measures of child health, ranging from maternal reports about the child’s general health status through questions about diagnoses of specific chronic conditions, to the occurrence of “adverse events”.
Case and Paxson (2008a,b, 2010a,b) do not have a direct measure of child health, but argue that adult height is a good proxy for early child health. This is a useful observation given that most surveys of adults have no direct information on child health. Height at age 5 is affected by a range of early health shocks including fetal conditions, poor nutrition, and illness. In turn, height at age 5 is strongly predictive of adult height. And like birthweight, it is predictive of many shorter and longer range outcomes.
A second problem is that it is often unclear whether the ill health dates from a particular period (e.g. an injury) or whether it might reflect a continuing, perhaps a congenital, condition. For example, Smith (2009) uses data from the Panel Study of Income Dynamics which asked young adults a retrospective question about their health status before age 16. In models with sibling fixed effects, he finds that the sib with the worse health had significantly lower earnings, although educational attainment was not significantly affected. He also finds using data from the Health and Retirement Survey that reports of general poor health in childhood do tend to be correlated in the expected way with the presence of specific health conditions. However, it is not possible to ascertain that the negative effects are due to poor health at any particular “critical” window. Salm and Schunk (2008) attempt to deal with this problem using detailed health information from a medical examination of young German children entering school. In models with sibling fixed effects, they find a significant relationship between poor mental health and asthma on the one hand, and measures of cognitive functioning on the other. They control for the child’s birth weight in an effort to distinguish between the effects of health at birth and health after birth (though to the extent that birth weight is an imperfect measure of health at birth, it is possible that the other health measures partly capture congenital conditions).
Currie et al. (2010) use administrative data from the Canadian province of Manitoba’s public health insurance system to follow children from birth through young adulthood. Using information about all contacts with medical providers, they construct measures of whether children suffered injuries, asthma, mental health problems or other health problems at ages 0 to 3, 4 to 8, 9 to 13, and 14 to 18. It is interesting that even in a large sample, there were relatively few children with specific health problems other than injuries, asthma, or mental health problems, so that it was necessary to group the remaining problems together. They then look at the relationship between health at various ages, educational attainment, and use of social assistance as a young adult in sibling fixed effects models that also control flexibly for birth weight and for the presence of congenital anomalies. The results are perhaps surprising in view of the conceptual framework developed in Section 3. When entered by themselves, early childhood health conditions (at age 0–3 and at age 4–8) are predictive of future outcomes, conditional on health at birth. However, when early physical health conditions are entered along with later ones, generally only the later ones matter. This result suggests that physical health in early childhood affects future outcomes largely because it affects future health (i.e., subsequent health mediates the relationship), and not because there is a direct link between early physical health status and cognition. In contrast, mental health conditions at early ages seem to have significant negative effects on future outcomes even if there are no intermediate report of a mental health condition. This result suggests that common mental health problems such as Attention Deficit Hyperactivity Disorder (ADHD, also called Attention Deficit Disorder or ADD) or Conduct Disorders (i.e. disorders usually involving abnormal aggression and anti-social behavior) may impair the process of human capital accumulation even if they do not lead to diagnoses of mental health disorders in adulthood.
Several recent papers focus specifically on measures of mental health conditions. Currie and Stabile (2006) use questions similar to those on mental health “screeners” which were administered to large samples of children in the US and Canada in two national surveys. They find that children whose scores indicated mental health problems in 1994 had worse outcomes as of 2002–4 than siblings without such problems. They controlled for birth weight (among other variables) and estimated models with and without including children with diagnosed learning disabilities. In all specifications, they found negative effects of high ADHD scores on test scores on schooling attainment. Smith and Smith (2008) report similar results using data from the PSID which includes retrospective questions about mental health problems before age 16. Like Smith (2009) and Currie et al. (2010) they estimate models with sibling fixed effects, and find significant long term effects of mental health conditions which are much larger than those of physical health conditions. Vujic et al. (2008) focus on conduct disorders using a panel of Australian twins and find that conduct disorder before age 18 has strong negative effects on the probability of high school graduation as well as positive effects on the probability of criminal activity. None of these three papers focus specifically on measures of mental health conditions before age 5 but “externalizing” mental health conditions such as ADHD and Conduct Disorder typically manifest themselves at early ages. Finally, although they are conceptually distinct, many survey measures of mental health resemble measures of ”non-cognitive skills”. Hence, one might interpret evidence that non-cognitive skills in childhood are important determinants of future outcomes as further evidence of the importance of early mental health conditions (Blanden et al., 2006; Heckman and Rubinstein, 2001).
4.2.3 Home environment
The home is one of the most important environments affecting a young child and there is a vast literature in related disciplines investigating the relationship between different aspects of the home environment and child outcomes. We do not attempt to summarize this literature here, but pick three aspects that may be most salient: Maternal mental health and/or substance abuse, maternal employment, and child abuse/foster care (which may be considered to be an extreme result of bad parenting). Given the importance of child mental health and non-cognitive skills, it is interesting to ask how maternal mental health affects child outcomes? Frank and Meara (2009) examine this question using data from the National Longitudinal Survey of Youth. They include a rich set of control variables (mother’s cognitive test score, grandparent’s substance abuse, permanent income) and estimate models with mother fixed effects and models with propensity scores. Their estimates suggest large effects (relative to the effects of income) of contemporaneous maternal depression on the quality of the home environment and on children’s behavioral problems, but little effect on math and reading scores. Estimates of the effects of maternal substance abuse are mixed, which echoes the findings of Chatterji and Markowitz (2000) using the same data. Unfortunately, the authors are not able to look at the long term effects of maternal depression experienced by children aged 0 to 5 because the depression questions in the NLSY have been added only recently. As these panel data are extended in time, further investigation of this issue is warranted.
There is also a large literature, including some papers by economists, examining the effect of maternal employment at early ages on child outcomes. Much of this literature suffers from the lack of an appropriate conceptual framework. If we think of child outcomes being produced via some combination of inputs, then the important question is how maternal employment affects the inputs chosen? This will evidently depend on how much her employment income relaxes the household budget constraint, and the price and quality of the child care alternatives and other inputs that are available. Some of the literature on maternal employment seems to implicitly assume that the mother’s time is such an important and unique input that no purchased input can adequately replace it. This may possibly be the case but is a strong assumption. If the mother’s time is replaceable at some price, then one might expect maternal employment to have quite different effects on women with different levels of household income (moreover, mother’s time may not all be of equal quality, so that it is easier to replace some mother’s time than others with the market). This argument suggests that it is extremely important to consider explicitly the quality of the mother’s time inputs and the availability of potential substitute inputs in models of maternal employment, something that is difficult to do in most available data sets. Studies that rely on regression methods and propensity score matching (see Berger et al. (2005) and Ruhm (2004)) often find small negative effects of maternal employment (especially in the first year) on children’s cognitive development. However, two recent studies using variation in maternity leave provisions find that while more generous maternity leave policies are associated with increased maternal employment, there is little effect on children’s outcomes (Baker and Milligan, 2010; Dustmann and Schönberg, 2009). Dustmann and Schönberg (2009) have data that permit cohorts affected by expansions in German maternity leave laws to be followed for many years. They see no effect of maternal employment on educational attainment or wages.
Finally, there are a few papers examining the effects of child abuse/foster care on child outcomes. This is a difficult area to investigate because it is hard to imagine that abuse (or neglect) can be divorced from other characteristics of the household. Currie and Widom (2009) use data from a prospective longitudinal study in which abused children (the treatments) were matched to controls. After following these children until their mid 40s, they found that the abused children were less likely to be employed, had lower earnings, and fewer assets, and that these patterns were particularly pronounced among women. It is possible that these results are driven by unobserved differences between the treatments and controls, although focusing on various subsets of the data (e.g. children whose mothers were on welfare; children of single mothers) produced similar results. Currie and Tekin (2006) use data from the National Longitudinal Study of Adolescent Health to examine the effect of having been abused before age 7 on the propensity to commit crime. They find strong effects which are quite similar in OLS, sibling, and twin fixed effects models. It is possible that these results reflect a characteristic of an individual child (such as difficult temperament) which makes it both more likely that they will be abused and more likely that they will commit crime. However, controlling directly for measures of temperament and genetic endowments does not alter the results. The Doyle (2008) study of the effects of foster care on the marginal child is also summarized in Table 5.
4.2.4 Toxic exposures
Epidemiological studies of postnatal pollution exposure and infant mortality have yielded mixed results and many are likely to suffer from omitted variables bias. Currie and Neidell (2005) examine the effect of more recent (lower) levels of pollution on infant health, along with the role of specific pollutants in addition to particulates (only TSPs were measured during the time periods analyzed by Chay and Greenstone (2003a,b)). Using within-zip code variation in pollution levels, they find that a one unit reduction in carbon monoxide over the 1990s in California saved 18 infant lives per 100,000 live births. However, unlike Currie et al. (2009) they were unable to find any consistent evidence of pollution effects on health at birth, probably because of the crudeness of their measure of maternal location.
Reyes (2007) found large effects of banning leaded gasoline on crime in the US, but results were not robust to state-specific time trends despite a relatively long panel of statelevel lead measurements. Nilsson (2009) considered reductions in ambient lead levels in Sweden following the banning of lead in gasoline and measures possible exposures using the concentrations of lead in 1000 moss (bryophyte) collection sites that have been maintained by the Swedish environmental protection agency since the early 1970s. Nilsson (2009) found that early childhood exposure reduced human capital, as reflected by both grades and graduation rates. These effects persisted when comparisons were restricted within siblings, and were substantially larger for low-income families.
4.2.5 Summary re: long term effects of fetal and early childhood environment
The last 10 years have seen an upsurge of empirical work on the long-term effects of early childhood. As a result, much has been learned. We can state fairly definitively that at least some things that happen before age five have long-term consequences for health and human capital. Moreover, these effects are sufficiently large and general to shape outcomes at the population level. On balance, effects of fetal exposure tend to be somewhat larger than postnatal effects, but there are important exceptions. Mental health is a prime example. Mental health conditions and non-cognitive skills seem to have large, persistent effects independent of those captured by measures of child health at birth.
5 Empirical literature: policy responses
The evidence discussed above indicates that prenatal and early childhood often have a critical influence on later life outcomes. However, by itself this evidence says little about the effectiveness of remediation. Hence, this section discusses evidence about whether remediation in the zero to five period can be effective in shaping future outcomes. In so doing, we take a step away from explicit consideration of an early-childhood shock ug as in Section 2. Instead, we focus on the specific public policies that may be able to alter developmental trajectories, often in disadvantaged sub-populations. We begin with programs that raise income, and then move on to programs that target specific domains.
5.1 Income enhancement
In the model sketched above, there are many ways for poverty to affect child outcomes. Even with identical preferences, poorer parents will make different investment choices than richer ones. In particular, poor families will optimize at lower investment (and consumption) levels and thereby have children with lower health and human capital, other things equal. Further, poor parents may face different input prices for certain goods, or have access to different production technologies. Providing cash transfers addresses the budgetary problems without necessarily changing the production technology. Hence, it is of interest to see whether cash transfers, in and of themselves, can improve outcomes. It is however, remarkably difficult to find examples of policies that increase incomes without potentially having a direct effect on outcomes. For example, many studies of cash welfare programs have demonstrated that children who are or have been on welfare remain worse off on average than other children. This does not necessarily mean, however, that welfare has failed them. Without welfare, their situation might have been even worse. Berger et al. (2009) explore the relationship between family income, home environments, child mental health outcomes, and cognitive test scores using data from the Fragile Families and Child Well-being Study which follows a cohort of five thousand children born in several large US cities between 1998 and 2000. They show that all of the measures of the home environment they examine (which include measures of parenting skills as well as physical aspects of the home) are highly related to income and that controlling for these measures reduces the effects of income on outcomes considerably.
Levine and Zimmerman (2000) showed that children who spent time on welfare scored lower than other children on a range of tests, but that this difference disappeared when the test scores of their mothers were controlled for, suggesting that welfare had little effect either positive or negative. Similarly, Levine and Zimmerman (2000) argue that children of welfare mothers were more likely to grow up to be welfare mothers, mainly because of other characteristics of the household they grew up in.
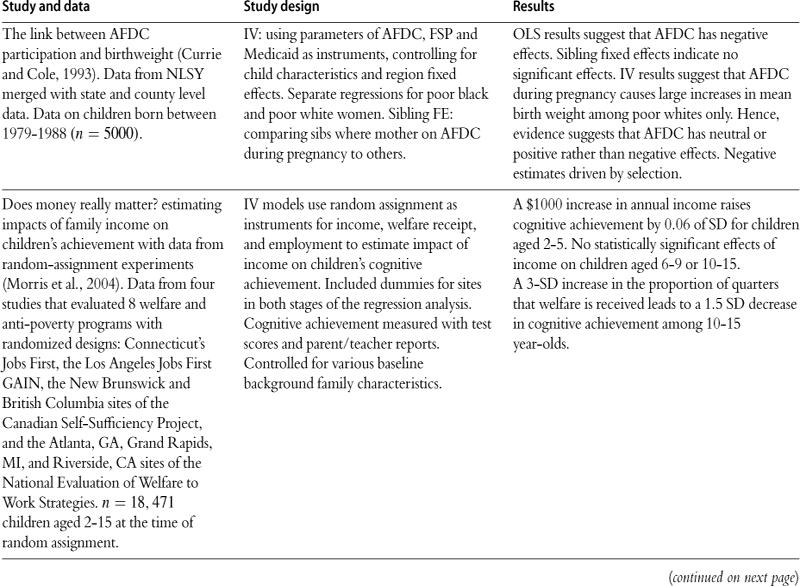
Currie and Cole (1993) compare siblings in families where the mother received welfare while one child was in utero, but not while the other child was in utero, and find no difference in the birth weight of the siblings. Given that research has shown little evidence of positive effects of cash welfare on children, it is not surprising that the literature evaluating welfare reform in the United States has produced similarly null findings. The National Research Council (Smolensky and Gootman, 2003) concluded that “no strong trends have emerged, either negative or positive, in indicators of parent well-being or child development across the years just preceding and following the implementation of [welfare reform]”. However, US welfare reform was a complex intervention that changed many parameters of daily life by, for example, imposing work requirements on recipients.
Conditional tax credits represent an alternative approach to providing income to poor families, and hence to poor children. The early years of the Clinton administration in the United States saw a huge expansion of the Earned Income Tax Credit (EITC), while in the UK, the Working Families Tax Credit approximately doubled in 1999. These are tax credits available to poor working families. Their essential feature is that they are “refundable”—in other words, a family whose credit exceeds its taxes receives the difference in cash. The tax credits are like welfare in that they give cash payments to poor families. But like welfare reform, the tax credits are a complex intervention in that recipients need to work and file tax returns in order to be eligible, and a great deal of research has shown that such tax credits affect maternal labor supply and marriage patterns (Eissa and Liebman, 1996; Meyer and Rosenbaum, 2001 ; Blundell, 2006). This is because the size of the payment increases with earnings up to a maximum level before being phased out, so that it creates an incentive to work among the poorest households but a work disincentive for households in the phase-out range. In the US, the number of recipients grew from 12.5 million families in 1990 to 19.8 million in 2003, and the maximum credit grew from $953 to $4204. The rapid expansion of this formerly obscure program run through the tax system has resulted in cash transfers to low-income families that were much larger than those that were available under welfare. Gundersen and Ziliak (2004) estimate that the EITC accounted for half of the reduction in after-tax poverty that occurred over the 1990s (the other halfbeing mainly accounted for by strong economic growth).
Table 6 provides an overview of some of the research on the effects of income on children. Dahl and Lochner (2005) use variation in the amount of the EITC households are eligible for over time and household type to identify the effects of household income and find that each $1000 of income improves childrens’ test scores by 0.02% to 0.04% of a standard deviation. An attractive feature of the changes in the EITC is that households may well have regarded them as permanent, so this experiment may approximate the effects of changes in permanent rather than transitory income. Their result implies, though, that it would take on the order of a $10,000 transfer to having an educationally meaningful effect on test scores.
Table 6
Effects of income on birth and early childhood outcomes: evidence from the US and around the world.
Unless otherwise noted, only results significant at 5% level are reported.
Percent changes (denoted by % instead of ”pp”) are reported relative to the mean, if means were reported in the paper. “T” = Treatment group, “C” = Control group.
Outcomes written as “T > C” mean that treatment outcome greater than control outcome at 5% significance level.
Outcomes written as “T = C” mean that there is no statistically significant difference in outcomes between 2 groups at 5% level.
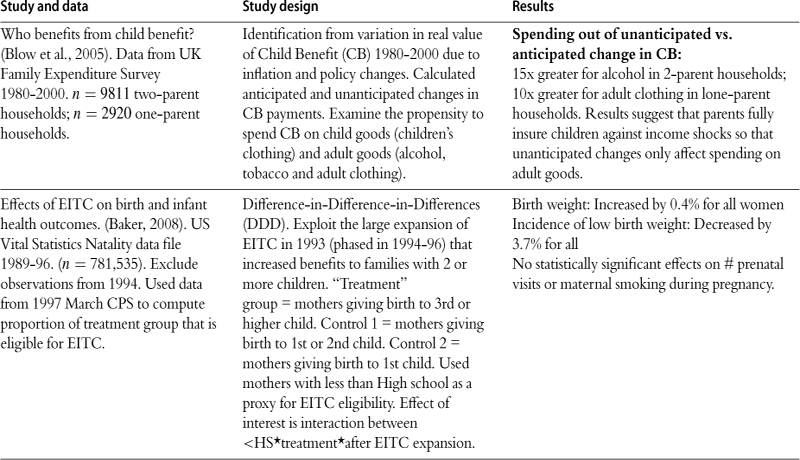
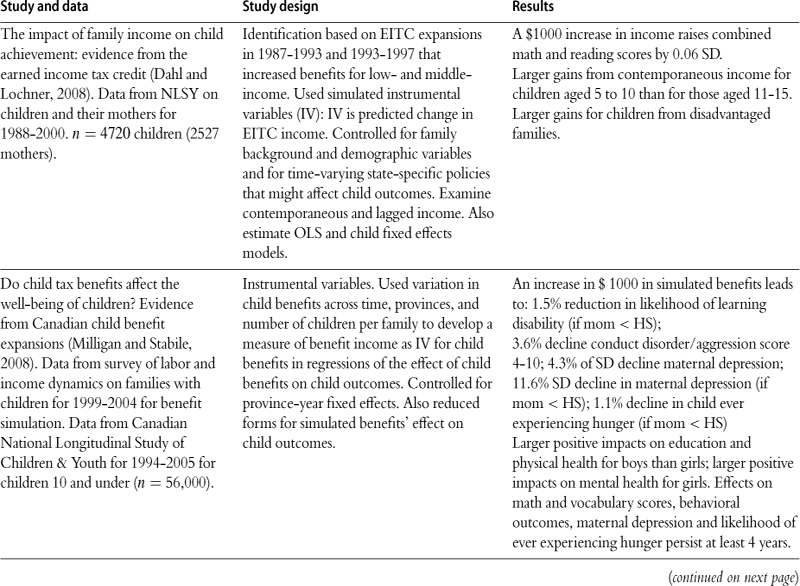
Milligan and Stabile (2008) take advantage of a natural experiment resulting from changes in Canadian child benefits. These benefits vary across provinces and were reformed at different times. An advantage of their research is that the changes in income were not tied to other changes in family behavior, in contrast to programs like the EITC. They find that an extra $1000 of child benefits leads to an increase of about 0.07 of a standard deviation in the math scores and in the Peabody Picture Vocabulary Test, a standardized test of language ability for four to six year old children. If we think of a change of a third or a halfa standard deviation in test scores as a meaningful educational effect, then these results suggest that an increase of as little as $5000 in family income has a meaningful effect. Milligan and Stabile (2008) go beyond Dahl and Lochner by examining effects on other indicators. They find that higher child benefits lower aggression in children and decrease depression scores for mothers. They do not find much impact on physical health measures, though they do find a decrease in families reporting that their children went hungry. There is some evidence of gender differences, with girls showing greater responsiveness to income on the mental health and behavioral scores while boys show greater responsiveness on test scores.
These findings are extremely intriguing, but raise several questions. First, do the effects of income vary depending on the child’s age? Morris et al. (2004) argue that income is more important at younger ages, though persistent poverty is worst of all. Second, are there really gender effects in the impact of income, and if so why? Third, the effects that Milligan and Stabile find are roughly twice those found by Dahl and Lochner. Is this because the former study a pure income transfer while the latter study a tied transfer? Fourth, will the effects last, or will they be subject to “fade out” as the children grow older?
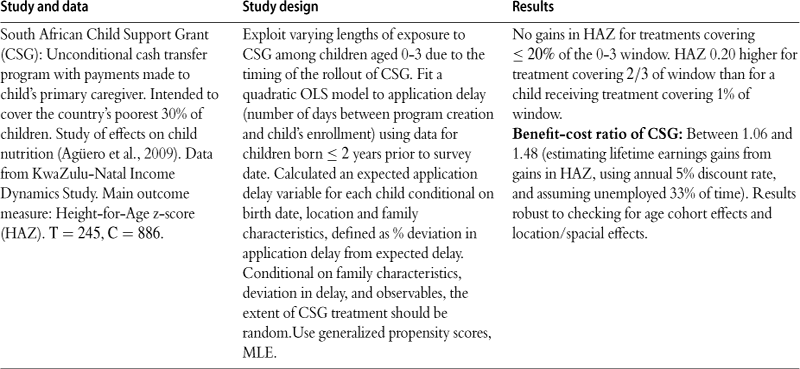
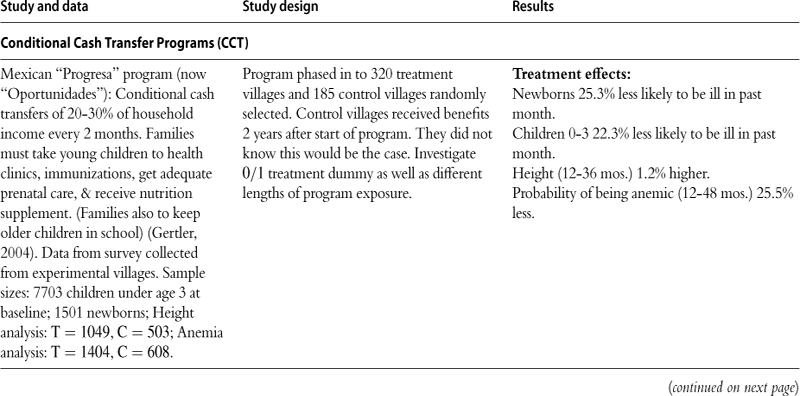
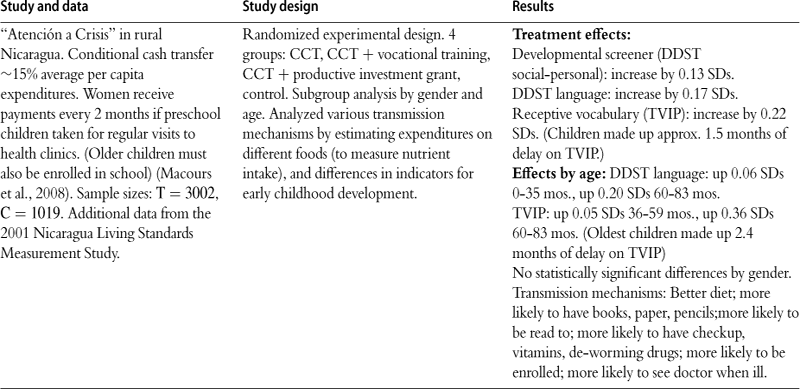
Table 6 also includes examples from a growing literature analyzing “conditional cash transfer programs” (CCTs). These are programs that tie transfers to specific behavior on the part of the family. For example, the parents may be required to make sure that the children attend school or get medical care in return for the transfer. These programs have become increasingly popular in developing countries, and have also been implemented to a limited extent in rich countries (for example, there is a program in New York City which is being evaluated by Manpower Development Research Corporation). By their nature, CCTs are complex programs that cannot tell us about the pure impacts of income. Still, these programs have attracted attention because randomized controlled trials have shown at least short-term results. It is difficult however to compare across programs, given that they all tend to focus on different outcomes.
Given this positive evidence about the effects of income, it is a puzzle why so much aid to poor families is transferred in kind. Currie and Gahvari (2008) survey the many reasons for this phenomena that have been offered in the economics literature and conclude that the most likely reasons aid is offered in kind are agency problems, paternalism, and politics. In a nutshell, policy makers and the voters they represent may be more concerned with ensuring that children have medical care than with maximizing their parent’s utility, even if the parent’s utility is assumed to be affected by the children’s access to health care. Politics come in because coherent lobby groups (such as doctors, teachers, or farmers) may have incentives to advocate for various types of in kind programs. In any case, in kind programs are an important feature of aid policies in all Organization for Economic Cooperation and Development states, accounting for over 10% of GDP if health care and educational programs are included. In what follows, we first discuss “near cash programs” and then programs whose benefits are less fungible with cash.
5.2 Near-cash programs
Programs such as the US Food Stamp Program (FSP, now renamed the Supplemental Nutrition Assistance Program, or SNAP) and housing assistance are often referred to as “near cash” programs because they typically offer households benefits that are worth less than what the household would have spent on food or housing in any case. Hence, canonical microeconomic theory suggests that households should think of them as equivalent to cash and that they should have the same impact as the equivalent cash transfer would have. In the case of food stamps, it has proven difficult to test this prediction because the program parameters are set largely at the national level, so that there is only time series variation.
Currie (2003) provides an overview of the program, and the research on its effects that had been conducted up to that point. Schanzenbach (forthcoming) uses data from a food stamp cash out experiment to examine the effect on food spending. She finds that a minority of households actually received more in food stamps than they would otherwise spend on food. In these constrained households, families did spend more on food than they would have otherwise, while in other households, food stamps had the same effect as cash. Unfortunately, there is little evidence that constrained households bought foods that were likely to have beneficial effects; they seem, for example, to have spent some of the “extra” food money on products such as soda.
Hoynes and Schanzenbach (2009) use variation from the introduction of the FSP to identify its effects on food spending. The FSP began as a small pilot program in 1961, and gradually expanded over the next 13 years: In 1971, national eligibility standards were established, and all states were required to inform eligible households about the program. In 1974, states were required to extend the program statewide if any areas of the state participated. Using data from the PSID, the introduction of the FSP was associated with an 18% increase in food expenditures in the full sample, with somewhat larger effects in the most disadvantaged households. They find that the marginal propensity to consume (MPC) food out of food stamp income was 0.16 compared to 0.09 for cash income. Thus, it does seem that many households were constrained to spend more on food than they otherwise would have (or alternatively, that the person receiving the food stamps had a stronger preference for food than the person controlling cash income in the household). From a policy maker’s point of view, this means that the FSP has a bigger impact on food spending than an equivalent cash transfer. Still, it is a leaky bucket if only 16 cents of every dollar transferred goes to food.
Bingley and Walker (2007) conduct an investigation of the Welfare Milk Program in the UK. They identify the effect of the program on household milk expenditures using a large change in eligibility for the program that had differential effects by household type. They find that about 80% of a transfer of free milk is crowded out by reductions in milk purchases by the household. This estimate is quite similar to that of Hoynes and Schanzenbach, though it still suggests that the in kind transfer is having some effect on the composition of spending. Details of these two studies are shown in Table 7.
Table 7
Impacts of Food Stamps on birth and early childhood outcomes.
Unless otherwise noted, all reported results are statistically significant at 5% level.
Percent changes (denoted by % instead of ”pp”) are reported relative to the mean.
| Study | Study design | Results |
| Consumption responses to in-kind transfers: evidence from the introduction of the Food Stamp program (Hoynes and Schanzenbach, 2009). Data from PSID for 1968–78 and from the 1960, 1970, and 1980 decennial censuses. n = 39,623 person-year obs. | Difference-in-difference using variation in county-level implementation of FSP to estimate impact of FSP on food consumption and labor supply. Controlled for county and year fixed effects as well as state linear time trends. Included trends interacted w/ pre-treatment characteristics and three measures of annual per capita county transfer payments. | Introduction of FSP is associated with: 18% increase in total food expenditures (whole sample); 26–28% increase in total food expenditures for female-headed HHs; 6–13% increase in total food exp. for non-white female-headed HHs. No significant effect on meals out and cash expenditures on food at home. Elasticity of food spending with respect to income = 0.30. MPC for food out of cash income = 0.09 (for whole sample); MPC for food out of cash income = 0.111 (<$25,000 income); MPC for food out of FSP income = 0.16 (for whole sample); MPC for food out of FSP income = 0.238 (<$25,000 income). Decrease in whether the HH head reports any work by 21%. |
| There’s no such thing as a free lunch: Altruistic parents and the response of household food expenditures to nutrition program reforms (Bingley and Walker, 2007). Data from UK Family Expenditure Surveys for 1981–1992. n = 29, 222. | Analyzed 3 nutrition programs in the UK: free school lunch for children from poor HHs, free milk to poor HHs w/ pre-school children, and free milk at day care for pre-schoolers in attendance regardless of income. For identification, exploited 1988 reform that ended eligibility for poor HHs with working parents. Difference-in-difference (DD). Also did DD using the fact that free school lunches available only during term time, and summer holidays begin earlier in Scotland. |
Free school lunch reduces food expenditure by 15% of the purchase price of the lunch. Free pint of milk reduces milk expenditure by 80%. |
| Impact of Food Stamp Program (FSP) on birthweight, neonatal mortality, and fertility (Almond et al., 2009). Birth and death micro data from the National Center for Health Statistics merged with county-level data for 1968–77. FSP data from USDA. County characteristics from 1960 City and County Data Book. Data on government transfers and per-capita income from REIS. Participation rates calculated using CPS. n = 97, 785 whites; 27,274 blacks. | Difference-in-difference, using the fact that FSP was introduced to different counties at different times due to available funding and policy changes. Key policy/treatment variable is the month and year that each county implemented FSP. Estimated the impact of FSP on county-level birth outcomes, using county and time fixed effects. Main outcomes concerned with availability of FSP during 3rd trimester of pregnancy. | Introduction of FSP in 3rd trimester led to: 0.06-0.08% (0.1-0.2%) increase in birth weight for whites (blacks); a 1% (0.7-1.5%) decrease in fraction of low birth weight for whites (blacks). Insignificant impacts of exposure to FSP during earlier trimesters. Results robust to adding county & time fixed-effect and other controls, as well as various time trends to the analysis. Results robust to conducting an event study analysis. |
| Effects of FSP benefits on weight gained by expectant mothers (Baum, 2008). Data from the NLSY. Limited to low-income black and Hispanic women w/ pregnancy information in the surveys. n = 1477 pregnancy-level obs. | Random effects models using Heckman and Singer method to model unobserved heterogeneity. Dependent variable is whether women gain correct amount of weight during pregnancy based on pre-pregnancy BMI. Assume state variation in FSP eligibility rules, and program administration affects FSP takeup but not weight gain. Control for gestation, pre-pregnancy FSP, WIC. | Increasing average monthly FSP benefits from $0 to $100 decreases probability of gaining too little weight by 11.8-13.7%. No effect on probability of gaining too much weight. No statistically significant difference in effects of FSP on weight gain between first-time and non-first-time mothers. |
| Impact of FSP on birth outcomes in California (Currie and Moretti, 2008). Data on FSP from state records and REIS. Data from birth records in CA for 1960–74. Aggregated data into cells defined using county, race, year of birth, maternal age group, parity, and the third of the year. n = 38,475 cells. |
Difference-in-difference using county-level variation in timing of FSP introduction. FSP measured using dummy (= 1 if FSP introduced), log expenditures, or log participation. FSP dummy refers to 9 months prior to birth. County fixed effects and county-specific time trends included. Examined teenage mothers and LA county separately. | FSP introduction led to a 10% increase in number of first births to white teen mothers (only in Los Angeles); a 24% increase in number of first births to black teen mothers; a 12% increase in number of first births to all blacks; a 0.1% increase in probability infant 1500–2000 g survives for whites; a 4% decrease in probability infant < 3000 g survives for blacks; a 4% increase in probability of low birth weight among white teens. |
Given that these programs appear to have some effect on food expenditures, it is reasonable to ask what effect they have on child outcomes. There is a substantial older literature examining this question (see Currie (2003) for a summary). The modal study compares eligible participants to eligible non-participants using a multiple regression model. The main problem with drawing inferences about the efficacy of the FSP from this exercise is that participants are likely to differ from eligible non-participants in ways that are not observed by the researcher. Thus, for example, Basiotis et al. (1998) and Butler and Raymond (1996) both find that participation in the FSP reduces consumption of some important nutrients. Since it is hard to imagine how giving people food coupons could do this, one suspects that these results are driven by negative selection into the FSP program.
Several recent papers examining the effects of the FSP on young children are summarized in Table 7. Currie and Moretti (2008) were the first to try to use variation in the timing of the introduction of the Food Stamp program to look at effects on birth outcomes. Using Vital Statistics Natality data from California, they find that the introduction of the FSP increased the number of births, particularly in Los Angeles County. They also find some evidence that the FSP increased the probability of fetal survival among the lightest white infants, but the effect is very small, and only detectable in Los Angeles. Notably, the FSP increased (rather than decreased) the probability of low birth weight but the estimated effect is small, and concentrated among teenagers giving birth for the first time. Thus, it appears that in California, the FSP increased fertility and infant survival (in some groups) with overall zero or negative effects on the distribution of birth weight.
Almond et al. (forthcoming) examine the same question using national data, and focus on receipt of the FSP during the third trimester, when the fetus typically puts on most of the weight the baby will have at birth. In contrast to Currie and Moretti, they find that the introduction of the FSP increased birth weights for whites and had even larger effects on blacks. The percentage reductions in the incidence of low birth weight were greater than the percentage increases in mean birth weight, suggesting that the FSP had its largest effects at the bottom of the birth weight distribution. Almond et al. find no effect of Food Stamp receipt in the first trimester of pregnancy and much weaker evidence for effects of receipt in the second. This suggests that one reason for the contrast between their results and those of Currie and Moretti is that the latter did not focus narrowly enough on the relevant part of pregnancy. Moreover, Almond et al. find larger effects in the South than in other regions, raising the possibility that overall effects were smaller in California than in other regions. Finally, it is possible that the effects in California are obscured by the substantial in-migration that the state experienced over this period.
Baum (2008) examines the effects of the FSP on weight gain among pregnant women, with particular attention to whether women gained either less than the recommended amount or greater than the recommended amount given their pre-pregnancy body mass index. He estimates a simultaneous equations model in which weight gain and FSP participation are jointly determined. FSP participation is assumed to be affected by various state-level rules about eligibility, outreach and so on. One difficulty is that these rules may be affected by other characteristics of states (such as overall generosity of social programs) which have direct effects on weight gain (e.g. through superior access to health care during pregnancy). Baum finds that FSP participation reduces the probability that women experienced inadequate weight gain during pregnancy, but has no effect on the probability that they gained too much weight. Since inadequate maternal weight gain is an important risk factor for low birth weight, it is likely that FSP had a positive effect on birth weights among affected mothers.
As discussed above, the other large category of “near cash” offer subsidized housing. Many OECD countries have large housing assistance programs, but their effects on families are understudied. In fact, we were able to find only one paper that examined the effects of housing programs on the outcomes of children less than five, and only a handful that examined effects on children at all. These studies are summarized in Table 8.
Table 8
Effects of housing and neighborhoods on child outcomes.
Unless otherwise noted, only results significant at 5% level are reported here.
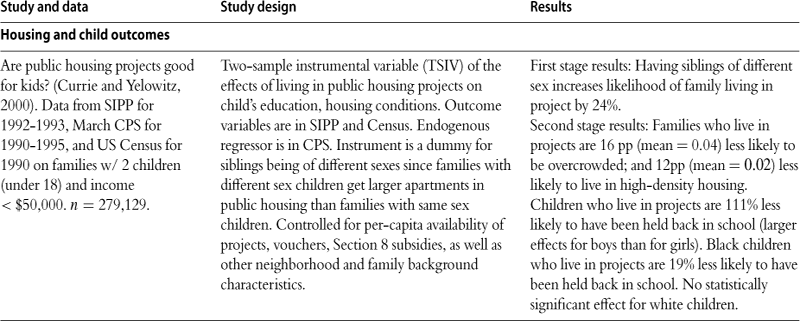
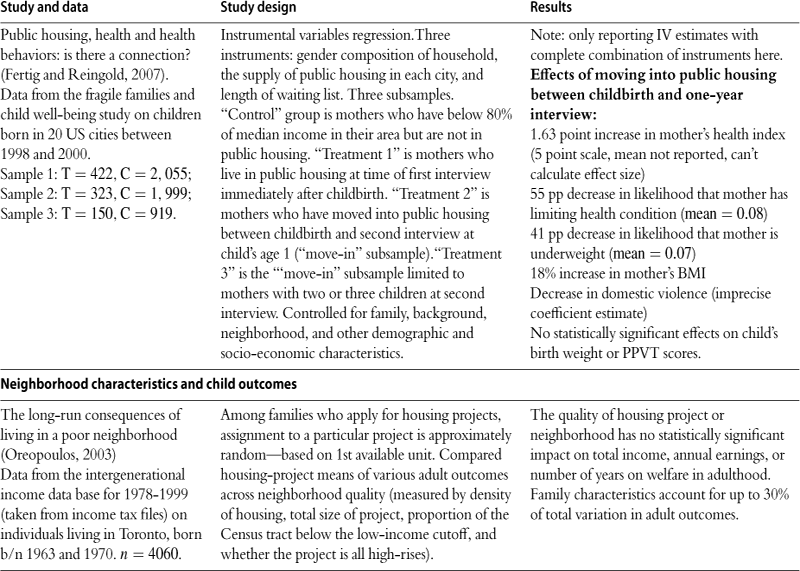
Since by design, families receiving housing assistance are among the poorest of the poor, it is clearly important to address the endogeneity of program receipt. Currie and Yelowitz (2000) look at the effects of living in a public housing project in families with two children. They combine information from the Census and from the Survey of Income and Program Participation in a two-sample instrumental variables framework where the instrument for receipt of housing assistance is the sex composition of the siblings (families with a boy and a girl are entitled to larger apartments, and so are more likely to take up housing benefits). They find that families living in projects are less likely to be subject to overcrowding and that the children are much less likely to have been held back in school. The latter effect is three times bigger for boys (who are more likely to be held back in any case) than for girls. Since most “holding back” occurs at younger ages (Kindergarten and grade 1), this suggests that this type of assistance is in fact beneficial for young children.
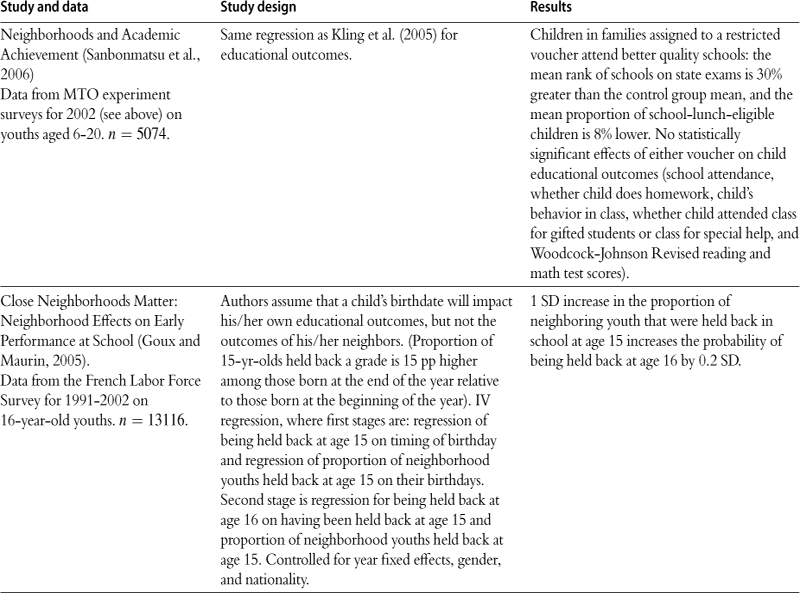
Goux and Maurin (2005) focus on the effect of overcrowding in France using a similar instrumental variables strategy: They argue that children in families in which the two eldest children are the same sex are more likely to live in crowded conditions in childhood. They also propose an alternative strategy in which crowding is instrumented with whether or not the parent was born in an urban area—parents who are from urban areas are more likely to live in crowded conditions. They find evidence consistent with Currie and Yelowitz in that crowding has a large and significant effect on the probability that a child falls behind in school and eventually drops out.
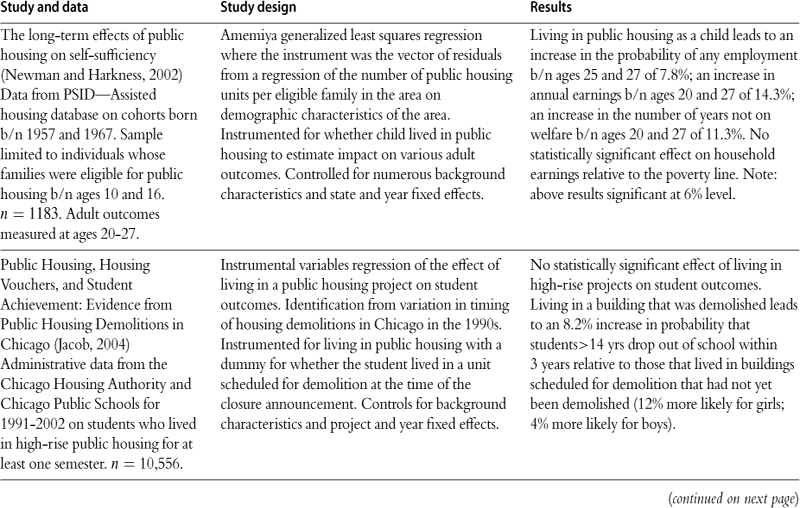
Fertig and Reingold (2007) examine the effect of receipt of public housing assistance using data from the Fragile Families Study and three instruments: the gender composition of children in the household, the supply of public housing in each location, and the length of waiting lists in each location. They find mixed estimates of effects on maternal health and little evidence of an effect on child health, though their samples are quite small. Newman and Harkness (2002) use data from the PSID to examine the effect of living in public housing as a child on future earnings and employment. Living in public housing is instrumented using the residual from a regression of local housing supply on the demographic characteristics of the area. They find that public housing is associated with increases in the probability of any employment (from 88% to about 95%) and increases in annual earnings (by $1861 from a mean of $11,210). While all of these instrumental variables strategies are subject to caveats (is gender composition really uncorrelated with sibling’s outcomes? Are characteristics of local housing markets associated with unobserved factors such as the quality of schools that might also affect child outcomes?) they certainly all point in a similar direction.
An important question is whether public housing assistance benefits children more than the equivalent cash transfer. It is difficult to answer this question given the available data. However, it is possible to eliminate some possible channels through which public housing programs might have different effects. One is that public housing programs may constrain the recipient’s choice of neighborhoods, with either positive or negative effects. Jacob (2004) studies students displaced by demolitions of the most notorious Chicago high-rise projects. The US Congress passed a law in 1996 that required local housing authorities to destroy units if the cost of renovating and maintaining them was greater than the cost of providing a voucher for 20 years. Jacobs argues that the order in which doomed buildings were destroyed was approximately random. For example, in January 1999, the pipes froze in some buildings in the Robert Taylor Homes, which meant that those buildings were demolished before others in the same complex. By comparing children who stayed in buildings scheduled to be demolished to others who had already been displaced by demolitions, he obtains a measure of the effect of living in high-rise public housing. Despite the fact that the high rises in Jacob’s study were among the most notorious public housing projects in the country, he finds very little effect of relocation on children’s educational outcomes. However, this may be because for the most part, children stayed in the same neighborhoods and in the same schools.
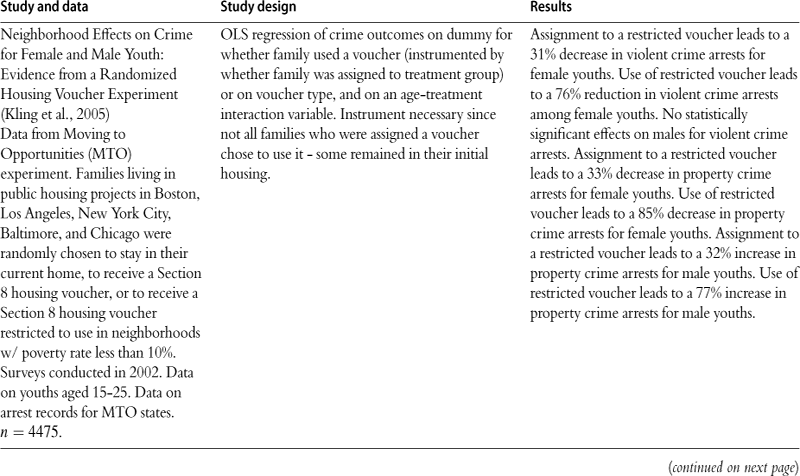
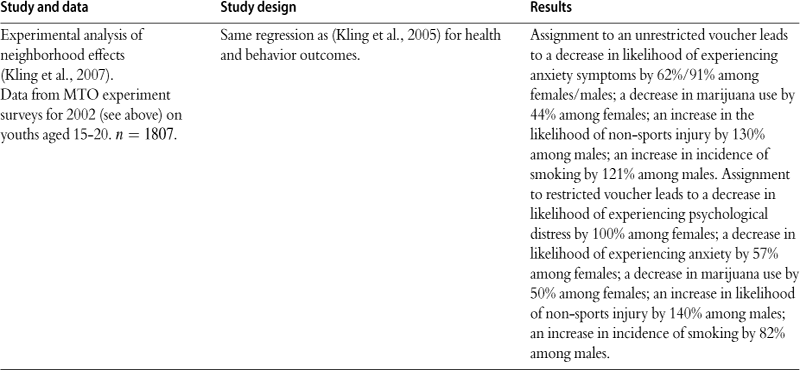
The most exhaustive examination of the effects of giving vouchers to project residents is an ongoing experiment called “Moving to Opportunity” (MTO). MTO was inspired by the Gautreaux program in Chicago, which resulted from a consent decree designed to desegregate Chicago’s public housing by relocating some black inner-city residents to white suburbs. MTO is a large-scale social experiment that is being conducted in Chicago, New York, Los Angeles, Boston and Baltimore (see Orr et al. (2003), Kling et al. (2005) and Sanbonmatsu et al. (2006)). Between 1994 and 1998, volunteers from public housing projects were assigned by lottery to one of three groups. The first group received a voucher that could only be used to rent housing in a low-poverty area (a Census tract with a poverty rate less than 10%). This group also received help locating a suitable apartment (referred to here as the “MTO group”). The second group received a voucher which they could use to rent an apartment in any neighborhood. The third group was the control and received no vouchers or assistance although they were eligible to remain in their project apartment. Families in the first group did move to lower poverty neighborhoods and the new neighborhoods of the MTO group were considerably safer. The move to new neighborhoods had positive effects on the mental health and schooling attainment of girls, and negative effects on the probability that they were ever arrested. But surprisingly, MTO either had no effect, or negative effects, on boys. Boys in the experimental group were 13% more likely than controls to have ever been arrested. This increase was due largely to increases in property crimes. These boys also report more risky behaviors such as drug and alcohol use. And boys in the MTO and voucher groups were more likely to suffer injuries. These differences between boys and girls are apparent even within families (Orr et al., 2003).
It remains to be seen how the long-term outcomes of the MTO children will differ from controls. Oreopoulos (2003) uses data from Canadian income tax records to examine the earnings of adults who lived in public housing projects in Toronto as children. There are large differences between projects in Toronto, both in terms of the density of the projects, and in terms of the poverty of the neighborhoods. Oreopoulos argues that the type of project a family lives in is approximately randomly assigned because the family is offered whatever happens to be available when they get to the top of the waiting list. Oreopoulos finds that once the characteristics of the family are controlled, the neighborhood has no effect on future earnings or on the likelihood that someone works.
The findings on near cash programs can be summarized as follows. There is credible evidence that the FSP may improve birth weight. More work remains to be done to determine whether it has positive effects on the nutrition of children after birth, whether similar programs in other countries have positive effects, and whether this particular type of in kind program has effects that are different than cash subsidies to poor households. The evidence regarding housing programs also suggests that they can be beneficial to families, but offers little guidance about the important question of whether housing programs matter primarily because they subsidize family incomes or operate through some other mechanism. It seems doubtful, given the available evidence, that housing programs benefit child outcomes primarily by improving their neighborhoods (especially since many housing projects are located in less desirable neighborhoods).
5.3 Early intervention programs
Many programs specifically seek to intervene in the lives of poor children in order to improve their outcomes. Three interventions that have been shown to be effective are nurse home visiting programs, nutritional supplementation for pregnant women, and quality early childhood education programs. Table 9 summarizes some recent evidence about home visiting programs.
Table 9
Randomized trials of home visiting programs.
Some cost-benefit analysis from Aos et al. (2004), Technical Appendix.
“T” refers to treatment group, “C”; refers to control group. “T = C” means no discernable difference between groups at 5% significance level.
| Study/program name | Data, program description, and study design | Results |
| The Comprehensive Child Development Program (CCDP) (St. Pierre and Layzer, 1999) | Biweekly visits starting 0–1, ending at 5 years. Population served: 43% African-American, 26% Hispanic; all below poverty. Background of Home Visitors: paraprofessionals Sample sizes: T = 2, 213, C = 2, 197 Evaluation Sites: 21 sites throughout the US. Age of children at last follow-up: 5 years old |
Developmental Checklist: T = 57.93, C = 57.51 Found no significant effects on wide range of outcomes including: Development and Behavior scores, medical care, mortality, HOME scores, maternal depression, welfare use, maternal income, education or employment, maternal substance use. Total cost per participant: $ 37,488. Total benefit per participant: $91. Net present value = —$37,397. |
| Healthy start (Duggan et al., 1999, 2004; Harding et al., 2007; DuMont et al., 2006) | Weekly visits, fading to quarterly age of participation: birth to 5 years. population served: low-income, at-risk families of newborns recruited through an HSP screening and assessment protocol. All English-speaking. Background of home visitors: paraprofessionals. Sample sizes: Alaska: T = 179, C = 185; Hawaii: T = 373, C = 270, 6 sites; Virginia: T = 422, C = 197, 2 sites. 19 additional sites discussed in (Harding et al., 2007). Age of children at last follow-up: 2 years old (3 in San Diego) |
Some positive effects on parenting practices and negative effects on domestic violence in some sites. E. g. Hawaii partner violence: T = 16, C = 24. Less corporal/verbal punishment T < C (odds ratio 0.59). Health effects in some sites but not others, e.g. VA: birth complications T = 0.2, C = 0.48; New York: low birth weight T = 3.3, C = 8.3; maternal depression T = 23, C = 38. Increases in child Bayley Scale for Infant Development in San Diego, Arkansas. Increases in maternal education and decreases in serious child abuse only in New York (T 12.5% less than C). All sites tested for a wide range of possible effects, with generally insignificant effects on other measures of child well being and child abuse. |
| The nurse-family partnership program (Olds et al., 1999) | Weekly visits, fading to monthly, prenatal to 2 yrs. Population served: disadvantaged first-time mothers less than 30 weeks pregnant (62% unmarried, 47% teenage, 23% poor, unmarried and teenage). Background of home visitors: Nurses. Sample sizes: C1 = 90, C2 = 94, T3 = 100 T4 = 116 (see below for description of groups). Evaluation site: Elmira, New York. C1 = screening; C2 = screening & transportation; T3 = screening, transportation, & prenatal home visits; T4 = screening, transportation, prenatal and postnatal home visits. Prenatal analysis: T = T3 + T4, C = C1 + C2; Postnatal analysis: T = T4, C = C1 + C2. Age of children at last follow-up: 15 years old. |
Pre-term births for women who smoked more than 4 cigarettes per day: T = 2.08, C = 9.81 (mothers also less likely to smoke during pregnancy, better nutrition during pregnancy, more likely to use WIC). For children: fewer emergency room visits at 0–12, 12–24 months. AT 15-yr follow-up Mother’s number of months receiving AFDC: T4 = 60.4, C = 90.3; Mother’s substance use impairments: T4 = 0.41, C = 0.73; Mother’s arrests: T4 = 0. 18, C = 0.58; Convictions: T4 = 0. 06, C = 0. 28; Substantiated reports of child abuse and neglect, 0 to 15 yrs: T4 = 0.29, C = 0.54; Child’s incidence of arrests: T4 = 0.20, C = 0.45; Child’s convictions and probation violations : T4 = 0.09, C = 0.47; Child’s number of sex partners: T4 = 0.92, C = 2.48; Child’s number of days drank alcohol: T4 = 1.09, C = 2.49. Cost-benefit analysis: Total cost per child: $10,300 ; Total benefit per child: $ 30,000. Net present value = +$19,700. Most benefits due to reduced crime on part of the child and reductions in child abuse on part of parent. |
| The nurse-family partnership program (Olds et al., 2007) | Weekly visits, fading to monthly, prenatal to 2 yrs. Population served: first-time mothers less than 29 weeks pregnant and at least 2 of the following: unmarried, less than 12 yrs of education, or unemployed; 92% African-American, 98% unmarried, 64% 18 yrs of age or younger, 85% at or below poverty level. Background of home visitors: nurses. Sample sizes: C1 = 166, C2 = 515, T3 = 230, T4 = 228 (see below for description of groups). Evaluation sites: Memphis, Tennessee. C1 = transportation; C2 = screening & transportation; T3 = screening, transportation, prenatal home visits, one visit postpartum in hospital, one postpartum visit at home; T4 = T3 plus home visits through child’s 2nd birthday. Prenatal analysis: T = T3 + T4, C = C1 + C2; Postnatal analysis: T = T4, C = C2. Age of children at last follow-up: 9 years old. |
During first 2 years of child’s life: Number of health encounters for injuries/ingestions: T = 0.43, C = 0.56 Number of outpatient visits for injuries/ingestions: T = 0.11, C = 0.20 Number of days hospitalized for injuries/ingestions: T = 0.04, C = 0.18 Mother attempted breast-feeding: T = 26, C = 16 Subsequent live births: T = 22, C = 31 AT 9-yr follow-up Child GPA (low-resource only): T = 2.68, C = 2.44 Reading and math achievement (low-resource only): T = 44.89, C = 35.72 Mother’s # months with current partner: T = 51.89, C = 44.48 Number of months on AFDC/TANF per year: T = 5.21, C = 5.92 Number of months on food stamps per year: T = 6.98, C = 7.80 Maternal mastery: T = 101.03, C = 99.50 No. of months with employed partner: T = 46.04, C = 48.43 No significant effects on ER visits for injuries in first 2 years, health at birth, use of medical care, maternal health. |
| Early start (Fergusson et al., 2006) | Weekly visits for 1st month, then varying age of participation: prenatal to 3 years. Population Served: families recruited through the same screening process as in Hawaii Healthy Start. Background of home visitors: “family support workers” with nursing or social work qualifications. Sample sizes: T = 220, C = 223. 1 site in New Zealand. Age of children at last follow-up: 3 years old. |
Average number of doctor’s visits 0–36 mo: T > C by 0.24 SD. Percentage of up-to-date well-child checks 0–36 mo: T > C by 0.25 SD. Percentage enrolled w/ dentist 0–36 mo: T > C by 0.20 SD. Percentage attended hospital for accident/injury or accidental poisoning 0–36 mo: T < C by 0.22 SD. Mean duration of early childhood education: T > C by 0.22 SD. Mean number of community service contacts: T > C by 0.31 SD. Positive parenting attitudes score: T > C by 0.26 SD. Non-punitive parenting attitudes score: T > C by 0.22 SD. Overall parenting score: T > C by 0.27 SD. Percentage of parental report of severe physical assault: T < C by 0.26 SD. Child internalizing (negative) behavior score*: T < C by 0.26 SD. Child total negative behavior score*: T < C by 0.24 SD. |
| Effectiveness of home visitation by public health nurses in prevention of the recurrence of child physical abuse and neglect: a randomized controlled trial (MacMillan et al., 2005) | Weekly visits for first 6 months, then biweekly Age of participation: Entry: 0–13 yrs old, program lasted 3 years. Population served: parents who have a reported episode of physical abuse or neglect in the 3 months prior to joining program. Background of home visitors: public health nurses. Sample sizes: T = 73, C = 66. 1 site in Hamilton, Canada. Note: Control group received standard services from the child protection agency CPA). Treatment group also received the standard services in addition to the home visiting. Age of children at last follow-up: Varied (3-year follow-up). |
Recurrence of physical abuse or neglect based on hospital records: T = 24, C = 11 Also tested, but found no statistically significant effects on: Recurrence of abuse or neglect based on CPA records; HOME score; child’s behavioral, anxiety, attention problems, aggression or conduct disorder scores; parenting behavior scores or CAP score. |
| Economic evaluation of an intensive home visiting programme for vulnerable families: A cost-effectiveness analysis of a public health intervention (McIntosh et al., 2009) | Weekly visits Age of Participation: prenatal to 18 months old. Population Served: Pregnant women identified by community midwives as being at risk for child abuse or neglect. Background of home visitors: paraprofessionals who received program training. Sample Sizes: T = 67, C = 64. 1 site in the UK. Age of Children at Last Follow-up: 1 year old |
Maternal sensitivity (CARE Index): T > C by 13%. Infant cooperativeness (CARE Index): T > C by 18%. Likelihood infant placed on child protection register: T > C (1.35 times more likely). Proportion of children removed from home: T = 6, C = 0. |
5.3.1 Home visiting
Unlike many social programs, home visiting has been subject to numerous evaluations using randomized control trials. A recent survey appears in Howard and Brooks-Gunn (2009). David Olds and collaborators have developed a particular model for home visiting and conducted randomized controlled trials in a number of settings (Olds et al., 1999, 2007) to evaluate it. Olds’ programs focus on families that are at risk because the mother is young, poor, uneducated and/or unmarried, and involve home visits by trained public health nurses from the prenatal period up to two years postpartum. The evaluations have shown many positive effects on maternal behavior, and on child outcomes. As of two years of age, children in the Elmira New York were much less likely to have been seen in a hospital emergency room for unintentional injuries or ingestion of poisonous substances, although this finding was not replicated at other study sites. As of age 15, children of visited mothers were less likely to have been arrested or to have run away from home, had fewer sexual partners, and smoked and drank less. The children were also less likely to have been involved in verified incidents of child maltreatment. This finding is important given the high incidence of maltreatment among US children (and especially among poor children), and the negative outcomes of maltreated children discussed above. There was little evidence of effects on cognition at four years of age (except among children of initially heavy smokers), though one might expect the documented reduction in delinquent behavior among the teens to be associated with improvements in eventual schooling attainment.
In Olds’ model, using nurses as home visitors is viewed as key to getting good results. This may be because nurse home visitors are more acceptable to parents than social workers or community workers because families may want medical services. A randomized trial of nurses versus trained paraprofessionals (Olds et al., 2002) suggests that the effects that can be obtained by paraprofessionals are smaller. Also, the Olds programs are strongly targeted at families considered to be at risk and so they do not shed light on the cost-effectiveness of the universal home visiting programs for pregnant women and/or newborns that exist in many countries.
Olds’ positive results do not imply that all home visiting programs are equally effective. In fact, Table 9 suggests that the average home visiting program has relatively small effects. They often improve parenting in subtle ways and may result in some improvements in specific health outcomes. However, these may not be sufficient to justify the cost of a large scale program (Aos et al. (2004) offers a cost benefit analysis of several programs). Home visiting programs can be viewed as a type of parenting program—presumably the reason why Olds’ home visitors improved outcomes is because they taught mothers to be better parents. Since parents are so important to children, programs that seek to improve parenting practices are perennially popular. Yet studies of these programs suggest that it is remarkably difficult to change parents’ behavior and that many attempted interventions are unsuccessful. The most successful parenting programs are those that combine parent education with some other intervention that parents want, such as visits by nurses (as in Olds case) or child care (Brooks-Gunn and Markham, 2005).
5.3.2 US supplemental feeding program for women, infants, and children (WIC)
A second type of early intervention program that has been extensively studied is the US Supplemental Feeding Program for Women, Infants, and Children (WIC). As its name implies, WIC is a program targeted at pregnant and lactating women, infants, and children up to age 5. Participants receive vouchers that can be redeemed for particular types of food at participating retailers. Participants must generally go to the WIC office to receive the vouchers, and generally receive nutrition education services at that time. Many WIC offices are run out of clinics and may also facilitate access to medical care. Dozens of studies (many of them reviewed in Currie (2003)) have shown that participation in WIC during pregnancy is associated with longer gestations, higher birth weights, and generally healthier infants, and that the effects tend to be largest for children born to the most disadvantaged mothers. Economists have critiqued these studies, on the grounds that there may be unobservable variables that are correlated with WIC participation among eligibles and also with better birth outcomes. Moreover, it may be implausible to expect WIC to have an effect on pre-term birth. A recent Institute of Medicine report on the subject reviewed the evidence and concluded that randomized trials of many different interventions with women at risk of pre-term birth had failed to find effects (Behrman and Butler, 2007). So it might be surprising to find an effect for WIC, when more specific and intensive interventions aimed at preventing pre-term birth have generally failed.
A number of new studies have attempted to deal with various aspects of this critique, as shown in Table 10. Bitler and Currie (2005) look at data from the Pregnancy Risk Monitoring System, which contains very detailed data from new mothers obtained by combining data from birth records and survey data taken from women before and after pregnancy. They directly address the question of selection bias by examining the population of mothers eligible for Medicaid (all of whom are adjunctively eligible for WIC) and asking how participants differ from non-participants along observable dimensions. They find that the WIC women are more disadvantaged than the non-participants along all observables. This finding does not prove that WIC women are also negatively selected in terms of unobservable variables, but it does mean that women who were very negatively selected in terms of education, health, family relationships and so on would have to have other attributes that were systematically correlated with positive outcomes. Like previous studies, Bitler and Currie also find that WIC participation is associated with higher maternal weight gain, longer gestation, and higher birth weight, particularly among women on public assistance, high school dropouts, teen mothers, and single mothers.
Table 10
Selected studies of special supplemental feeding program for women, infants, and children (WIC).
Unless otherwise noted, only results significant at 5% level are reported here.
Percent changes (denoted by % instead of “pp”) are reported relative to the mean.
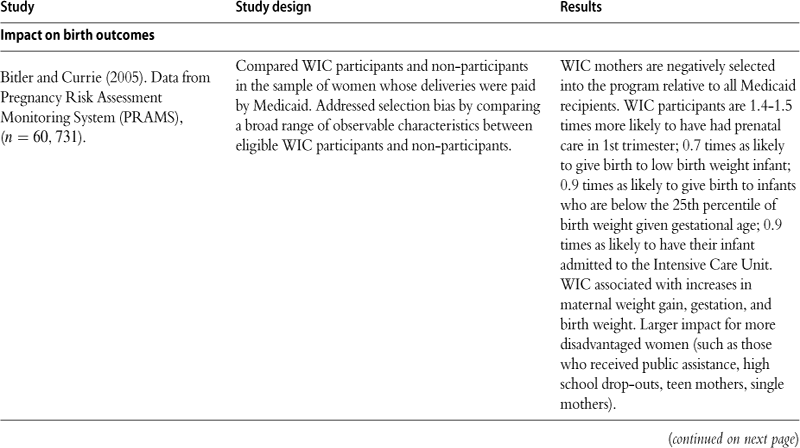
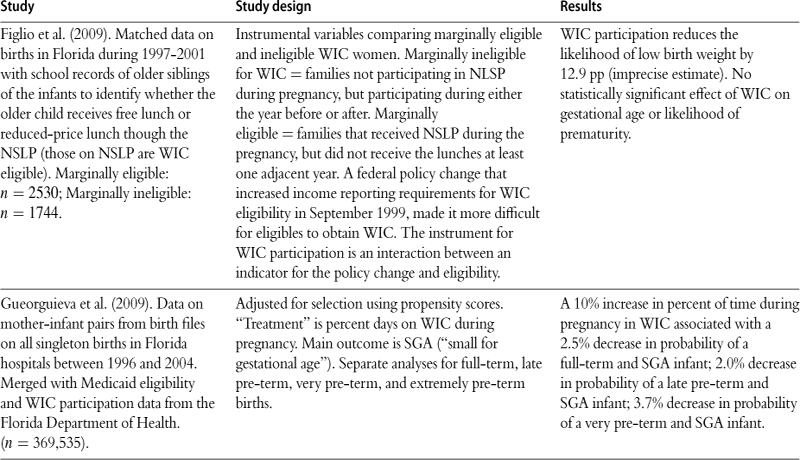
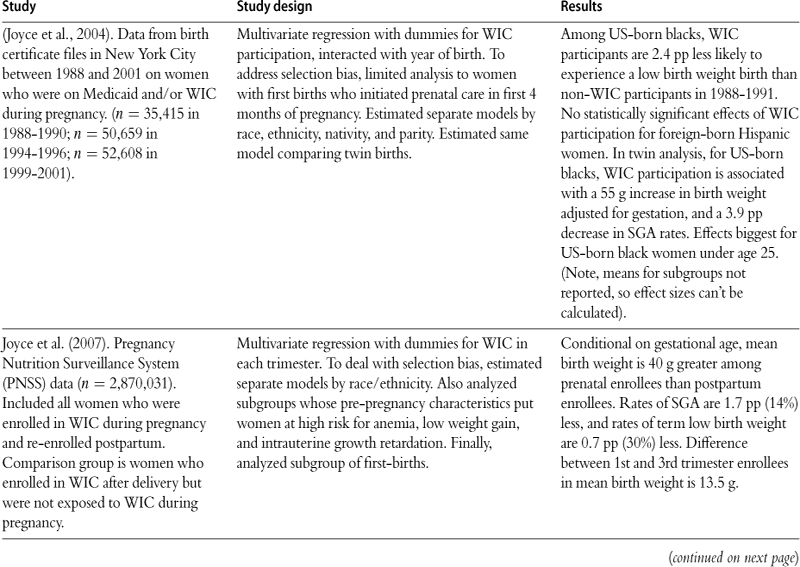
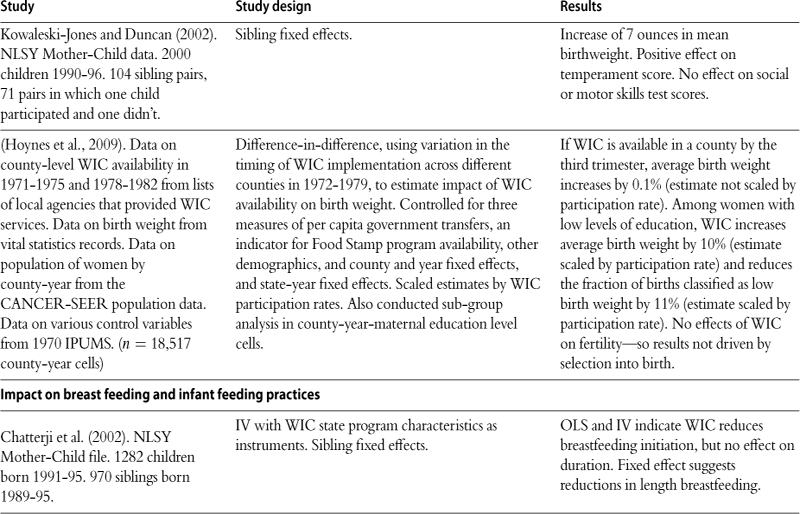
Joyce et al. (2004) adopt a similar strategy with regard to selection, and focus on a sample of first births to women who initiated prenatal care in the first four months of pregnancy in order to ensure that participants and non-participants were more likely to be similar in terms of unobservables. In their sample of women giving birth in New York City, they find positive effects of WIC among US born black women, but not in other groups. Joyce et al. (2007) use a national sample of women, compare women who enrolled in WIC pre and post delivery, and focus on whether infants are small for gestational age (SGA). If one does not believe that WIC can affect gestation, then focusing on SGA is appropriate because it is not affected by gestational age. They find that the incidence of SGA is lower for the prenatal enrollees than for the postpartum enrollees. Gueorguieva et al. (2009) use a large sample of births from Florida and try to deal with potential selection using propensity score matching. They side step the issue of whether WIC affects gestation by presenting separate analyses for pregnancies of different length, and focusing on SGA. They find that longer participation in WIC is associated with reductions in the incidence of SGA. Kowaleski-Jones and Duncan (2002) examine sibling pairs from the NLSY and find that WIC participation is associated with an increase of seven ounces in birth weight. However, the number of pairs in which one child participated and one did not is quite small, so it would be useful to try to replicate this finding in a larger sample of siblings.
Figlio et al. (2009) present an innovative instrumental variables strategy using a large sample of births from Florida that have been merged to school records of older siblings. While the characteristics of WIC programs vary across states, they do not show a lot of variation over time, and previous analyses have demonstrated that these characteristics are weak instruments (Bitler and Currie, 2005). Figlio et al. (2009) first try to select participant and non-participant groups who are very similar. They do this by defining “marginally ineligible” families as those who participated in the National School Lunch Program (NLSP) in the year before or after the birth, but did not participate in the birth year. Thus, the study focuses on families whose incomes hover around the eligibility threshold for NSLP, which is the same as the eligibility threshold for WIC. The instrument is a change in income reporting requirements for WIC in Sept. 1999 which made it more difficult for eligible families to receive benefits. Figlio et al. (2009) find that WIC participation reduces the probability of low birth weight, but find no significant effect on gestational age or prematurity.
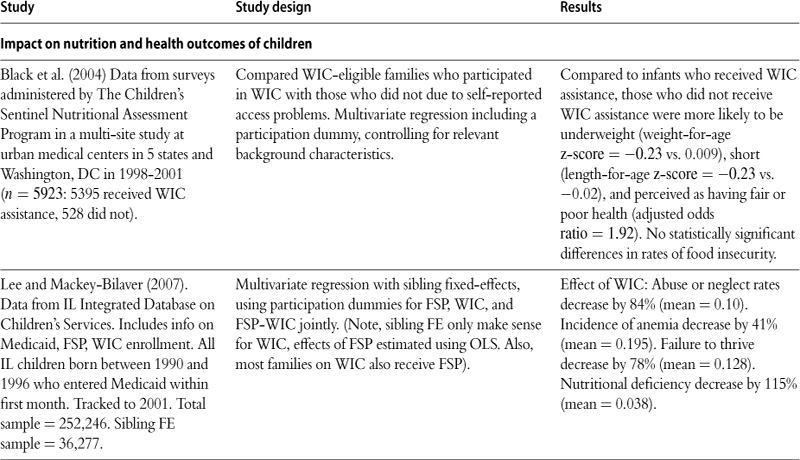
There has been much less study of the effects of WIC on other outcomes, or other groups of participants. A couple of studies that make some attempt to deal with the selection issue are summarized in Table 10. One problem with WIC is that it subsidizes baby formula, which is likely to discourage breast-feeding. Chatterji and Brooks-Gunn (2004) use the NLSY Mother-Child file and estimate both sibling fixed effects models and instrumental variables models using characteristics of state programs as instruments. They find that WIC reduces breast feeding initiation and the length of breastfeeding. However, these results are subject to the caveats above (i.e. small samples and possibly weak instruments). Turning to the effects of WIC on older children, Black et al. (2004) compare WIC eligible participants and those who did not participate due to “access problems”. These problems were assessed based on the families own reports about why they were not participating. They found that infants who received WIC were less likely to be underweight, short, or perceived by their parents to be in fair or poor health. Lee and Mackey-Bilaver (2007) use a large data base from Illinois that integrates administrative data from several sources. Using sibling fixed effects models, they find that siblings who received WIC were less likely to be anemic, to have exhibited failure-to-thrive, or other nutritional deficiencies, and that the infants were less likely to be abused or neglected. As discussed above, one issue in the interpretation of these findings is why one infant would receive WIC while the other did not?
In one of the most interesting recent studies, Hoynes et al. (2009) use the initial roll-out of the WIC program in the 1970s to identify its effects. They find that the implementation of WIC increased average birth weight by 10% and decreased the fraction of low birth weight births. They did not find any evidence of changes in fertility.
In summary, the latest group of studies of WIC during pregnancy largely support the findings of earlier studies which consistently found beneficial effects on infant health. The finding is remarkable because WIC benefits are relatively modest (often amounting to about $40 per month) and Americans are generally well fed (if not overfed at least in terms of total calories). Research that attempted to peer into the “black box” and shed light on why the program is effective would be extremely interesting. Another question that cries out for future research is whether WIC benefits infants and children (i.e. children who participate after birth)? While a few studies suggest that it does, the effects of WIC in this population has been subject to much less scrutiny than the effects on newborns.
5.3.3 Child care
There have been many evaluations of early intervention programs delivered through the provision of child care. One reason for focusing on early intervention through the provision of quality child care is that the majority of young children are likely to be placed in some form of care. In 2008, 64% of women with children under 3 worked for pay (US Bureau of Labor Statistics, 2009). While the US may be an outlier in this respect, labor force participation among women with children is high and rising in many other economies. Blau and Currie (2006) provide an overview of the literature on early intervention through child care. Many studies concern experimental evaluations of model programs that serve relatively small numbers of children and involve intensive services delivered by well-trained and well-supervised staff. These studies generally find that early intervention has long-lasting effects on schooling attainment and other outcomes such as teen pregnancy and crime, even if it does not result in any lasting increase in cognitive test scores. These results point to the tremendous importance of “non-cognitive skills” (cf Heckman and Rubinstein (2001)) or alternatively, to the importance of mental as well as physical health in the production of good child outcomes (Currie and Stabile, 2006).
A few of the most notable model programs are summarized in Table 11. Two studies of “model” early intervention child care programs stand out because they randomlyassigned children to treatment and control group, had low dropout rates, and followed children over many years. They are the Carolina Abecedarian Project and the Perry Preschool Project. Both found positive effects on schooling. A recent cost-benefit analysis of the Abcedarian data through age 21 found that each dollar spent on Abecedarian saved tax payers four dollars. And by focusing only on cost savings, this calculation does not even include the value of higher achievement to the individual children and society (Masse and Barnett, 2002). Each dollar spent on Perry Preschool has been estimated to have saved up to seven dollars in social costs (Karoly et al., 1998), although this high benefit-cost ratio is driven largely by the effect of the intervention on crime, which in turn depends on a handful of individuals.
Table 11
Selected recent evaluations of early childhood programs with randomized designs.
Throughout the table, “T” refers to treatment group and “C” refers to control or comparison group.
Outcomes listed as T > C or C > T were statistically significant at the 5% level.
| Study/program namea | Data, program description, and study design | Results |
| Carolina Abecedarian follow-up and cost-benefit analysis at 21 years of age (Barnett and Masse, 2007) | Preschoolers: full-day child care School age: parent program Sample sizes: Initial: T = 57, C = 54 Age 8: T = 48, C = 42 Age 15: T = 48, C = 44 Age 21: T = 53, C = 51 Age of participation in program: Entry: 6 weeks to 3 months old Exit: 5 to 8 years |
Follow-up at 21 years of age: Grade retention: T = 34%, C = 65%, age 21 Special education: T = 31%, C = 49%, age 21 High school dropout: T = 33%, C = 49%, age 21 College attendance: T = 36%, C = 13%, age 21 Crime rate: T = C, age 21 Employment status: T = C at age 21 Average age first child born: T > C at age 21 Cost-Benefit Analysis: (using 5% discount rate, $2002) Net cost per child = $34,599 Net benefit of program = $72,591 per participant |
| Infant Health and Development Project Follow-up at 18 years of age (McCormick et al., 2006) | Home visits, full-day child care Sample sizes: Initial: T = 377, C = 608 Followup at age 8: T = 336, C = 538 Followup at age 18: T = 254, C = 381 (divided in 2 groups: lighter low birth weight (LLBW) and heavier low birth weight (HLBW)) Age of participation in program: Entry: birth (home visits), 1 year (care). Exit: 3 years |
Math achievement: T > C by 6.8°%, age 18 HLBW Reading achievement: T > C by 5.6%, age 18 HLBW Risky behaviors: T > C by 23.3%, age 18 HLBW IQ: T = C, age 18 HLBW Note: For all outcomes: T = C, age 18 LLBW |
| A reevaluation of early childhood intervention— Abecedarian, Perry Preschool and Early Training Project— with emphasis on gender differences and multiple inference (Anderson, 2008) | Abecedarian: T = 57, C = 54 Perry: T = 58, C = 65 ETP: T = 44, C = 21 Ages of entry: Abecedarian/Perry/ETP: 4.4 mo./3 yrs./3-4 yrs |
Outcomes include: IQ, grade repetition, special ed., high school, college attendance, employment, earnings, receipt transfers, arrests, convictions, drug use, teen pregnancy, marriage. Summary index pools multiple outcomes for a single test. Separate tests by gender. Effects on summary index for girls 5–12: ABC/Perry: increase by 0.45/0.54 SDs. Effects on summary index for girls 13–19: ABC/Perry/ETP: increase by 0.42/0.61/0.46 SDs. Effects on summary index for women over 21–40: ABC/Perry: increase by 0.45/0.36 SDs. No statistically significant effects on males of any age. |
| High/Scope Perry Preschool project follow-up and cost-benefit analysis at 40 years of age (Barnett et al., 2006) | Home visits, Preschool program Sample sizes: Initial: T = 58, C = 65 Age 40: T = 56, C = 63 Age of participation in program: Entry: 3 to 4 years, Exit: 5 years |
Arrests: T = 32, C = 48; In jail: T = 6, C = 17; Report of stopping work for health reasons: T = 43, C = 55; Hard drug use: T = 22, C = 29; Abortions: T = 17, C = 32 Cost-benefit analysis: Main result: Benefit of $12.90 for each $1 cost Most benefits due to reduced crime rates for males Cost: $15,827 ($2000) per student Total Net Private Benefit = $17,730 per participant Total Net Public Benefit = $180,455 per participant |
| National evaluation of Early Head Start (Administration on Children, Youth and Families, 2002 & Love et al., 2005) Cost-Benefit (Aos et al., 2004). | 17 Early Head Start sites selected to reflect EHS programs funded in 1995–96. Random assignment within site (possible given wait lists). Sample: T = 1513, C = 1488. Age of participation in program: Entry at 0–1 year, exit 3 years | Mental Development Index (MDI): T > C by 0.12 SD PPVT-III Vocabulary score: T > C by 0.13 SD Percentage with PPVT score <85 pts: T < C by 0.12 SD Aggressive behavior: T < C by 0.11 SD Supportiveness during parent-child play: T > C by 0.15 SD HOME score: T > C by 0.11 SD Index of severity of discipline: T < C by 0.11 SD No statistically significant effects on parental mental or physical health or on measures of family functioning. Cost-benefit analysis: Total Cost per child: $20,972 Total Benefit per child: $4768, NPV: −$16,203 |
| Head Start impact study (US Department of Health and Human Services, 2010) | Congressionally-mandated study of Head Start. Children from wait lists randomly assigned to one of 383 randomly selected Head Start centers across 23 different states. Baseline data collected in fall 2002; annual spring follow-ups through spring 2006. Sample Sizes: T = 2783, C = 1884. Entry: 3–4 years old; Exit: 4–5 years old | Summary of effects for 4-year-old entry cohort at end of 1st grade: PPVT: T > C by 0.09 SD; Withdrawn behavior: T < C by 0.13 SD; Shy/socially reticent: T > C by 0.19 SD; Problems with teacher interaction: T > C by 0.13 SD. No statistically significant impacts at age 4, kindergarten, or 1st grade on: math scores, Spanish language tests, oral comprehension, and several parent- and teacher-reported measures of emotional and behavioral outcomes. No statistically significant impacts at kindergarten or 1st grade on: school accomplishments, promotion, language and literacy ability, math ability, and social studies and science ability. Summary of effects for 3-year-old entry cohort as of 1st grade (selected results): Oral comprehension: T > C by 0.08 SD. No significant effect on other outcomes. |
| The rates of return to the High/Scope Perry Preschool Program (Heckman et al., 2009) | See Barnett et al. (2006) entry for sample sizes and information about the Perry Preschool Program. Randomization was compromised because of reassignment after initial randomization. Standard errors on the rate of return estimates adjusted for failure of randomization using bootstrapping and Monte Carlo methods. Also, adjusted for the deadweight loss due to taxation (assuming 0%, 50%, and 100% deadweight losses). Used a wide variety of methods for within-sample imputation of missing earnings. Used local data on costs of education, welfare participation, and crime instead of national data, wherever possible. Used several methods to extrapolate benefits and costs beyond age 40 (after last follow-up). Used several measures of the statistical cost of life to estimate costs of murder. | Estimated social rates of return to the Perry Preschool Program are 7%-10%. Estimated benefit-cost ratio = 2.2 to 31.5 (depends on discount rate used, and the measure of cost of murder). |
aPrograms are grouped such that those enrolling children younger than three years old appear first, followed by those enrolling children after age three.
Anderson (2008) conducts a re-analysis of the Perry Preschool and Abcedarian data (and a third intervention called the Early Training Project) and finds that like the MTO public housing experiment, the significant effects of the intervention were largely concentrated among girls. In addition to analyzing the data by gender, Anderson pays careful attention to the idea that there may be a reporting bias in the published studies of early intervention experiments; that is, researchers who found largely null effects of the experiment might still be able to publish results focusing on one or two positive outcomes out of many outcomes investigated. Conversely, if all effects tended in the same direction, but there was insufficient power to detect significant effects on each outcome, it might be possible to detect a significant effect on an index of the outcomes. Anderson finds positive effects (for girls) on a summary index of effects, and the effects are quite large at about a halfa standard deviation. This study highlights an interesting question, which is whether it is generally easier to intervene with girls than with boys, and why that might be the case?
The fact that special interventions like Perry Preschool or Abcedarian had an effect on at least some target children does not prove that the types of programs typically available to poor inner-city children will do so. Head Start is a preschool program for disadvantaged 3, 4, and 5 year olds which currently serves about 800,000 children each year. It is funded as a federal-local matching grant program and over time, federal funding has increased from $96 million when the program began in 1965 to about $7 billion in 2009 (plus additional “stimulus” funds). Head Start is not of the same quality as the model interventions, and the quality varies from center to center. But Head Start centers have historically been of higher average quality than other preschool programs available to low income people. This is because, in contrast to the private child care market, there are few very low-quality Head Start programs (see Blau and Currie (2006) for an overview of preschool quality issues).
An experimental evaluation of Head Start has recently been conducted (Puma et al., 2010). The evaluation compares Head Start children to peers who may or may not be in some other form of preschool (including state-funded preschools modeled in Head Start). In fact, the majority of children who did not attend Head Start did end up attending some other preschool program. Even relative to this baseline, initial results show that Head Start children make gains, particularly in terms of language ability. But children are followed only into the first grade, and so this evaluation did not address the important issue of whether Head Start has longer term effects. This example illustrates one of the limitations of experiments for the study of longer-term effects, which is that one may have to wait a long time for evidence to accumulate. There has also been a federal evaluation of Early Head Start (EHS), a version of the program geared to infants and toddlers under three years old. As Table 11 shows, EHS has small positive effects on cognitive test scores and some measures of behavior though Aos et al. (2004) conclude that it does not pass a cost-benefit test.
Table 12 summarizes notable non-experimental evaluations of Head Start and other public preschool programs. In a series of studies Currie and Thomas use national publicly-available survey data to try to measure the effect of Head Start. In most of these studies, they compare the outcomes of children who attended Head Start to siblings who did not attend. As discussed above, sibling fixed effects control for many shared characteristics of children, but are not a panacea. However, careful examination of differences between participant and non-participant children within families suggested that the Head Start sibling typically attends when the family is relatively disadvantaged. For example, a young single mother might have her first child attend Head Start. If she then marries, her next child will enjoy higher income and be ineligible for Head Start. Currie and Thomas found no within-family differences in birth weight or other individual characteristics of the children. They also investigated spillover effects, which as discussed above, can bias the estimated effect of Head Start. They found some evidence (Garces et al., 2002) that having an older sibling attend Head Start had positive effects on younger siblings. In all, it seems likely that sibling fixed effects models understate the true effect of Head Start.
Table 12
Selected studies of large-scale public early childhood programs.
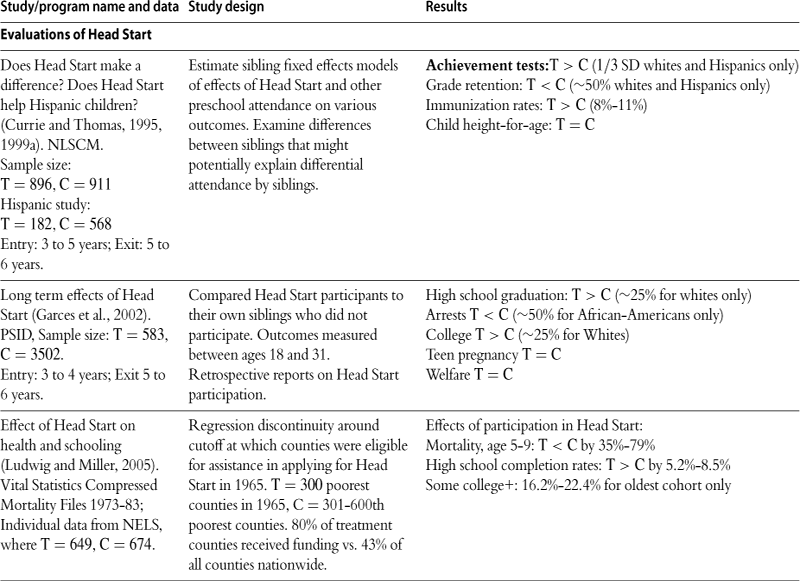
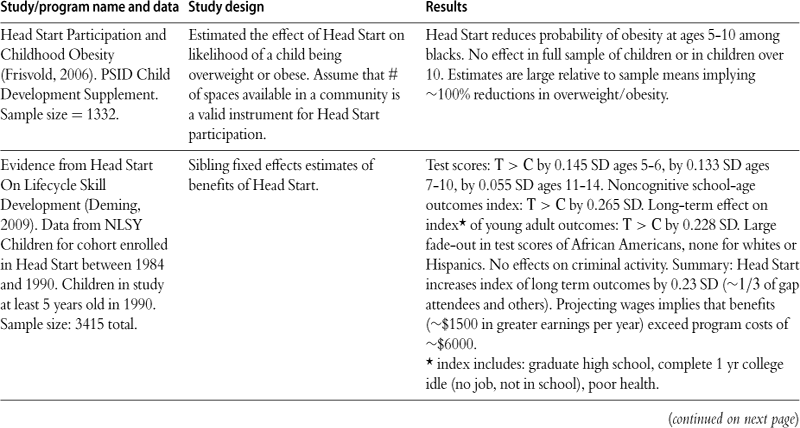
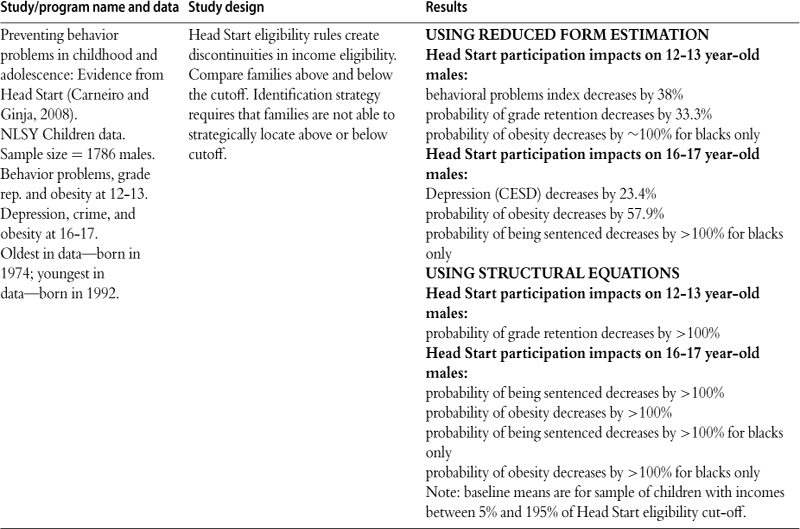
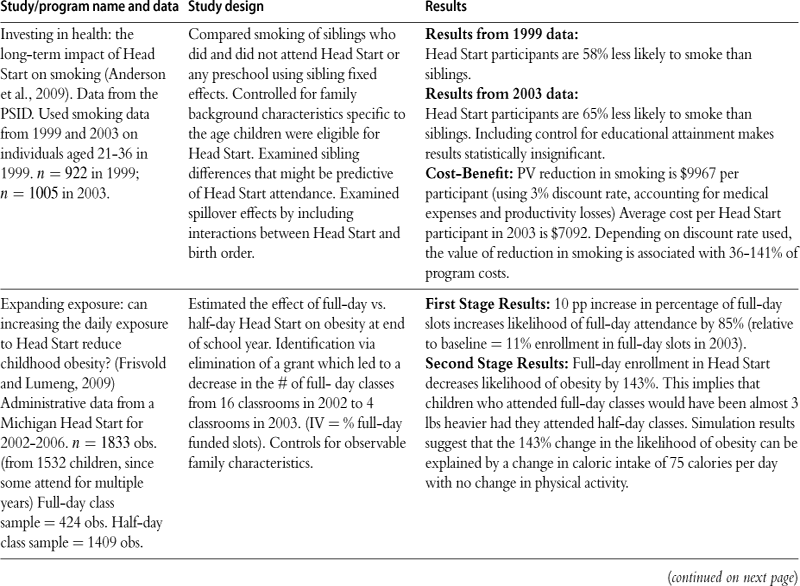
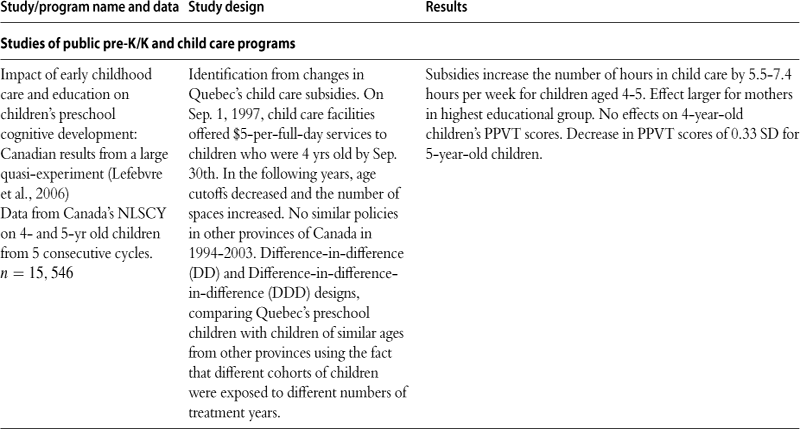
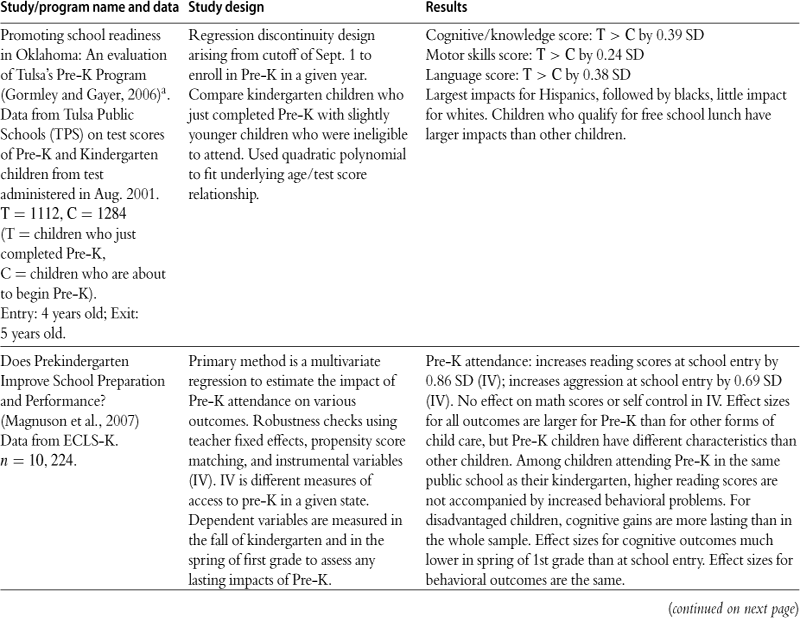
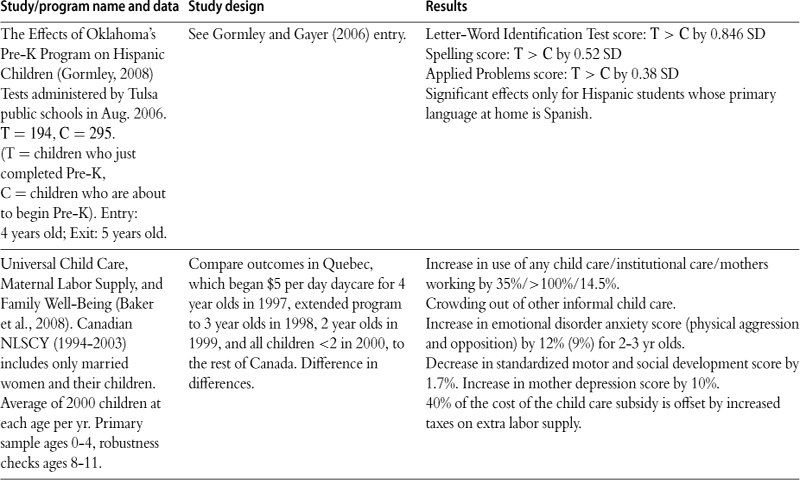
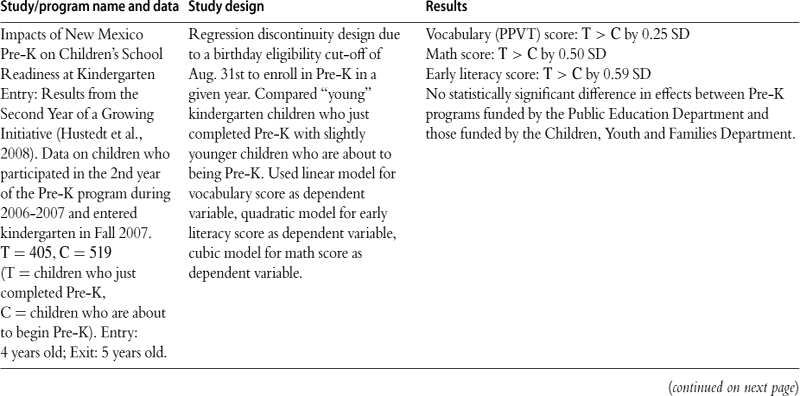
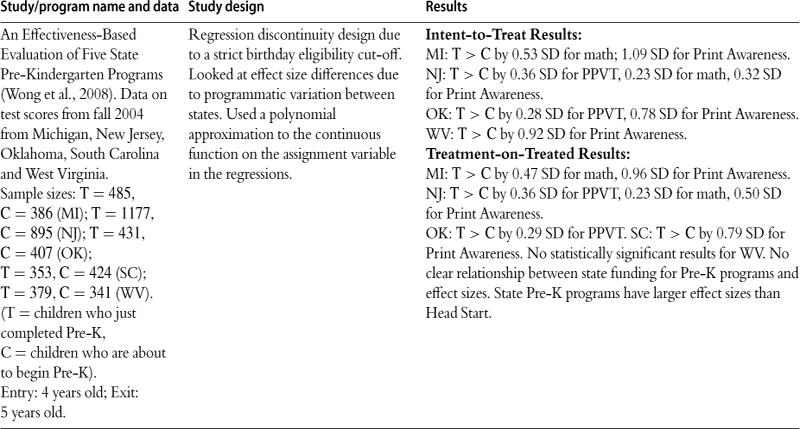
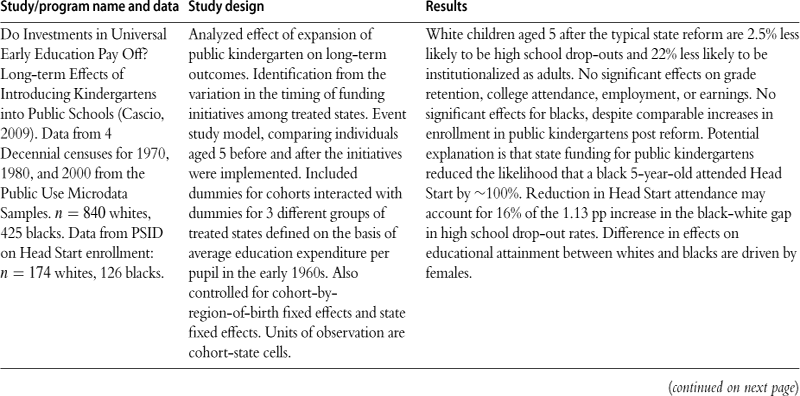
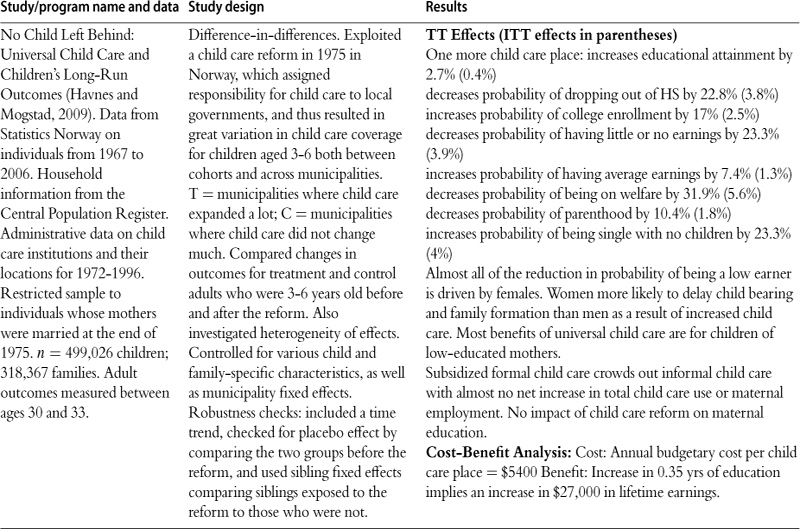
aA very similar study by Gormley et al. (2005) evaluates the effects of Oklahoma’s Universal Pre-K program on school readiness using the same regression discontinuity design, but measuring outcomes with the Woodcock-Johnson Achievement Test. They find a 0.79 SD increase in the Letter-Word Identification score, a 0.64 SD increase in the Spelling score, and a 0.38 SD increase in the Applied Problems score.
See Karoly et al. (2005) for more information about some of the studies described in this table. Unless otherwise noted, none of these evaluations was randomized. “T” refers to the treatment, and “C” refers to the control or comparison group. T > C means that the difference was significant at the 5% level.
Nevertheless, they found significant positive effects of Head Start on educational attainments among white youths, and reductions in the probabilities of being booked or charged with a crime among black youths (Garces et al., 2002). Test score gains for blacks and whites were initially the same, but these gains tended to fade out more quickly for black than white students, perhaps because black former Head Start students typically attend worse schools than other students (Currie and Thomas, 1995). Effects were especially large for Hispanic children (Garces et al., 2002).
More recently, Deming (2009) replicates the results of Currie and Thomas (1995) using the same cohort of NLSY children observed at older ages. Like Anderson, he focuses on an index of outcomes (although he also reports results for separate outcomes) and finds that Head Start results in an increase of 0.23 standard deviations, which is equivalent to about 1/3 of the gap between Head Start and other children. He notes that projected gains in earnings are enough to offset the cost of the program, so that there is a positive cost/benefit ratio. Carneiro and Ginja (2008) use the same data but a different identification strategy: they focus on families around the cutoff for income eligibility for the program and compare families who are just below (and therefore eligible) to those who are just above (and therefore ineligible). A potential problem with this strategy is that it implicitly assumes that families cannot game the system by reducing their incomes in order to become eligible for the program. Consistent with other studies, they find positive effects of Head Start attendance on adolescents including reductions in behavior problems, grade repetition, depression, and obesity.
Since its inception, Head Start has aimed to improve a broad range of child outcomes (not only test scores). When the program was launched in 1965, the Office of Economic Opportunity assisted the 300 poorest counties in applying for Head Start funds, and these counties were significantly more likely than other counties to receive funds. Using a regression discontinuity design, Ludwig and Miller (2007) show that mortality from causes likely to be affected by Head Start fell among children 5 to 9 in the assisted counties relative to the others. Mortality did not fall in slightly older cohorts who would not have been affected by the introduction of the program.
Frisvold (2006) and Frisvold and Lumeng (2009) also focus on health effects by examining the effect of Head Start on obesity. The former instruments Head Start attendance using the number of Head Start places available in the community, while the later takes advantage of a cut in a Michigan Head Start program which resulted in the conversion of a number of full-day Head Start places to half day places. Both studies find large and significant effects of Head Start on the incidence of obesity. In defense of their estimates, which some might find implausibly large, Frisvold and Lumeng point out that a reduction of only 75 calories per day (i.e. less than a slice of bread or an apple) would be sufficient to yield their results. In small children, even small changes in diet may have large cumulative effects. Anderson et al. (2009) follow Garces et al. and use sibling fixed effects and data from the PSID to estimate the effect of Head Start on smoking as an adult. Again, they find large effects.
Head Start has served as a model for state preschools targeted to low-income children in states such as California, and also for new (non-compulsory) universal preschool programs in Georgia, and Oklahoma. The best available evaluations of universal preschool programs highlight the importance of providing a high quality program that is utilized by the neediest children. Baker et al. (2008) examine the introduction of a universal, $5 per day (later $7), preschool program in the Canadian province of Quebec. The authors find a strong response to the subsidy in terms of maternal labor supply and the likelihood of using care, but they find negative effects on children for a range of outcomes. Lefebvre et al. (2006) focus on the same natural experiment and examine the effects on children’s vocabulary scores, which have been shown to be a good predictor of schooling attainment in early grades. They find strong evidence of negative effects. In interpreting this study, it is important to consider who was affected by the program. Because poor children were already eligible for child care subsidies, the marginal child affected by this program was a child who probably would have stayed home with his or her middle-class, married, mother, and instead was put into child care. Moreover, the marginal child care slot made available by the program was of low quality—the sudden influx of children into care caused the province to place more emphasis on making slots available than on regulating their quality. Hence, the study should be viewed as the consequence of moving middle class children from home care to relatively poor quality care. It is not possible to draw any conclusion from this study about the effect of drawing poor children into care of good quality, which is what model preschool programs and Head Start aim to do.
Gormley and Gayer (2006) examine the effects of Oklahoma’s universal pre-K program, which is run through the public schools and is thought to be of high quality. They take advantage of strict age cutoffs for the program and compare children who had just attended for a year to similar children who were ineligible to attend because they were slightly younger. They find a 52% gain in pre-reading skills, a 27% gain in pre-writing skills, and a 21% gain in pre-math skills. These results suggest that a high quality universal pre-K program might well have positive effects, though one would have to track children longer to determine whether these initial gains translate into longer term gains in schooling attainment. Several other recent studies use a similar regression discontinuity design, including Hustedt et al. (2008) and Wong et al. (2008) who examine state pre-K programs in five states. These studies find uniformly positive effects. It has been argued in fact, that the effects of quality state preschool programs are larger than those of Head Start. However, it is difficult to control for pre-existing differences between the Head Start children and children who attend other preschools. For example in Magnuson et al. (2007), the preschool children had systematically higher incomes than those who attended Head Start.
A handful of studies examine the long-term effects of public pre-school or kindergarten programs. Cascio (2009) uses data from four decennial censuses to analyze the impact of introducing kindergarten into public schools in the US, where kindergarten was phased in on a state-by-state basis. Using a cohort-based design, she finds that white children born in adopting states after the reform were less likely to dropout of high school and less likely to be institutionalized as adults. However, she finds no significant effect for blacks, which may be due to significant crowd out of blacks from other programs, such as Head Start. Like Anderson, she finds that the effects were larger for girls. Havnes and Mogstad (2009) study a 1975 policy change in Norway which increased the availability of regulated child care in some areas but not in others. They find that children “exposed” to more child care received more education and were more likely to have earnings as adults. Once again, much of the benefit was concentrated among females, and children of less educated mothers were particularly likely to benefit. In terms of mechanisms, they find that the increase in formal care largely displaced informal care, without much net effect on the mother’s labor force participation.
Finally, it is worth mentioning the “Sure Start” program in England and Wales. This program aimed to provide early intervention services in disadvantaged neighborhoods but allowed a wide variety of program models, which obviously complicates an assessment of the program. An evaluation was conducted by comparing communities that were early adopters to those that adopted later. A second evaluation compared Sure Start children to children from similar neighborhoods who were drawn from the Millennium Cohort study. This second study used propensity scores to balance the samples. The first evaluation found that the most disadvantaged households were actually doing more poorly in intervention areas than in other areas (NESS, 2005), while the second found some evidence of positive effects (NESS, 2008). Following the first evaluation, there has been a move to standardize the intervention and most communities are now offering Sure Start Children’s Centers. This latest incarnation of the program remains to be evaluated.
This discussion shows the value of using a framework for the production of child quality as a lens for the interpretation of the program evaluation literature. As discussed above, child human capital is produced using inputs that may come from either the family or from other sources. A program that augments the resources available to the child is likely to have positive effects (subject of course to diminishing returns), while a program that reduces the resources available to the child is likely to have negative effects. Hence, a program that causes poor quality group time to be substituted for relatively high quality maternal time can have a negative effect and vice versa. The important point is that it is possible to intervene effectively and to improve the trajectories of young children.
5.3.4 Health insurance
Health insurance is not an intervention program in the sense of the programs described above. Yet, there is a good deal of evidence that access to health insurance improves children’s health at birth and afterwards. Much of the evidence comes from studies of the introduction, or expansion, of health insurance benefits. Some of this literature is summarized in Table 13. For example, Hanratty (1996) examined the introduction of public health insurance in Canada, which was phased in on a province-by-province basis. Using county-level panel data, she finds that the introduction of health insurance was associated with a decline of four percent in the infant mortality rate, and that the incidence of low birth weight also decreased by 1.3% for all parents and by 8.9% for single parents. Currie and Gruber (1996) conduct a similar exercise for the US, focusing on an expansion of public health insurance to pregnant women and infants. They find that the effects vary depending on whether the expansion covered the poorest women, or women somewhat higher in the income distribution. Narrowly targeted expansions that increased the fraction of the poorest women eligible by 30%, reduced low birth weight by 7.8%, and reduced infant mortality by 11.5%. Expansions of eligibility of a similar magnitude to women of higher incomes had very small effects on the incidence of low birth weight, but reduced infant mortality. This result suggests that among women of somewhat higher income levels, the expansions did not improve health at birth, but may have increased access to life-saving technologies after birth. Currie and Grogger (2002) focus on bureaucratic obstacles to obtaining health insurance by looking at contractions of welfare (women cut from the rolls lost automatic eligibility for Medicaid) as well as outreach measures undertaken by different states. They find that changes that reduced barriers to enrollment increased use of prenatal care and had positive effects on infant health outcomes.
Table 13
Effects of Medicaid and other public health insurance on birth and early childhood outcomes.
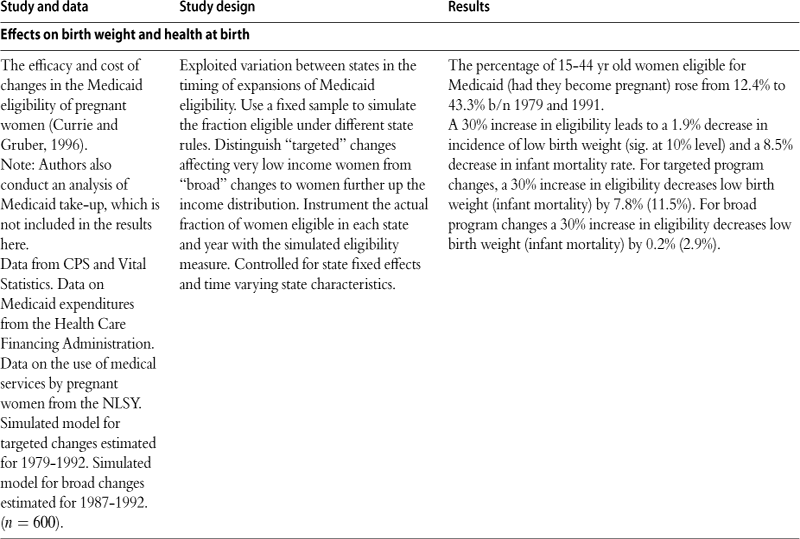
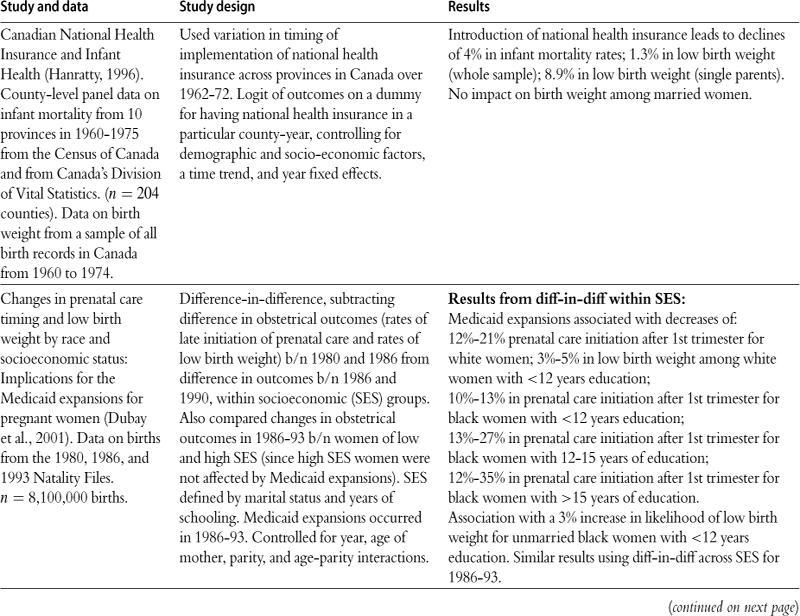
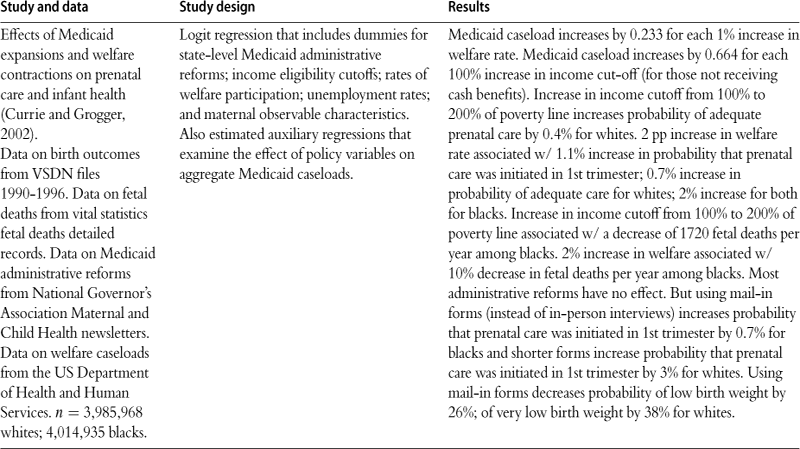
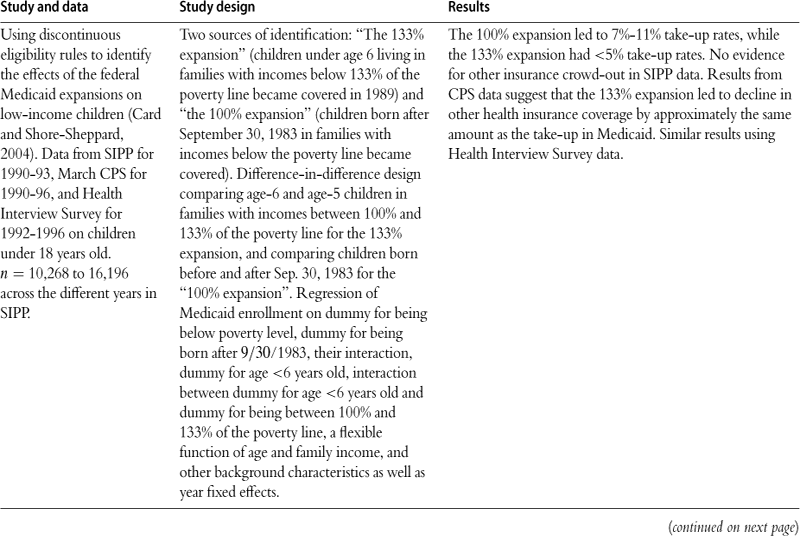
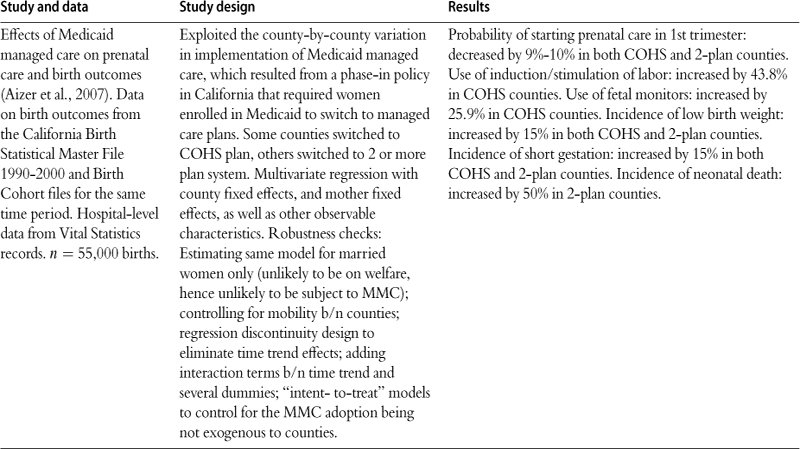
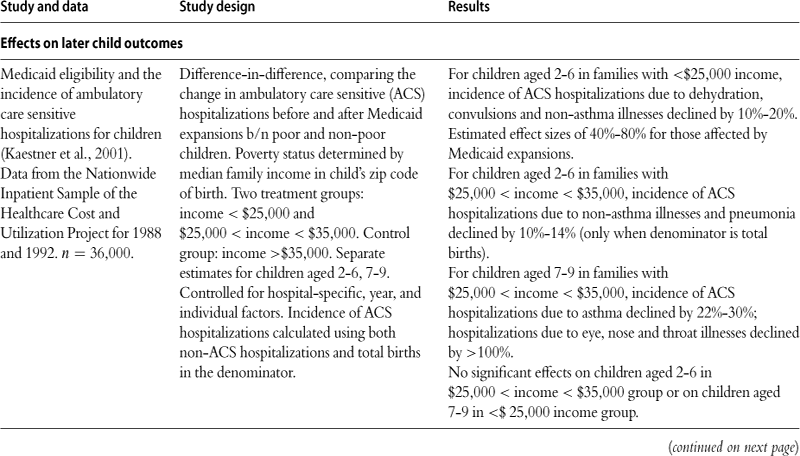
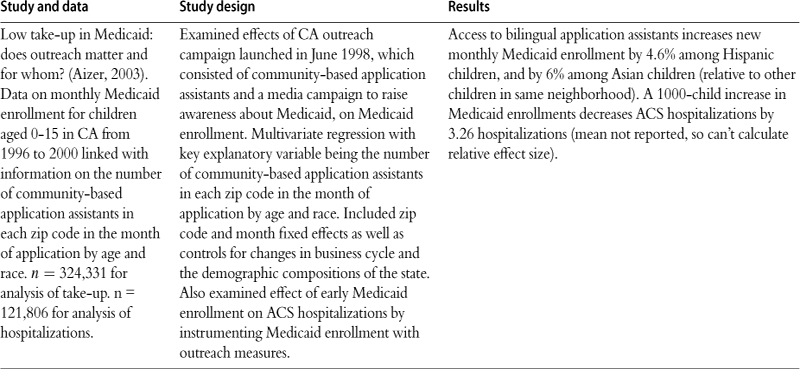
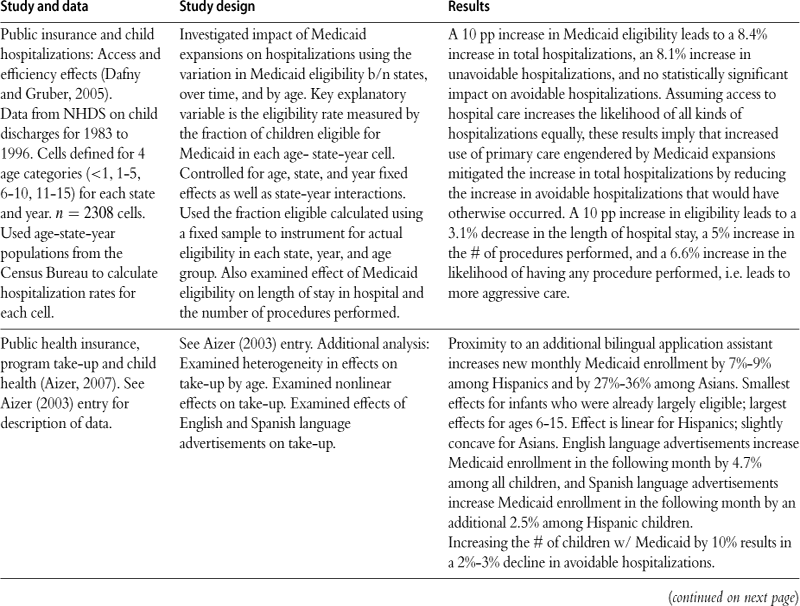
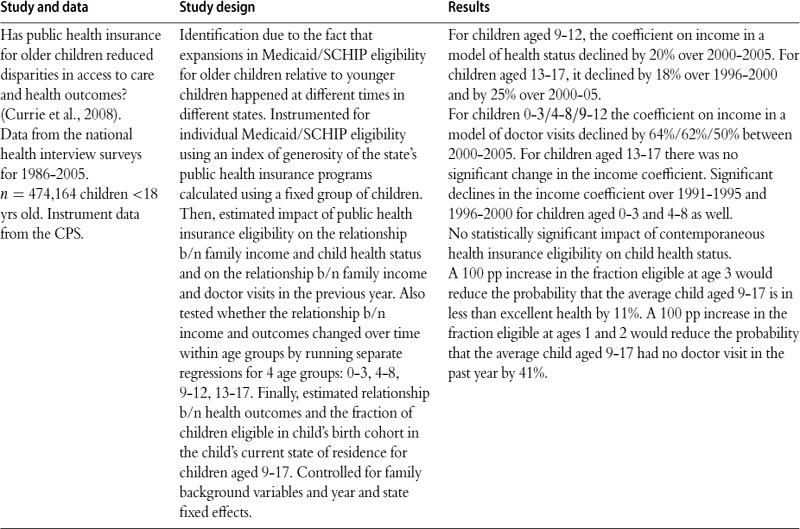
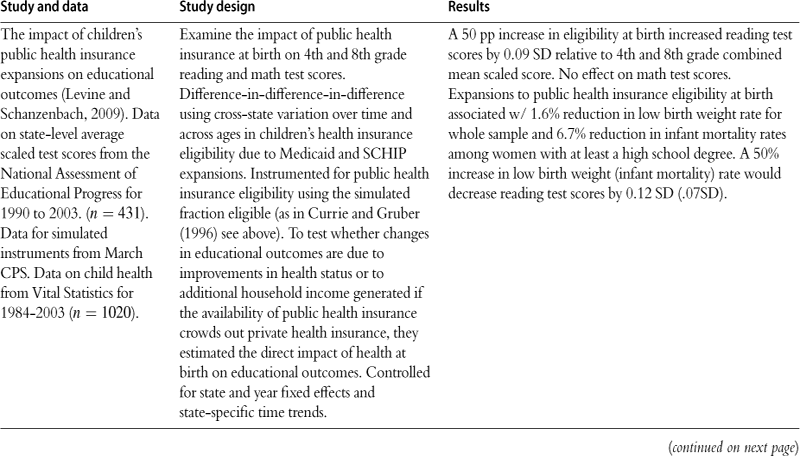
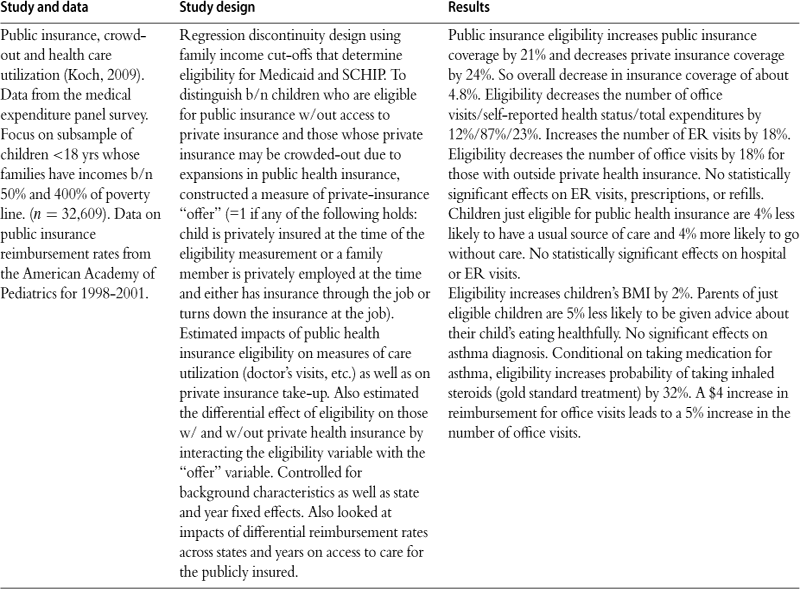
Percent changes (denoted by % instead of ”pp”) are reported relative to the mean.
Baldwin et al. (1998) use individual-level data and compare expansions in Washington, which included enhanced prenatal care services, to expansions in Colorado which did not, in a difference-in-differences design. They find reductions in low birth weight among medically high risk infants in Washington. Dubay et al. (2001) conduct a difference-in-difference investigation comparing the outcomes of high and low socioeconomic status women in the 1980–1986 period and in the 1986–1993 period. They find overall improvements in the use of prenatal care for low SES women, but find improvements in birth weight only for some groups of white women. However, this design does not really focus on health insurance per se, since the estimates will be affected by any other changes in health care markets between the two periods that had differential effects by SES.
Studies of the effects of health insurance expansions on children often examine preventable hospitalizations (also called ambulatory care sensitive hospitalizations). The idea is that certain conditions, such as childhood asthma, should not result in hospitalizations if they are properly treated on an outpatient basis. Hence, hospitalizations for these conditions are inefficient and indicate that children are receiving inadequate preventive care. Kaestner et al. (2001) use a difference-in-differences design comparing low income and other children before and after Medicaid expansions. They find reductions in preventable hospitalizations of 10% to 20%.
Aizer (2003) examines a California outreach program that increased child enrollments into Medicaid. She finds that an increase in enrollments of 1000 reduces hospitalizations by 3.26. Dafny and Gruber (2005) use a design similar to Currie and Gruber in which actual individual eligibility is instrumented using a “simulated eligibility measure” which is an index of the generosity of the Medicaid program in the state. The reason for adopting instrumental variables estimation is that eligibility for Medicaid is determined by endogenous variables such as parental labor supply. They find that Medicaid eligibility increased hospitalizations overall. However, there was no statistically significant increase in avoidable hospitalizations, suggesting that the increase was mainly due to children with unavoidable conditions gaining greater access to care. They also found increases in the probability of receiving a procedure and reductions in length of stay, suggesting that children who were hospitalized were receiving more aggressive care and that it may have improved their outcomes.
One difficulty with studying child health is that health today is affected by past investments, including health insurance at younger ages. Currie et al. (2008) therefore compare the health effects of contemporaneous eligibility for health insurance among older children to the effect of having been eligible since birth. They find that contemporaneous health insurance coverage has little effect on health status but that eligibility from birth is protective. Levine and Schanzenbach (2009) link health insurance eligibility at birth to 4th and 8th grade scores on the National Assessment of Educational Progress. They find that a 50% point increase in eligibility at birth is associated with a small but significant gain on reading scores at both grades, though there is no effect on math scores. A difficulty with both studies is that neither income at birth nor state of birth are directly observed in the cross sectional data sets that they use, so they must be imputed using current income and state of birth.
Another area of research focuses on the quality of care provided by public health insurance programs. Analysis of this issue is complicated by the possibility that expansions of public insurance cause people to lose private health insurance coverage, a phenomena dubbed “crowdout” (Cutler and Gruber, 1996; Dubay and Kenney, 1997; Card and Shore-Shepard, 2004; Gruber and Simon, 2008). If the private insurance that is lost (or dropped) in response to expansions of public insurance is of superior quality to the private insurance, then people’s health may suffer. Koch (2009) concludes that recent expansions of public health insurance to children at higher income levels have reduced access to doctor’s office visits and increased reliance on emergency rooms. He also shows some evidence consistent with the idea that this is because children are being crowded out of superior (but obviously more expensive) coverage from private heath insurance plans. In fact, it is quite possible that crowding out has increased over time as the public has become familiar with public health insurance plans for children and private health insurance costs have continued to escalate.
Medicaid managed care has also been shown (in at least some cases) to reduce the quality of care. Sloan et al. (2001) conduct a difference-in-difference analysis of Tennessee and North Carolina before and after Tennessee switched its Medicaid patients to managed care. They find that use of prenatal care and birth outcomes deteriorated in Tennessee after the switch. Aizer et al. (2007) examine data from California, where Medicaid managed care was adopted on a county-by-county basis. They also find that compulsory managed care had a negative impact on use of prenatal care and birth outcomes. This may be because the California Medicaid managed care program “carved out” care for sick newborns-that is, they were covered by a state fund rather than by the managed care companies so that companies had little incentive to take actions to improve newborn health.
In summary, health insurance matters for children’s outcomes. But quality of care also matters. And it is important to remember that for most children threats to health and well being come from sources such as injuries, poor nutrition, and toxins rather than only from lack of access to medical care.
6 Discussion and conclusions
There has been an explosion of research into the early determinants of human capital development over the past 10 years. The work surveyed in this chapter conclusively shows that events before five years old can have large long term impacts on adult outcomes. It is striking that child and family characteristics measured at school entry do as much to explain future outcomes as factors that labor economists have more traditionally focused on, such as years of education. Yet evidence for long term effects of early insults should not be a cause of pessimism. While children can be permanently damaged at this age, the damage can be remediated. The picture that emerges is one of vulnerability but also of resilience.
Since early childhood is a new area of research for economists, there remain many unanswered questions. One major question implicit in the structure of this chapter is whether it will ever be possible to estimate human capital production functions. The opening sections of this chapter showed that the production function paradigm provides an extremely useful way of thinking about the problem, and in particular, that it highlights the importance of actions taken by parents and others in exacerbating or mitigating the effects of random shocks. However, to actually estimate the implied production functions would place huge demands on the data, demands that are unlikely to be met in practice.15 Hence, the evidence we have surveyed is largely reduced form.
A second major question is whether shocks at certain key ages matter more than others? Much has been written about “critical periods”. The idea is that certain functionalities must be acquired at a particular point in life, and if they are not acquired at that point, they will either not be acquired at all, or will not be acquired properly. There is to date little hard evidence of critical periods in humans. However, the evidence discussed above certainly suggests that the period while children are in utero is one of the most important to their later development. This has important implications for the timing of social interventions designed to mitigate harms—it may be that interventions should be targeted at pregnant women and/or women of child bearing age in addition to young children. But there is insufficient evidence at present to be able to say that insults or interventions at for example zero to one are likely to be more effective than interventions at age three or four. Moreover, the cohort designs used to establish the importance of the fetal period can tell us more about the comparison between the fetal period and the early post natal period than they do about the comparison between the fetal period and say exposures at age five.
A related question is whether some types of shocks matter more than others. This chapter surveyed many different types of shocks including exposure to disease, inadequate nutrition, exposure to pollution, injuries, maternal mental health problems, maternal smoking, and maltreatment. However, given that studies of the effects of these shocks rely on different populations, time periods, and methods, it is difficult to get any sense of whether one type of shock is more of a threat to human capital development than any other. Similarly, while it is clear that shocks to health have long-term effects on domains such as education and earnings, it is not clear whether health shocks have direct effects on cognition or learning, or whether they act mainly by affecting future health.
Several studies we reviewed suggested that both shocks and interventions can have different long-term effects on males and females. But these findings are too new for us to be able to predict when this difference will occur, and we have virtually no evidence about why it occurs. One possibility is that gender differences are biological. For example, boys may be less robust than girls so that the same health shock can “cull” boys while girls survive (e.g., see Kraemer (2000); Almond and Mazumder (2008)). In this case, average health of male survivors might be better than that of female survivors. Alternatively, gender differences could reflect differential parental or societal responses to shocks inspired by son preferences or by beliefs about biological gender differences.16
Finally, given all of this evidence of long-term effects of early life outcomes, what is the least costly way to intervene to improve outcomes? This is still an open question and our knowledge of the types of programs that are effective (and why) is evolving rapidly. For example, until recently, there was little evidence that income transfers had much effect, so it was easy to surmise that in-kind programs were a more effective way to improve child outcomes. Recent evidence that cash transfers are indeed effective should cause a re-evaluation of the received wisdom on this point, given the inefficiencies involved in providing transfers in-kind. Similarly, the large literature about negative effects of maternal employment in the early years is thrown into question by recent studies showing that large changes in maternity leave policies affected maternal employment without having any detectable impact on long-term child outcomes. This rapid development in our knowledge makes the study of human capital development before five an exciting frontier for research in labor economics.
Appendix A
The following acronyms are used in this chapter:
AFDC = Aid to Families with Dependent Children
BCS = British Birth Cohort Study of 1970.
BPI = Behavioral Problems Index
BW = birth weight
CESD = Center for Epidemiological Depression scale
CCT = Conditional Cash Transfer
COHS = County Organized Health System
CPS = Current Population Survey
DDST = Denver Developmental Screening Test
ECLS-B = Early Childhood Longitudinal Study—Birth Cohort
ECLS-K = Early Childhood Longitudinal Study—Kindergarten Class of 1998–1999
EITC = Earned Income Tax Credit
EPA = US Environmental Protection Agency
FSP = Food Stamp Program
HAZ = Height for age
z-score
HOME = Home Observation for Measurement of the Environment Score
IHDP = Infant Health and Development Project
IPUMS = Integrated Public-Use Microdata Samples of the US Census
IV = instrumental variables
LBW = Low Birth Weight (birth weight less than 2500 g)
MMC = Medicaid Managed Care
NBER = National Bureau of Economic Research
NCDS = National Child Development Survey (1958 British Birth Cohort)
NELS = National Education Longitudinal Study
NHANES = National Health and Nutrition Examination Survey
NHDS = National Hospital Discharge Survey
NLSY = National Longitudinal Survey of Youth, 1979 cohort
NLSY-Child = Children of the NLSY 1979 cohort
NLSCY = National Longitudinal Survey of Children and Youth (Canadian)
PIAT = Peabody Individual Achievement Test
pp = percentage points
PPVT = Peabody Picture Vocabulary Test
NSLP = National School Lunch Program
OLS = Ordinary Least Squares
PNM = Post Neonatal Mortality (death after 28 days and before 1 year)
PSID = Panel Study of Income Dynamics
RDA = Recommended Dietary Allowance
REIS = Regional Economic Information System
SCHIP = State Child Health Insurance Program
SD = Standard Deviation
SES = Socio-economic Status
SGA = Small for Gestational Age
SIPP = Survey of Income and Program Participation
SNAP = Supplemental Nutrition Assistance Program (formerly, Food Stamps)
TSIV = Two Sample Instrumental Variables
TVIP = Spanish-speaking version of the Peabody Picture Vocabulary Test
TSP = Total Suspended Particles
USDA = US Department of Agriculture
VSDN = Vital Statistics Detailed Natality files (birth certificate data for US)
WIC = Special Supplemental Nutrition Program for Women, Infants, and Children
WPPSI = Wechsler Preschool and Primary Scale of Intelligence
Appendix B
Human capital of a child is produced with a CES technology:
![]() (9)
(9)
where μg is an exogenous shock to (predetermined) period 1 investments. Parents value their consumption and the human capital of their child:
![]() (10)
(10)
and have the budget constraint:
![]()
Absent discounting, the marginal utility from consuming equals the marginal utility from investing:
![]()
![]() (11)
(11)
![]() (12)
(12)
![]() (13)
(13)
![]() (14)
(14)
![]()
 (15)
(15)
using the implicit function theorem and defining a to be (1 − γ)Aψ ≥ 0.
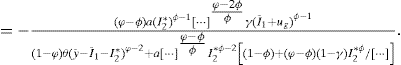 (16)
(16)
For ψ > ϕ, (16) is positive, so negative shocks in the first period should be reinforced. Accommodation through preferences (i.e., more consumption and less investment, which lowers h in addition to that caused by μg) is optimal.
Appendix C
Sibling a has human capital ha, which is affected by a period 1 investment shock of μg:
![]() (17)
(17)
Sibling b does not experience a shock to first period investments:
![]() (18)
(18)
Assume further that first period investments do not distinguish between the two siblings (absent the shock experienced by sibling a):
![]()
Parents have Cobb-Douglas utility that cares only about the human capital of their two children:
![]() (19)
(19)
The parents exhaust their budget on investments in their children:
![]()
Denoting ![]() as the budget for second period investments,
as the budget for second period investments, ![]()
To maximize utility, the marginal utilities from investing in siblings a and b should be equal:
![]()
![]()
![]() (20)
(20)
![]()
![]() (21)
(21)
![]()
![]() (22)
(22)
using budget the constraint: ![]() By the implicit function theorem:
By the implicit function theorem:
![]() (23)
(23)
![]() (24)
(24)
![]()
 (25)
(25)
 (26)
(26)
 (27)
(27)
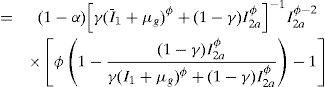
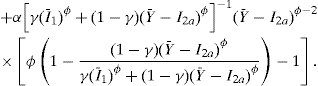 (28)
(28)
Because ϕ ≤ and:
![]()
Eq. (28) is always negative. Therefore:
![]()
We consider three cases for the substitutability of period 1 and period 2 investments (as captured by ϕ):
1. Good Substitutability Between Periods 1 and 2 When ϕ > 0, the optimal I2a moves in the opposite direction from μg and parents should compensate a negative shock to child a by reducing second period investments in child b. Intuitively, it is easier to substitute though the production function for human capital than it is through the Cobb-Douglas utility function.
2. Cobb-Douglas Substitutability Between Periods 1 and 2 For ϕ = 0, the elasticity of substitution between periods is the same as the elasticity of substitution in preferences between the children (both Cobb-Douglas). Here, there is no winning investment response to the shock to child a, i.e. ![]() so period 2 investments should be left unchanged.
so period 2 investments should be left unchanged.
3. Poor Substitutability Between Periods 1 and 2 For ϕ < 0, it is difficult to repair damage from a negative μg shock in the second period, so the return to period 2 investments in sibling a is below that for sibling b. Therefore, parents should reinforce the first period shock by allocating second period investments away from sibling a.
Importantly, the direction of these investment responses did not depend on α, the relative weight parents place in their utility function on the human capital of child a versus child b. Favoring the human capital formation of a particular child—even the child that experiences the negative endowment shock—does not affect the direction of the optimal investment response. Nor do differences in the “overall” productivity of the child, i.e. efficiency parameter A ≠ B in Eqs (17) and (18), alter the direction of the optimal investment response to μg. Thus, empirical evidence suggesting either reinforcing or compensating investments within the family does not reveal information on parental preferences absent additional information on the production function for human capital.
Appendix D
In general, we need to observe the baseline investments ![]() and
and ![]() to estimate parameters of the production function ϕ and γ. However, nearly all datasets with measures of human capital h and an observable investment shock μg lack measures of human capital investments
to estimate parameters of the production function ϕ and γ. However, nearly all datasets with measures of human capital h and an observable investment shock μg lack measures of human capital investments ![]() and
and ![]() . We can still make progress in estimating parameters of the production function despite not observing
. We can still make progress in estimating parameters of the production function despite not observing ![]() and
and ![]() , so long as we expect baseline investment levels to be similar:
, so long as we expect baseline investment levels to be similar: ![]() ≅
≅ ![]() . For μg = μ′g,17 Eq. (4) reduces to:
. For μg = μ′g,17 Eq. (4) reduces to:
![]() (29)
(29)
That is, we can observe damage to h from the shock μ′g in second period investments relative to the damage from the first period shock μg, which isolates γ (while remaining silent on the magnitude of ϕ).
With an estimate of γ in hand, we can then estimate ϕ by using the total derivative in investment shocks, i.e. how human capital changes as we change both first and second period investments (by an equal amount). In an overlapping generations framework, this would require a shock lasting two childhood periods (or longer), and “half-exposed” cohorts on either end of the shock. Damage to the fully exposed cohort relative to the cohort exposed in period 1 alone is:
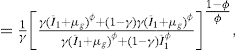 (30)
(30)
using the assumption that ![]() =
= ![]() and μg = μ′g,
and μg = μ′g,
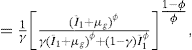 (31)
(31)
 (32)
(32)
 (33)
(33)
Similarly, damage to the “doubly exposed” cohort relative to that experiencing a shock in just the second childhood period is:
 (34)
(34)
Eqs (33) and (34) constitute two equations in the two unknowns ![]() and ϕ, with γ known from Eq. (29).
and ϕ, with γ known from Eq. (29).
References
1. 2001. 2001. An overstretched hypothesis? The Lancet 357 (9254), 405.
2. Agüero, Jorge M., Carter, Michael R., Woolard, Ingrd, 2009. The impact of unconditional cash transfers on nutrition: the South African child support grant. Manuscript, February.
3. Aizer Anna. Low take-up in Medicaid: does outreach matter and for whom? American Economic Review Papers and Proceedings. 2003;93(2):238–241.
4. Aizer Anna. Public health insurance, program take-up and child health. The Review of Economics and Statistics. 2007;89(3):400–415.
5. Aizer Anna, Currie Janet, Moretti Enrico. Does managed care hurt health? Evidence from Medicaid mothers. The Review of Economics and Statistics. 2007;89(3):385–399.
6. Aizer, Anna, Stroud, Laura, 2009. Education, medical knowledge and the evolution of disparities in health. manuscript, Brown University, September.
7. Aizer, Anna, Stroud, Laura, Buka, Stephen, 2009. Maternal stress and child well-being: evidence from siblings. manuscript. Brown University, February.
8. Almond Douglas. Is the 1918 Influenza Pandemic over? Long-term effects of in utero influenza exposure in the post-1940 US population. Journal of Political Economy. 2006;114(4):672–712.
9. Almond Douglas, Chay Kenneth Y, Lee David S. The costs of low birth weight. The Quarterly Journal of Economics. 2005;120(3):1031–1084.
10. Almond Douglas, Edlund Lena, Palme Marten. Chernobyl’s subclinical legacy: prenatal exposure to radioactive fallout and school outcomes in sweden. Quarterly Journal of Economics. 2009;124(4):1729–1772 URL http://www-mitpressjournals-org/doi/abs/10-1162/qjec-2009-124-4-1729.
11. Almond Douglas, Hoynes Hilary W, Schanzenbach Diane Whitmore. Inside the war on poverty: the impact of food stamps on birth outcomes. The Review of Economics and Statistics 2010.
12. Almond Douglas, Mazumder Bhashkar. The 1918 influenza pandemic and subsequent health outcomes: an analysis of SIPP data. American Ecnomic Review, Papers and Proceedings. 2005;95.
13. Almond, Douglas, Mazumder, Bhashkar, 2008. Health capital and the prenatal environment: the effect of maternal fasting during pregnancy. Working Paper 14428, National Bureau of Economic Research, October, URL http://www.nber.org/papers/w14428.
14. Kathryn Anderson H, Foster James E, Frisvold David E. Investing in health: the long-term impact of Head Start on smoking. Western Economic Association International: Working Paper 1465–7295; 2009.
15. Anderson Michael. Multiple inference and gender differences in the effects of early intervention: a reevaluation of the Abecedarian, Perry Preschool, and Early Training projects. Journal of the American Statistical Association. 2008;103(484):1481–1495.
16. Angrist Joshua D, Pischke Jörn-Steffen. Mostly Harmless Econometrics: an Empiricist’s Companion. Princeton, New Jersey: Princeton University Press; 2009;.
17. Aos, Steve, Lieb, Roxanne, Mayfield, Jim, Miller, Marna, Pennucci, Annie, 2004. Benefits and costs of prevention and early intervention programs for youth. Technical appendix, Washington State Institute for Public Policy, September.
18. Ashenfelter Orley, Rouse Cecilia. Income, schooling, and ability: evidence from a new sample of identical twins. Quarterly Journal of Economics. 1998;113(1):253–284 URL http://www-mitpressjournals-org/doi/abs/10-1162/003355398555577.
19. Baker Kevin. Do cash transfer programs improve infant health: evidence from the 1993 expansion of the earned income tax credit. University of Notre Dame: Manuscript; 2008.
20. Baker Michael, Gruber Jonathan, Milligan Kevin. Universal child care, maternal labor supply, and family well-being. Journal of Political Economy. 2008;116(4):709–745 URL http://www.joumals.uchicago.edu/doi/abs/10.1086/591908.
21. Baker Michael, Milligan Kevin. Evidence from maternity leave expansions of the impact of maternal care on early child development. Journal of Human Resources. 2010;45(1):1–32.
22. Baldwin Laura-Mae, Larson Eric H, Connell Frederick A, et al. The effect of expanding Medicaid prenatal services on birth outcomes. American Journal of Public Health. 1998;88(11):1623–1629.
23. Banerjee Abhijit, Duflo Esther, Postel-Vinay Gilles, Watts Timothy. Long run health impacts of income shocks: wine and phylloxera in 19th century France. The Review of Economics and Statistics 2010.
24. Banzhaf Spencer, Walsh Randall P. Do people vote with their feet? an empirical test of tiebout. American Economic Review. 2008;98(3):843–863.
25. Barker DJP. Fetal and infant origins of adult disease. British Medical Journal 1992.
26. Barnett WS, Masse Leonard N. Comparative cost-benefit analysis of the Abecedarian program and its policy implications. Economics of Education Review. 2007;26:113–125.
27. Barnett Steven, Belfield Clive R, Nores Milagros, Schweinhart Lawrence. The High/Scope Perry Preschool program: cost-benefit analysis using data from the age-40 follow-up. The Journal of Human Resources. 2006;41(1):162–190.
28. Barreca Alan. The long-term economic impact of in utero and postnatal exposure to malaria. Journal of Human Resources. 2010;45(4):865–892.
29. Basiotis Peter, Kramer-LeBlanc Carol S, Kennedy Eileen T. Maintaining nutrition security and diet quality: the role of the Food Stamp program and WIC. Family Economics. 1998;11(1–2):4–16.
30. Baten, Jorg, Crayen, Dorothee, Voth, Joachim, 2007. Poor, hungry and stupid: numeracy and the impact of high food prices in industrializing Britain, 1780–1850. Economics Working Papers 1120, Department of Economics and Business, Universitat Pompeu Fabra, October. URL http://ideas.repec.org/p/upf/upfgen/1120.html.
31. Baum Charles L. The effects of food stamp benefits on weight gained by expectant mothers. Institute for Research on Poverty, September: Discussion Paper 1343–08; 2008.
32. Becker Gary, S, Tomes Nigel. Child endowments and the quantity and quality of children. The Journal of Political Economy. 1976;84(4):S143–S162.
33. Behrman Richard, E, Butler Adrienne S. Preterm Birth: Causes, Consequences, and Prevention Institute of Medicine Report. National Academies Press 2007.
34. Behrman Jere, R, Pollak Robert A, Taubman Paul. Parental preferences and provision for progeny. Journal of Political Economy. 1982;90(1):52–73.
35. Behrman Jere R, Rosenzweig Mark R. Returns to birthweight. The Review of Economics and Statistics. 2004;86(2):586–601.
36. Behrman Jere R, Rosenzweig Mark R, Taubman Paul. Endowments and the allocation of schooling in the family and in the marriage market: the twins experiment. Journal of Political Economy. 1994;102(6):1131–1174.
37. Van Den Berg Gerard J, Lindeboom Maarten, Portrait France. Economic conditions early in life and individual mortality. American Economic Review. 2006;96(1):290–302.
38. Van Den Berg, Gerard J., Lindeboom, Maarten, Portrait, France, 2010. Long-run longevity effects of a nutritional shock early in life: the Dutch potato famine of 1846–1847-Journal of Health Economics (in press).
39. Berger Lawrence, M, Hill Jennifer, Waldfogel Jane. Maternity leave, early maternal employment, and child health and development in the us. The Economic Journal. 2005;115:F29–F47.
40. Berger Lawrence M, Paxson Christina, Waldfogel Jane. Income and child development. Children and Youth Services Review. 2009;31(9):978–989.
41. Bingley, Paul, Walker, Ian, 2007. There’s no such thing as a free lunch: altruistic parents and the response of household food expenditures to nutrition program reforms. Discussion Paper 2007–19, University College Dublin Geary Institute, June.
42. Bitler Marianne, Currie Janet. Does WIC work? the effect of WIC on pregnancy and birth outcomes. Journal of Policy Analysis and Management. 2005;24(1):73–91.
43. Black Maureen, M, Cutts Diana B, Frank Deborah A, et al. Special supplemental nutrition program for women, infants, and children participation and infants’ growth and health: a multi-site surveillance study. Pediatrics. 2004;114(1):169–176.
44. Black Sandra E, Devereux Paul J, Salvanes Kjell G. The more the merrier? The effect of family size and birth order on children’s education. Quarterly Journal of Economics. 2005;120(2):669–700.
45. Black Sandra E, Devereux Paul J, Salvanes Kjell G. From the cradle to the labor market? The effect of birth weight on adult outcomes. Quarterly Journal of Economics. 2007;122(1):409–439.
46. Blanden, Jo, Gregg, Paul, MacMillan, Lindsey, 2006. Explaining intergenerational income persistence: noncognitive skills, ability and education. CMPO Working Paper Series 06/146, University of Bristol, The Centre for Market and Public Organisation, April. URL www.bris.ac.uk/Depts/CMPO.
47. Blau David, Currie Janet. Pre-school, day care, and after-school care. Who’s minding the kids?. 2006;2:1163–1278.
48. Bleakley Hoyt. Disease amd development: evidence from hookworm eradication in the south. The Quarterly Journal of Economics. 2007;122(1):73.
49. Blow, Laura, Walker, Ian, Zhu, Yu, 2005. Who benefits from child benefit. manuscript, February.
50. Blundell Richard. Earned income tax credit policies: impact and optimality: the Adam Smith lecture, 2005. Labour Economics (ISSN: 0927–5371). 2006;13(4):423–443 European Association of Labour Economists, 2nd World Conference SOLE/EALE, Fairmont Hotel San Francisco, USA, 2–5 June 2005.
51. Boyer George R. An Economic History of the English Poor Law. Cambridge, 1750–1850: CUP; 1990.
52. Bozzoli, Carlos, Deaton, Angus S., Quintana-Domeque, Climent, 2010. Child mortality, income and adult height. NBER Working Paper No. 12966, March. Demography (forthcoming).
53. Brooks-Gunn Jeanne, Markham Lisa B. The contribution of parenting to ethnic and racial gaps in school readiness. The Future of Children. 2005;15(1):139–168.
54. Butler JS, Raymond Jennie E-. The effect of the Food Stamp program on nutrient intake. Economic Inquiry. 1996;34:781–798.
55. Card David, Shore-Sheppard Laura. Using discontinuous eligibility rules to identify the effects of the federal Medicaid expansions on low-income children. Review of Economics and Statistics. 2004;86(3):752–766.
56. Carneiro, Pedro, Ginja, Rita, 2008. Preventing behavior problems in childhood and adolescence: evidence from Head Start. manuscript, March.
57. Cascio, Elizabeth, U., 2009. Do investments in universal early education pay off? long-term effects of introducing kindergartens into public schools. Working Paper 14951, National Bureau of Economic Research, May.
58. Case Anne, Fertig Angela, Paxson Christina. The lasting impact of childhood health and circumstance. Journal of Health Economics. 2005;24:365–389.
59. Case Anne, Lee Diana, Paxson Christina. The income gradient in children’s health: a comment on Currie, Shields, and Wheatley price. Journal of Health Economics. 2008;27(3):801–807.
60. Case Anne, Lubotsky Darren, Paxson Christina. Economic status and health in childhood: the origins of the gradient. American Economic Review. 2002;92(5):1308–1334.
61. Case Anne, Paxson Christina. Height, health, and cognitive function in old age. American Economic Review: Papers & Proceedings. 2008a;98(2):463–467.
62. Case Anne, Paxson Christina. Stature and status: height, ability, and labor market outcomes. Journal of Political Economy. 2008b;116(3):499–532.
63. Case Anne, Paxson Christina. Early life health and cognitive function in old age. American Economic Review Papers and Proceedings. 2009;99(2):104–109.
64. Case, Anne, Paxson, Christina, 2010a. Causes and consequences of early life health. Working Paper 15637, National Bureau of Economic Research, January. URL http://www.nber.org/papers/w15637.
65. Case, Anne, Paxson, Christina, 2010b. The long reach of childhood health and circumstance: evidence from the Whitehall II study. Working Paper 15640, National Bureau of Economic Research, January. URL http://www.nber.org/papers/w15640.
66. Chatterji Pinka, Brooks-Gunn Jeanne. Wic participation, breastfeeding practices, and well-child care among unmarried, low-income mothers. American Journal of Public Health. 2004;94(8):1324–1327.
67. Chatterji, Pinka, Markowitz, Sarah, 2000. The impact of maternal alcohol and illicit drug use on children’s behavior problems: evidence from the children of the national longitudinal survey of youth. Working Paper 7692, National Bureau of Economic Research.
68. Chatterji Pinka, Bonuck Karen, Dhawan Simi, Deb Nandini. WIC participation and the initiation and duration of breastfeeding. WI: Institute for Research on Poverty: Discussion Paper No. 1246–02. Madison; 2002.
69. Chay, Kenneth, Y., Greenstone, Michael, 2003a. Air quality, infant mortality, and the Clean Air Act of 1970. Working Paper 10053, National Bureau of Economic Research, October. URL http://www.nber.org/papers/w10053.
70. Chay Kenneth, Y, Greenstone Michael. The impact of air pollution on infant mortality: evidence from the geographic variation in pollution shocks induced by a recession. Quarterly Journal of Economics. 2003b;118(3):1121–1167.
71. Chay, Kenneth Y., Guryan, Jonathan, Mazumder, Bhashkar, 2009. Birth cohort and the black-white achievement gap: the roles of access and health soon after birth. Working Paper 15078, National Bureau of Economic Research, June. URL http://www.nber.org/papers/w15078.
72. Chiang Alpha C. Fundamental Methods of Mathematical Economics. 3 New York: McGraw-Hill; 1984.
73. Condliffe Simon, Link Charles R. The relationship between economic status and child health: evidence from the United States. American Economic Review. 2008;98(4):1605–1618.
74. Conley Dalton, Bennett Neil G. Birth weight and income: interactions across generations. Journal of Health and Social Behavior (ISSN: 00221465). 2001;42(4):450–465 URL http://www.jstor.org/stable/3090189.
75. Conley Dalton, Pfeiffer Katherine M, Velez Melissa. Explaining sibling differences in achievement and behavioral outcomes: the importance of within. and between-family factors Social Science Research. 2007;36(3):1087–1104.
76. Conley Dalton, Strully Kate W, Bennett Neil G. Twin differences in birth weight: the effects of genotype and prenatal environment on neonatal and post-natal mortality. Economics and Human Biology. 2006;4(2):151–183.
77. Costa Dora L, Lahey Joanna N. Predicting older age mortality trends. Journal of the European Economic Association. 2005;3(2—3):487–493.
78. Crimmins Eileen M, Finch Caleb E-. Infection, inflammation, height, and longevity. Proceedings of the National Academy of Sciences. 2006;103(2):498–503.
79. Cunha Flavio, Heckman James. The technolgy of skill formation. American Economic Review. 2007;97(2):31–47.
80. Cunha Flavio, Heckman James J. Formulating, identifying and estimating the technology of cognitive and noncognitive skill formation. Journal of Human Resources. 2008;43(4):738–782 URL http://jhr.uwpress.org/cgi/content/abstract/43/4/738.
81. Cunha Flavio, Heckman James, Schennach Susanne. Estimating the technology of cognitive and noncognitive skill formation. Econometrica. 2010;78(3):883–931.
82. Currie Alison, Shields Michael, Price Stephen W. Is the child health/family income gradient universal? Evidence from England. Journal of Health Economics. 2007;26(2):213–232.
83. Currie Janet. US food and nutrition programs. In: Moffitt Robert, ed. Means-tested Transfer Programs in the United States. Chicago, IL: University of Chicago Press for NBER; 2003;199–290.
84. Currie Janet, Cole Nancy. Welfare and child health: the link between AFDC participation and birth weight. The American Economic Review. 1993;83(4):971–985.
85. Currie Janet, Gahvari Firouz. Transfers in cash and in-kind; theory meets the data. Journal of Economic Literature. 2008;46(2):333–383.
86. Currie Janet, Grogger Jeffrey. Medicaid expansions and welfare contractions: offsetting effects on prenatal care and infant health. Journal of Health Economics. 2002;21(2):313–335.
87. Currie Janet, Gruber Jonathan. Health insurance eligibility, utilization of medical care, and child health. The Quarterly Journal of Economics. 1996a;111(2):431–466.
88. Currie Janet, Gruber Jonathan. Saving babies: the efficacy and cost of recent changes in the Medicaid eligibility of pregnant women. Journal of Political Economy. 1996;104(6):1263 URL http://www.journals.uchicago.edu/doi/abs/10.1086/262059.
89. Currie Janet, Hyson Rosemary. Is the impact of shocks cusioned by socioeconomic status? The case of low birth weight. American Economic Review. 1999;89(2):245–250.
90. Currie Janet, Moretti Enrico. Biology as destiny? short- and long-run determinants of intergenerational transmission of birth weight. Journal of Labor Economics. 2007;25(2):231–264 URL http://www.journals.uchicago.edu/doi/abs/10.1086/511377.
91. Currie Janet, Moretti Enrico. Short and long-run effects of the introduction of food stamps on birth outcomes in California. In: Schoeni RF, House J, Kaplan G, Pollack H, eds. Making Americans Healthier: Social and Economic Policy as Health Policy. New York: Russell Sage; 2008.
92. Currie Janet, Neidell Matthew. Air pollution and infant health: what can we learn from California’s recent experience? Quarterly Journal of Economics. 2005;120(3):1003–1030 URL http://www-mitpressjournals-org/doi/abs/10-1162/003355305774268219.
93. Currie Janet, Stabile Mark. Socioeconomic status and child health: why is the relationship stronger for older children? American Economic Review. 2003;93(5):1813–1823.
94. Currie Janet, Stabile Mark. Child mental health and human capital accumulation: the case of ADHD. Journal of Health Economics. 2006;25(6):1094–1118.
95. Currie, Janet, Tekin, Erdal, 2006. Does child abuse cause crime? Working Paper 12171, National Bureau of Economic Research, April. URL http://www.nber.org/papers/w12171.
96. Currie Janet, Thomas Duncan. Does Head Start make a difference? American Economic Review. 1995;85(3):341–364.
97. Currie Janet, Thomas Duncan. Does Head Start help Hispanic children? Journal of Public. 1999a;Economics(ISSN: 0047–2727) 74 (2):235–262.
98. Currie, Janet, Thomas, Duncan, 1999b. Early test scores, socioeconomic status and future outcomes. Working Paper 6943, National Bureau of Economic Research, February. URL http://www.nber.org/papers/w6943.
99. Currie, Janet, Walker, Reed, 2009. Traffic congestion and infant health: evidence from E-Zpass. Working Paper 15413, National Bureau of Economic Research, October. URL http://www.nber.org/papers/w15413.
100. Currie, Janet, Widom, Cathy S., 2009. Long-term consequences of child abuse and neglect on adult economic well-being. Manuscript, September.
101. Currie Janet, Yelowitz Aaron. Are public housing projects good for kids? Journal of Public. 2000;Economics(ISSN: 0047–2727) 75 (1):99–124.
102. Currie Janet, Decker Sandra, Lin Wanchuan. Has public health insurance for older children reduced disparities in access to care and health outcomes? Journal of Health Economics. 2008;27(6):1567–1581.
103. Currie Janet, Neidell Matthew, Schmieder Johannes F. Air pollution and infant health: lessons from New Jersey. Journal of Health Economics. 2009;28(3):688–703.
104. Currie Janet, Stabile Mark, Manivong Phongsack, Roos Leslie L. Child health and young adult outcomes. The Journal of Human Resources. 2010;45(3):517–548.
105. Cutler David M, Miller Grant, Norton Douglas M. Evidence on early-life income and late- life health from America’s Dust Bowl era. Proceedings of the National Academy of Sciences. 2007;104(33):13244–13249 URL http://www.pnas.org/content/104/33/13244.abstract.
106. Dafny Leemore, Gruber Jonathan. Public insurance and child hospitalizations: access and efficiency effects. Journal of Public Economics. 2005;89(1):109–129 URL http://ideas.repec.org/a/eee/pubeco/v89y2005i1p109-129.html.
107. Dahl, Gordon, Lochner, Lance, 2008. The impact of family income on child achievement: evidence from the earned income tax credit. Working Paper 14599. National Bureau of Economic Research, December. URL http://www.nber.org/papers/w14599.
108. Dahl, Gordon, B., Lochner, Lance, 2005. The impact of family income on child achievement. Working Paper 11279, National Bureau of Economic Research, April. URL http://www.nber.org/papers/w11279.
109. Dalenius Tore, Reiss Steven P. Data swapping: a technique for disclosure control. Journal of Statistical Planning and Inference. 1982;6(1):73–85.
110. Datar Ashlesha, Kilburn Rebecca, Loughran David S. Endowments and parental investments in infancy and early childhood. Demography. 2010;47(1):145–162.
111. Dearden, Lorraine, 1998. Ability, family, education, and earnings in Britain. Working Paper 98/114, Institute for Fiscal Studies, July.
112. Del Bono, Emilia, Ermisch, John, Francesconi, Marco, 2008. Intrafamily resource allocations: a dynamic model of birth weight. IZA Discussion Papers 3704, Institute for the Study of Labor (IZA), September. URL http://ideas.repec.org/p/iza/izadps/dp3704.html.
113. Deming David. Early childhood intervention and life-cycle skill development. American Economic Journal: Applied Economics. 2009;1(3):111–134.
114. Deschnes, Olivier, Greenstone, Michael, 2007. Climate change, mortality, and adaptation: evidence from annual fluctuations in weather in the US. NBER Working Paper No. 13178, June.
115. Doblhammer Gabriele, Vaupel James W. Lifespan depends on month of birth. Proceedings of the National Academy of Sciences. 2001;98(5):2934–2939.
116. Doyle Jr. Joseph J. Child protection and adult crime: using investigator assignment to estimate causal effects of foster care. Journal of Political Economy. 2008;116(4):746–770 URL http://www.joumals.uchicago.edu/doi/abs/10.1086/590216.
117. Doyle, Orla, Walker, Ian, Harmon, Colm P., 2005. The impact of parental income and education on the health of their children. Discussion Paper 5359, Centre for Economic Policy Research, December.
118. Dubay Lisa, Joyce Ted, Kaestner Robert, Kenney Genevieve M. Changes in prenatal care timing and low birth weight by race and socioeconomic status: implications for the medicaid expansions for pregnant women. Health Services Research. 2001;36(2):373–398.
119. Duggan Anne K, McFarlane Elizabeth, Fuddy Loretta, et al. Randomized trial of a statewide home visiting program: impact on preventing child abuse and neglect. Child Abuse and Neglect. 2004;28(6):597–622.
120. Duggan AK, McFarlane EC, Windham AM, et al. Evaluation of Hawaii’s Healthy Start Program. The Future of Children. 1999;9(1):66–90.
121. DuMont, Kimberly, Mitchell-Herzfeld, Susan, Greene, Rose, Lee, Eunju, Lowenfels, Ann, Rodriguez, Monica, 2006. Healthy families New York (hfny) randomized trial: impacts on parenting after the first two years. Working Paper Series: evaluating Healthy Families New York 1, New York State Office of Children & Family Services, June.
122. Dustmann, Christian, Schonberg, Uta, 2009. The effect of expansions in maternity leave coverage on children’s long-term outcomes. SSRN eLibrary.
123. Eissa Nada, Liebman Jeffrey B. Labor supply response to the earned income tax credit. The Quarterly Journal of Economics. 1996;113(3):653–691.
124. Farrelly, Matthew, C., Nimsch, Christian T., James, Joshua, 2003. State cigarette excise taxes: Implications for revenue and tax evasion. Report 08742.000, RTI International, Research Triangle Park, NC, May.
125. Fergusson David, M, Grant Hildegard, Horwood L John, Ridder Elizabeth M. Randomized trial of Early Start program of home visitation. Pediatrics. 2006;117(3):803–809.
126. Fertig Angela R, Reingold David A. Public housing, health, and health behaviors: Is there a connection? Journal of Policy Analysis and Management. 2007;26(4):831–859.
127. Field Erica, Robles Omar, Torero Maximo. Iodine deficiency and schooling attainment in Tanzania. American Economic Journal: Applied Economics. 2009;1(4):140–169.
128. Figlio David, Hamersma Sarah, Roth Jeffrey. Does prenatal WIC participation improve birth outcomes? new evidence from Florida. Journal of Public Economics. 2009;93(1—2):235–245.
129. Fletcher, Jason M., Lehrer, Steven F., 2009. Using genetic lotteries within families to examine the causal impact of poor health on academic achievement. Working Paper 15148, National Bureau of Economic Research, July. URL http://www.nber.org/papers/w15148.
130. Frank, Richard, G., Meara, Ellen, 2009. The effect of maternal depression and substance abuse on child human capital development. Working Paper 15314, National Bureau of Economic Research, September.
131. Frisvold, David, E., 2006. Head Start participation and childhood obesity. Working Paper 06-WG01, Vanderbilt University, February.
132. Frisvold, David E., Lumeng, Julie C., 2009. Expanding exposure: can increasing the daily duration of Head Start reduce childhood obesity? manuscript, April.
133. Garces Eliana, Thomas Duncan, Currie Janet. Longer-term effects of Head Start. American Economic Review. 2002;92(4):999–1012.
134. Gertler Paul J. Do conditional cash transfers improve child health? Evidence from Progresa’s control randomized experiment. Health, Health, Care, and Economic Development. 2004;94(2):336–341.
135. Gluckman Peter, D, Hanson Mark A. Adult disease: echoes of the past. European Journal of Endocrinology. 2006;155(Suppl. 1):S47–S50.
136. Gormley Jr. William. The effects of Oklahoma’s pre-K program on Hispanic children. Social Science Quarterly. 2008;89(4):916–936.
137. Gormley Jr. William, Gayer Ted. Promoting school readiness in Oklahoma: an evaluation of Tulsa’s pre-K program. The Journal of Human Resources. 2006;40(3):533–558.
138. Gormley Jr. William, Gayer Ted, Phillips Deborah, Dawson Brittany. The effects of universal pre-K on cognitive development. Developmental Psychology. 2005;41(6):872–884.
139. Goux Dominique, Maurin Eric. The effects of overcrowded housing on children’s performance at school. Journal of Public Economics. 2005;89(5–6):797–819.
140. Griliches Zvi. Sibling models and data in economics: beginnings of a survey. Journal of Political Economy. 1979;87(s5):S37 URL http://www.journals.uchicago.edu/doi/abs/10.1086/260822.
141. Grossman Michael. On the concept of health capital and the demand for health. Journal of Political Economy 1972;223–255.
142. Gueorguieva Ralitza, Morse Steven B, Roth Jeffrey. Length of prenatal participation in WIC and risk of delivering a small for gestational age infant: Flordida, 1996–2004. Journal of Maternal and Child Health. 2009;13(4):479–488.
143. Gundersen Craig, Ziliak James. Poverty and macroeconomic performance across space, race, and family structure. Demography. 2004;41(1):61–86.
144. Hanratty Maria J. Canadian national health insurance and infant health. American Economic Review (ISSN: 00028282). 1996;86(1):276–284 URL http://www.jstor.org/stable/2118267.
145. Harding Kathryn, Galano Joseph, Martin Joanne, Huntington Lee, Schellenbach Cynthia J. Healthy Families America effectiveness: a comprehensive review of outcomes. Journal of Prevention and Intervention in the Community. 2007;34(1–2):149–179.
146. Havnes, Tarjei, Mogstad, Magne, 2009. No child left behind: universal child care and children’s long-run outcomes. Discussion Paper 582, Statistics Norway, Research Department, May.
147. Heckman James. The economics, technology, and neuroscience of human capability formation. PNAS. 2007;104(33):13250–13255.
148. Heckman, James, Moon, Seong H., Pinto, Rodrigo, Savelyev, Peter A., Yavitz, Adam, 2009. The rate of return to the High/Scope Perry preschool program. Working Paper 15471, National Bureau of Economic Research, November.
149. Heckman James, J, Rubinstein Yona. The importance of noncognitive skills: lessons from the GED testing program. American Economic Review: Papers & Proceedings. 2001;91(2):145–149.
150. Heider Fritz. The influence of the epidemic of 1918 on deafness: a study of birth dates of pupils registered in schools for the deaf. American Journal of Epidemiology. 1934;19:756–765.
151. Howard Kimberly S, Brooks-Gunn Jeanne. The role of home visiting programs in preventing child abuse and neglect. The Future of Children. 2009;19(2):119–146.
152. Hoynes, Hilary W., Page, Marianne, Stevens, Ann H., 2009. Is a WIC start a better start? evaluating WIC’s impact on infant health using program introduction. Working Paper 15589, National Bureau of Economic Research, December.
153. Hoynes Hilary, W, Schanzenbach Diane. Consumption responses to in-kind transfers: evidence from the introduction of the Food Stamp program. American Economic Journal: Applied Economics. 2009;1(4):109–139.
154. Hsin Amy. Is biology destiny? Birth weight and differential parental treatment. Population Studies Center, University of Michigan: Manuscript; 2009.
155. Hustedt, Jason, T., Barnett, W. Steven, Jung, Kwanghee, Figueras, Alexandra, 2008. Impacts of new Mexico pre-K on children’s school readiness at kindergarten entry: Results from the second year of a growing initiative. Research report, National Institute for Early Education, Rutgers University, June.
156. Jacob Brian. Public housing, housing vouchers, and student achievement: evidence from public housing demolitions in Chicago. American Economic Review. 2004;94(1):233–258.
157. Johnson, Rucker C., Schoeni, Robert F., 2007. The influence of early-life events on human capital, health status, and labor market outcomes over the life course. Working Paper 07–05, National Poverty Center, February.
158. Joyce, Theodore, Gibson, Diane, Colman, Sylvie, 2004. The changing association between prenatal participation in WIC and birth outcomes in New York city. Working Paper 10796, National Bureau of Economic Research, September.
159. Joyce Theodore, Racine Andrew D, Yunzal-Butler Cristina. Reassessing the WIC effect: evidence from the pregnancy nutrition surveillance system. Journal of Policy Analysis and Management. 2007;87(2):277–303.
160. Kaestner Robert, Joyce Ted, Racine Andrew. Medicaid eligibility and the incidence of ambulatory care sensitive hospitalizations for children. Social Science and Medicine. 2001;52(2):305–313.
161. Karoly, Lynn A., Kilburn, Rebecca M., Cannon, Jill S., 2005. Early Childhood Interventions: Proven Results, Future Promise. RAND Corporation.
162. Karoly, Lynn, A., Greenwood, Peter W., Everingham, Susan S., Hoube, Jill, Kilburn, M. Rebecca, Rydell, C. Peter, Sanders, Matthew, Chiesa, James, 1998. Investing in our children: what we know and don’t know about the costs and benefits of early childhood interventions. Consensus report, Rand, July.
163. Kehrer Barbara, H, Wolin Charles M. Impact of income maintenance on low birth weight: evidence from the Gary experiment. The Journal of Human Resources. 1979;14(4):434–462 autumn.
164. Kelly, Elaine, 2009. The scourge of Asian flu: in utero exposure to pandemic influenza and the development of a cohort of British children. Institute for Fiscal Studies, Working Paper 09/17, September. University College London.
165. Kermack WO, McKendrick AG, McKinlay PL. Death-Rates in Great Britain and Sweden. The Lancet 1934;698–703.
166. Khanam Rasheda, Nghiem Hong S, Connelly Luke B. Child health and the income gradient: evidence from Australia. Journal of Health Economics. 2009;28(4):805–817.
167. Kling Jeffrey R, Liebman Jeffrey B, Katz Lawrence F. Experimental analysis of neighborhood effects. Econometrica. 2007;75(1):83–119.
168. Kling Jeffrey R, Ludwig Jeffrey, Katz Lawrence F. Neighborhood effects on crime for female and male youth: evidence from a randomized housing voucher experiment. The Quarterly Journal of Economics. 2005;120(1):87–130.
169. Knittel Christopher R, Miller Douglas L, Sanders Nicholas J. Caution drivers! children present: Traffic, pollution and infant health. UC Davis: Manuscript; 2009.
170. Koch, Thomas, G., 2009. Public insurance, crowd-out, and health care utilization. Manuscript, August.
171. Kowaleski-Jones Lori, Duncan Greg J. Effects of participation in the WIC program on birthweight: evidence from the National Longitudinal Survey of Youth. Am J Public Health. 2002;92(5):799–804 URL http://ajph.aphapublications.org/cgi/content/abstract/92/5/799.
172. Kraemer Sebastian. The fragile male. BMJ. 2000;321(7276):1609–1612 URL http://www.bmj.com.
173. Lee Bong, J, Mackey-Bilaver Lee. Effects of WIC and Food Stamp program participation on child outcomes. Children and Youth Services Review. 2007;29(4):501–517.
174. Lefebvre, Pierre, Merrigan, Philip, Verstraete, Matthieu, 2006. Impact of early childhood care and education on children’s preschool cognitive development: Canadian results from a large quasi-experiment. Working Paper 06–36, Centre interuniversitaire sur le risque, les politiques conomiques et lemploi (CIRPEE), October.
175. Levine Philip, B, Schanzenbach Diane W. The impact of children’s public health insurance expansions on educational outcomes. Forum for Health Economics and Policy. 2009;12 Article 1.
176. Levine, Phillip, B., Zimmerman, David J., 2000. Children’s welfare exposure and subsequent development. Working Paper 7522, National Bureau of Economic Research, February. URL http://www.nber.org/papers/w7522.
177. Lhila Aparna, Simon Kosali I. Prenatal health investment decisions: does the childs sex matter? Demography. 2008;45(4):885–905.
178. Lien Diana S, Evans William N. Estimating the Impact of large cigarette tax hikes: the case of maternal smoking and infant birth weight. J Human Resources. 2005;XL(2):373–392 URL http://jhr.uwpress.org/cgi/content/abstract/XL/2/373.
179. Lin Ming-Jen, Liu Jin-Tan. Do lower birth weight babies have lower grades? twin fixed effect and instrumental variable evidence from Taiwan. Social Science & Medicine. 2009;68(10):1780–1787.
180. Logan WPD, Glasg MD. Mortality in London fog incident, 1952. Lancet. 1953;1(1):336–338.
181. Love John M, Kisker Ellen E, Ross Christine, et al. The effectiveness of Early Head Start for 3-year-old children and their parents: lessons for policy and programs. Developmental Psychology. 2005;41(6):885–901.
182. Ludwig, Jens, Miller, Douglas L., 2005. Does Head Start improve children’s life chances? evidence from a regression discontinuity design. Discussion Paper 1311–05, Institute for Research on Poverty, November.
183. Ludwig Jens, Miller Douglas L. Does Head Start improve children’s life chances? evidence from a regression discontinuity design. Quarterly Journal of Economics. 2007;488(1):159–208.
184. MacDorman Marian F, Martin Joyce A, Mathews TJ, Hoyert Donna L, Ventura Stephanie J. Explaining the 2001–2002 infant mortality increase in the United States: data from the linked birth/infant death data set. International Journal of Health Services. 2005;35(3):415–442.
185. MacMillan Harriet L, Thomas B Helen, Jamieson Ellen, et al. Effectiveness of home visitation by public health nurses in prevention of the recurrence of child physical abuse: a randomized controlled trial. Lancet. 2005;365(9473):1786–1793.
186. Macours, Karen, Schady, Norbert, Vakis, Renos, 2008. Cash transfers, behavioral changes, and cognitive development in early childhood: evidence from a randomized experiment. Working Paper 4759, The World Bank: Development Research Group, Human Development and Public Services Team, October.
187. Magnuson Katherine, A, Ruhm Christopher, Waldfogel Jane. Does pre-kindergarten improve school preparation and performance? Economics of Education Review. 2007;26(1):33–51.
188. Masse Leonard, Barnett W Steven. A Benefit-cost Analysis of the Abecedarian Early Childhood Intervention. Rutgers, NJ: National Institute for Early Education Research; 2002.
189. McCormick Marie C, Brooks-Gunn Jeanne, Buka Stephen L, et al. Early intervention in low birth weight premature infants: results at 18 years of age for the infant health and development. Pediatrics. 2006;117(3):771–780.
190. McIntosh Emma, Barlow Jane, Davis Hilton, Stewart-Brown Sarah. Economic evaluation of an intensive home visiting programme for vulnerable families: a cost-effectiveness analysis of public health intervention. Journal of Public Health. 2009;31(3):423–433.
191. McLeod Jane, Kaiser Karen. Childhood emotional and behavioral problems and educational attainment. American Sociological Review. 2004;69(5):636–658.
192. Meyer Bruce D, Rosenbaum Dan T. Welfare, the earned income tax credit, and the labor supply of single mothers. Quarterly Journal of Economics. 2001;116(3):1063–1114 URL http://www-mitpressjournals-org/doi/abs/10-1162/00335530152466313.
193. Milligan, Kevin, Stabile, Mark, 2008. Do child tax benefits affect the wellbeing of children? evidence from Canadian child benefit expansions. Working Paper 14624, National Bureau of Economic Research, December. URL http://www.nber.org/papers/w14624.
194. Morris, Pamela, Duncan, Greg J., Rodrigues, Christopher, 2004. Does money really matter? estimating impacts of family income on children’s achievement with data from random-assignment experiments. Manuscript.
195. Newman Sandra, J, Harkness Joseph M. The long-term effects of public housing on self-sufficiency. Journal of Policy Analysis and Management. 2002;21(1):21–43.
196. Nilsson, Peter, 2008. Does a pint a day affect your child’s pay? the effect of prenatal alcohol exposure on adult outcomes. Centre for Microdata Methods and Practice Working Paper CWP22/08, The Institute for Fiscal Studies, August.
197. Nilsson, Peter, 2009. e long-term effects of early childhood lead expsoure: evidence from sharp changes in local air lead levels induced by the phase-out of leaded gasoline. manuscript, Uppsala University, September.
198. Oaxaca Ronald L. Male-female wage differentials in urban labor markets. International Economic Review. 1973;14:693–709.
199. Olds David L, Henderson Charles R, Kitzman Harriet J, Eckenrode John J, Cole Robert E, Tatelbaum Robert C. Prenatal and infancy home visitation by nurses: recent findings. The Future of Children. 1999;9(1):44–65 Spring-Summer.
200. Olds David, L, Kitzman Harriet, Hanks Carole, et al. Effects of nurse home visiting on maternal and child functioning: age-9 follow-up of a randomized trial. Pediatrics. 2007;120(4):832–845.
201. Olds David L, Robinson JoAnn, O’Brien Ruth, et al. Home visiting by paraprofessionals and by nurses: a randomized controlled trial. Pediatrics. 2002;110(3):486–496 URL http://pediatrics.aappublications.org/cgi/content/abstract/110/3/486.
202. Oreopoulos Phil, Stabile Mark, Walld Randy, Roos Leslie. Short, medium, and long-term consequences of poor infant health: an anlysis using siblings and twins. Journal of Human Resources. 2008;43 Winter.
203. Oreopoulos Philip. The long-run consequences of living in a poor neighborhood. Quarterly Journal of Economics. 2003;118(4):1533–1575 URL http://www-mitpressjournals-org/doi/abs/10-1162/003355303322552865.
204. Orr, Larry, Feins, Judith D., Jacob, Robin, Beecroft, Erik, Sanbonmatsu, Lisa, Katz, Lawrence F., Liebman, Jeffrey B., Kling, Jeffrey R., 2003. Moving to opportunity: interim impacts evaluation. Final report, US Department of Housing and Urban Development, Office of Policy Development and Research, June.
205. Pitt Mark, Rosenzweig Mark, Hassan Nazmul. Productivity, health, and inequality in the intrahousehold distribution of food in low-income countries. American Economic Review. 1990;80(5):1139–1156.
206. Propper Carol, Rigg John, Burgess Simon. Child health: evidence on the roles of family income and maternal mental health from a UK birth cohort. Health Economics. 2007;16(11):1245–1269.
207. Puma, Michael, Bell, Stephen, Cook, Ronna, Heid, Camilla, Shapiro, Gary, Broene, Pam, Jenkins, Frank, Fletcher, Philip, Quinn, Liz, Friedman, Janet, Ciarico, Janet, Rohacek, Monica, Adams, Gina, Spier, Elizabeth, 2010. Head start impact study: Final report; executive summary. Technical report, Administration for Children and Families. US Department of Health and Human Services, January.
208. Rasmussen Kathleen Maher. The “fetal origins” hypothesis: challenges and opportunities for maternal and child nutrition. Annual Review of Nutrition. 2001;21:73–95.
209. Reyes, Jessica Wolpaw, 2007. Environmental policy as social policy? the impact of childhood lead exposure on crime. Working Paper 13097, National Bureau of Economic Research, May. URL http://www.nber.org/papers/w13097.
210. Reznek, Arnold, 2007. Methods of confidential data protection. Virtual RDC powerpoint presentation, Cornell University, April. URL http://www.vrdc.cornell.edu/news/.
211. Rosenzweig Mark, R, Paul Schultz T. Market opportunities, genetic endowments, and intrafamily resource distribution: child survival in rural India. American Economic Review. 1982;72(4):803–815.
212. Rosenzweig Mark R, Wolpin Kenneth I-. Heterogeneity, intrafamily distribution, and child health. Journal of Human Resources. 1988;23(4):437–461.
213. Royer Heather. Separated at girth: US twin estimates of the effects of birth weight. American Economic Journal: Applied Economics. 2009;1(1):49–85.
214. Ruhm Christopher J. Parental employment and child cognitive development. The Journal of Human Resources. 2004;39(1):155–192.
215. Rush David, Stein Zena, Susser Mervyn. Diet in Pregnancy: a Randomized Controlled Trial of Nutritional Supplements. New York: Alan R. Liss, Inc; 1980.
216. Salm, Martin, Schunk, Daniel, 2008. The role of childhood health for the intergenerational transmission of human capital: evidence from administrative data. Discussion Paper 3646, The Institute for the Study of Labor (IZA), August.
217. Sanbonmatsu Lisa, Kling Jeffrey R, Duncan Greg J, Brooks-Gunn Jeanne. Neighborhoods and academic achievement. Journal of Human Resources. 2006;41(4):649–690.
218. Schanzenbach, Diane W., What are food stamps worth. American Economic Journal. Economic Policy (forthcoming).
219. Scherjon Sicco, A, Oosting Hans, Ongerboer de Visser Bram W, deWilded Ton, Zondervan Hans A, Kok Joke H. Fetal brain sparing is associated with accelerated shortening of visual evoked potential latencies during early infancy. American Journal of Obstetrics and Gynecology. 1996;175(6):1569–1575.
220. Sloan Frank A, Conover Christopher J, Rankin Peter J. Effects of Tennessee Medicaid managed care on obstetrical care and birth outcomes. Journal of Health Politics, Policy, and Law. 2001;26(6):1291–1324.
221. Smith James P. The impact of childhood health on adult labor market outcomes. The Review of Economics and Statistics. 2009;91(3):478–489.
222. Smith, James P., Smith, Gillian C., 2008. Long-term economic costs of psychological problems during childhood. Manuscript, October.
223. Smolensky E, Gootman J Appleton. Working Families and Growing Kids: Caring for Children and Adolescents. Washington, DC: The National Academies Press; 2003.
224. Solon Gary. Chapter Intergenerational mobility and the labor market. In: Ashenfelter Orley, Card David, eds. Handbook of Labor Economics. Elsevier 1999;1761–1800. vol. 3.
225. St. Pierre Robert, G, Layzer Jean I. Using home visits for multiple purposes: the comprehensive child development program. The Future of Children. 1999;9(1):134–151.
226. Stein Zena, Susser Mervyn, Saenger Gerhart, Marolla Francis. Famine and Human Development: the Dutch Hunger Winter of 1944–1945. New York: Oxford University Press; 1975.
227. Tominey, Emma, 2007. Maternal smoking during pregnancy and early child outcomes. CEP Discussion Papers dp0828, Centre for Economic Performance, LSE, October. URL http://ideas.repec.org/p/cep/cepdps/dp0828.html.
228. Vujic, Suncica, Konig, Pierre, Webbinnk, Dinand, Martin, Nick, 2008. The effect of childhood conduct disorder on human capital. Discussion Paper 3646, CPB Netherlands Bureau for Economic Policy Analysis, November.
229. Wong Vivian, C, Cook Thomas D, Barnett W Steven, Jung Kwanghee. An effectiveness-based evaluation of five state pre-kindergarten programs. Journal of Policy Analysis and Management. 2008;27(1):122–154.
230. Zweifel Peter, Breyer Friedrich HJ, Kifmann Mathias. Health Economics. 2 Oxford University Press 2009.
*We thank Maya Rossin and David Munroe for excellent research assistance, participants in the Berkeley Handbook of Labor Economics Conference in November 2009 for helpful comments, and Christine Pal and Hongyan Zhao for proofreading the equations.
1See Zweifel et al. (2009) for a two period version of the Grossman (1972) model.
2We include the subscript here because environmental influences at some aggregated geographic level g may provide exogenous variation in early childhood investments.
3I.e. δ2h/δμgδI1 < 0. On the other hand, δ2h/δμgδ2 > 0 so lower period two investments would tend to reduce damage to h from μg. The ratio of the former effect to the latter is proportional to γ/(1 – γ) (Chiang, 1984). Thus, damage from a period 1 shock is more likely to be concentrated among poor families when the period-1 share parameter (γ) is high.
4The cross-effect δ2h/δμgδI2 is similar to dynamic complementarity, but Heckman (2007) reserves this term for the cross-partial between the stock and flow, i.e. δ2/δh0δIt for t = 1, 2 in the example of Section 2.1.
5How parameters of the production function might be recovered is discussed in Appendix D.
6Obviously, the marginal utilities themselves will not be the same but equal subject to discount factor, preference parameters, and prices of C versus I, which have been ignored.
77 In the siblings model of Appendix C, this can be seen in the case of a Leontiefproduction technology, where the second period investments generate increases in h only up to the level of first period investments. If parental income Y falls below the cost of maintaining the initial investment level 2![]() + μg in the second period, it may be optimal to invest fully in child b (i.e.
+ μg in the second period, it may be optimal to invest fully in child b (i.e. ![]() ), but not in child a (i.e.,
), but not in child a (i.e., ![]() ), who experiences the negative first-period shock.
), who experiences the negative first-period shock.
8For example, the effectiveness of remedial investments would change over time if γ varied with the birth cohort. Remediation would be more effective for later cohorts if γt > γt + 1 in Eq. (4).
9In another example, Currie and Gruber (1996a) were able to examine the effects of the Medicaid expansions on the utilization of care among children by merging state-level information on Medicaid policy to data from the National Health Interview Survey (NHIS). At the time, this was only possible because one of the authors had access to the NHIS state codes through his work at the Treasury Department. It has since become easier to access geocoded health data either by traveling to Washington to work with the data, or by using it in one of the secure data centers that Census and the National Center for Health Statistics (NCHS) support. However, it remains a source of frustration to health researchers that NCHS does not make state codes and/or codes for large counties available on its public use data sets.
10For example, it has been argued that nausea and vomiting in early pregnancy (morning sickness) is an adaptive response to prevent maternal ingestion of foods that might be noxious to the fetus.
11Royer (2009) notes that Black et al. (2007) find a “negligible effect of birth weight on high school completion for the 1967–1976 birth cohort, but for individuals born between 1977 and 1986, the estimate is nearly six times as large”.
12Some states enacted earlier excise taxes: the “average state tax rate increased from 5.7 cents in 1964 to 15.5 cents in 1984” (Farrelly et al., 2003); high 1970s inflation can be an additional potential source of identification as excise taxes were set nominally.
13For example, early postnatal exposure to Pandemic influenza apparently had a larger impact on hearing than did prenatal flu exposure (Heider, 1934).
14Condliffe and Link (2008) argue that in the US, differential access to care also plays a role in the steepening of the relationship between income and child health with age. A number of studies have investigated this relationship, dubbed “the gradient”, in other countries (cf Currie et al. (2007), Case et al. (2008), Doyle et al. (2005), Khanam et al. (2009)). Propper et al. (2007) and Khanam et al. (2009) are particularly interesting because they find that when maternal mental health is controlled, the relationship between family income and child health disappears, suggesting that it is mediated largely by factors that affect maternal mental health.
15See however Appendix D for one thought about how a production function might be estimated.
16For example, advances in ultrasound technology could have changed the average human capital endowments of boys and girls by allowing parents who prefer sons to invest differentially prenatally (and not only by allowing them to abort female fetuses). See Lhila and Simon (2008) for recent work on this topic.
17The assumption that μg = μ′g simplifies the algebra, but ϕ and γ can still be estimated for μg ≠ μ′g so long as μg and μ′g are observed. We thank Christine Pal for pointing this out.