Regardless of how much effort you put into understanding your product’s users and crafting behaviors that help them achieve their goals, these efforts will fall short unless significant work is also dedicated to clearly communicating these behaviors to users in an appropriate manner. With interactive products, this communication commonly happens visually, through a display (although in some cases you must communicate product behavior through physical properties such as the shape or feel of a hardware button).
Visual interface design is a frequently misunderstood discipline, largely because of its similarities to visual art and graphic design. It is also commonly mischaracterized as “skinning” the interface; we’ve even heard people refer to it as “hitting the product with the pretty stick.”
In our practice, we’ve come to recognize that visual interface design is a critical and unique discipline, and it must be conducted in concert with interaction design and industrial design. It has great power to influence the effectiveness and appeal of a product, but for this potential to be fully realized, visual design must not be an afterthought (i.e., “putting lipstick on a pig”), but should be thought of as an essential tool for satisfying user and business needs.
Visual interface design requires several related skills, depending on the product in question. To create an effective and engaging user interface, a designer must have a command of the basic visual properties — color, typography, form, and composition — and must know how they can be used to effectively convey behavior and information and create a mood or visceral response. Interface designers also need a fundamental understanding of the interaction principles and interface idioms that shape the behavior of the product.
In this chapter, we’ll talk about effective visual interface design strategies. In Part III, we will provide more detail about specific interaction and interface idioms and principles.
Practitioners of fine art and practitioners of visual design share a visual medium. However, while both must be skilled and knowledgeable about that medium, their work serves different ends. The goal of the artist is to produce an observable artifact that provokes an aesthetic response. Art is a means of self-expression on topics of emotional or intellectual concern to the artist and, sometimes, to society at large. Few constraints are imposed on the artist; and the more singular and unique the product of the artist’s exertions, the more highly it is valued.
Designers, on the other hand, create artifacts for people other than themselves. Whereas the concern of contemporary artists is primarily self-expression, visual designers are concerned with clear communication. As Kevin Mullet and Darrell Sano note in their excellent book Designing Visual Interfaces, “design is concerned with finding the representation best suited to the communication of some specific information.” Visual interface designers are concerned with finding representations best suited to communicating the specific behavior of the interactive product that they are designing. In keeping with a Goal-Directed approach, they should endeavor to present behavior and information in such a way that it is understandable and useful, and supports the branding objectives of the organization as well as the experience goals of the personas.
To be clear, the design of user interfaces should not entirely exclude aesthetic concerns, but rather should place such concerns within a functional framework. While there is always some subjective judgment involved in visual communication, we endeavor to minimize questions of taste. We’ve found that clear articulation of user experience goals and business objectives is invaluable even when it comes to designing the aspects of a visual interface that support brand identity, user experience, and visceral response. (See Chapter 5 for more about visceral processing.)
Graphic design is a discipline that has, until the last 20 years or so, been dominated by the medium of printed ink, as applied to packaging, advertising, and environmental and document design. Traditional graphic designers are not always accustomed to dealing with the demands of pixel-based output. However, a new breed of graphic designer has been trained in digital or “new” media and is more comfortable applying the concepts of traditional graphic design to the new medium.
While graphic designers typically have a strong understanding of visual principles, they usually lack an adequate understanding of the key concepts surrounding software interaction and behavior. Talented, digitally fluent graphic designers excel at providing the sort of rich, aesthetically pleasing, and exciting interfaces we see in Windows Vista, Mac OS X, and the more visually sophisticated computer-game interfaces and consumer-oriented applications. They can create beautiful and appropriate surfaces for the interface which establish a mood or connection to a corporate brand. For them, design is first about the tone, style, and framework that communicate a brand experience, then about legibility and readability of information, and finally (if at all) about communicating behavior through affordances (see Chapter 13).
Visual interface designers share some skills with new-media-oriented graphic designers, but they must possess a deeper understanding and appreciation of the role of behavior. Much of their work emphasizes the organizational aspects of the design and the way in which visual cues and affordances communicate behavior to users. They focus on how to match the visual structure of the interface to the logical structure of both the users’ mental models and the program’s behaviors. Visual interface designers are also concerned with the communication of program states to users (i.e., read-only vs. editable) and with cognitive issues surrounding user perception of functions (layout, visual hierarchy, figure-ground issues, and so on).
Visual information designers are concerned with the visualization of data, content, and navigation rather than interactive functions. Their skill set is particularly important in visual interface design, especially as it relates to data-intensive applications and some Web sites, where content outweighs function. The primary focus of information design tends to be on presenting data in a way that promotes proper understanding. This is largely accomplished by controlling the information hierarchy through the use of visual properties such as color, shape, position, and scale. Common examples of information design challenges include charts, graphs, and other displays of quantitative information. Edward Tufte has written several seminal books that cover the topic in detail, including The Visual Display of Quantitative Information.
Although it is beyond the scope of this book to discuss industrial design issues in any depth, as interactive appliances and handheld devices become widespread, industrial design is playing an ever-growing role in the creation of new interactive products. Much like the difference in skills between graphic designers and visual interface and information designers, there is a similar split among the ranks of industrial designers. Some are more adept at creating arresting and appropriate forms for objects, whereas others emphasize logical and ergonomic mapping of physical controls in a manner that matches user behaviors and communicates device behaviors. The increase of software-enabled devices that make use of rich visual displays demands a concerted effort on the part of interaction designers, visual designers, and industrial designers in order to produce complete and effective solutions.
At its root, interface design is concerned with the treatment and arrangement of visual elements to communicate behavior and information. Every element in a visual composition has a number of properties, such as shape and color, that work together to create meaning. There is rarely an inherent meaning to any one of these properties. Rather, the differences and similarities in the way these properties are applied to each element come together to allow users to make sense of an interface. When two objects share properties, users will assume they are related or similar. When users perceive contrast in these properties, they assume the items are not related, and the items with the greatest contrast tend to demand our attention.
Long before children are capable of using and understanding verbal language, they possess the ability to differentiate between objects with contrasting visual treatments. Just as Sesame Street relies upon this innate human capability with sketches where children are asked, “Which of these things is not like the other? Which of these things doesn’t belong?,” visual interface design capitalizes on it to create meaning that is far richer than the use of words alone.
When crafting a user interface, consider the following visual properties for each element and group of elements. Each property must be applied with care to create a useful and engaging user interface.
Is it round, square, or amoeba-like? Shape is the primary way we recognize what an object is. We tend to recognize objects by their outlines; a silhouette of a pineapple that’s been textured with blue fur still reads as a pineapple. However, distinguishing among different shapes takes a higher level of attention than distinguishing some other properties such as color or size. This means it’s not the best property to contrast when your purpose is to capture a user’s attention. The weakness of shape as a factor in object recognition is apparent to anyone who’s glanced at Apple’s OS X dock and mistakenly selected iTunes instead of iDVD, or iWeb instead of iPhoto. While these icons have different shapes, they are of similar size, color, and texture.
How big or small is it in relation to other items on the screen? Larger items draw our attention more, particularly when they’re much larger than similar things around them. Size is also an ordered and quantitative variable, which means that people automatically sequence objects in terms of their size and tend to assign relative quantities to those differences; if we have four sizes of text, we assume relative importance increases with size, and that bold type is more important than regular. This makes size a useful property in conveying information hierarchies. Sufficient distinction in size is also enough to draw our attention quickly. In his classic The Semiology of Graphics, Jacques Bertin describes size as a dissociative property, which means that when something is very small or very large, it can be difficult to decipher other variables, such as shape.
How light or dark is it? Of course, the idea of lightness or darkness is meaningful primarily in context of the value of the background. On a dark background, dark type is faint, whereas on a light background, dark type is pronounced. Like size, value can be dissociative; if a photo is too dark or light, for example, you can no longer perceive what’s in it. Contrasts in value are something people perceive quickly and easily, so value can be a good tool for drawing attention to elements that need to stand out. Value is also an ordered variable — for example, lower-value (darker) colors on a map are easy to interpret as deeper water or denser population.
Is it yellow, red, or orange? Differences in hue draw our attention quickly. In some professions, hue has specific meaning we can take advantage of; for example, an accountant sees red as negative and black as positive, and a securities trader sees blue as “buy” and red as “sell” (in the United States, at least). Colors also take on meaning from the social contexts in which we’ve grown up. To Westerners who’ve grown up with traffic signals, red means “stop” and sometimes even “danger,” whereas in China, red is the color of good luck. Similarly, white is associated with purity and peace in the West, and with funerals and death in Asia. Unlike size or value, though, hue is not intrinsically ordered or quantitative, so it’s less ideal for conveying that sort of data. Also, we don’t want to rely on hue as the sole communication vector, since color-blindness is quite common.
Color is best used judiciously. To create an effective visual system that allows users to identify similarities and differences between elements, you should use a limited number of hues — the carnival effect overwhelms users and limits your ability to communicate. Hue is also where the branding needs and communication needs of an interface can collide; it can take a talented visual designer (and skilled diplomat) to navigate these waters.
Is it pointing up, down, or sideways? This is a useful variable to employ when you have directional information to convey (up or down, backward or forward). Orientation can be difficult to perceive with some shapes or at small sizes, though, so it’s best used as a secondary communication vector. For example, if you want to show the stock market is going down, you might want to use a downward-pointing arrow that’s also red.
Is it rough or smooth, regular or uneven? Of course, elements on a screen don’t have real texture, but they can have the appearance of it. Texture is seldom useful for conveying differences or calling attention, since it requires a lot of attention to distinguish. Texture also takes a fair number of pixels to convey. However, it can be an important affordance cue; when we see a textured rubber area on a device, we assume that’s where we’re meant to grab it. Ridges or bumps on a user-interface (UI) element generally indicate that it’s dragable, and a bevel or drop-shadow on a button makes it seem more clickable.
Where is it relative to other elements? Like size, position is both an ordered and a quantitative variable, which means it’s useful for conveying information about hierarchy. We can leverage the reading order of a screen to locate elements sequentially, with the most important or first used in the top and left. Position can also be used to create spatial relationships between objects on the screen and objects in the physical world.
The human brain is a superb pattern-processing computer, making sense of the dense quantities of visual information that bombard us everywhere we look. Our brains manage the overwhelming amount of data our visual sense provides by discerning visual patterns and establishing a system of priorities for the things we see, which in turn allows us to make sense of the visual world. The ability of the brain’s visual system to assemble portions of our visual field into patterns based on visual cues is what allows us to process visual information so quickly and efficiently. For example, imagine manually calculating the trajectory of a thrown baseball in order to predict where it lands. Our eyes and brains together do it in a split second, without conscious effort on our part. To most effectively communicate the behavior and functions of a program to the people that interact with it, visual interface designers must take advantage of this innate visual processing capability.
One chapter is far too little to do justice to the topic of visual interface design. However, there are some important principles that can help make your visual interface more compelling and easier to use. As mentioned earlier in the chapter, Mullet and Sano provide an accessible and detailed analysis of these fundamental principles; we will summarize some of the most important visual interface design concepts here.
Visual interfaces should:
Use visual properties to group elements and create a clear hierarchy
Provide visual structure and flow at each level of organization
Use cohesive, consistent, and contextually appropriate imagery
Integrate style and function comprehensively and purposefully
Avoid visual noise and clutter
We discuss each of these principles in more detail in the following sections, as well as some general principles governing the appropriate use of text and color in visual user interfaces.
It’s usually a good idea to distinguish different logical sets of controls or data by grouping them by using visual properties such as color and dimensional rendering. By consistently applying these visual properties throughout an interface, you can create patterns that your users will learn to recognize. For example, in Windows XP, all buttons are raised with rounded corners and text fields are rectangular, slightly inset, and have a white background and blue border. Because of the consistent application of this pattern, there is no confusion as to what is a button and what is a text field, despite a number of similarities.

In looking at any set of visual elements, users unconsciously ask themselves “What’s important here?” followed almost immediately by “How are these things related?” We need to make sure our user interfaces provide answers to both of these questions.
Based on scenarios, determine which controls and bits of data users need to understand instantly, which are secondary, and which are needed only by exception. This ranking informs the visual hierarchy.
Next use hue, saturation, value, size, and position to distinguish levels of hierarchy. The most important elements should be larger, have greater contrast in hue, saturation, and value in relation to the background, and be positioned above or outdented in relation to other items. Items meant to stand out are best rendered in saturated colors. Less important elements should be less saturated, have less value and hue contrast against the background, and should also be smaller, or indented. Desaturated, neutral colors tend to recede.
Of course, adjust these properties with restraint, since the most important element doesn’t need to be huge, red, and outdented — often, varying just one of these properties will do the trick. If you find that two items of different importance are competing for attention, it’s often a good approach to “turn down” the less important one, rather than “turn up” the more important. This will leave you with more “headroom” to emphasize critical elements. (Think about it this way: If every word on a page is red and bold, do any of them stand out?)
Establishing a clear visual hierarchy is one of the hardest challenges in visual interface design, and takes skill and talent. A good visual hierarchy is almost never noticed by users — it is only the lack of one and an accompanying confusion that tends to jump out at most people.
To convey which elements are related, return to your scenarios to determine not only which elements have similar functions but also which elements are used together most often. Elements that tend to be used together should generally be grouped spatially to minimize mouse movement, while elements that aren’t necessarily used together but have similar functions may be grouped visually even if they are not grouped spatially.
Spatial grouping makes it clear to users what tasks, data, and tools relate to each other, and can also imply sequence. Good grouping by position takes into account the order of tasks and subtasks and how the eye scans the screen: left to right in Western languages, and generally from top to bottom. (We discuss this in more detail later in the chapter.)
Items in proximity to one another are generally related. In many interfaces, this grouping is done in a heavy-handed fashion with bounding boxes everywhere you look, sometimes even around just one or two elements. In many cases, you can accomplish the same thing more effectively with differences in proximity. For example, on a toolbar, perhaps you have four pixels between buttons. To group the file commands, such as open, new, and save, you could simply leave eight pixels between the file command buttons and other groups of buttons.
Group items that are not adjacent by giving them common visual properties, forming a pattern that eventually takes on meaning for users. For example, the use of dimensionality to give the feel of a manual affordance is perhaps the most effective way to distinguish controls from data or background elements (see Chapter 13 for more about affordance). Iconography is a common application of this strategy. Mac OS X uses bright colors for application icons and subdued ones for seldom-used utilities. A green button to start a device can be echoed by a green “running” icon to indicate that it’s functioning properly.
After you have decided what the groups are and how best to communicate them visually, begin to adjust the contrast between the groups to make them more or less prominent in the display, according to their importance in context. Emphasize differences between groups, but minimize differences between items within a group.
A good way to help ensure that a visual interface design employs hierarchy and relationships effectively is to use what graphic designers refer to as the squint test. Close one eye and squint at the screen with the other eye in order to see which elements pop out and which are fuzzy and which items seem to group together. Changing your perspective can often uncover previously undetected issues in layout and composition.
It’s useful to think of user interfaces as being composed of visual and behavioral elements, which are used in groups, which are then grouped together into panes, which then may, in turn, be grouped into screens, views, or pages. These groupings, as discussed earlier, can be accomplished through spacing or through shared visual properties. There may be several such levels of structure in a sovereign application, and so it is critical that you maintain a clear visual structure so that a user can easily navigate from one part of your interface to another, as his workflow requires. The rest of this section describes several important attributes that help define a crisp visual structure.
Alignment of visual elements is one of the key ways that designers can help users experience a product in an organized, systematic way. Grouped elements should be aligned both horizontally and vertically (see Figure 14-1). In general, every element on the screen should be aligned with as many other elements as possible. The decision not to align two elements or groups of elements should be made judiciously, and always to achieve a specific differentiating effect. In particular, designers should take care to:
Align labels—. Labels for controls stacked vertically should be aligned with each other; unless labels differ widely in length, left-justification is easier for users to scan than right justification.
Align within a set of controls—. A related group of check boxes, radio buttons, or text fields should be aligned according to a regular grid.
Align across control groups and panes—. Groups of controls and other screen elements should all follow the same grid wherever possible.

A grid system is one of the most powerful tools available to the visual designer. Popularized by Swiss typographers in the years after World War II, the use of a grid provides a uniform and consistent structure to layout, which is particularly important when designing an interface with several levels of visual or functional complexity. After interaction designers have defined the overall framework for the application and its user interface elements (as discussed in Chapter 7), visual interface designers should help regularize the layout into a grid structure that properly emphasizes top-level elements and structures and provides room for lower-level or less important controls.
Typically, the grid divides the screen into several large horizontal and vertical regions (see Figure 14-2). A well-designed grid employs an atomic grid unit that represents the smallest spacing between elements. For example, if your atomic unit is four pixels, spacing between screen elements and groups will all be in multiples of four pixels.

Figure 14-2. This example of a layout grid prescribes the size and position of the various screen areas employed by a Web site. This grid ensures regularity across different screens and reduces both the amount of work that a designer must do to lay out the screens and the work that a user must do to read and understand the screens.
Ideally, a grid should also have consistent relationships between the sizes of different screen areas. These relationships are typically expressed as ratios. Commonly used ratios include the celebrated “golden section,” or phi (approximately 1.61), which is found frequently in nature and is thought to be particularly harmonious to the human eye; the square root of two (approximately 1:1.14), which is the basis of the international paper size standard (e.g. the A4 sheet); and 4:3, the aspect ratio of most computer displays.
Of course, a balance must be struck between idealized geometric relationships and the specific spatial needs of the functions and information that must be presented on the screen. A perfect implementation of the golden section will do nothing to improve the readability of a screen where things are jammed together with insufficient spacing.
A good layout grid is modular, which means that it should be flexible enough to handle necessary variation while maintaining consistency wherever possible. And, as with most things in design, simplicity and consistency are desirable. If two areas of the screen require approximately the same amount of space, make them exactly the same size. If two areas have different requirements, make them substantially different. If the atomic grid unit is too small, the grid will become unrecognizable in its complexity. Slight differences can feel unstable to users (though they are unlikely to know the source of these feelings) and ultimately fail in capitalizing in the potential strength of a strong grid system.
The key is to be decisive in your layout. Almost a square is no good. Almost a double square is also no good. If your layout is close to a simple fraction of the screen, such as a half, third, or fifth, adjust the layout so it is exactly a half, third, or fifth. Make your proportions bold, crisp, and exact.
The use of a grid system in visual interface design provides several benefits:
Usability—. Because grids attempt to regularize positioning of elements, users are able to learn quickly where to find key interface elements. If a screen header is always in precisely the same location, a user doesn’t have to think or scan to find it. Consistent spacing and positioning support people’s innate visual-processing mechanisms. A well-designed grid greatly improves the readability of the screen.
Aesthetic appeal—. By carefully applying an atomic grid and choosing the appropriate relationships between the various areas of the screen, a design can create a sense of order that feels comfortable to users and invites them to interact with the product.
Efficiency—. Standardizing your layouts will reduce the amount of labor required to produce high-quality visual interfaces. We find that definition and implementation of a grid early in design refinement results in less iteration and “tweaking” of interface designs. A well-defined and communicated grid system results in designs that can be modified and extended, allowing developers to make appropriate layout decisions should alterations prove necessary.
In addition to precisely following a grid, the layout must also properly structure an efficient logical path for users to follow through the interface, taking into account the fact that (in Western languages) the eye will move from top to bottom and left to right (see Figure 14-3).

Symmetry is a useful tool in organizing interfaces from the standpoint of providing visual balance. Interfaces that don’t employ symmetry tend to look unbalanced, as if they are going to topple over to one side. Experienced visual designers are adept at achieving asymmetrical balance by controlling the visual weight of individual elements much as you might balance children of different weights on a seesaw. Asymmetrical design is difficult to achieve in the context of user interfaces because of the high premium placed on white space by screen real-estate constraints. The squint test is again useful for seeing whether a display looks lopsided.
Two types of symmetry are most often employed in interfaces: vertical axial symmetry (symmetry along a vertical line, usually drawn down the middle of a group of elements) or diagonal axial symmetry (symmetry along a diagonal line). Most typical dialog boxes exhibit one or the other of these symmetries — most frequently diagonal symmetry (see Figure 14-4).

Sovereign applications typically won’t exhibit such symmetry at the top level (they achieve balance through a well-designed grid), but elements within a well-designed sovereign interface will almost certainly exhibit use of symmetry to some degree (see Figure 14-5).

Use of icons and other illustrative elements can help users understand an interface, or if poorly executed, can irritate, confuse, or insult. It is important that designers understand both what the program needs to communicate to users and how users think about what must be communicated. A good understanding of personas and their mental models should provide a solid foundation for both the textual and visual language used in an interface. Cultural issues are also important. Designers should be aware of different meanings for colors in different cultures (red is not a warning color in China), for gestures (thumbs up is a terrible insult in Turkey), and for symbols (an octagonal shape means a stop sign in the U.S., but not in many other countries). Also, be aware of domain-specific color coding. In a hospital, yellow means radiation and red usually means something life threatening. On a stock trading desk, red means sell. Make sure you understand the visual language of your users’ domains and environments before forging ahead.
Visual elements should also be part of a cohesive and globally applied visual language. This means that similar elements should share visual attributes, such as how they are positioned, their size, line weight, and overall style, contrasting only what is important to differentiate their meaning. The idea is to create a system of elements that integrate together to form a cohesive whole. A design that achieves this seems to fit together perfectly; nothing looks stuck on at the last minute.
In addition to their functional value, icons can play a significant role in conveying the desired brand attributes. Bold, cartoonish icons may be great if you’re designing a Web site for kids, whereas precise, conservatively rendered icons may be more appropriate to a productivity application. Whatever the style, it should be consistent — if some of your icons use bold black lines and rounded corners while others use thin, angular lines, the visual style won’t hold together.
Icon design and rendering is a craft in and of itself; rendering understandable images at low resolution takes considerable time and practice and is better left to trained visual designers. Icons are a complicated topic from a cognitive standpoint, and we will only highlight a few key points here. For those who want to understand more about what makes usable icons, we highly recommend William Horton’s The Icon Book. You may find the examples dated, but the principles still hold true.
Designing icons to represent functions or operations performed on objects leads to interesting challenges. The most significant challenge is to represent an abstract concept in iconic, visual language. In these cases, it is best to rely on idioms rather than force a concrete representation where none makes sense and to consider the addition of ToolTips (see Chapter 23) or text labels.
For more obviously concrete functions, some guidelines apply:
Represent both the action and an object acted upon to improve comprehension. Nouns and verbs are easier to comprehend together than verbs alone (for example, for a Cut command, representing a document with an X through it may be more readily understood than a more metaphorical image of a pair of scissors).
Beware of metaphors and representations that may not have the intended meanings for your target audience. For example, while the thumbs-up hand gesture means “OK” in Western cultures and might strike you as an appropriate icon to communicate “approval,” it is quite offensive in Middle Eastern (and other) cultures, and should be avoided in any internationalized application.
Group related functions visually to provide context, either spatially or, if this is not appropriate, using color or other common visual themes.
Keep icons simple; avoid excessive visual detail.
Reuse elements when possible, so users need to learn them only once.
Creating unique symbols for types of objects in the interface supports user recognition. These symbols can’t always be representational or metaphoric — they are thus often idiomatic (see Chapter 13 for more information on the strengths of idioms). Such visual markers help users navigate to appropriate objects faster than text labels alone would allow. To establish the connection between symbol and object, use the symbol wherever the object is represented on the screen.
Designers must also take care to visually differentiate symbols representing different object types. Discerning a particular icon within a screen full of similar icons is as difficult as discerning a particular word within a screen full of words. It’s also particularly important to visually differentiate (contrast) objects that exhibit different behaviors, including variants of controls such as buttons, sliders, and check boxes.
Especially as the graphics capabilities of color screens increase, it is tempting to render icons and visuals with ever-increasing detail, producing an almost photographic quality. However, this trend does not ultimately serve user goals, especially in productivity applications. Icons should remain simple and schematic, minimizing the number of colors and shades and retaining a modest size. Windows Vista and Mac OS X have taken the step towards more fully rendered icons. Although such icons may look great, they draw undue attention to themselves and render poorly at small sizes, meaning that they must necessarily take up extra real estate to be legible. They also encourage a lack of visual cohesion in the interface because only a small number of functions (mostly those related to hardware) can be adequately represented with such concrete photorealistic images. Photographic icons are like all-capitalized text; the differences between icons aren’t sharp and easy to distinguish, so we get lost in the complexity. It’s much easier for users to differentiate between icons by shape, but in the case of Mac OS X, the outline of every icon is a similarly indistinct blob. The Mac OS X interface is filled with photorealistic touches that ultimately distract (see Figure 14-6). None of this serves users particularly well.

Figure 14-6. Photorealistic icons in Mac OS X. This level of detail in icons serves only to distract from data and function controls. In addition, although it might, in some instances, make sense to render in detail objects people are familiar with, what is the sense of similarly rendering unfamiliar objects and abstract concepts (for example, a network)? How many users have seen what a naked hard drive looks like (far right)? Ultimately, users must rely on accompanying text to make sense of these icons, unless they are used quite frequently.
Instead of using words alone to describe the results of interface functions (or worse, not giving any description at all), use visual elements to show users what the results will be. Don’t confuse this with use of icons on control affordances. Rather, in addition to using text to communicate a setting or state, render an illustrative picture or diagram that communicates the behavior. Although visualization often consumes more space, its capability to clearly communicate is well worth the pixels. In recent years, Microsoft has discovered this fact, and the dialog boxes in Microsoft Word, for example, have begun to bristle with visualizations of their meaning in addition to the textual controls. Photoshop and other image-manipulation applications have long shown thumbnail previews of the results of visual-processing operations.
The Print Preview view in Microsoft Word (see Figure 14-7) shows what a printed document will look like with the current paper size and margin settings. Many users have trouble visualizing what a 1.2-inch left margin looks like; the Preview control shows them. Microsoft could go one better by allowing direct input on the Preview control in addition to output, allowing users to drag the left margin of the picture and watch the numeric value in the corresponding spinner ratchet up and down. The associated text field is still important — you can’t just replace it with the visual one. The text shows the precise values of the settings, whereas the visual control accurately portrays the look of the resulting page.

When designers choose to apply stylistic elements to an interface, it must be from a global perspective. Every aspect of the interface must be considered from a stylistic point of view, not simply as individual controls or other visual elements. You do not want your interface to seem as though someone applied a quick coat of paint. Rather, you need to make sure that the functional aspects of your program’s visual interface design are in complete harmony with the visual brand of your product. Your program’s behavior is part of its brand, and your user’s experience with your product should reflect the proper balance of form, content, and behavior.
Although visual style is a tempting diversion for many stakeholders, the use of stylized visual elements needs to be carefully controlled within an interface — particularly when designing for sovereign applications. The basic shape, behavior, and visual affordance (see Chapter 13) of controls should be driving factors in developing the visual style, and purely aesthetic considerations should not interfere with the meaning of the interface or a user’s ability to interact with it.
That said, educational and entertainment applications, especially those designed for children, leave room for a bit more stylistic experimentation. The visual experience of the interface and content are part of the enjoyment of these applications, and a greater argument can also be made for thematic relationships between controls and content. Even in these cases, however, basic affordances should be preserved so that users can, in fact, reach the content easily.
Most successful companies make a significant investment in managing their identity and building brand equity. A company that cultivates substantial brand equity can command a price premium for its products and services, while encouraging greater customer loyalty. Brands indicate the positive characteristics of the product and suggest discrimination and taste in the user.
In its most basic sense, brand value is the sum of all the interactions people have with a given company. Because an increasing number of these interactions are occurring through technology-based channels, it should be no surprise that the emphasis placed on branding user interfaces is greater than ever. If the goal is consistently positive customer interactions, the verbal, visual, and behavioral brand messages must be consistent. For example, if a customer is trying to get pricing for DSL in her area and she finds the phone company’s Web site doesn’t give her a useful answer after making her do a lot of work, it leaves her with the impression that the phone company itself is an irritating, unhelpful institution, regardless of how stunning the site’s visual design is. The same is true of other channels: If she doesn’t get the answers she needs, it doesn’t matter if the computerized phone voice sounds friendly and accepts voice input in a conversational fashion, or if the human customer service rep says “Have a nice day.”
Although companies have been considering the implications of brand as it relates to traditional marketing and communication channels for some time now, many companies are just beginning to address branding in terms of the customer experience. In order to understand branding in the context of the user interface, it can be helpful to think about it from two perspectives: the first impression and the long-term relationship.
Just as with interpersonal relationships, first impressions of a user interface can be exceedingly important. The first five-minute experience is the foundation that long-term relationships are built upon. To ensure a successful first five-minute experience, a user interface must clearly and immediately communicate the brand. Visual design typically plays one of the most significant roles in managing first impressions largely through color and image. By selecting an appropriate color palette and image style that supports the brand, you go a long way towards leveraging the equity of that brand in the form of a positive first impression.
First impressions can also have a significant impact on the usability of a product. This is described as the “Aesthetic-Usability Effect” in Lidwell, Holden, and Butler’s eminently useful Universal Principles of Design. According to this principle (which is based in research), people perceive more aesthetically pleasing designs as easier to use than less aesthetically pleasing designs, regardless of actual functionality.
After people have developed a first impression, they begin to assess whether the behavior of the interface is consistent with its appearance. You build brand equity and long-term customer relationships by delivering on the promises made during the first impression. Interaction design and the control of behavior are often the best ways to keep the promises that visual branding makes to users.
Visual noise within an interface is caused by superfluous visual elements that distract from the primary objective of directly communicating software function and behavior. Imagine trying to hold a conversation in an exceptionally crowded and loud restaurant. It can become impossible to communicate if the atmosphere is too noisy. The same is true for user interfaces. Visual noise can take the form of overembellished and unnecessarily dimensional elements, overuse of rules boxes and other visually “heavy” elements to separate controls, insufficient use of white space between controls, and inappropriate or overuse of visual properties, including color, texture, and contrast.
Cluttered interfaces attempt to provide an excess of functionality in a constrained space, resulting in controls that visually interfere with each other. Visually baroque, disorderly, or overcrowded screens raise the cognitive load for the user, causing what Richard Saul Wurman calls “information anxiety,” and interfering with users’ speed, comprehension, and success.
In general, interfaces should use simple geometric forms, minimal contours, and a restricted color palette comprised primarily of less-saturated or neutral colors balanced with a few high-contrast accent colors that emphasize important information. Typography should not vary widely in an interface: Typically one or two typefaces, specified to display at just a few sizes, will be sufficient. When multiple design elements (controls, panes, windows) are required for similar or related logical purposes, they should be visually rendered in a consistent fashion to take advantage of the concept of inheritance. Inheritance provides the opportunity for an understanding of one element to transfer to other elements that are similar. Elements intended to stand out should be visually contrasted with any regularized elements through adjustment of one or more visual properties, such as size, color, and position.
Unnecessary variation is the enemy of a coherent, usable design. If the spacing between two elements is nearly the same, make that spacing exactly the same. If two typefaces are nearly the same size, adjust them to be the same size. Every visual element and every difference in color, size, or other visual property should be there for a reason. If you can’t articulate a good reason why it’s there, get rid of it.
Good visual interfaces, like any good visual design, are visually efficient. They make the best use out of the minimal set of visual and functional elements. A popular technique used by both graphic designers and industrial designers is to experiment with the removal of individual elements in order to test their contribution to the clarity of the intended message.
As pilot and poet Antoine de Saint Exupery famously said: “Perfection is attained not when there is no longer anything to add, but when there is no longer anything to take away.” As you create your interfaces, you should constantly be looking to simplify visually. The more useful work a visual element can accomplish while still retaining clarity, the better. As Albert Einstein suggested, things should be as simple as possible, but no simpler.
Related to the drive for simplicity is the concept of leverage, which is where a single interface element is used for multiple, related purposes. For example, in Microsoft Windows XP, an icon is presented next to the title of the window (see Figure 14-8). This icon is used both to visually communicate the contents of the window (for example, whether it is an Explorer window or a Word document) and to provide access to window configuration commands such as Minimize, Maximize, and Close.

In general, interaction designers, not visual designers, are best suited to tackle the assignment of multiple functions to visual elements. Such mapping of elements requires significant insight into the behavior of users in context, the behavior of the software, and programming issues. Don’t go overboard in doing this, though — many designers get caught up in the idea of creating a more efficient elegant solution and end up adding too many functions to a control, ultimately confusing users.
Text is a critical component to almost all user interfaces. Written language is capable of conveying dense and nuanced information, but significant care must be taken to use text appropriately, as it also has a great potential to confuse and complicate.
People recognize letters primarily by their shapes. The more distinct the shape, the easier the letter is to recognize, which is why WORDS TYPED IN ALL CAPITAL LETTERS ARE HARDER TO READ than upper/lowercase — the familiar pattern-matching hints are absent in capitalized words, so we must pay much closer attention to decipher what is written. Avoid using all caps in your interfaces.
Recognizing words is also different from reading, where we consciously scan the individual words and interpret their meaning in context. Interfaces should try to minimize the amount of text that must be read in order to navigate the interface successfully: After a user has navigated to something interesting, he should be able to read details if appropriate. Using short, easily recognized words facilitates navigation with minimal conscious reading.
Our brains can rapidly differentiate objects in an interface if we represent what objects are by using visual symbols and idioms. After we have visually identified the type of object we are interested in, we can read the text to distinguish which particular object we are looking at. In this scheme, we don’t need to read about types of objects we are not interested in, thus speeding navigation and eliminating excise. The accompanying text only comes into play after we have decided that it is important.
When text must be read in interfaces, the following guidelines apply:
Use high contrast text—. Make sure that the text is in high contrast with the background and do not use complementary colors that may affect readability. We aim for 80% contrast as a general rule of thumb.
Choose an appropriate typeface and size—. In general, a crisp sans-serif font such as Verdana or Tahoma is your best bet for readability. Serif typefaces such as Times or Georgia can appear “hairy” onscreen, but using a large enough size and font smoothing or appropriate anti-aliasing can often mitigate this issue. Type sizes of less than 10 pixels are difficult to read in most situations, and if you must use small type, it’s usually best to go with a sans-serif typeface without anti-aliasing.
Phrase your text clearly—. Make your text understandable by using the fewest words necessary to clearly convey meaning. Also, try to avoid abbreviations. If you must abbreviate, use standard abbreviations.
Color is an important aspect of almost all visual interfaces. In these days of ubiquitous color LCDs, users expect color displays even in devices like PDAs and phones. However, color is much more than a marketing checklist item; it is a powerful information and visual interface design tool that can be used to great effect, or just as easily abused.
Color is part of the visual language of an interface, and users will impart meaning to its use. For most applications, color should be used sparingly and integrate well into the other elements of the visual language: symbols and icons, text, and the spatial relationships they maintain in the interface. As discussed earlier in this chapter, when used appropriately, color can draw attention to important items, indicate relationships, and communicate status or other information.
There are a few ways that color can be misused in an interface if you are not careful. The most common of these misuses are:
Too many colors—. Adding one color to distinguish important items in a set significantly reduces search time. Adding more colors still improves user performance, but at seven or more, search performance degrades significantly. It isn’t unreasonable to suspect a similar pattern in any kind of interface navigation, since this number is consistent with how much information we can hold in our short-term memories; when there are too many colors, we spend time trying to remember what the colors mean, so that slows us down.
Use of saturated complementary colors—. Complementary colors are the inverse of each other in color computation. These colors, when highly saturated and positioned adjacent to each other, can create perceptual artifacts that are difficult to perceive correctly or focus on. A similar effect is the result of chromostereopsis, in which colors on the extreme ends of the spectrum “vibrate” when placed adjacent to one another. Just try looking at saturated red text on a saturated blue background and see how quickly you get a headache!
Excessive saturation—. Highly saturated colors tend to look garish and draw too much attention. Moderately saturated colors can be appropriate in small swatches to capture a user’s attention but should always be used sparingly. When multiple saturated colors are used together, chromostereopsis and other perceptual artifacts often occur.
Inadequate contrast—. When object colors differ from background colors only in hue, but not in saturation or value (brightness), they become difficult to perceive. Objects and background should vary in brightness or saturation, in addition to hue, and color text on color backgrounds should also be avoided when possible.
Inadequate attention to color impairment—. Roughly 10% of the male population has some degree of color-blindness. Thus care should be taken when using red and green hues (in particular) to communicate important information. Any colors used to communicate should also vary by saturation or brightness to distinguish them from each other. If a grayscale conversion of your color palette is easily distinguishable, color-blind users should be able to distinguish the color version. There are also applications and filters, such as Fujitsu’s ColorDoctor, that can be used to see how people with various forms of color-blindness would perceive your product.
Many of the practices we’ve discussed in this chapter have their roots in design for the desktop platform and the accompanying large screen size and stationary usage context. Clearly, designing for a handheld or other device such as a mobile phone or medical equipment has its own set of challenges related to a smaller screen size, mobile usage context, and diverse input methods. While this certainly isn’t a comprehensive list, it’s worth considering the following:
Onscreen controls should be prominent. Because handheld devices are used while standing, walking, riding on bumpy trains, and in all sorts of busy medical and industrial environments, onscreen controls must be much more obvious than their desktop counterparts. Different hardware and contexts require different tactics, but as a general rule using high-contrast designs is a good idea. If your hardware limits your ability to do this, you may have to resort to size, color, or line weight to accomplish this.
Provide visual landmarks. To accomplish a task, handheld users frequently must traverse several screens. As a result it’s important to use visual cues to orient users.
Onscreen controls should be large if you’re using a touch screen. If you are using a touch screen on your device, controls should be large enough to be touchable by fingers. Styli can get lost, and because of this (and the nerd factor), younger users are often put off by the use of a stylus.
Use larger, sans-serif fonts. Serif fonts are hard to read at low resolution; sans-serif fonts should be used for low-resolution handheld displays.
Clearly indicate when there is more data offscreen. Many people aren’t used to the idea of a small screen with scrolling information. If there is more data than fits on a screen, make sure to boldly indicate that more data is available, ideally with a hint as to how to access it.
Like visual interface design, visual information design also has many principles that the prospective designer can use to his advantage. Information design guru Edward Tufte asserts that good visual design is “clear thinking made visible,” and that good visual design is achieved through an understanding of the viewer’s “cognitive task” (goal) and a set of design principles.
Tufte claims that there are two important problems in information design:
It is difficult to display multidimensional information (information with more than two variables) on a two-dimensional surface.
The resolution of the display surface is often not high enough to display dense information. Computers present a particular challenge — although they can add motion and interactivity, computer displays have low information density compared to that of paper.
Although both points are certainly true, the visual interface designer can leverage one capability not available to the print information designer: interactivity. Unlike a print display, which must convey all of the data at once, electronic displays can progressively reveal information as users need more detail. This helps make up, at least in part, for the resolution limitations.
Even with the differences between print and digital media, some universal information design principles — indifferent to language, culture, or time — help maximize the effectiveness of any information display.
In his beautifully executed volume The Visual Display of Quantitative Information (1983), Tufte introduces seven “Grand Principles,” which we briefly discuss in the following sections as they relate specifically to digital interfaces and content.
Visually displayed information should, according to Tufte:
Enforce visual comparisons
Show causality
Show multiple variables
Integrate text, graphics, and data in one display
Ensure the quality, relevance, and integrity of the content
Show things adjacent in space, not stacked in time
Not de-quantify quantifiable data
We will briefly discuss each of these principles as they apply to the information design of software-enabled media.
You should provide a means for users to compare related variables and trends or to compare before-and-after scenarios. Comparison provides a context that makes the information more valuable and more comprehensible to users (see Figure 14-9 for one example). Adobe Photoshop, along with many other graphics tools, makes frequent use of previews, which allow users to easily achieve before and after comparisons interactively (see Figure 2-2).

Within information graphics, clarify cause and effect. In his books, Tufte provides the classic example of the space shuttle Challenger disaster, which could have been averted if charts prepared by NASA scientists had been organized to more clearly present the relationship between air temperature at launch and severity of O-ring failure. In interactive interfaces, modeless visual feedback (see Chapter 25) should be employed to inform users of the potential consequences of their actions or to provide hints on how to perform actions.
Data displays that provide information on multiple, related variables should be able to display them all simultaneously without sacrificing clarity. In an interactive display, the user should be able to selectively turn off and on the variables to make comparisons easier and correlations (causality) clearer. Investors are commonly interested in the correlations between different securities, indexes, and indicators. Graphing multiple variables over time helps uncover these correlations (see Figure 14-9).
Diagrams that require separate keys or legends to decode require additional cognitive processing on the part of users, and are less effective than diagrams with integrated legends and labels. Reading and deciphering diagram legends is yet another form of navigation-related excise. Users must move their focus back and forth between diagram and legend and then reconcile the two in their minds. Figure 14-10 shows an interactive example that integrates text, graphics, and data, as well as input and output: a highly efficient combination for users.
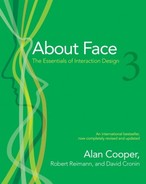
Figure 14-10. This “Communication Plan” is an interface element from a tool for managing outbound marketing campaigns that was designed by Cooper. It provides a visual structure to textual information, which is in turn augmented by iconic representations of different object types. Not only does this tool provide output of the current structure of the Communication Plan, but it also allows a user to modify that structure directly through drag-and-drop interactions.
Don’t show information simply because it’s technically possible to do so. Make sure that any information you display will help your users achieve particular goals that are relevant to their context. Unreliable or otherwise poor-quality information will damage the trust you must build with users through your product’s content, behavior, and visual brand.
If you are showing changes over time, it’s much easier for users to understand the changes if they are shown adjacently in space, rather than superimposed on one another. Cartoon strips are a good example of showing flow and change over time arranged adjacently in space.
Of course, this advice applies to static information displays; in software, animation can be used even more effectively to show change over time, as long as technical issues (such as memory constraints or connection speed over the Internet) don’t come into play.
Although you may want to use graphs and charts to make perception of trends and other quantitative information easy to grasp, you should not abandon the display of the numbers themselves. For example, in the Windows Disk Properties dialog, a pie chart is displayed to give users a rough idea of their free disk space, but the numbers of kilobytes free and used are also displayed in numerical form.
Many in-house usability organizations view themselves, among other things, as the gatekeepers of consistency in digital product design. Consistency implies a similar look, feel, and behavior across the various modules of a software product, and this is sometimes extended to apply across all the products a vendor sells. For at-large software vendors, such as Macromedia and Adobe, who regularly acquire new software titles from smaller vendors, the branding concerns of consistency take on a particular urgency. It is obviously in their best interests to make acquired software look as though it belongs, as a first-class offering, alongside products developed in-house. Beyond this, both Apple and Microsoft have an interest in encouraging their own and third-party developers to create applications that have the look-and-feel of the OS platform on which the program is being run, so that the user perceives their respective platforms as providing a seamless and comfortable user experience.
User interface standards provide benefits that address these issues when executed appropriately, although they come at a price. According to Jakob Nielsen, relying on a single interface standard improves users’ ability to quickly learn interfaces and enhances their productivity by raising throughput and reducing errors. These benefits accrue because users are more readily able to predict program behavior based on past experience with other parts of the interface or with other applications following similar standards.
At the same time, interface standards also benefit software vendors. Customer training and technical support costs are reduced because the consistency that standards bring improves ease of use and learning. Development time and effort are also reduced because formal interface standards provide ready-made decisions on the rendering of the interface that development teams would otherwise be forced to debate during project meetings. Finally, good standards can lead to reduced maintenance costs and improved reuse of design and code.
The primary risk of any standard is that the product that follows it is only as good as the standard itself. Great care must be taken in developing the standard in the first place to make sure, as Nielsen says, that the standard specifies a truly usable interface, and that it is usable by the developers who must build the interface according to its specifications.
It is also risky to see interface standards as a panacea for good interfaces. Assuming that a standard is the solution to interface design problems is like saying the Chicago Manual of Style is all it takes to write a good novel. Most interface standards emphasize the syntax of the interface, its visual look-and-feel, but say little about deeper behaviors of the interface or about its higher-level logical and organizational structure. There is a good reason for this: A general interface standard has no knowledge of context incorporated into its formalizations. It takes into account no specific user behaviors and usage patterns within a context, but rather focuses on general issues of human perception and cognition and, sometimes, visual branding as well. These concerns are important, but they are presentation details, not the interaction framework upon which such rules hang.
Although standards are unarguably useful, they need to evolve as technology and our understanding of users and their goals evolve. Some practitioners and programmers invoke Apple’s or Microsoft’s user interface standards as if they were delivered from Mt. Sinai on a tablet. Both companies publish user interface standards, but both companies also freely and frequently violate them and update the guidelines post facto. When Microsoft proposes an interface standard, it has no qualms about changing it for something better in the next version. This is only natural — interface design is still in its infancy, and it is wrongheaded to think that there is benefit in standards that stifle true innovation. In some respects, Apple’s dramatic visual shift from OS 9 to OS X has helped to dispel the notion among the Mac faithful that interface standards are etched in granite.
The original Macintosh was a spectacular achievement precisely because it transcended all Apple’s previous platforms and standards. Conversely, much of the strength of the Mac came from the fact that vendors followed Apple’s lead and made their interfaces look, work, and act alike. Similarly, many successful Windows programs are unabashedly modeled after Word, Excel, and Outlook.
Interface standards are thus most appropriately treated as detailed guidelines or rules of thumb. Following interface guidelines too rigidly or without careful consideration of the needs of users in context can result in force-fitting an application’s interface into an inappropriate interaction model.
So, what should we make of interface guidelines? Instead of asking if we should follow standards, it is more useful to ask: When should we violate standards? The answer is when, and only when, we have a very good reason.
But what constitutes a very good reason? Is it when a new idiom is measurably better? Usually, this sort of measurement can be quite elusive because it can rarely be reduced to a quantifiable factor alone. The best answer is: When an idiom is clearly seen to be significantly better by most people in the target user audience (your personas) who try it, there’s a good reason to keep it in the interface. This is how the toolbar came into existence, along with outline views, tabs, and many other idioms. Researchers may have been examining these artifacts in the lab, but it was their useful presence in real-world software that confirmed their success.
Your reasons for diverging from guidelines may ultimately not prove to be good enough and your product may suffer, but you and other designers will learn from the mistake. This is what Christopher Alexander calls the “unselfconscious process,” an indigenous and unexamined process of slow and tiny forward increments as individuals attempt to improve solutions. New idioms (as well as new uses for old idioms) pose a risk, which is why careful, Goal-Directed Design and appropriate testing with real users in real working conditions are so important.
Using standards or guidelines can involve special challenges when a company that sells multiple software titles decides that all its various products must be completely consistent from a user-interface perspective.
From the perspective of visual branding, as discussed earlier, this makes a great deal of sense, although there are some intricacies. If an analysis of personas and markets indicates that there is little overlap between the users of two distinct products and that their goals and needs are also quite distinct, you might question whether it makes more sense to develop two visual brands that speak specifically to these different customers, rather than using a single, less-targeted look. When it comes to the behavior of the software, these issues become even more urgent. A single standard might be important if customers will be using the products together as a suite. But even in this case, should a graphics-oriented presentation application, like PowerPoint, share an interface structure with a text processor like Word? Microsoft’s intentions were good, but it went a little too far in enforcing global style guides. PowerPoint doesn’t gain much from having a similar menu structure to Excel and Word, and it loses quite a bit in ease of use by conforming to an alien structure that diverges from the user’s mental models. On the other hand, the designers did draw the line somewhere, and PowerPoint does have a slide-sorter display, an interface unique to that application.
Designers, then, should bear in mind that consistency doesn’t imply rigidity, especially where it isn’t appropriate. Interface and interaction style guidelines need to grow and evolve like the software they help describe. Sometimes you must bend the rules to best serve your users and their goals (and sometimes even your company’s goals). When this has to happen, try to make changes and additions that are compatible with standards. The spirit of the law, not the letter of the law, should be your guide.