Introducing Google Finance
Use Google Financial News to stay on top of the market
Review detailed company information using Google Finance and related services
Participate in discussions and blogs about companies and stocks
Manage your financial portfolio with Google’s Portfolio Manager
Google Finance combines information it retrieves from the Web with data that it licenses from financial data sources. The Google Finance home page provides timely financial data in an easy-to-read format. Point your browser to http://finance.google.com to get started toward your next couple million bucks.
Learn detailed information about company stocks and mutual funds, but Google Finance does not cover bond information or option quotes.
Google Finance homepage, http://finance.google.com, displays a summary of the U.S. stock market based on the top indices, a list of your most recently requested quotes, today’s headlines, and related news (see Figure 16.1). At the top is the familiar Google Search box, but with a few twists.
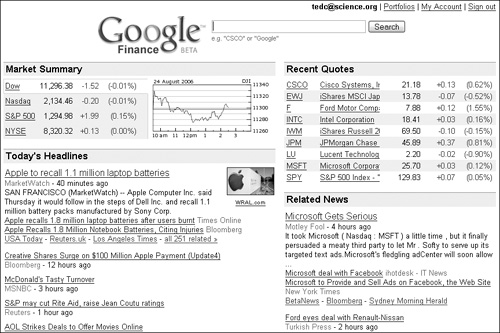
The Market Summary is the first section displayed on the Google Finance home page. Listed in the Market Summary section are the four top U.S. market indices: the Dow Industrials, Nasdaq, S&P 500, and New York Stock Exchange (NYSE). The graph shown in Figure 16.1 tracks the Dow Jones Industrials (DJI) through its intraday trading.
To the right of each index is the current trading level of the index. The third column shows how much the index is up or down for the day, displayed in green (meaning up) or red (meaning down) with a plus or minus sign displayed before the quantity. The same value is displayed again as a percentage of the index and enclosed in parentheses.
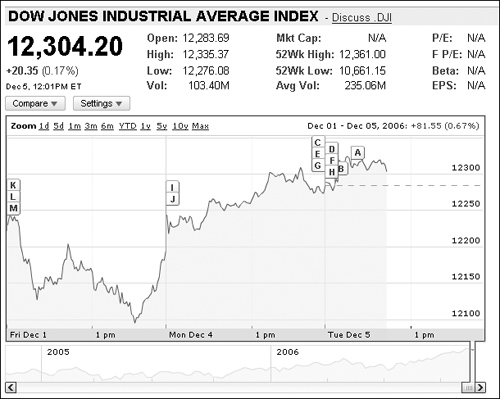
Each index’s name is displayed as a link. Clicking the link takes you to the detail for that index and the news about the index’s performance or news that is affecting the performance of that index. Figure 16.2 shows the detail for the Dow Jones Industrial Average Index.
For each index, you can see:
The current index price displayed in a large bold number beneath the index name
The amount the index is up or down
The date and time displayed as Eastern Time (either Standard or Daylight Savings Time).
The next column of information includes the index’s opening price, the high price, the low price, and the volume of trading for that index. The third column of information begins with the market capitalization level, which is not applicable for any of the indexes. Below that, view the 52--week-high price, the 52-week-low price, and the average volume of trading. The fourth column does not apply to indices, only to individual companies. This is covered later in the chapter.
The main Google Finance page displays today’s financial headlines. Just like Google News, Google Finance is not a news source, but rather a news aggregator, displaying financial news from other financial news sources. Some of the financial news sources include
Bloomberg
New York Times
ZDNet
MSN Money
BBC News
Reuters
Washington Post
USA Today
Articles in the Today’s Headline section are gathered from hundreds of news sources (see Figure 16.3). Similar to Google News, each article abstract appears with a link to the actual online article, a citation of where the article was printed, and how long ago the article was released.
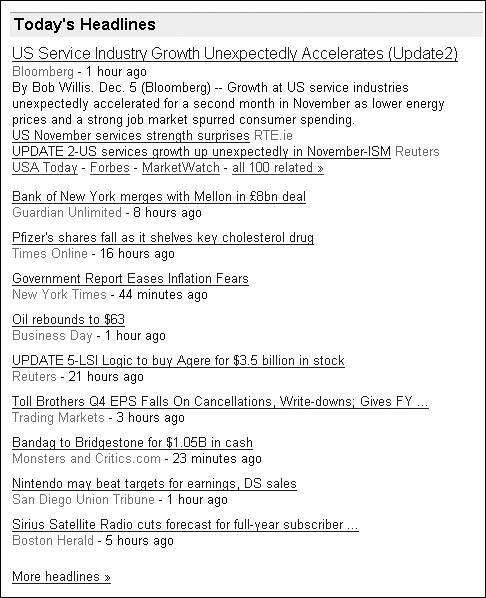
Below each article title, which is displayed as a link, is the name of the financial news source. This could be pointing to one of the larger financial news sources or to a local newspaper article with an interesting story of financial interest.
Some articles are released in multiple sources with each of the sources listed below the article so that you can choose which news source you want to read. The first couple of additional articles are listed with the title of the article (a link to the article) and the name of the source. Additional sources are listed in green beneath these, or click the link that lists all the related articles. The link, appearing in green, tells you how many related articles you can access. For example, the link may read, all 587 related >>.
Clicking the article title or news source links cause you to navigate away from Google Finance. If you do not want to navigate away from Google Finance, right-click with your mouse on the link and select the menu option that allows you to open the link in a new window. If you navigate away from Google Finance, click your browser’s Back button to return to it.
Look for the More headlines >> link near the last news article to see additional financial articles.
Each time you request a quote using the Google Finance Search box (more about this in the next section), your Google Finance home page updates the list of quotes that appear in the Recent Quotes section in the upper right.
The stock symbol and company name appear as links making it easy to return to the company detail page quickly for a new quote or updated company information. Also shown is the quote for each stock and the amount changed for the day.
The Related News area is a particularly nice feature. While the top financial headlines of the day may be interesting, chances are you are interested in news articles that affect the companies in which you own stock or may be researching for a purchase or sale. The Related News section displays news articles only about companies that appear in your Recent Quotes.
The related news articles are displayed in the same fashion as those in the Today’s Headlines section, and navigating to the articles works the same way. Depending on the company and how often news articles are written about it, it’s possible that the news articles that appear in the Related News can be much older than those you expect to see in Today’s Headlines.
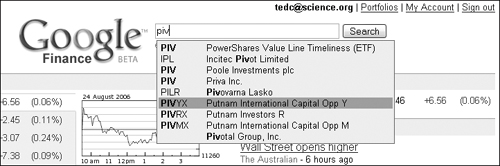
The easiest way to get quotes is by typing them in the Search box at the top of the Google Finance page. You can type a stock symbol, the name of an index, or the name of a company. This Search box is quite different than the Google Web search box. As you type in the Google Finance Search box, a drop-down list appears with suggestions of what you might be looking for (see Figure 16.4). This helps for a number of different reasons: You might need information quickly and this speeds you along your way. Or if you don’t know that the Nasdaq 100 Trust Shares has changed from a symbol of QQQ to QQQQ, this feature helps by showing you possible companies and their stock symbols as you type.
When you press Enter or click Search, the detailed page for that company appears (see “Trading Details” later in this chapter). An important thing to know is that in many cases, and depending on the stock exchange, the quote you see displayed is delayed by a specific time delay. Table 16.1 lists the various preprogrammed delays you can expect for the various exchanges and indices. Most of the indices display quotes in real time. The stock exchanges delay their quotes by 15 or 20 minutes.
Table 16.1. Exchange Display Delays
Exchange | Delay |
|---|---|
American Stock Exchange | 20 minutes |
Canadian Venture Exchange | 15 minutes |
Dow Jones Index | Real time |
Euronext | 15 minutes |
Nasdaq Indices | Real time |
Nasdaq Stock Exchange | 15 minutes |
New York Stock Exchange | 20 minutes |
New York Stock Exchange Indices | Real time |
Standard & Poor’s Indices | Real time |
Toronto Stock Exchange | 15 minutes |
You can get stock quotes on your mobile device, whether it’s your mobile phone, or handheld computer, through SMS. Currently, Google Finance does not offer company information through mobile services.
Cross-Ref
See Chapter 28 for more information about getting quotes on your mobile device.
When you select a stock to review, whether you have searched in the Google Finance Search box, selected it from your Recent Quotes, or navigated to the detail from a link within Google Finance, a detailed company information page launches.
The detailed page begins with the name of the company, whether the company is public or private, its stock symbol (when it has one), and in which exchange the stock is traded. Along this same informational bar near the top of the page you also find the Add to Portfolio and Discuss symbol links. Portfolios and discussions are covered later in this chapter.
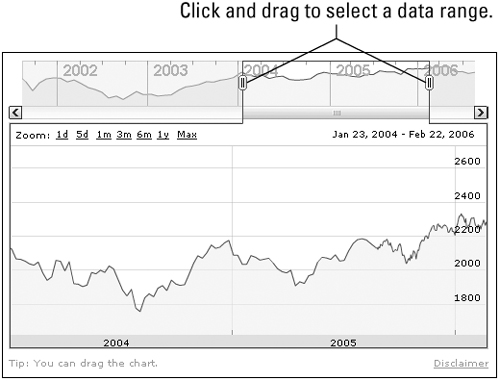
A five--year performance chart appears below the index summary information just described. This is more than simply a chart. It has a special function of allowing you to see a range in the larger chart below. If you look to the right of the small chart, you will see small “grab” icons with double vertical bars (see Figure 16.5). Grabbing those with your mouse and dragging them to a new position on the chart changes the date range displayed in the chart below. You can click and drag beginning and end icons to change the range’s beginning and ending dates.
There is an additional way to set the date range in the chart. By default, the chart displays three trading days (Saturday, Sunday, and holidays do not appear in the chart). In the upper-left corner of the chart you see several links labeled Zoom. The links set the period displayed in the chart. The options are as follows:
1d: One day
5d: Five days (one trading week)
1m: One month
3m: Three months
6m: Six months
1y: One year
Max: Five years
Clicking one of these links automatically adjusts the chart. The chart updates without reloading the Web page.
After you set your date period, you can fine-tune your chart by selecting the dates that fall in the period you want to view. When you place your mouse cursor over the chart, it turns into a hand icon, which means that you can drag the chart contents. You can not reposition the chart on the page, only move the data from left to right and back again, adjusting the dates displayed on the chart. Click the chart and drag your mouse. Continue doing this until the period you want to see appears. See the hand icon in Figure 16.6.
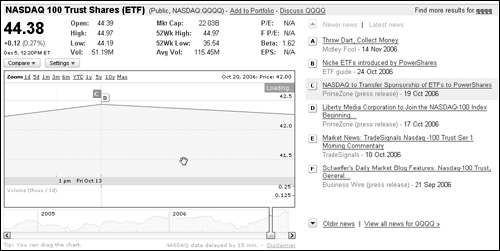
The detail page for stocks and indices contains news articles marked with a letter appearing in a small box. You can see them displayed in Figure 16.6 along the right side of the page. As you scroll through the chart, you may notice flags bearing the same letters as the news articles. These flags mark the days on which the news article may have affected the stock performance. Clicking the flag in the chart highlights the associated news article. If you click a letter that does not appear to have an associated article, the list of articles scrolls until this item appears.
When you click the letter next to a news article, that flag within the chart is highlighted. Also, as you drag the chart to different time periods, the news articles for that time period also scroll to match those marked in the chart.
The Key Stats & Ratios section of the detail page displays important company financial information related to its stock. This can include any combination of the following detail:
Previous year’s revenue.
Net profit margin.
Operating margin.
Return on average assets.
Return on average equity.
The number of people employed in the previous year.
The address of the main corporate office, including the phone number.
The company Web page.
A link from Reuters that lists additional ratios.
When the company has additional links to important information, these are provided in the Site Links.
All of the links in this section cause you to navigate away from the Google Finance page. Some of the pages take you to company-specific Web sites, some to financial sites with additional company information, and you can even view a map courtesy of Google Maps.
The company Summary gives you a snapshot of the company basics. It tells you what kind of business it is in. When a business has multiple locations, you learn how many locations it has. When a business owns other businesses, the summary tells you what they are. For companies that sell products, you can find out more about what kinds of products it sells and to which marketplace. It can also tell you where the company derives its revenue.
This information is truly a summary; in fact it is a summary of another summary provided by Reuters. A link to the full Reuters summary is provided at the end of the Google Finance summary so you can read additional detailed information. Simply click the More ratios from Reuters >> link.
Company financials are listed in the Financials section and divided into three different sections: income statement, balance sheet, and cash flow. You can read financial data for the last quarter reported and also for the last fiscal year.
The income statement lists the money the company made. This information consists of the company’s reported total revenue, the gross profit, operating income, and net income. These figures are shown for the last reported quarter and for the previous fiscal year.
The balance sheet deals with longer-term information such as the value of the company assets, both current and total. The balance sheet also shows the company’s liabilities both current and total. Finally, the balance sheet also reports the company’s total equity.
In addition to a company’s income from sales and services, it is important when determining the overall financial health of a company to review its cash flow. This section of Google Finance’s detailed reporting lists the company’s net income/starting line, cash from operating, cash from investing, cash from financing, and the net change in cash.
It is often important to know who is at the helm of a company. The company’s products or services can be excellent, the employees may be highly skilled, and there may be many customers, but the wrong management team can spell disaster for a company.
The Management section lists the company’s corporate officers. Putting your mouse cursor over the name and title of the officer causes a small “card” to appear displaying the date the officer took office, his or her photo when available, and the person’s age. Additional links that are also often included are:
Reuter’s bio and compensation information
Yahoo Finance trading activity
Of course, you can also do Google searches to find additional information about many of these people.
Each company tracked by Google Finance is categorized by business sector and specific business industry and specific category or categories. Find other related companies in the Related Companies section. As an example, the mythical Acme Semiconductor Co. would be categorized in the Technology sector, in the Semiconductor industry and the categories might include
Category: Technology > Electronic Components > Semiconductors > Processor
Category: Technology > Software > Design/Engineering > Software Development
Each of these specific categories appears in the Google Finance page as a link. Clicking one of these links launches a page showing all of the related companies in that category, along with the stock quote, change, change percentage, market capitalization, price-to-earnings ratio, annual revenue, and annual net income for each company in the list. Quickly sort on any of these company figures. Click the column heading, which appears as a link. Clicking once sorts highest to lowest; clicking again sorts lowest to highest. Viewing the companies in this fashion allows you to take a quick look at the other players in the field with a quick look at the company fundamentals.
Viewing the list of related companies also allows you to easily navigate to more specific information about each company, as the names appear as a link. Also, if there are subcategories, you can click on the subcategory and see a different list of companies. This is a great way to narrow your research.
Knowing the company financials and the people that make up the management team is not always enough to make stock purchase decisions. Google Finance provides links to other important analytical information. These may include:
Analyst Estimates: Reports by industry stock analysts from TheStreet.
SEC Filings: Security Exchange Commission filings through EDGAR.
Major Holders: MSN Money provides a detail of how the company stock is distributed including ownership information, ownership activity and a list of some of the larger shareholders.
About Company: Wikipedia, the open-source online encyclopedia provides general encyclopedic information about the company.
Transcripts: Read the transcripts of stock-related conference calls at SeekingAlpha.
Options: Track the sale of options, rather than the stock itself, at MarketWatch.
Research Reports: Yahoo! Finance has compiled a list of research reports about the stock and provides links to them for your perusal.
Events: Watch Webcasts of conferences at AOL Money & Finance.
Comparison Reports: See pre-generated or custom-generated reports that compare stock performance against others in the same or different industries.
The amount of information in these resources can only be described as vast. Google Finance contains the information you need when doing much of your fundamental stock analysis.
Anyone can join a discussion about the stocks shown in Google Finance. You can find links to a few of the discussions about the company and its stock listed in the Discussions section of the company detail page. The discussions are hosted by Google, rather than information you might find in blogs (see the next section) hosted on other sites. The Discussions section contains a link to the discussion, a brief snapshot of the discussion’s text, and the name or pseudonym of the person who last posted in the discussion. To read the entire discussion, click the title link of the discussion.
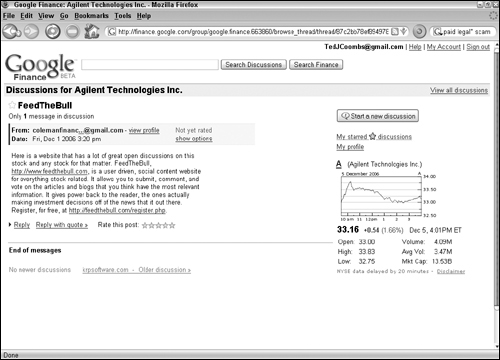
The Google Finance Discussion page (see Figure 16.7) contains the full discussion transcript along with links to the profiles of the people in the discussion. To join the discussion, click the show options link next to any of the discussion posts. This causes several new links to appear that allow you to join the discussion:
Reply: Reply to the group.
Reply to Author: Reply only to the person posting the message.
Forward: Send this post to someone else by e-mail.
Print: Print the message post.
Individual Message: Read only the individual message.
Report Abuse: Let Google know if someone is posting nonrelated or inappropriate material.
Find messages by this author: When you want to see all the other posts by this person click this link.
Reply with quote: Reply to the message while quoting its content.
Before posting to the discussion, read and accept the Google Finance Discussion Groups Posting policy. After reading it, put a check in the checkbox at the bottom and click the Next step >> link. As part of the approval-to-post process, you must post your first message.
You can start a new discussion related to the company rather than join an existing discussion. Your topic should be different than the discussions currently taking place. Click Start a New Discussion to begin the new discussion thread. This launches a new page where you can fill in a new subject and text of the message, just as though you were sending an e-mail to someone. Instead, you are sending a message to the group that appears publicly. Select to have a copy of your own message sent to you by clicking the “Send me a copy of this message” checkbox below the Message text box. You can choose to preview your message by clicking Preview, or you can immediately post your message by clicking Post Message.
Caution
Discussions and blogs are merely the opinions of people, many of whom may not even be qualified to offer opinions. There are no knowledge requirements to post to these discussions. You may find wonderful information in the discussions, but be careful about the weight that you give this information.
Part of the company’s detailed information page is a place where you can view and search through related information people have posted in their blogs. A blog is a weblog or Web-based journal. Clicking the More blogs >> link performs a Google Blog Search on the name of the company. The search page returns a link to the post, a notice of how long it has been since the post was made in the blog, a small snippet of the blog post, and a link to the blog’s main page.
Cross-Ref
See Chapter 24 for more information about blogs.
When some blogs have more than one hit in the search results, only the first result appears. But a More results from Blog Name link also appears. Clicking this link shows you all the related posts from that specific blog.
You can manage your portfolio within a simple-to-use interface. Next to your login name in the upper-right corner of the page you find a Portfolios link. Click this link to start creating your first Google Finance portfolio. By default, it is named My Portfolio. A message appears the first time telling you that “This portfolio is empty. Add a stock or a mutual fund.”
When viewing your portfolio page, you will find a text box where you can type a single or a comma-separated list of stock symbols, as shown in Figure 16.8. As you type a stock symbol, a drop-down list appears listing the name of the company associated with the symbol. This may not happen for other symbols in the list. This symbol list is the only required information you need to enter on this page. You may also choose to type the price at which you purchased your stock or mutual fund so you can easily track your trading success. Also, you can optionally type the number of shares you currently own to make managing your portfolio simpler.
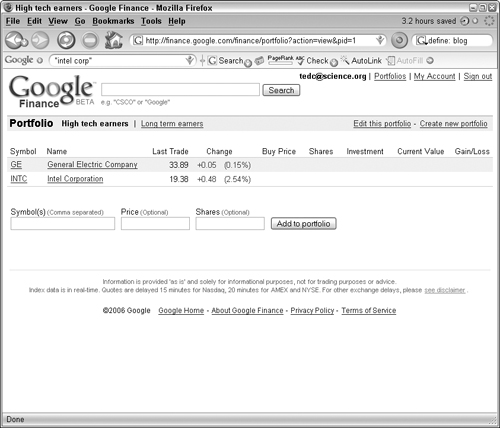
When you finish adding the list of symbols and the optional price and share quantity, click Add to portfolio. At any time you can, continue adding to your portfolio by typing information in the Symbols, Price, and Shares text boxes that appear at the bottom of the portfolio listing.
Once you have items in your portfolio they are listed along with the Last Trade price and the Change in currency and percentage. When you add the optional price and share information, the portfolio also displays and calculates the Buy price, Shares (as entered by you), Investment (price x shares), Current value (shares x last trade), and Gain/Loss (Current value – Investment).
Another way to add stocks to your portfolio is when viewing the detail for a company you can quickly add it to your portfolio by clicking the Add to Portfolio link found next to the company name.
To add a transaction, follow these steps:
While viewing your portfolio click the company name or stock symbol. The detail for the company appears.
Click the Add to Portfolio link for stocks already in your portfolio and a new Add Transaction page appears.
In the Add Transaction page, select which portfolio you want to add the transaction to by selecting the name of the portfolio from the drop-down Portfolio list. By default, the stock symbol appears for the company you were previously viewing.
Optionally add values to the Price and Shares text boxes.
You can also add transactions while editing your portfolio.
Follow these simple steps to edit your stock portfolio:
Click the Edit this portfolio link near the top right of the Portfolios page to begin editing a portfolio.
Create a new name for your portfolio and replace the default My Portfolio name. Select a new name, such as high-tech, high-risk, long term, or watch list.
Next to each company name you have listed in your portfolio are text boxes that allow you to add transactions by filling in the number of Shares and the Buy price.
Delete companies from your or your entire portfolio by following these steps:
Remove a company by putting a check in the Remove column.
Click Save Changes. This adds transactions that have been entered and removes any companies marked for removal.
Completely delete a portfolio by selecting the checkbox above the Delete This Portfolio button. This button only becomes active when the checkbox is selected. This helps to prevent accidental deletion from your profile.
This chapter explains how Google Finance is used to stay on top of the market through Google Finance news. You can perform detailed stock analyses using the many company information resources. You can read about the management team, the company performance over time, or use external services to read things such as the company’s SEC postings.
In addition to gathering information, you can play an active part in the information offered by a company by using the Google Finance-hosted discussion list or reading and posting to blogs about related company financial information.
As you gather information, you can also manage your purchases in the Google Finance Portfolio. This is a private portfolio manager, and it’s free. Only people who can view your Google account can view your portfolio.
Use Google Finance together with your online broker information or to track your offline brokerage account. The next chapter takes you further into ways you can communicate with others and share resources using Google Base.