
Part III of Your Google Game Plan for Success covers Google's web-analytics program, Google Analytics, which is a giant in its industry. The format for this part is one you're already familiar with. Just as in Part II, I'll start by walking you through the interface in this chapter (7), then talk about the industry philosophy and core essentials (8), and dive deep into the advanced features (9). In Part III there is an additional chapter of technical information (10), discussing things like tracking code, goals, Regular Expressions, profiles, and some Google Analytics "hacks."
I'll start by covering how to open a Google Analytics account and then talk about the functionality within the interface — in other words, the things that you can actually do, like segmenting and date-range comparisons. Then I'll cover each report section, starting with the overview dashboard and working my way in. As just mentioned, I'll save things like Advanced Segments and Intelligence for Chapter 9. If you purchased this book, or are standing in a bookstore reading it, because you need technical assistance, you may want to flip to Chapter 10 first before reading this chapter.
Note
As with Google AdWords, you are required to create a Google account to log in to any of the Google family of products. If you created a Google account in Chapter 2, you can use that same e-mail address and password to open up a Google Analytics account. To avoid repetition of the initial steps, you should revisit Chapter 2 if you still need to open up a Google account.
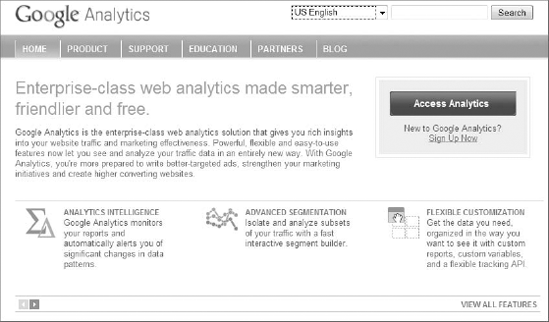
Once you have your Google account, you'll want to visit www.google.com/analytics. Bookmark this page for easier access in the future. From the Google Analytics homepage you can select your language (Google Analytics is currently offered in over 30 languages), search the website, and access your Analytics account (there is a big blue call to action on the upper right-hand side directing you to log in). You can also subscribe to the Google Analytics Blog (I highly recommend it), view product information, and, if you're in the market for it, look up and contact a Google Analytics Authorized Consultant (GAAC) in your area. As you know from reading the introduction, at the time of this writing I work for a GAAC and highly recommend the services of one if you're ready to take your analytics to the next level.
You'll also notice a Sign Up Now text link underneath the main call to action on the right-hand side of the page, as shown in Figure 7-1. If you're not logged in to your Google account, you'll be prompted to log in before continuing. Once logged in you'll be taken to a sign-up screen where you'll click a silver Sign Up button to begin creating your Google Analytics account.
You'll notice on this sign-up screen that Google Analytics has a five-millionpage view cap per month for non-AdWords advertisers. Unless you are the owner of a very high-volume website, you probably don't have to worry about this limit. If you do think (or know for a fact) that your website generates around five million page views monthly (or more), check out Chapter 14, where I discuss syncing an AdWords account with a Google Analytics account. Remember that you'll need to first sign up for a Google account before opening an Analytics account, as I outlined at the beginning of Chapter 2. You can't have access to or create an Analytics account without first having a Google account (any e-mail address can be a Google account — it's not limited to Gmail accounts).
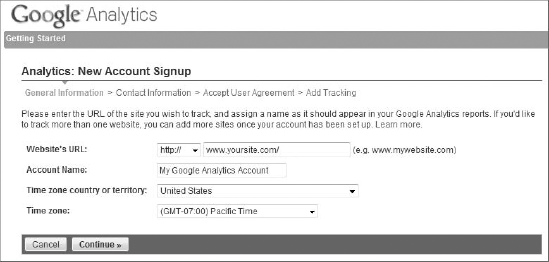
After the sign-up page, you'll be asked to provide general information about your new account, such as the URL of the website you wish to track, an account name, and your country or time zone. (If you don't have an account name, Google Analytics will use the URL that you inserted as the account name.) Figure 7-2 shows this general information screen. Click Continue after filling out this information.
On the next screen that appears, you can enter your first and last names if you want, but it's not required. Then, select the country/territory where you're located. The next screen displays the user agreement, which you should read carefully and understand fully.
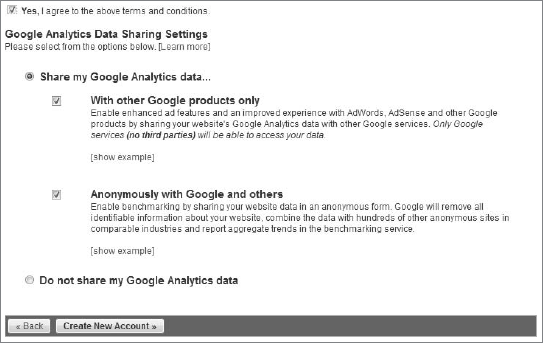
There are two parts to this user-agreement screen. First, you'll be able to read the Google Analytics Terms of Service, which are available after the account-creation process toward the bottom of any screen within Google Analytics. You'll need to click Yes . . . Accept before being allowed to create a Google Analytics account. The second part contains your Data Sharing settings. Google Analytics can anonymously aggregate your website's data and share it with other Google products only, such as Google's Conversion Optimizer; you can also choose to anonymously share data with Google products and others, including the Industry Benchmarking section that we'll cover later in this chapter. You may also choose not to share your data with Google Analytics at all by clicking the appropriate radio button, shown in Figure 7-3.
To give you a high-level overview of what this all means, sharing your data anonymously with Google products and others allows you access to top-level, aggregated, and anonymous data, like visits, page views, and bounce rate. Think of such sharing as a form of reverse poker — you can see everyone else's cards on the table, but you can't see how the dealer shuffles the cards or deals them. Only here, the players (websites) are also anonymous. You can't look at the Industry Benchmarking section and view your competitors' data by name, and they can't look at yours.
It's good to check with your legal adviser or department before deciding to share your data. If you don't have such a department, check with your superior or major stakeholder. In certain circumstances data sharing may not be allowed. Keep in mind that you can change your data-sharing settings at any time after you open your Google Analytics account.
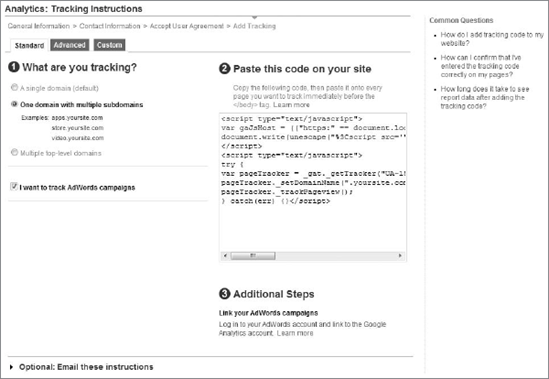
Once you have reviewed everything, it's time to create your new account. Click the appropriate button, shown on the bottom of Figure 7-3. You'll find some analytics-tracking instructions for your website on the next screen. Google Analytics works by collecting visitor data via a JavaScript snippet of code that will need to be installed on every page of your website.
If you're the person installing the code, take a moment to review the options that you see in Figure 7-4. This Tracking Code Wizard will help you gather the pieces of JavaScript code that you'll need for your specific situation. Or, if someone else will be installing the tracking code, you have the option toward the bottom of this screen of e-mailing the instructions to that person. You may also have the opportunity to learn more details on the bottom right of the page. Don't be overly concerned at this point — you don't have to install the Google Analytics tracking code right now. You can always retrieve your code within any profile's settings page. We'll cover the technical inner workings of Google Analytics in later chapters.
Finally, click Save and Finish to complete the Google Analytics account-creation process! Keep in mind that data for your website won't begin to be collected until you install the tracking code on your site's pages. When your account-creation duties are complete, you'll see a screen like the one in Figure 7-5, with your newly created account and profile and (for now) zeroes going across the board.
For now, we're done setting things up and we'll talk about technical matters in Chapter 10. I'll ask you to pretend to jump about a month or so into the future, at which point your tracking code has been installed on your website and your Google Analytics account is successfully collecting data. This is where we'll begin the next section of this chapter.
Before you start exploring the interface, you'll need to know the essential functions within Google Analytics, just as we reviewed the essential functions within AdWords in Chapter 2. You'll use such functions as trending graph customizations and segmenting virtually every time you log in to Google Analytics. The first thing that you may notice when you log in is the date-range selection area, located toward the upper right-hand side of any report. We'll start there.
By default, Google Analytics displays data to you from the previous 30 days. It does not include the current day, and Google Analytics will not save your date-range selection if you log out and log back in. Anytime I introduce a new person, client, or group to Google Analytics, one of the first things I start talking about is the date-range tool. You should make it a habit to check this each time you log in to Google Analytics, and periodically as you're doing things within the interface. Believe me, this will save you lots of head-scratching.
Figure 7-6 shows what happens when you click that rectangular date-range tool on the upper right-hand side of your screen. You'll notice a standard Roman calendar as the default view, but you can click the Timeline mini-tab to view your calendar in a trending graph view (like the ones on Google Finance). From here, you can also select an individual day to view data for just that one day. You can also select a full week by clicking the vertical tab next to it, or you can view monthly Google Analytics data by clicking the name of the desired month. You can also select a custom date range by selecting the first day in the date range (click your desired individual day) and then the last day. If you'd just rather type it in manually, you can do that toward the right-hand side of the date-range tool.
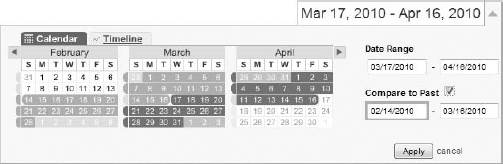
Comparing two date ranges, as in Figure 7-6, will become very important to you. Choose your starting date range and then click the Compare to Past check-box. The immediately previous date range of the same size will be selected and highlighted in green. You may also perform a date-range comparison manually by typing in the date ranges on the right-hand side — as long as both ranges are the same size (that is, the same number of days).
The date-range tool is available in all Google Analytics reports. As you'll learn in the next few chapters, performing date-range comparisons is the cornerstone of comparative web analytics.
Most Google Analytics reports offer a visual aid that accompanies the data, called a trending graph. It plots the data on an (x/y) axis, with the individual hour, day, week, or month on the x-axis (going horizontally) and the selected metric on the y-axis (going vertically).
When you move your mouse over any data point, you will be able to see the volume for the selected metric for the selected hour, day, week, or month. If, for example, you're on the dashboard, rolling your mouse over any data point will show you all visits to your site for that particular day. But with the trending graph, you have two types of customizable areas for your convenience.
The first type of customization possibility with the trending graph is changing the metric you wish to view, and changing the graph mode. By default, Google Analytics will plot one metric on the trending graph, but you can click the small drop-down menu arrow on the top left of the trending graph to view your options. You will have more, fewer, or different options depending on where you are in the interface. If desired, you can compare two metrics on the same graph, or compare your metrics to the site averages (which options don't add a lot of value on the dashboard but may in other sections). As I've done on Figure 7-7, you can do such things as compare the visits metric to the bounce-rate metric. Rolling over any data point will now show both metric values.
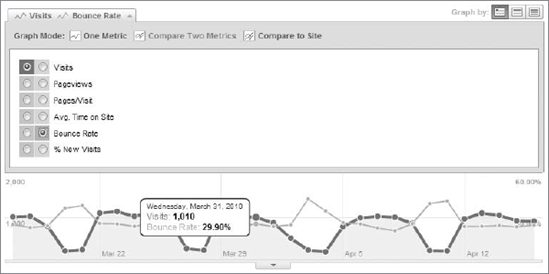
The other type of customization possibility is the Graph By options that you see at the top right of Figure 7-7. By default, you'll see data plotted by day, but by clicking the other icons on the top right, you can view data by week or by month. Some reports, like the individual metric reports in the Visitors section, allow you to plot your data by the hour.
The trending graph is available in almost every report in Google Analytics. Some reports do not come equipped with a trending graph, and I'll explain why as we move along in this chapter. I'm saving another feature of the trending graph, called Annotations, for Chapter 9.
The dashboard is like your Analytics account "homepage." When you log in to Google Analytics and select a profile from the Overview screen, you'll always see this report first. You're provided with five default dashboard reports to start with, and if you enable e-commerce tracking (which I'll show you how to do), you'll start with six reports.
As we move along here in Chapter 7, you'll see that you can get very specific with your individual report views. You can click tabs, show more or fewer rows, view different table displays, sort by column headings, drill down into individual line items, and segment and even pivot your data by other metrics. Google Analytics provides a way to save your favorite or most useful reports, along with the viewing options that you've created on the fly, with a silver Add to Dashboard button toward the top of almost every report. You'll see it next to the Export and E-mail buttons. Once your report is saved, you can safely log out and then log back in, accessing your report exactly as you saved it.
You can add as many reports to the dashboard as you wish. In Chapter 8 we'll talk about dashboards and how to make a useful one.
Google strongly believes that you (the website owner) are in charge of your data. It's up to you, not a vendor, to decide what you want to do with your data. Therefore, each report is equipped with an export feature that allows you to download a file of your selected report. When you do this on the dashboard, you'll be downloading the dashboard summary as well as each individual report that's been saved to the dashboard. For every other report within Google Analytics, you'll simply get that report.
Reports are available in PDF, XML, CSV, CSV for Excel, and TSV file formats. The PDF format is the only format that represents your data with images — it's virtually a screenshot. The other four file formats download your data so that you can perform operations, create formulas, or integrate the data with your own database or data storage. Reports take virtually no time at all to download and there is no limit to the number of reports that you can download.
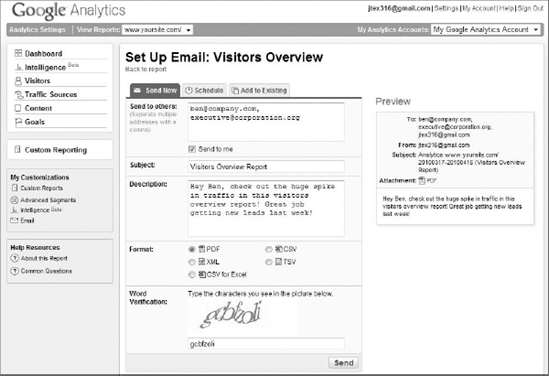
If you're following along on your own Google Analytics account while you're reading, you may have noticed an E-mail button right next to the Export feature that I was just talking about. At any time, you can e-mail a report to a colleague, friend, or team member by simply clicking on this button. When you do, you'll be taken to a Set Up E-mail screen like the one in Figure 7-8.
From here, you'll notice three tabs: Send Now, which allows you to send your report immediately (it will be in your recipient's inbox literally a second after you hit Send); Schedule, where you can schedule your report for delivery daily, weekly, monthly, or quarterly; and Add to Existing, which enables you to add multiple reports, one at a time, to a scheduled e-mail.
On the Send Now screen, enter the e-mail addresses of the recipients you'd like your report sent to. Separate each e-mail address from the next with a comma and a space after the comma. You can have a copy of the report sent to you via the checkbox that you'll see under the entered e-mails. Below that, enter a subject line and a brief description of your report. Next choose your format (from the five file-download options that are available); when you're finished, enter the word that appears on the screen for verification. Hit Send, and instantaneously your report will appear in your inbox (you'll need to hit Send/Receive if you're using the standard version of Outlook, for example).
The Schedule e-mail screen is almost identical to the Send Now screen, with the only difference being that you're given the option to schedule your report delivery. The options are daily, weekly (sent each Monday), monthly (sent the first of each month), and quarterly (sent the first day of each quarter).
The Add to Existing screen simply shows you any reports that you've already scheduled for delivery. You can add reports to existing reports, rolling them up into one scheduled e-mail.
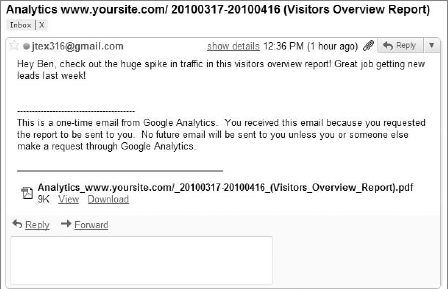
Any report within Google Analytics is available to be e-mailed, or scheduled for delivery with one of the four scheduling options. Figure 7-9 shows how an e-mail will look in your inbox (if you have Gmail).
Along with making date-range comparisons, segmenting is one of the most important techniques in all of web analytics. Each web-analytics vendor makes sure that its customers can perform segmentation to learn about their visitors at a deeper, more refined level. Within each table report in Google Analytics you'll find a drop-down menu directly beneath the scorecard (the row of metrics in a bigger font underneath the table's tabs). This drop-down menu lets you change the original segment that the report shows, and in most reports there are 23 different segments to select from (some reports, like the AdWords section, have more). You will need to get to know these segment names, as you'll see them throughout Google Analytics. They are:
Source: The name of the source of traffic (Google, Yahoo! etc.)
Medium: The means by which a user accessed your site (cost-per-click, cost-per-thousand-impressions, e-mail, etc.)
Campaign: The name of the campaign (usually for cost-per-click advertising campaigns)
Keyword: The keyword that a user searched for in a search engine, or the keyword being bid on in a cost-per-click campaign
Ad content: The headline of the ad used in a cost-per-click campaign
Visitor type: The visitor's type (either new or returning)
Landing page: The entry (first) page in a visitor's visit
Continent: The visitor's continent
Sub-continent region: The visitor's sub-continent (e.g., Central America, Western Europe, etc.)
Country/territory: The country or territory of a visitor
Region: The region or state of a visitor
City: The visitor's city
Browser: The visitor's browser (Internet Explorer, Firefox, etc.)
Operating system: The visitor's computer's operating system (Windows 7, Windows XP, Mac OS X, etc.)
Screen colors: The visitor's screen colors (16-bit, 32-bit, etc.)
Screen resolution: The visitor's screen resolution (1024×768, 800×600, etc.)
Flash version: The visitor's version of Adobe Flash (10.x, 9.x, etc.)
Java support: Whether or not the visitor's browser supports Java (meaning not JavaScript, but Java from Sun Microsystems)
Service provider: The visitor's Internet service provider (ISP)
Hostname: The hostname from which a user originated (what top-level domains a visitor saw)
Connection speed: The visitor's connection speed (T1, T3, OCS, etc.)
User-defined value: The visitor's user-defined cookie value (user-defined segmenting)
For example, if you're looking at the Keywords report, you can click into an individual keyword, find the segmenting drop-down menu, and select the Landing Page segment to view what page of your site visitors saw first after entering that keyword in a search engine (or clicking a paid ad after searching for that keyword). Or you can look at your Traffic Sources report and change the drop-down to Visitor Type to get a breakdown of new vs. returning visitors.
Segmenting is available in most reports in Google Analytics. Not only is it extremely important; it is extremely powerful as well.
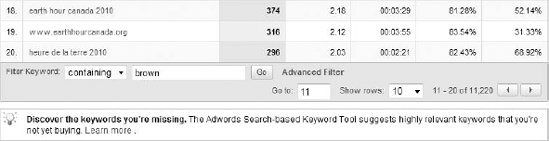
Another useful feature found within each standard report table is the table filter, located toward the bottom of the table. Let's say that you're in the Keywords report and you see that there are more than 2,000 keywords listed within your specified date range. You don't have a lot of time to download the full report in an Excel file, and you need to get all keywords that contain the word brown. Instead of sifting through several rows of data and collecting your desired data in some way, type in the word brown on the table filter tool and make sure that the drop-down menu to its left says Containing, as in the example shown in Figure 7-10.
You can filter something out by selecting the Excluding drop-down menu option. You can also use Regular Expressions in these table filters; you'll learn all about Regular Expressions in Chapter 10 when I talk about creating goals and filters. One particular character in Regular Expression language will be extremely helpful for the table filter tool and is also easy to learn and use. It's the "pipe" symbol, |, which is "either/or" in Regular Expression language. It is located directly above the Enter key on your keyboard (it looks like two vertical dashes). Hit the Shift key and that button on your keyboard and use it to filter multiple keywords together.
There's also an advanced filter option, which lets you use deeper segmenting and filtering possibilities within the report table. I've saved this for Chapter 9.
If you look at the top right of any report table in Google Analytics, you'll notice a Views row with five or sometimes six different mini-icons laid out in a row. The standard "table" view is the Google Analytics default, but you can view your data in other ways by simply clicking any of the listed icons.
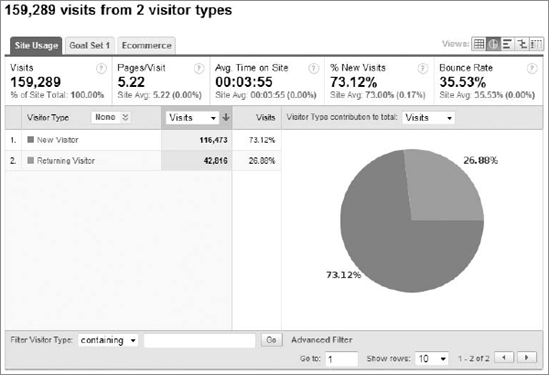
The first one is the percentage or pie-chart view, which is highlighted in Figure 7-11. This type of view is the default report view in the New vs. Returning Visitors report. When you change views in Google Analytics, you're provided with two drop-down menus that are not available in the standard report table. The first, on the left-hand side of the percentage view, allows you to change the metric that's being displayed. The second, on the right-hand side, allows you to change the "contribution to total" metric that the pie chart is showing.
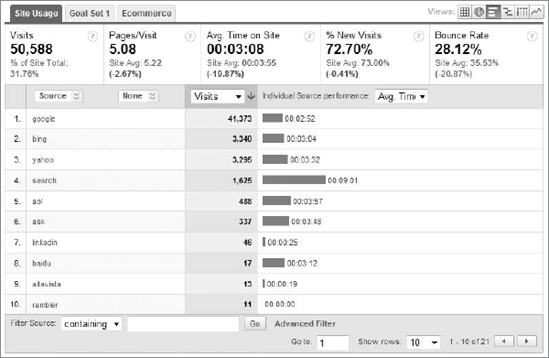
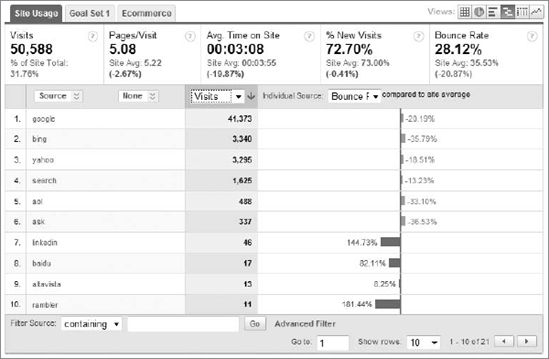
The second view is the performance view, which presents a horizontal histogram listing the line items in the report you're looking at. Figure 7-12 shows the performance view in the search engine's report. Here you can change the metric in the drop-down menu on the left-hand side, but on the right-hand side the drop-down menu now changes the individual source performance, instead of contribution to total as in the percentage view. In the example in Figure 7-12 I have changed the individual source performance drop-down menu to the average-time-on-site metric, so I can evaluate each search engine by that metric.
The third view, probably my favorite, is the comparison view. This allows you to compare line items in the table data against the site averages, which can be useful for your analysis efforts. When you look at Figure 7-13, you'll see that on the left-hand side the table data is the same as in Figure 7-12; however, on Figure 7-13 I applied the comparison view and changed the individual source drop-down to the bounce-rate metric. Now, I can tell which search engines have a better or worse bounce rate when compared to the site average bounce rate. This view is extremely helpful in reports that I'll show you later in this chapter, like the Top Landing Pages report and the Keywords report.
There's also a pivot view, but since it's an advanced feature, I'll save it for Chapter 9.
At the bottom of every report you'll find some links that when clicked will send you to some of Google's help resources. There is a lot of great information online that, along with Your Google Game Plan for Success, will help you learn and become better at using Google Analytics.
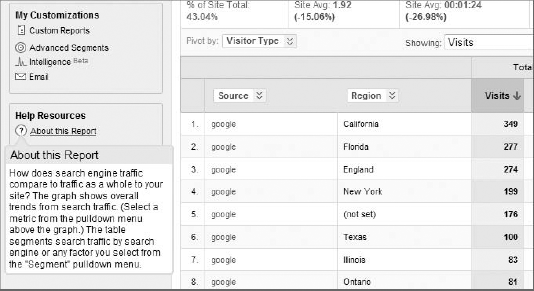
You'll see three links on the bottom left of any report page, underneath the main navigation area. There is an About This Report link, which, when clicked, provides an explanation of the report, as shown in Figure 7-14. Under that link is a link to Google's Conversion University, which is a website set up with articles and more information about how Google Analytics works. This may give you hints for the particular report you're looking at. The last link at bottom left is for common questions that Google Analytics users like you have asked. Perhaps your question has already been asked, and the answer may be available from this link.
There are also little question mark symbols scattered throughout Google Analytics, specifically on the scorecard metrics and within the individual reports themselves. Clicking these will provide a definition of the metric or dimension being displayed.
You may also view the Google Analytics terms of service, read up on the privacy policy, or contact Google Analytics via text links that are at the very bottom of any page within the interface.
Now that you have had a tiny taste of what Google Analytics can do, let's start with a tour of the available sections and reports within this powerful interface. The best place to start is naturally the Overview page, which is the first screen that you'll see upon successfully logging in to Google Analytics.
Note
If you have access to multiple Google Analytics accounts (if you work for a company that handles multiple client accounts or just have been given multiple access), you'll see a higher-level Overview screen that lists all accounts for which you have access. Simply click the desired account to access it.
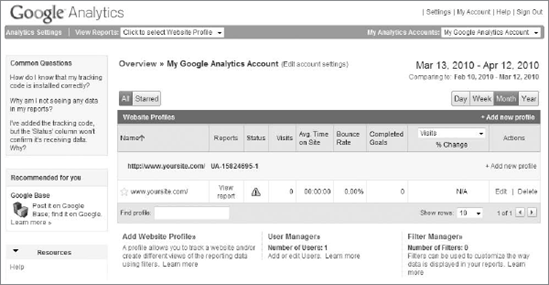
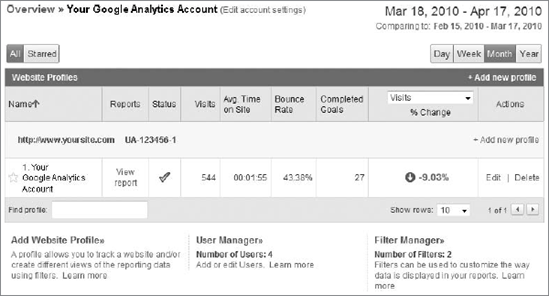
On this Overview screen, which you can see in Figure 7-15, you'll notice a lot of different things that you can do if you have administrative access. If you don't, you'll see only your profiles listed, without all the editable regions around them. Starting from the top of the screen, you can edit your account's settings, which include your account name and your data-sharing settings, which I talked about at the beginning of the chapter. On the top right, you'll notice the date range and see that a previous date range has been applied automatically. Directly below the date range, you can toggle the timeframe that appears in the report table by day, week, month, or year. The comparison date range that appears below the main date range will also change to reflect your choice.
Moving to the left, you'll notice an All and a Starred button. If you have multiple profiles, you can mark any profile as a favorite and click the Starred button to view only your favorites. This can be convenient if you have access to multiple profiles. Folks who work for agencies or companies serving several clients with Google Analytics will make great use of this feature.
Finally, each profile's data is shown in its own row. Starting on the far left, you can change the name of the profile by simply hovering over it with your mouse and clicking the small pencil icon that appears. Next to that, the View Report link takes you to the profile's dashboard. The Status column tells you whether or not the profile is successfully receiving data (it will show a yellow warning sign if it's not). High-level metrics are shown up until the last column, where you can click to either edit or delete a profile (don't ever delete a profile unless you are 100 percent sure). The only column that you can edit here in the overview is the % Change column. By default, you'll see the percentage change from one date range to the previous one, but you can also view average time on site, bounce rate, and completed goals.
Below the overview table you can create a new website profile, manage the users that have access to your Google Analytics account, and manage your filters. All of these administrative options will be covered in Chapter 10.
The great thing about the Overview screen is that you can get high-level comparative data without even truly entering the Google Analytics interface. This screen makes for a great printout, and I don't say that very often. Make use of this Overview screen, especially if you have access to multiple profiles.
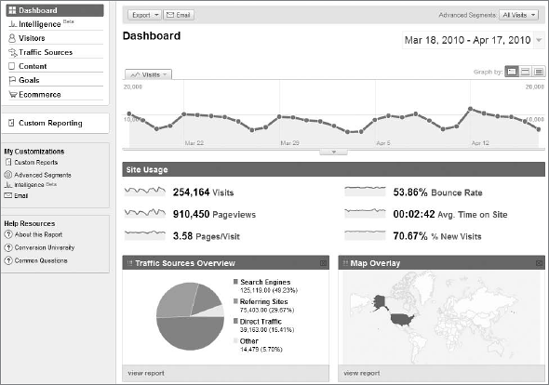
When you click View Report on any profile listed on the Overview screen, you'll be taken to the dashboard. As I mentioned earlier in this chapter, the dashboard can be thought of as the homepage of your website. It's where you'll be able to find high-level information about your website, such as the number of visits, the number of page views, and what your site's bounce rate is. Tools like the date-range tool, the trending graph, and e-mail options are available here. Also, this page is where you'll find any saved reports after clicking the silver Add to Dashboard button that you'll find at the top of each report within Google Analytics.
As you can see on the left-hand side of Figure 7-16, Google Analytics has its own unique organizational structure. As you start to use Google Analytics, you'll quickly become familiar with where data is stored and where to access the reports you need. Starting from the top left and working our way down, we find these navigation items:
Dashboard: The "homepage" of your Google Analytics account. Saved reports appear here.
Intelligence: An advanced feature of Google Analytics that can show you significant events that take place on your website (we'll cover Intelligence in Chapter 9).
Visitors: Statistics and data about the visitors who come to your website are found in this section. This includes reports like the popular Map Overlay, Benchmarking, and New vs. Returning, and technical data about your website's visitors' browsers, operating systems, and more.
Traffic Sources: The places where visitors come from can be discovered in this section. Reports here include Referring Sites, All Traffic Sources, Search Engines, Keywords, and AdWords, all of which I'll cover later in this chapter.
Content: Information about the pages of your website is found here. The Content section is home to reports like Top Content, Top Landing Pages, and the Site Overlay report. It's also home to features like the navigation summary and entrance paths, and subsections like Site Search and Event Tracking.
Goals: The goals that you set up to measure the very important actions that visitors take on your site are available for analysis here. Reports include Goal Conversions, Goal Verification, and an especially important one called Funnel Visualization.
E-commerce: If enabled and if installed properly on your site, this section can provide you with all sorts of details about the orders that take place on your site. It includes reports on transactions and products, and a neat visits/days-to-purchase histogram.
Each section also contains its own overview page, providing general information about that section.
The Custom Reports, Advanced Segments, and Intelligence links found beneath the main navigation will be covered in Chapter 9. This navigation menu follows you throughout your journey within the Google Analytics interface.
The windows (or the mini-report tables) that appear on the dashboard can be moved to your liking. Simply drag and drop the reports to positions that suit you better. The only element that cannot be moved on the dashboard is anything above the Site Usage table. If you don't want to have a particular report window on your dashboard any longer, you can purge it by clicking the X at the upper right of any window. Click View Report at the bottom of any window to go to that report. Remember, you'll be taken to the report exactly as you left it.
Let's start moving beyond the dashboard and into the first section of reports, the Visitors section.
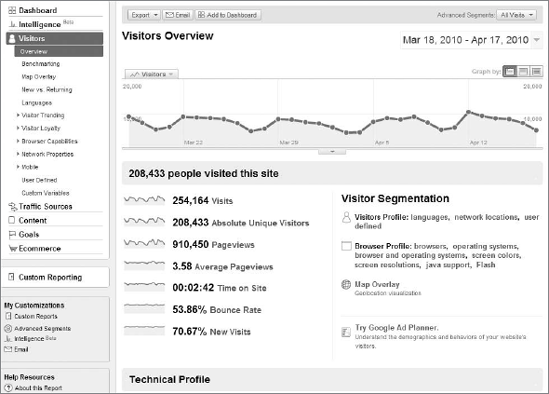
The FIrst report in this section — as in any main section — is the Overview report, where you'll be taken by default when you click the Visitors link in the left-hand navigation. This section is all about the visitors who come to your website. Please note that personal information, such as phone numbers, names, and Social Security numbers, won't appear here. This report section shows only things like regions, cities, browser versions, operating systems, screen resolutions, and custom segments. (As you'll read in Chapter 8, collecting personally identifiable information is a bad practice.)
As you'll see in Figure 7-17, the overview data is neatly displayed on half of the middle of the page. Notice also that the trending graph's default metric is now Visitors, not Visits, as was the case on the dashboard. On the other half of the middle of the page, you're given some links to different reports within that section, like Map Overlay and Custom Segmentation, so you can access these individual reports without fishing through the navigation menu. At the bottom of the Visitors Overview you'll also find some brief technical data, including the browsers and connection speeds that brought visitors to your site. In the Visitors section you'll find the following reports:
Benchmarking: Baseline and anonymous competitive information
Map Overlay: An interactive visualization of visitors' physical locations
New vs. Returning: A report showing the difference between new (firsttime) visitors and returning (repeat) visitors
Languages: The language settings used by your visitors
Visitor Trending: Subsection of reports containing basic histograms for the six cornerstone metrics of Google Analytics
Visitor Loyalty: Four interesting histograms showing customer retention and intent
Browser Capabilities: Seven technical reports detailing your visitors' technical browser and operating system data
Network Properties: Three reports identifying your visitors' Internet service providers and the URLs of your sites that they visit
Mobile: A breakdown of the mobile carriers and devices used
User Defined: A report on a subset of visitors that you manually tag
Custom Variables: A newer feature that expands upon the user-defined variables
If you're an astute reader (which I know you are), you will have noticed that this report contains the Add to Dashboard button mentioned earlier. If you're following along on your own Google Analytics account as you read this chapter, you may have also noticed that there are now all five report-exporting options to choose from. Both the Add to Dashboard button and the five report-exporting options are now available on the dashboard.
Note
It's very likely that you are looking at these screenshots of Google Analytics for the very first time and are wondering what terms like bounce rate and absolute unique visitors mean. Feel free to flip over to Chapter 8's "Web Metrics and Dimension Definitions" section for a complete list of all terms used in web analytics. We'll save such definitions and deep analysis until after this chapter.
After enabling data sharing when you open your Google Analytics account (or when you do it from the Account Settings link on the Overview screen), you'll see after a couple of weeks that there's data in the Benchmarking section. At this time you'll be able to compare the six cornerstone metrics (visits, page views, pages per visit, average time on site, percent of new visits, and bounce rate) to those of anonymous websites of a similar size.
Check out Figure 7-18. Here, you'll see the six cornerstone metrics compared to the benchmarks of sites similar in size to yours. Google Analytics automatically determines the size of your site by analyzing the traffic volume you receive monthly. Currently there is no way to know what your website's size is or how to modify the way Google classifies your site. Mouse over any data point within the six metrics to view how your data compared to the benchmark on that particular day. Below each data window you'll see the number corresponding to the metric, the benchmark's number, and the percentage difference.
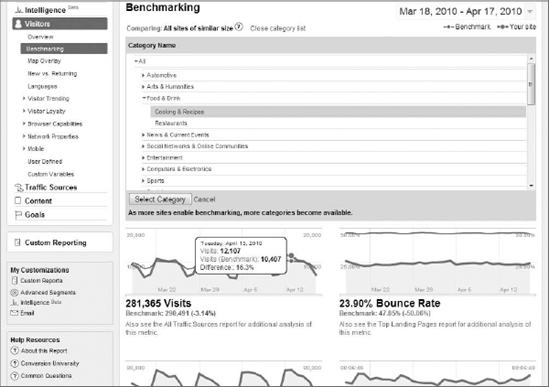
However, you can segment this report by industry so that you can measure your site's metrics against sites classified in your industry. Click Open Category List to view all available categories and subcategories, and select the category that's closest to yours. You can also view your website statistics against the benchmark of any other industry if you desire.
The Benchmarking section is one of the few reports in Google Analytics that cannot be exported, e-mailed, or added to your dashboard. It's also one of the reports in Google Analytics in which Advanced Segments are disabled — you'll learn why in Chapter 9.
The Map Overlay report may be my favorite report in all of Google Analytics. I simply gush over this report. Not only is it visually appealing, but it's also extremely useful for any advertiser who needs specific geographic information. It's also the first report that introduces you to the standard report table that you've read so much about in this chapter.
When you first arrive at this report you'll see a map of the world. Some countries will be colored light green; others will be dark green. The darker the color, the more visits originated from that country or territory. Mousing over any country, as I've done in Figure 7-19, will show that country's visits. You can edit the default metric shown in the Map Overlay report by clicking the word Visits at the top left of the map. This will bring up a list of all available metrics you can view on your Map Overlay report.
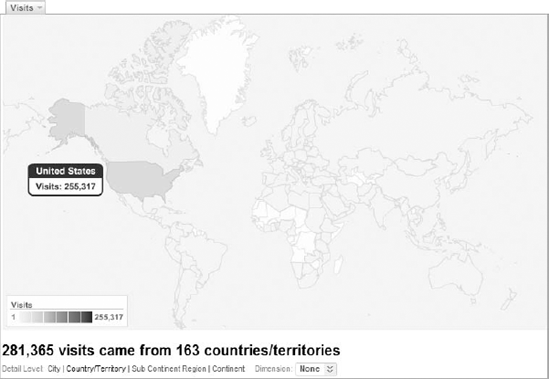
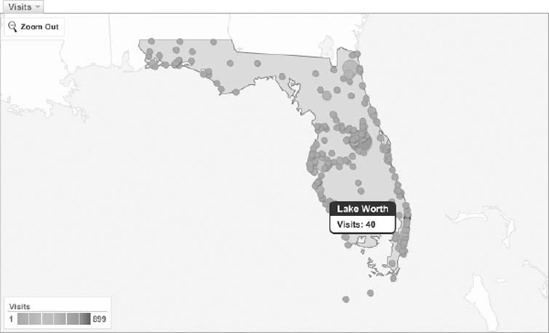
Below the map you can see the total number of visits (or your desired metric) and the number of countries/territories that were responsible for those visits. When you click a country or territory, you will drill down into that area and view the state/region overlay. Clicking any state or region will show you something like Figure 7-20, which is a "chicken pox" view of each city that generated your selected metric. Mousing over any dot on the city-level view will show the metric total for that city. The bigger the dot is, the more visits (or selected metric) the city generated.
The Map Overlay report is one of the few reports that do not contain a trending graph. However, you can e-mail, export, and advance-segment this report, unlike the Benchmarking section. When you scroll down the page you'll see the regular table view that is found in almost every report in Google Analytics.
As I mentioned earlier, the New vs. Returning Visitors report shows the pie-chart percentage view by default. Now that you know how to change the views, you can switch back to the table view, or any other view for that matter.
Google Analytics can determine by analysis of a visitor's cookies whether he or she is a new (first-time) visitor to your website or a returning (repeat) visitor. This distinction is referred to as visitor type, which you'll see in the segmenting drop-down and in the pivot view.
There are no functionality limitations on this report. You can perform Advanced Segments, table filters, and exporting/e-mailing options. You can also add this report to your dashboard.
The Languages report tells you what language options your visitors have enabled on their browsers of choice. The browser languages will be listed with their two-letter codes, so you'll have to know that "en" means English and "es" means Spanish. (Some of these codes are self-explanatory, and you'll most likely get the highest percentage of your traffic from the language that's native to you.) The Languages report also provides the first good example of a full-table view to show you how the standard reporting table is structured in Google Analytics, as shown in Figure 7-21.
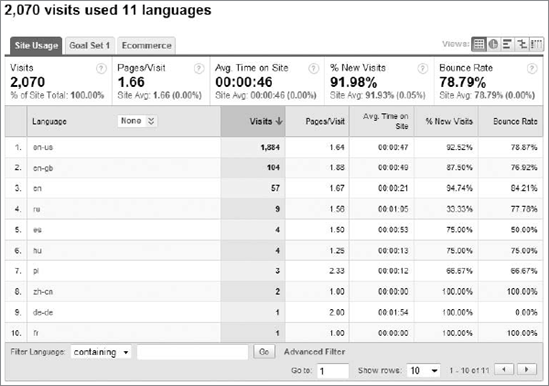
The very top of the report table will contain the Site Usage tab, showing you baseline data like visits and pages per visit; up to four Goal Set tabs, showing you conversion rates and goal values for your goal conversions; and an E-commerce tab, which (if enabled) shows you revenue and transaction data.
In a way, clicking these tabs is a form of segmenting your data — you're just using tabs instead of drop-down menus.
Directly across from the tabs are the report views that you are familiar with from earlier in the chapter. Below the tabs and the view toggle buttons is what's known as the scorecard. The scorecard shows you data for all line items within the report you're looking at. If you look again at Figure 7-21, you'll see data for all language sets in the scorecard. You'll see the metric name, the value for the metric, and either a comparison to the site average or contribution to total.
Below the scorecard are the column headings for the report data that you see. The first column heading contains a second drop-down menu called secondary dimension, which I'll demo in Chapter 9. These column headings are sortable, and default sorting is by the first metric from the left.
Clicking any line item will single it out in most reports and show you that line item's data isolated from the rest of the group. In a few reports you'll actually drill down one level deeper (for example, clicking a search engine name in the Traffic Sources section may show you the keywords searched for from that search engine).
At the bottom of the report table, as you know, is the filter tool, as well as yet another advanced feature for Chapter 9 called advanced table filtering. At the bottom right of the table you can expand to show more rows, go to a line-item number directly, or view the next page of line items. You can view a maximum of 500 rows at one time.
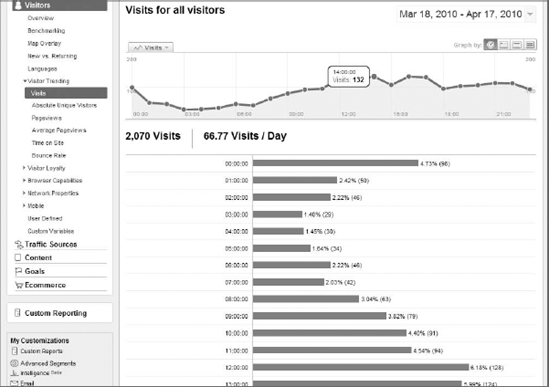
The Visitor Trending subsection of reports has six reports that are identical, the only difference being the metric that is displayed. Figure 7-22 shows the most basic of reports that you'll be able to find here in Google Analytics, but with one neat addition that's not available in any other type of report.
Each of the reports for the six visitor trending metrics (the "cornerstone" metrics from the Site Usage window on the dashboard) shows a histogram broken down by your selected date range. In Figure 7-22 I'm showing the visits per day, but I've selected the Graph by Hour trending graph view that's available only in these basic reports. Below the trending graph the breakdown by hour is shown.
The distribution of visits that you see in the trending graph is pretty consistent with that of most websites on the Internet. Most web activity happens during business hours and into the early evening, before midnight. Usually there is a steady drop-off in traffic after seven o'clock at night, and sometimes the drop-off is later. In this example there's a significant drop-off after midnight.
The Visitor Trending reports can be exported, downloaded, e-mailed, and segmented. They cannot be filtered because there is no standard table filter available here.
The Visitor Loyalty reports are an interesting group of reports in that they allow you to measure visitor retention and to some extent the awareness of your brand by your website visitors. Four reports in this subsection allow you to measure loyalty (how many times visitors visit your site in a given period), recency (how long ago visitors visited your site in a given period), length of visit (how long a visit lasted, on average), and depth of visit (how deep, in terms of page views, each visit went, on average).
Even though these reports are histograms like the Visitor Trending reports, they're an important group for several reasons. For one, this information is available only here, in this section. (The data from this report isn't available in the segmented format you see in Figure 7-23 unless you perform some Advanced Segments, which I'll talk about in Chapter 9.) Another reason is the sheer value of this information.
For most websites, Figure 7-23 will be a familiar representation of the site's data. It tells you the following:
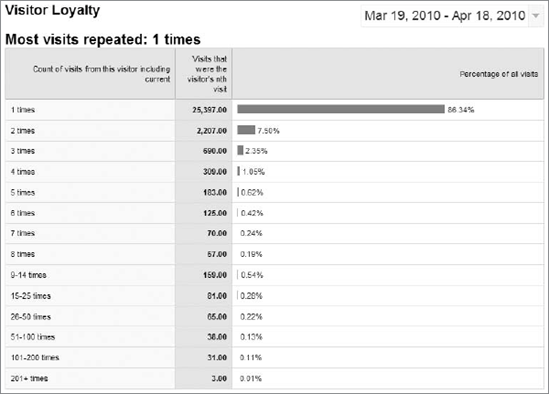
Over time, depending on your marketing, site optimization, and branding work, you'll notice certain trends beginning to develop, such as fewer visitors visiting your site only once in their lifetimes. You can follow these trends over time by using the date-range comparison tool. As you build your audience and customer base, you'll want to get an idea of how often customers come back to your site and how deep they go. A good initial gauge of overall website success comes when you start cutting into that overwhelming group of visitors who interact very little with your site — it's like you're winning them over.
Because this report doesn't have a standard report table, it cannot be filtered. However, it can be e-mailed, added to the dashboard, and exported, and have Advanced Segments applied.
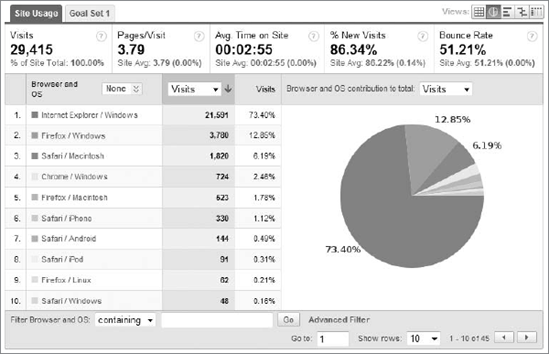
In the Browser Capabilities subsection are seven reports to slice and dice your visitor's technical details, as in Figure 7-24. Google Analytics collects this information for each visitor and stores it in this report section. This section may not seem useful for most folks, but if you're a web designer, it's vital to ensure that your websites are designed optimally for the majority of your visitors.
Within Browser Capabilities, the seven available reports are:
Browsers: What browsers your site's visitors used (Internet Explorer, Firefox, etc.)
Operating Systems: The operating systems used by your site's visitors (Windows Vista, OS X, iPhone, etc.)
Browser and OS: A report showing you the most popular combinations of browser and operating system (see Figure 7-24)
Screen Colors: How many colors the video cards on your visitors' computers can see (32-bit, 16-bit, etc.)
Screen Resolutions: The screen-resolution sizes for your visitors' computers (1024×768, 800×600, etc.)
Flash Versions: The version of Flash installed on your visitors' browsers (10.0 rx, 9.0 rx, etc.)
Java Support: Whether your visitors have Java installed on their computers
The Network Properties subsection includes a few more technical reports. Two of the reports are mostly for your enjoyment, as they don't provide any real insight. The third report is actually a very valuable technical report that allows you to see what URLs your Google Analytics Tracking Code is installed on.
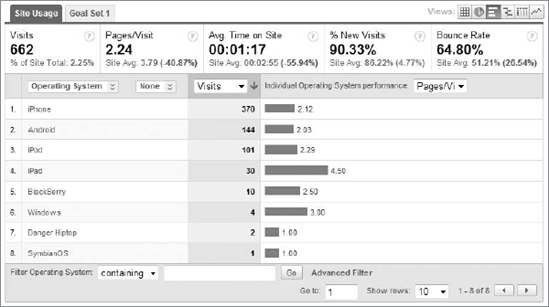
The Mobile report section includes two reports to help you analyze the visitors who come to your site via a web-enabled mobile phone or a mobile device like the iPad. If you have a mobile site or are just interested in the mobile traffic that your site receives, this report is for you.
The two reports in this section are:
Mobile Devices: This report shows the actual mobile devices that your website visitors use. Be prepared to see a lot of iPhone, Android, and iPad traffic listed here.
Mobile Carriers: The service providers for your visitors' mobile devices are listed here, such as AT&T, T-Mobile, Sprint, and others.
Keep this in mind when looking at this report: Google Analytics can report only on mobile traffic that accepts JavaScript, cookies, and images. If the mobile device being used is not "Web 2.0-enabled," or is configured to block JavaScript, cookies, or images, then Google Analytics cannot report on that visitor, and he or she will not be listed in this (or any) report. Check out Figure 7-25 for an example of the Mobile Devices report.
The second major reporting section within Google Analytics is the Traffic Sources section. Here you'll find data on how your visitors accessed your site, and just like the Visitors reporting section, this report starts off with its own overview section providing high-level traffic source information.
Excluding the overview, the reports in this section are:
Direct Traffic: Shows the volume of direct traffic to your website
Referring Sites: The traffic that is referred to you from another website
Search Engines: Organic and paid search engine traffic that your site receives
All Traffic Sources: A roll-up report combining all the different sources of traffic in one view
AdWords: A subsection within the Traffic Sources section providing you with data on your AdWords campaigns (more on this in Chapter 14)
Keywords: The keywords visitors searched for to access your site
Campaigns: The campaigns visitors came to your site from
Ad Versions: The ad version that a user clicked to reach your site
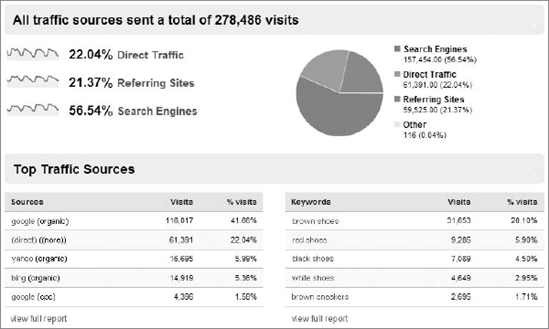
As you can see in Figure 7-26, Google Analytics organizes the traffic sources into three different categories: Direct Traffic, Referring Sites, and Search Engines. Direct traffic is traffic that comes to your site directly when visitors type the URL of your site into their browser address bars (or reach it via a bookmark). Referring sites contain traffic from visitors who clicked links to your site from other sites. Search engines are self-explanatory; there are organic search engines and paid search engines (labeled "cpc").
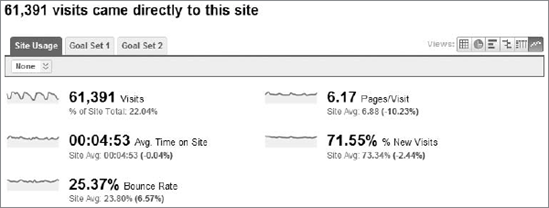
The Direct Traffic report shows you the traffic that came to your site directly. Direct traffic can happen when a user types or copies the URL of your website into his or her browser address bar. It can also happen if a user bookmarks your site after visiting your site directly, and accesses your site later via that bookmark. You can also get direct traffic if users have a page on your site as their browsers' starting page.
The Direct Traffic report is quite bland, but since I haven't shown this "individual" report view yet, this is a good opportunity to do just that. Figure 7-27 shows an example of the Direct Traffic report.
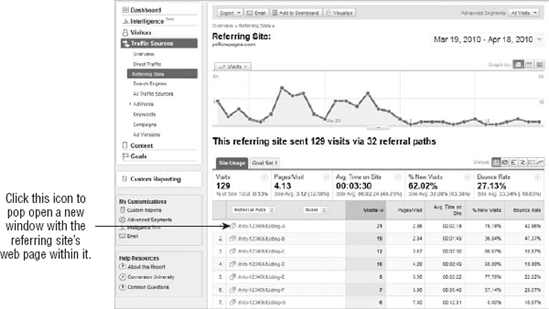
A referring site in Google Analytics is any website (other than a search engine) that's responsible for sending you traffic. If a site has a text or image link pointing to your site, and a user clicks it, the user will be counted as a referral. The visitor's referring site URL will be listed in this valuable report.
All referring sites are listed that are responsible for at least one visit to your site within your specified date range. This makes life interesting — sites that you may never have heard of will appear on this list, piquing your curiosity and leaving you wondering where your link actually resides on the referring site, and what it looks like. But with Google Analytics, you're very rarely left just wondering. Clicking any individual referring site listed in the report table will show you the page(s) on that site that contain your link (and have sent at least one visit to your site). The great part about this report is the little icon that appears next to the page name, which you can make out in Figure 7-28. Clicking that icon will open up a new window and take you directly to the page where your link is located on the referring site! In the example shown in Figure 7-28 I'm taking a look at the pages from www.yellowpages.com, which is a referring site sending my website traffic.
The Search Engines report within the Traffic Sources section offers a neat toggle feature that is not available in any other report in Google Analytics. You'll notice three text links at the very top of Figure 7-29 that enable you to show the total volume for both paid and organic search engines, paid search engines only, or non-paid (organic) search engines only. This can be very helpful, since you don't have to switch among reports on the navigation menu — you can simply use the text links above the report.
In this report, when you click a name of a search engine you will view a list of keywords that drove traffic from that selected search engine. This is the easiest possible way to perform segmenting in Google Analytics, and if you advertise with Google AdWords or do SEO on your site, you're definitely going to want to dive into Google, Yahoo!, and Bing at least.
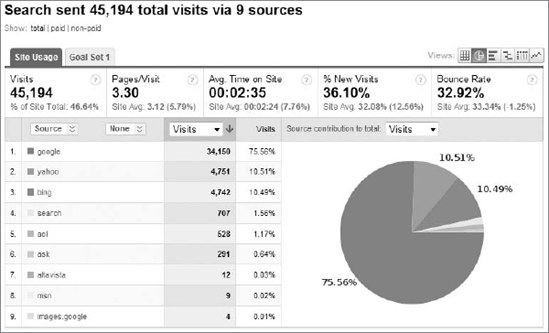
Notice two interesting things in Figure 7-29: the eighth row says MSN, which is also considered a search engine (remember that before the Bing days, MSN.com was Microsoft's search engine), and the ninth row says images.google, which is considered a search engine as well. (Seeing traffic from images.google reminds me to advise you to optimize your images, if you don't already, by using the ALT image tag and descriptive text near the image itself on your web page for higher presence in this engine.)
This is possibly the most accessed report in all of Google Analytics, and one you should become very familiar with. The All Traffic Sources report combines the traffic you receive from direct, referring, and search engines (paid and organic), and rolls them all up in this awesome report.
Look at Figure 7-30. First the report lists the traffic sources paired with their corresponding media. Remember that a medium is the means by which a visitor accesses your site. So, the second line item in Figure 7-30 reads google/organic, which is the source/medium combination. The tenth line item at the bottom reads charter.net/referral, which you now know is a referring site. If there were any traffic from Google AdWords, it would be listed as google/cpc. Finally, the first line item is direct/(none) because direct traffic doesn't have a medium (so Google Analytics labels it as "none"). Here, as in the Search Engines report, you can click an organic or paid search engine to drill down and view its keywords, but when you click either a referring site or the direct line item, you'll be taken to the individual report (which looks exactly like the one I showed earlier in Figure 7-27).
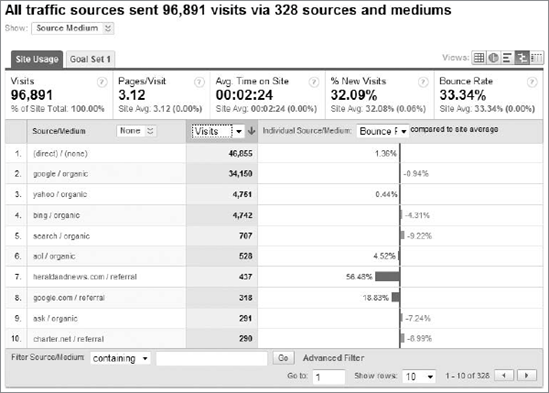
This is a great report on which to use the filter tool at the bottom of the report table. For example, you could type the word google into the filter tool and view all data for any source containing the word Google (paid, organic, or referral site, such as images.google.com). Or, you can exclude the word google to see what traffic you get that does not come from a Google property.
Note
Looking for the AdWords report subsection of the Traffic Sources section in Google Analytics? Flip over to Chapter 14.
Another of the most popular reports in Google Analytics (and the web-analytics industry, for that matter) is the Keywords report. All website owners want to know what keywords drove traffic to their websites, and with good reason. You can view more information about your organic keywords here, and you can see which pages visitors land on and lots of other information by segmenting. If you're a paid advertiser, this report is pure gold because it provides the missing information that you've been yearning for ever since Part II of this book, when I covered Google AdWords.
To really get an idea of how valuable your keywords are, you can click the Goal Set or E-commerce tab in this report, as you can in any standard report view. Click an individual keyword to isolate it from the other keywords, and use segmenting to backtrack and discover which search engine(s) drove traffic via this keyword, among many other segmenting possibilities.
This report, like the Search Engine report shown in Figure 7-29, also contains the Total, Paid, and Non-Paid toggle links for your convenience. The report itself looks like the Search Engines report, so I'll spare you a repetitive image.
Mainly for pay-per-click advertising efforts, this report lists all campaigns that have generated traffic to your site. Organic, referral, and direct traffic does not have to carry a campaign name, but cost-per-click initiatives like AdWords and manually tagged URLs (which I'll talk about in Chapter 17) do.
Ad Versions is the final report of the Traffic Sources section, and it lists all headlines of all ads in any cost-per-click campaign you're running. If you're using the Keyword Insertion function that you learned about from the AdWords chapters, those will appear in this report as well. You'll have to perform some basic segmenting here to discover what search engines, keywords, campaigns, and other data are associated with any entry in this report. If you manually tag links in the way I explain in Chapter 17, the ad content variables (like banner ad sizes and ad names) will show up in this report as well.
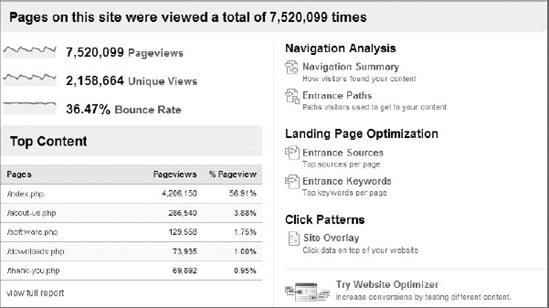
Up next in the Google Analytics interface is the Content section of reports (see Figure 7-31). On the overview report of the Content section, you'll quickly realize that this section is all about the actual pages of your site. You'll learn what pages were popular ones, and which were the most entered and exited. This section has a unique set of features unavailable in any other report.
The Content section of reports in Google Analytics offers you the following reports:
Top Content: A full listing of every page of your website
Content by Title: A list of your site's pages by each page's title tag
Content Drilldown: Your pages grouped together by subdirectory
Top Landing Pages: The pages that served as entry points into your site
Top Exit Pages: The pages that served as jumping-off points for your site visitors
Site Overlay: Click data shown graphically on top of your site
Site Search: Data on your site's internal search function (more on this in Chapter 9)
Event Tracking: Reporting on your Flash- and AJAX-based website events
AdSense: Reports on your Google AdSense account
By looking at the earlier Figure 7-31, you'll notice on the right-hand side of the overview screen that you're provided with links to perform a navigation summary or look at your site's entrance paths. We'll save those for the very end of this section of the chapter.
Along with the All Traffic Sources report, the Top Content report is one of the most popular and most accessed in Google Analytics. It is a full listing of all of your website's pages that have received at least one page view. In the Content section you are shown a modified report table with different metrics. For example, in Figure 7-32, you'll see that the sole tab of the Top Content report is called Content Performance. The columns of metrics now include the page views metric, the unique page views metric, the percentage of exits metric and the $index metric. Gone from this report table are the visits, pages per visit, and percentage of new visits metrics that you've been accustomed to until now.
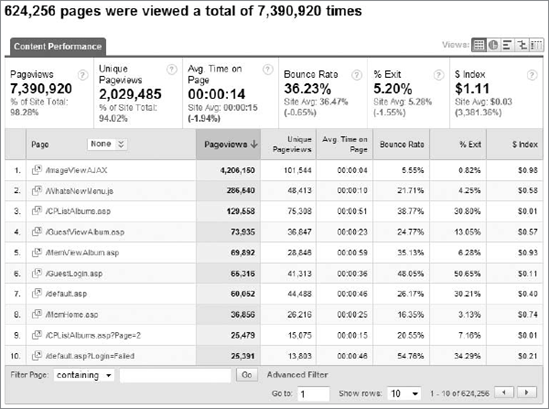
Just as with the Referring Sites report, you can click the small icon next to a page name to pop open a new browser window that will show you the web page on your site. When you click a page name you'll see that page singled out and separated from the rest of the pages listed, allowing you to perform some deeper analysis on that page by itself.
The reports in the Content section do not come equipped with Goal Set or E-commerce tabs. Instead, Google Analytics provides the $index metric, which gives you insight into the value of each page (the higher the $index metric, the more valuable the page is, essentially).
The Content by Title report looks exactly like the Top Content report, except for the fact that the line items in the report are page titles, not page file names. The number of pages listed in the Content by Title report could very easily not be identical to the number of pages in the Top Content report for the simple reason that if you have multiple pages using the same title meta-tag, those pages will be grouped together under the same line item. If all your pages use the same title meta-tag, then this report will show you one line item. I hope this isn't the case, and that each of your pages has a unique title meta-tag.
This report is almost exactly like both the Top Content and the Content by Title reports. They look, smell, and taste the same. What makes the Content Drilldown report different is the fact that this report groups subdirectories together, and lists all pages without a standalone subdirectory structure. If you use subdirectories for organizing your pages, you can make use of this report. Many people reading this book will never have need of this report.
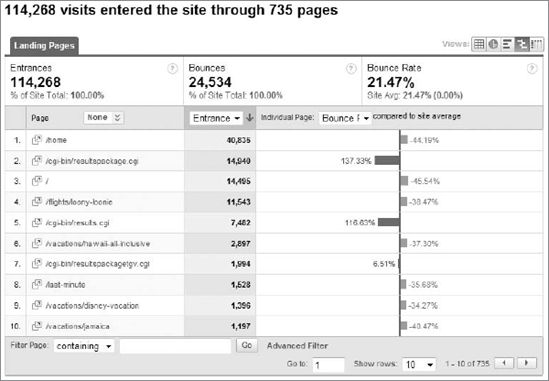
Unlike the previous report, this report should always be used! The Top Landing Pages report is one of my all-time favorites in Google Analytics. It shows you all the pages that were used as entry points into your website. It's not the Top Content report, which lists all pages that have had at least one page view in the selected date range. Here, you get only pages that have been used as entrances, so not all website pages will be seen here.
Figure 7-33 shows the Top Landing Pages report in action. It features a very simple layout, focusing on entrances, bounces, and the bounce rate metric that you've been hearing about throughout this book and especially in this chapter. When combined with the comparison view, with the individual drop-down menu focused on bounce rate, this makes for one of the most useful and best reports Google Analytics has to offer. I find that the simplicity of this report is also a nice change of pace from the mountains of data that other reports throw your way.
The Top Exit Pages report is the complete opposite of the Top Landing Pages report, since it shows you the pages that directly led to exits from your website. For reasons that I'll save for Chapter 8, this report is not to be used for any type of analysis, and is for informational purposes only (see the "Unfortunate and Common Misconceptions" section of the next chapter).
The Site Overlay report is among the most unusual reports in Google Analytics. There are no report table, no segmenting possibilities, and no trending graph to see. Instead, when you click the Site Overlay report link, a new window will automatically pop up and your website's homepage will be displayed. After a few seconds the screen will refresh and you'll see click data on top of your website. You'll see the percentage of clicks that each link on your site received, and when you mouse over any of the click data points, you'll see how many goal conversions and e-commerce transactions each link received.
Figure 7-34 is an image of the Site Overlay report that I found on images.google.com from the http://blog.sageinternet.com/ website. It shows the website bWEST Interactive and the site overlay data on top of that website.
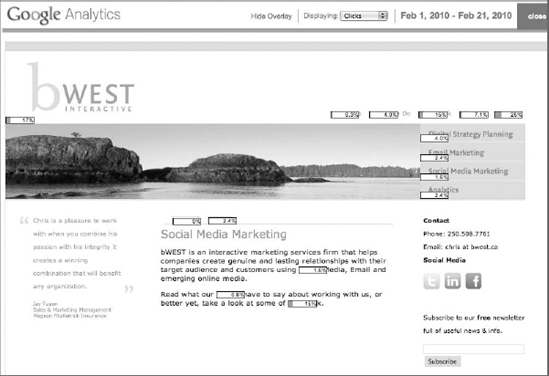
I feel obligated to point out that the Site Overlay report isn't perfect. In fact, there are lots of ways in which this report can break or not work properly. Normally, heavy amounts of Flash or AJAX objects will break the report, causing a wide variety of problems. When the report works, it is a great one, as you can actually see where people are clicking on your website. However, it has been plagued by functionality issues for years. It's my hope that one day this report section will be fixed and made to work with the Web 2.0 elements that are a part of so many websites today.
One of the two tools I want to highlight from the Content section is the Navigation Summary. When you click any page individually, you are provided with the option to perform this navigation summary on the right-hand side of the page. Figure 7-35 shows an example of the navigation summary for the default. aspx page of this particular website (which is the homepage). The Navigation Summary report gives you a three-page scenario for all visitors who encountered the selected page.
On the left of Figure 7-35 you'll see the top 10 pages that people viewed before the default.aspx page, sorted by the percentage of clicks that each page received (the total contribution). In this example, 68.85 percent of all traffic consisted of entrances directly to the default.aspx page, and 31.15 percent of the traffic originated from a previous page. The small page icon in the very middle of the screenshot represents the selected page, which in this case is the default.aspx page.
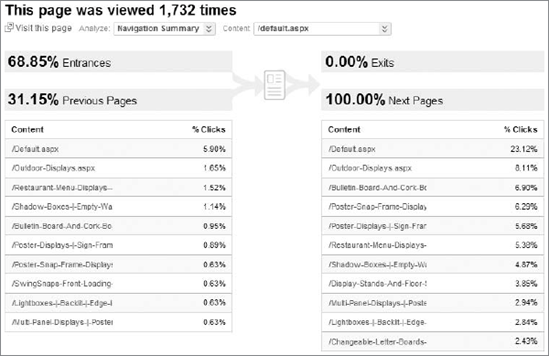
On the right-hand side of Figure 7-35, the page visited immediately after the default.aspx page is shown. In this example there were no site exits after the default.aspx page was viewed (which is very good), and 100 percent of the traffic coming through this page visited another page of the site. Here the top 11 pages are listed.
One question usually asked about the Navigation Summary is why the same page sometimes appears as both the previous and next page in the report. The answer is actually somewhat complex — the simplest explanation is that there are lots of user reasons this happens (page refreshes, back/forward browser button usage, clicking the link for the same page a user is on, and others). This confusion of activity results in some confusion in the report.
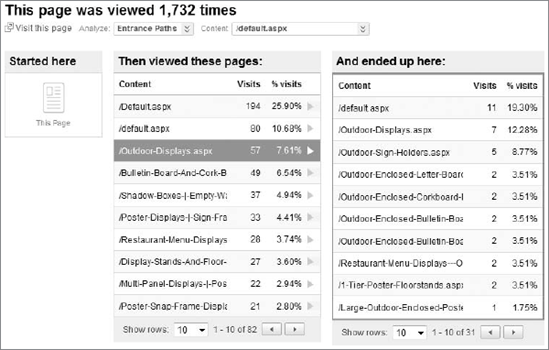
The other scenario-analysis tool that may be of use to you in the Content report section is the Entrance Paths report. The Navigation Summary report shows a three-page scenario of traffic that flows in and out of the selected page. Here, in the Entrance Paths reports, you select a starting page, view the pages that were seen by your visitors immediately afterward, and then manually select a page to view where visitors who chose that page ultimately wound up.
An example of the Entrance Paths report is shown in Figure 7-36. I once again selected the default.aspx page as my starting point. Directly to the right of the This Page symbol, I saw the top 10 pages to which visitors went after viewing the default.aspx page. I then clicked Outdoor-Displays.aspx, which is the fourth line item in that column, in order to view where visitors wound up who came from the homepage and then immediately visited the Outdoor-Displays.aspx page. As you'll notice, some returned to the homepage, while others went back to the Outdoor-Displays.aspx page or some other website page.
To be completely honest with you, I seldom use either the Navigation Summary or the Entrance Paths report in Google Analytics. I find that they are lacking in the simplicity department, and while I understand what can cause the same page name to appear as both the previous and next page, the general population doesn't.
The next-to-last section in Google Analytics (and in this chapter) is the Goals section. This section focuses entirely on the outcomes that you can set up within the Google Analytics profile settings. Goals are important actions that visitors take on your website, such as viewing a key page, filling out a contact form, or purchasing something from your online store. In Google Analytics, a goal is counted when a unique page view is made. This is on purpose so that multiple page views by the same user on the same page aren't replicated, which can heavily inflate your goal counts.
Aside from the Overview report, the Goals section includes the following reports:
Total Conversions: A histogram showing the conversions that occur each day
Conversion Rate: Another histogram displaying the total and daily conversion rate for your site
Goal Verification: The page URLs that match your goals
Reverse Goal Path: The last four pages that users visited to reach a goal page
Goal Value: A histogram showing the goal value by day
Goal Abandoned Funnels: A report that displays the abandonment rate
Funnel Visualization: A highly important report showing how visitors travel through a predefined funnel
If visitors encounter a message to "Set up goals and funnel before continuing," it means this task has not been done yet, and they may have to contact an administrator to help them set up the goals.
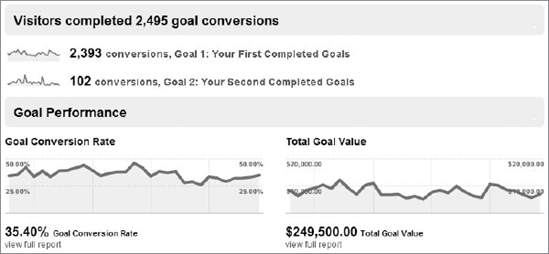
When you click Goals from the left-hand navigation menu, you'll see a simple overview page showing you the number of completed goals for each goal that you set up, as well as the total goal-conversion rate and total goal value for all active goals. In Figure 7-37 there are only two goals set up for this profile, but remember that you can set up as many as 20 goals per profile.
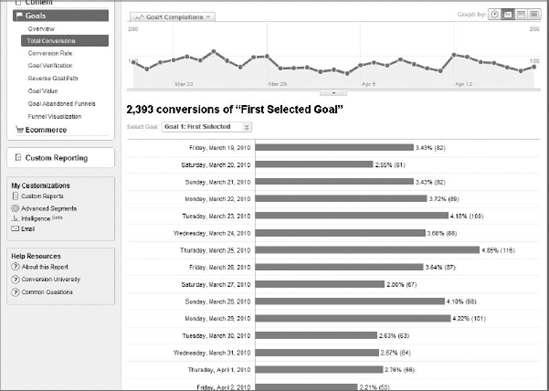
As I just mentioned, this report is a simple histogram showing your conversions for each day listed vertically. With the provided drop-down menu you can view each goal individually, or the total conversions for all goals. For good measure, I'll throw in Figure 7-38 to show an example of this report.
The Conversion Rate report is exactly the same as the Total Conversions report, except that — you guessed it — it shows conversion rate instead of the total number of conversions. So in essence Google Analytics is giving you two options for viewing a daily breakdown of your goals: either by the count of conversions or by the rate of conversions.
When we start talking about Regular Expressions in Chapter 10, I'll show an example of this Goal Verification report, which can come in handy if you're matching a single goal to multiple URLs. This report can show you all matches within your date range for a specific goal. For example, if you're tracking any view of your /partners/ subdirectory as a goal, and have set up /partners/ as a goal, you'll see all the pages within that subdirectory that resulted in a goal match. Remember that goals equal unique page views, so repeated page views within a subdirectory won't be counted as goals.
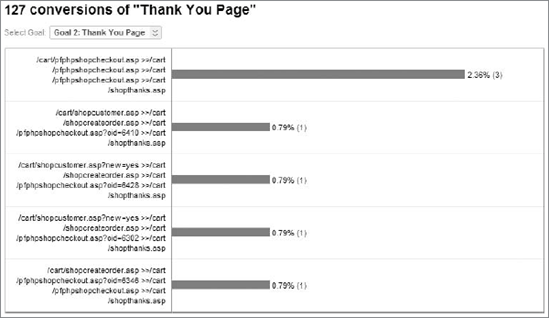
The Reverse Goal Path report shows you the last four steps taken by visitors to reach any selected goal. This report can provide a little bit of insight for you, as you'll quickly notice that several different combinations are shown as paths users take to reach your goal page(s).
Figure 7-39 shows an example of the Reverse Goal Path report for Goal 2, which shows that there were 127 conversions for a Thank You Page in this date range. On the left-hand side in the middle of the page, the last four page-path combinations are shown, and on the right, percentage bars are displayed with the percentage of goals and the goal count for each combination. For this goal, the top reverse goal path had three conversions. All the other reverse goal paths had only one apiece. This suggests that there are as many ways to reach this goal as there are interested visitors to this site (another reason to optimize every page of your site, not just your homepage or what you perceive to be the important pages).
As you've read up to this point, you can insert a goal value for each and every goal that you create. I always encourage people to use numerical values for goals (aside from the actual total counts of goals) because it's a vital part of analysis intelligence (which I'll discuss in more depth in Chapter 8). This report is another one of the basic reports, like Total Conversions and Conversion Rate, for which the sums of daily goal values are listed vertically.
Even though this is yet another basic type of histogram report, it introduces a very important metric — abandonment rate. Abandonment rate is the percentage of visitors who leave your goal funnel before completing it. As you'll read much more about, especially when I start talking about Google Website Optimizer, goal funnel optimization is one of the hidden treasures for increasing one's conversion rate. Not a lot of folks bother optimizing the pages that they define as goal funnels, leading to a lot of folks being unable to increase their conversion rates no matter what they try. As you continue reading, you'll find out ways to do just that.
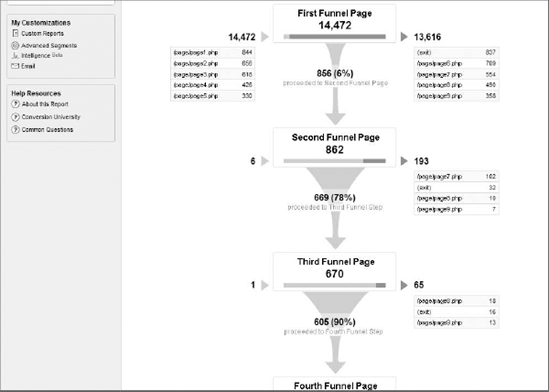
The last report in the Goals section is quite possibly the most vital, and is arguably the single most important report in terms of conversion rate optimization. The Funnel Visualization report provides a neat visualization showing you your defined funnel, where visitors enter the funnel, and where visitors exit the funnel, detailing the information through each individual funnel step.
Figure 7-40 shows an example funnel that starts at a faux First Funnel Page, as you can see from the top of the figure. To the left of that area are the top five pages from which visitors enter this first funnel step. To the right of that area are the top five pages to which visitors go when they exit the funnel without continuing to the second step. Notice the (exit) line item — these are the visitors who exit the website entirely. In the middle portion below First Funnel Step, where the green arrow points down, is the number of visitors who have continued to the second step of the funnel, and the percentage of visitors who do so is represented in parentheses.
The process repeats itself for each of the individual funnel steps until you reach the goal page. For each individual goal, you can create up to 10 goal funnel steps. The Funnel Visualization report is awesome for e-commerce websites (with shopping carts and long checkout processes), but it also works great for anyone who simply wants to measure how each page in the conversion process behaves.
You'll want to look at this report to see if any step along the way is preventing visitors from successfully completing the goal, such as pages for which (exit) is listed as a "page" to which visitors often go instead of the next funnel step.
The final section of reports in Google Analytics is the E-commerce section. If you sell a product or service online, this section will help you view transaction, product, and revenue data right within this last reporting section. As you'll learn in Chapter 10, you'll need to install additional JavaScript programming to your shopping cart's receipt or the thank-you page a user sees after successfully making a purchase on your site.
The E-commerce report section includes the following reports:
Total Revenue: Revenue in a daily histogram
Conversion Rate: Similar to the report in the Goals section, but calculating the e-commerce conversion rate vs. the goal conversion rate
Average Order Value: A histogram charting the average order value for all transactions within the specified date range
Product Performance: A subsection of reports detailing all product-oriented data
Transactions: Another vertical histogram charting daily transactions
Visits to Purchase: A Visitor Loyalty–style report showing how many visits visitors perform before making a transaction
Days to Purchase: How many days it takes visitors to perform a transaction
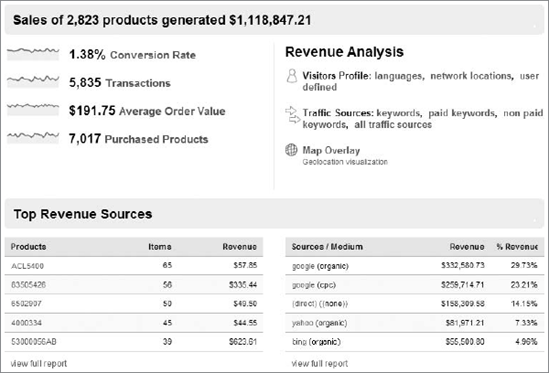
Figure 7-41 shows the overview of the E-commerce report section. The conversion rate, transactions, average order value, and number of purchased products are immediately shown, along with some revenue analysis links on the right-hand side. On the bottom part of the overview page you can see the top products and traffic sources in terms of revenue.
The interesting thing about the E-commerce section — and to some extent the Goals section — is that you won't find yourself spending too much time here. Instead, you'll find yourself using the Goal Set and E-commerce tabs available in almost every report within Google Analytics, obtaining your e-commerce data that way. The in-report tabs are super-convenient and come pre-segmented for the individual report you're in (keywords, traffic sources, visitor type, etc.).
One of four histogram-style reports in this section, Total Revenue plots your overall revenue (including shipping and tax) per day. Remember that this information is also available in the E-commerce tabs throughout Google Analytics.
This Conversion Rate report is not the same as the Conversion Rate report in the Goals section. This conversion rate is for e-commerce only — the report in the Goals section counts conversions from all goals. One of your goals could be the receipt or "Thank You" page from your e-commerce shopping system — check with your Google Analytics account administrator, who should be able to tell you for sure. The conversion rate from your goal that may be the "Thank You" page of your shopping cart system should be very close to the figures that appear in this report.
This metric is very important for any business owner, accountant, or C-level executive (that's "C" as in CEO or CPO). It's vital for the life of your business to know how much money on average you're bringing in from online sales. You may want to check this histogram report from time to time, since your average order value can fluctuate depending on what you do in terms of marketing, site optimization, or SEO work.
This mini subsection of reports highlights the information about the individual products ordered from your site.
Product Overview: Each product ordered from all transactions in the specified date range is listed. You'll notice that in the report table, some new metrics appear in the scorecard, all of which are very easy to understand. Quantity, Unique Purchases, Product Revenue, Average Price, and Average Quantity are the five scorecard metrics that appear, instead of the standard visits and page views you see in most every other report.
Product SKUs: Google Analytics collects the SKU or the code of each one of your products, and provides you with a report categorized by SKU.
Categories: As you'll learn in Chapter 10, one optional piece of information that you can add to any product within any order is the product's category. Some online stores aren't organized by category, which is why this field is optional.
The Transactions report is a standard report table with data about the individual transactions performed on your site. Each transaction is denoted by a transaction ID that is pulled in from your system. In the scorecard, you'll see Revenue, Tax, Shipping, and Quantity metrics.
The neat part about this report table is evident when you click an individual transaction ID. Let's say that you see the first transaction ID listed with a very large purchase price next to it. You can click to view the details of that transaction, including the purchased products as well as the quantity and price of each individual product. The trending graph above the report table will refresh and show one spike on one day, showing you the day on which the transaction occurred.
Figure 7-42 shows an example of what the final two reports of this section look like. The Visits to Purchase report essentially displays your sales cycle in the style of the Visitor Loyalty report from the Visitors section. The Days to Purchase report is very similar.
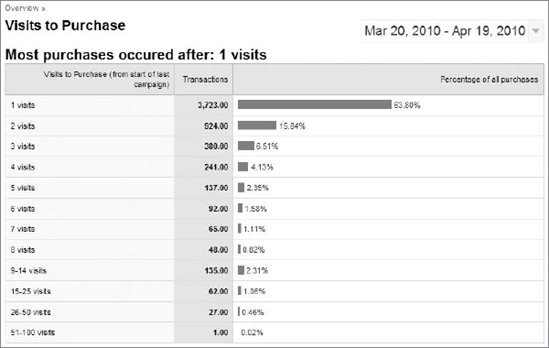
You don't need me to tell you how important it is to know your online sales cycle. However, I will tell you that for most online stores, most purchases happen within one visit. For the largest percentage of merchants, this is optimal. You want visitors to buy in as few visits as possible, to reduce the chance that they will go somewhere else (remember, you probably have lots of competitors hungry to take your business away from you).
As you refine your marketing efforts and optimize your website over time, do visitors start purchasing within fewer visits? Do 70 percent of visitors purchase an item this month within one visit, against 65 percent within one visit last month? Pay close attention and even go as far as adding this report to your dashboard to stay on top of your online sales cycle.
The Days to Purchase report looks and feels exactly like the Visits to Purchase report, except that it shows you how many days it takes visitors to purchase something from your website.
As you may have guessed, the highest percentage of visitors make a transaction within the same day that they visit your site (represented in this report by "0 days"). Keep in mind that while most visitors purchase on the same day, some visitors may make a few visits in the same day before purchasing. A solid idea of how many days it takes for your visitors to purchase, combined with the Visits to Purchase report, can help you gauge your e-commerce efforts.