
As I noted earlier, the option of adding a "safety increment" to every task is not a good approach because there’s a risk that Parkinson’s Law will prevail. In addition, you would have to increase the estimates by a surprisingly large amount to substantially increase the chance of meeting your schedule.
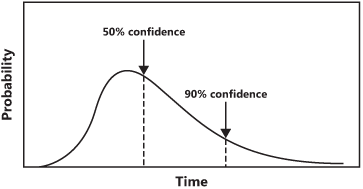
An estimate is really a probability distribution. That is, there is some probability of completing a task, or an entire project, at a given time or cost. As Figure 10-2 illustrates, the probability distribution for an estimate is not symmetrical: A long tail extends to the right along the time axis (DeMarco and Lister 2003; Goldratt 1997). That’s because many factors and events could potentially delay the task completion, but the most damaging events have a low probability of occurrence. However, a minimum time is required to complete the task even under the best of circumstances, so the probability distribution is skewed to the right. The area under the curve from the left edge (project launch) to a given time indicates the probability that the task will be completed by that time. Adding enough safety time to move from, say, the 50 percent probable estimate to the 90 percent confidence level can practically double the duration. Including a safety factor in each task therefore greatly extends the schedule, although it does increase your chances of achieving that generous schedule.
Critical chain project management offers a more sophisticated approach to incorporating contingency buffers (Leach 2000; Zultner 1999). Unlike the task-oriented critical-path concept, the critical chain considers both task and resource dependencies. The critical chain of tasks is the longest sequence of tasks that leads to project completion, after all resource conflicts have been resolved. In critical chain planning, you estimate each task at the nominal 50 percent confidence level, which means that half of the tasks will be completed ahead of plan and about half will be late. In addition, you remove the safety time from individual tasks, which encourages team members to strive to meet the stated estimates.
The schedule safety net is provided through feeding buffers that the project manager inserts at the end of major activity sequences along the critical chain of project tasks, as illustrated in Figure 10-3. An additional project buffer is placed at the end of the critical chain. To calculate the buffer sizes, first estimate the safety time that would increase the estimate probability from 50 percent to 90 percent for each task in the critical chain. Then, take the square root of the sum of the squares of these individual task contingencies (Leach 2000). This results in a buffer considerably smaller than one you would get by simply totaling the individual safety times for the critical chain tasks. However, the project schedule buffer should be at least 25 percent of your critical chain duration (Leach 2000).
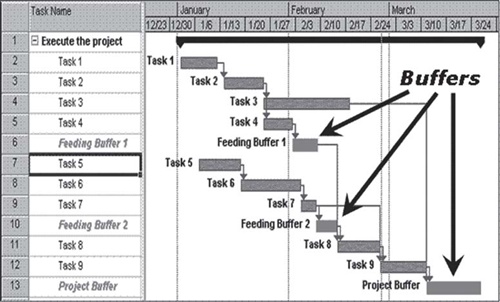
Table 10-1 illustrates such a calculation for a hypothetical project with a critical chain consisting of seven tasks. Of course, there would likely be other tasks that aren’t on the critical chain. I estimated the individual task contingencies by considering that some tasks have less risk or are simpler than others. The total task duration is 28 days and the total task contingency is 20 days, so simply summing these would nearly double the nominal 50 percent probability estimated duration. However, the square root of the sum of the squares of the individual task contingencies (70 days) is just 8.4 days. Adding this to our 50 percent probability estimate gives us a contingent schedule of approximately 36 days, compared to the nominal schedule of 28 days. This amounts to a 29 percent reserve, which seems like a sensible cushion to build into your project schedule to account for uncertainties and risks.
The safety buffers in critical chain project management represent a pooling of risk—the risk of not completing tasks on time—as a technique for dealing with those tasks that do slip. Studies suggest that using critical chain contingency buffers for planning can substantially improve a project’s schedule performance (Schragenheim and Dettmer 2001).
As my colleague Michael Green says, "It’s not my estimating process that’s weak. It’s my chronic inability to see the invisible, know the unknowable, and predict the unpredictable that keeps throwing me off." Given the many sources of uncertainty on software projects, the wise project manager will use contingency buffers to protect his team members from undue stress and help them meet their commitments.