A
Excel 2003 Object Model
Most of the objects in the Excel Object Model have objects with associated collections. The collection object is usually the plural form of the associated object. For example, the Worksheets collection holds a collection of Worksheet objects. For simplicity, each object and associated collection will be grouped together under the same heading.
Common Properties with Collections and Associated Objects
In most cases the purpose of the collection object is only to hold a collection of the same objects. The common properties and methods of the collection objects are listed in the following section. Only unique properties, methods, or events will be mentioned in each object section.
Common Collection Properties
Common Collection Methods
Common Object Properties
Objects also have some common properties. To avoid redundancy the common properties and methods of all objects are listed next. They will be mentioned in each object description as existing but are only defined here.
Excel Objects and Their Properties, Methods and Events
The objects are listed in alphabetical order. Each object has a general description of the object and possible parent objects. This is followed by a table format of each of the object's properties, methods, and events. The last section of each object describes some code examples of the object's use.
Addin Object and the Addins Collection
The Addins collection holds all of the Addin objects available to Excel. Each Addin object represents an Addin shown in Excel's Addins dialog box under the Tools ![]() Add-Ins… menu. The Addin must be installed (AddIn.Installed = True) to be able to use it in the current session. Examples of available Addin objects in Excel include the Analysis Toolpack, the MS Query Addin, and the Conditional Sum Wizard.
Add-Ins… menu. The Addin must be installed (AddIn.Installed = True) to be able to use it in the current session. Examples of available Addin objects in Excel include the Analysis Toolpack, the MS Query Addin, and the Conditional Sum Wizard.
The Add method of the Addins collection can be used to add a new Addin to the collection. The Add method requires a FileName to be specified (usually with a XLL or XLA file extension). The Count property of the Addins collection returns the number of Addins that are available for use by the current Excel session.
Addin Common Properties
The Application, Creator, and Parent properties are defined at the beginning of this Appendix.
Addin Properties
Example: Addin Object and the Addins Collection
This example ensures that the Analysis Toolpack is installed:
Sub UseAnalysisToolpack()
   Dim oAddin As AddIn
   'Make sure the Analysis Toolpack is installed
   For Each oAddin In AddIns
      If oAddin.Name = “ANALYS32.XLL” Then
         oAddin.Installed = True
      End If
   Next
End Sub
Note that instead of looping through the Addins collection, you could follow the online Help and use:
AddIns(“Analysis Toolpak”).Installed = True
Unfortunately, this approach may not work with a non-English User-Interface language, if the Addin's title has been localised.
Adjustments Object
The Adjustments object holds a collection of numbers used to move the adjustment “handles” of the parent Shape object. Each Shape object can have up to eight different adjustments. Each specific adjustment handle can have one or two adjustments associated with it depending on if it can be moved both horizontally and vertically (two) or in just one dimension. Adjustment values are between 0 and 1 and hence are percentage adjustments—the absolute magnitude of a 100% change is defined by the shape being adjusted.
Adjustments Common Properties
The Application, Creator, and Parent properties are defined at the beginning of this Appendix.
Adjustments Properties
Example: Adjustments Object
This example draws a block arrow on the sheet, then modifies the dimensions of the arrow head:
Sub AddArrow()
    Dim oShp As Shape

    'Add an arrow head to the sheet
    Set oShp = ActiveSheet.Shapes.AddShape( _ msoShapeRightArrow, 10, 10, 10 0,    50)

    'Set the ‘head’ of the arrow to start 30% of the way across
    'and the ‘shaft’ to start 40% of the way down.
    oShp.Adjustments(1) = 0.3     'Left/right
    oShp.Adjustments(2) = 0.4     'Up/down
End Sub
AllowEditRange Object and the AllowEditRanges Collection
The AllowEditRange object represents a range of cells on a worksheet that can still be edited when protected. Each AllowEditRange object can have permissions set for any number of users on your network and can have a separate password.
Be aware of the Locked property of the Range object when using this feature. When you unlock cells, then protect the worksheet, you are allowing any user access to those cells, regardless of the AllowEditRange objects. When each AllowEditRange object's cells are locked, any user can still edit them unless you assign a password or add users and deny them permission without using a password.
The AllowEditRanges collection represents all AllowEditRange objects that can be edited on a protected worksheet. See the AllowEditRange object for more details.
AllowEditRanges Collection Properties
AllowEditRanges Collection Methods
AllowEditRanges Properties
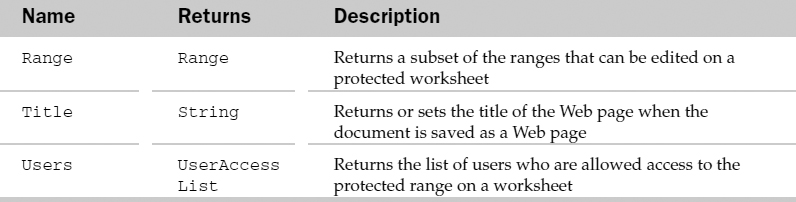
AllowEditRange Methods
Example: AllowEditRange Object
The following routine loops through a list of range names in a worksheet and adds an AllowEditRange item for each one whose name begins with “pc”. It also denies access to the pcNetSales range to all but one user, who can only edit the range with a password.
Sub CreateAllowRanges()

    Dim lPos As Long
    Dim nm As Name
    Dim oAllowRange As AllowEditRange
    Dim sName As String

    With wksAllowEditRange
        'Loop through the worksheet level
        ' range names
        For Each nm In .Names
            'Store the name
            sName = nm.Name

            'Locate the position of the “!”
            lPos = InStr(1, sName, “!”, vbTextCompare)

            'If there was an “!”…
            If lPos > 0 Then
               'Is there a “pc” just after the exclamation point
               'If so, it's a range we want to create an AllowEditRange
               ' object for
               If Mid(sName, lPos + 1, 2) = “pc” Then
                   'Make sure the cells are locked
                   'Unlocking them will allow any user
                   ' access to them.
                   nm.RefersToRange.Locked = True

                   'Pull out the worksheet reference (including the “!”)
                   ' from the range name
                   sName = Right(sName, Len(sName) - lPos)

                   'Create the AllowEditRange
                   'Remove the old one if it exists
                   On Error Resume Next
                       Set oAllowRange = Nothing
                       Set oAllowRange = .Protection.AllowEditRanges(sName)
                   On Error GoTo 0
                   If Not oAllowRange Is Nothing Then oAllowRange.Delete
                   Set oAllowRange = .Protection.AllowEditRanges.Add(sName, _ nm.RefersToRange)
                   'If it's the sales range name…
                   If sName = “pcNetSales” Then
                       'Add a password, then
                       'Add a user and deny them from editing the range
                       ' without the password
                       oAllowRange.ChangePassword “pcnsw”
                       oAllowRange.Users.Add “RCRAgamaOffice”, False
                   End If
               End If
           End If
       Next nm
   End With

End Sub
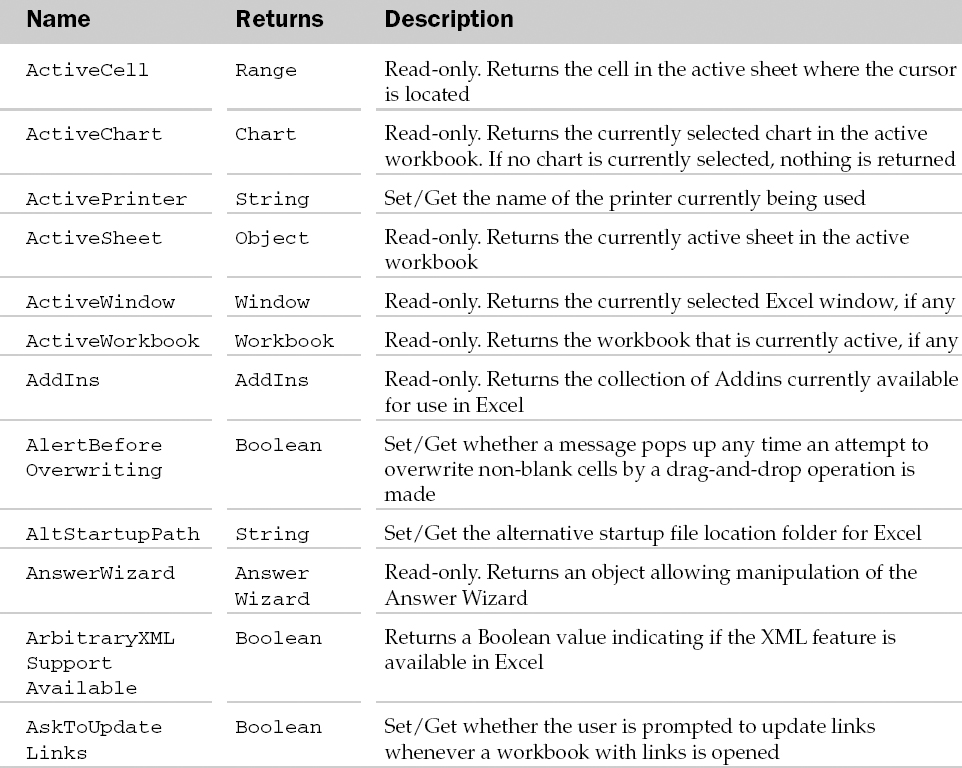
Application Object
The Application object is the root object of the Excel Object Model. All the other objects in the Excel Object Model can only be accessed through the Application object. Many objects, however, are globally available. For example, the ActiveSheet property of the Application object is also available globally. That means that the active WorkSheet can be accessed by at least two ways: Application.ActiveSheet and ActiveSheet.
The Application object holds most of the application level attributes that can be set through the Tools ![]() Options menu in Excel. For example, the DefaultFilePath is equivalent to the Default File Location text box in the General tab of the Options dialog box.
Options menu in Excel. For example, the DefaultFilePath is equivalent to the Default File Location text box in the General tab of the Options dialog box.
Many of the Application object's properties and methods are equivalent to things that can be set with the Options dialog box.
The Application object is also used when automating Excel from another application, such as Word. The CreateObject function, GetObject function or the New keyword can be used to create a new instance of an Excel Application object from another application. Please refer to Chapter 15 for examples of automation from another application.
The Application object can also expose events. However, Application events are not automatically available for use. The following three steps must be completed before Application events can be used:
Create a new class module, say, called cAppObject, and declare a Public object variable in a class, say, called AppExcel, to respond to events. For example:
Public WithEvents AppExcel As Excel.Application
Now the Application object events will be available in the class for the AppExcel object variable. Write the appropriate event handling code in the class. For example, if you wanted a message to appear whenever a worksheet is activated then you could write the following:
Private Sub AppExcel_SheetActivate(ByVal Sh As Object)
    'display worksheet name
    MsgBox “The ” & Sh.Name & “ sheet has just been activated.“
End Sub
Finally, in a procedure in a standard module instantiate the class created above with a current Application object:
Private App As New cAppObject 'class with the above code snippets
Sub AttachEvents()
    Set App.AppExcel = Application
End Sub
The EnableEvents property of the Application object must also be set to True for events to trigger at the appropriate time.
Application Common Properties
The Application, Creator, and Parent properties are defined at the beginning of this Appendix.
Application Properties
Application Methods

Application Events
Example: Application Object
This example demonstrates how to use Application.GetOpenFilename to get the name of a file to open. The key to using this function is to assign its return value to a Variant data type:
Sub UsingGetOpenFilename()
   Dim sFilter As String
   Dim vaFile As Variant
   'Build a filter list. If you omit the space before the first comma,
   'Excel will not display the pattern, (*.New)
   sFilter = “New Files (*.New) ,*.new,” & _
             “Old Files (*.Old) ,*.old,” & _
             “All Files (*.*) ,*.*”
   'Display the File Open dialog, putting the result in a Variant
   vaFile = Application.GetOpenFilename(FileFilter:=sFilter, FilterIndex:=1, _ Title:=“Open a New or Old File”,
MultiSelect:=False)
   'Did the user cancel?
   If vaFile <> False Then
      MsgBox “You want to open ” & vaFile
   End If
End Sub
'The Application object is used to store and retrieve custom sort orders:
Sub UsingACustomSortOrder()
   Dim vaSortList As Variant
   Dim iListNum As Integer
   Dim bAdded As Boolean
   'Sort the products in this order
   vaSortList = Array(“Oranges”, “Mangoes”, “Apples”, “Pears”)
   'Get the number of this custom sort, if it exists.
   iListNum = Application.GetCustomListNum(vaSortList)
   'If it doesn't exist, we get zero, NOT an error
   If iListNum = 0 Then
   'Create a custom list for this sort order
   Application.AddCustomList vaSortList

   'And retrieve its number (the last one!)
   iListNum = Application.CustomListCount

   'Remember that we added it - delete it after use
   bAdded = True
   End If
   'Sort the range using this custom list. Note that we have to
   'add 1 to the list number, as ‘ordercustom:=1’ means to use the
   'standard sort order (which is not a custom list)
   ActiveCell.CurrentRegion.Sort key1:=ActiveCell, _ ordercustom:=iListNum + 1, header:=xlYes
   'If we added the list, remove it.
   If bAdded Then Application.DeleteCustomList iListNum
End Sub
Chapter 3 in the first section of this book contains more examples of using the Application object.
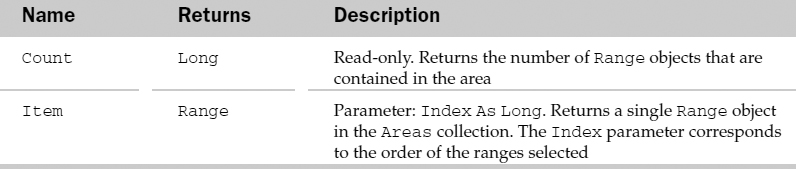
Areas Collection
The Areas collection holds a collection of Range objects. Each Range object represents a block of cells (for example, A1:A10) or a single cell. The Areas collection can hold many ranges from different parts of a workbook. The parent of the Areas collection is the Range object.
Areas Common Properties
The Application, Creator, and Parent properties are defined at the beginning of this Appendix.
Areas Properties
Example: Areas Collection
When using a Range containing a number of different areas, we cannot use code like rgRange.Cells(20).Value if the twentieth cell is not inside the first area in the range. This is because Excel only looks at the first area, implicitly doing rgRange.Areas(1).Cells(20).Value, as this example shows—with a function to provide a workaround:
Sub TestMultiAreaCells()
   Dim oRNg As Range
   'Define a multi-area range
   Set oRNg = Range(MD2:F5,H2:I5M)
   'The 12th cell should be F5.
   MsgBox “Rng.Cells(12) is ” & oRNg.Cells(12).Address & _
           vbCrLf & “Rng.Areas(1).Cells(12) is ” & _
                               oRNg.Areas(1).Cells(12).Address & _
           vbCrLf & “MultiAreaCells(Rng, 12) is ” & _
                               MultiAreaCells(Rng, 12).Address

   'The 13th cell of the multi-area range should be H2,
   'that is the first cell in the second area.
   MsgBox “Rng.Cells(13) is ” & oRNg.Cells(13).Address & _
                  vbCrLf & “Rng.Areas(1).Cells(13) is ” & _
                               oRNg.Areas(1).Cells(13).Address & _
                  vbCrLf & “MultiAreaCells(Rng, 13) is ” & _
                               MultiAreaCells(Rng, 13).Address
End Sub
Function MultiAreaCells(oRange As Range, iCellNum As Long) As Range
   Dim iTotCells As Long, oArea As Range
   'Loop through all the areas in the range,
   'starting again from the first if we run out
   Do
      For Each oArea In oRange.Areas
         'Is the cell we want in this area?
         If iTotCells + oArea.Cells.Count >= iCellNum Then

            'Yes - return it and exit the function
            Set MultiAreaCells = oArea.Cells(iCellNum - iTotCells)
            Exit Function
         Else
            'No - count up the cells we've checked and carry on
            iTotCells = iTotCells + oArea.Cells.Count
         End If
      Next
   Loop
End Function
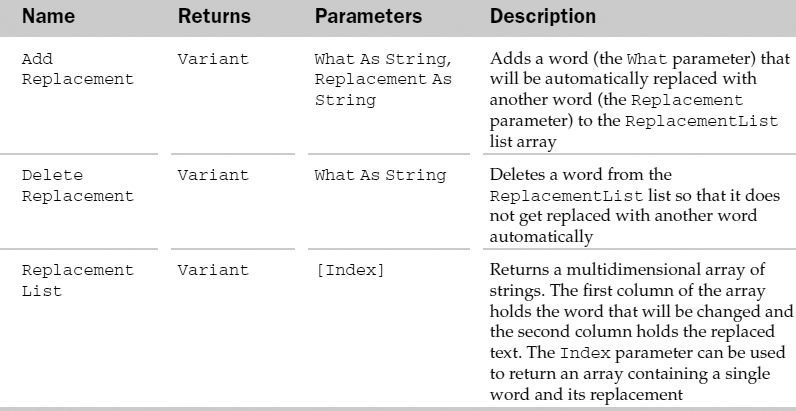
AutoCorrect Object
The AutoCorrect object represents all of the functionality of the Excel's AutoCorrect features.
AutoCorrect Common Properties
The Application, Creator, and Parent properties are defined at the beginning of this Appendix.
AutoCorrect Properties
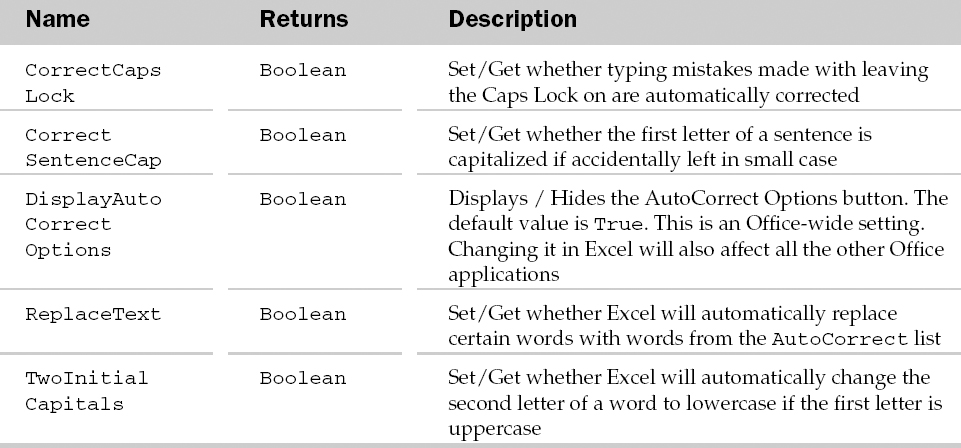
AutoCorrect Methods
Example: AutoCorrect Object
This example uses the AutoCorrect object to find the replacement to use for a given word:
Sub TestAutoCorrect()
   MsgBox “‘(c)’ is replaced by ” & UseAutoCorrect(“(c)”)
End Sub
   Function UseAutoCorrect(ByVal sWord As String) As String
      Dim i As Integer
      Dim vaRepList As Variant
      Dim sReturn As String
      'Default to returning the word we were given
      sReturn = sWord
      'Get the replacement list into an array
      vaRepList = Application.AutoCorrect.ReplacementList
      'Go through the replacement list
      For i = LBound(vaRepList) To UBound(vaRepList)
         'Do we have a match?
         If vaRepList(i, 1) = sWord Then
            'Return the replacement text
            sReturn = vaRepList(i, 2)
            'Jump out of the loop
         Exit For
      End If
   Next
   'Return the word, or its replacement if it has one
   UseAutoCorrect = sReturn
End Function
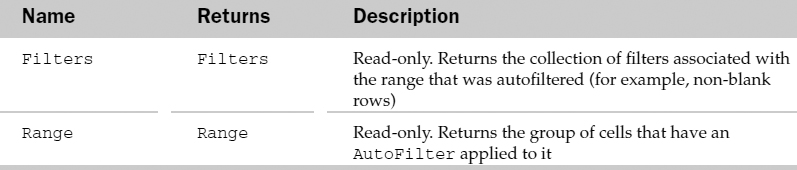
AutoFilter Object
The AutoFilter object provides the functionality equivalent to the AutoFilter feature in Excel. This object can programmatically filter a range of text for specific types of rows, hiding the rows that do not meet the filter criteria. Examples of filters include top 10 rows in the column, rows matching specific values, and non-blank cells in the row. Using the Data ![]() Filter
Filter ![]() AutoFilter submenu in Excel can access this feature. The parent of the AutoFilter object is the Worksheet object (implying that a worksheet can have only one AutoFilter).
AutoFilter submenu in Excel can access this feature. The parent of the AutoFilter object is the Worksheet object (implying that a worksheet can have only one AutoFilter).
The AutoFilter object is used with the AutoFilter method of the Range object and the AutoFilterType property of the Worksheet object.
AutoFilter Common Properties
The Application, Creator, and Parent properties are defined at the beginning of this Appendix.
AutoFilter Properties
Example: AutoFilter Object
This example demonstrates how to use the AutoFilter, Filters and Filter objects, by displaying the complete set of auto-filters currently in use:
Sub ShowAutoFilterCriteria()
   Dim oAF As AutoFilter, oFlt As Filter
   Dim sField As String
   Dim sCrit1 As String, sCrit2 As String
   Dim sMsg As String, i As Integer
   'Check if the sheet is filtered at all
   If ActiveSheet.AutoFilterMode = False Then
      MsgBox “The sheet does not have an AutoFilter”
      Exit Sub
   End If
   'Get the sheet's AutoFilter object
   Set oAF = ActiveSheet.AutoFilter
   'Loop through the Filters of the AutoFilter
   For i = 1 To oAF.Filters.Count
      'Get the field name from the first row
      'of the AutoFilter range
      sField = oAF.Range.Cells(1, i).Value
      'Get the Filter object
      Set oFlt = oAF.Filters(i)
      'If it is on…
      If oFlt.On Then
         'Get the standard filter criteria
         sMsg = sMsg & vbCrLf & sField & oFlt.Criteria1
         'If it's a special filter, show it
         Select Case oFlt.Operator
            Case xlAnd
               sMsg = sMsg & “ And ” & sField & oFlt    .Criteria2
            Case xlOr
               sMsg = sMsg & “ Or ” & sField & oFlt.    Criteria2
            Case xlBottom10Items
               sMsg = sMsg & “ (bottom 10 items)”
            Case xlBottom10Percent
               sMsg = sMsg & “ (bottom 10%)”
            Case xlTop10Items
               sMsg = sMsg & “ (top 10 items)”
            Case xlTop10Percent
               sMsg = sMsg & “ (top 10%)”
         End Select
      End If
   Next
   If sMsg = “” Then
      'No filters are applied, so say so
      sMsg = “The range ” & oAF.Range.Address & “ is    not filtered.”
   Else
      'Filters are applied, so show them
      sMsg = “The range ” & oAF.Range.Address & “ is    filtered by:” & sMsg
   End If
   'Display the message
   MsgBox sMsg
End Sub
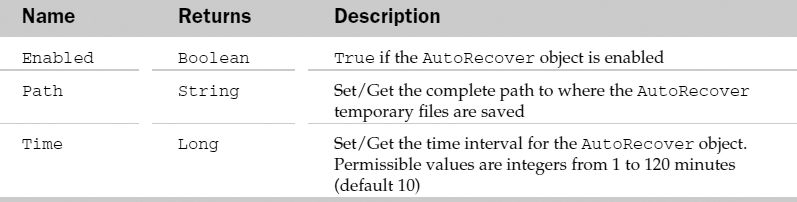
AutoRecover Object
This object allows access to the AutoRecover settings for the Excel application. These settings can be found on the Save tab of the Tools ![]() Options command and apply to all workbooks. Note that each workbook can choose whether or not to have AutoRecover applied to it—also located on the Save tab.
Options command and apply to all workbooks. Note that each workbook can choose whether or not to have AutoRecover applied to it—also located on the Save tab.
AutoRecover Common Properties
The Application, Creator, and Parent properties are defined at the beginning of this Appendix.
AutoRecover Properties
Example: AutoRecover Object
The following subroutine and function sets AutoRecover properties, then ensures that the workbook the code is in uses them:
Sub SetAutoRecoverOptions()
    'Set the AutoRecover options for the application
    ChangeAutoRecoverSettings True, “C:Documents and SettingsAgamaOfficeMy DocumentsBackup FilesAutoRecoverExcel”, 2

    'Make sure this workbook uses them
    ThisWorkbook.EnableAutoRecover = True
End Sub
Function ChangeAutoRecoverSettings(Optional ByVal vEnable As Variant,
Optional ByVal vPath As Variant, Optional ByVal vTime As Variant)
    With Application.AutoRecover
         'Only set the property if a value was passed
         If Not IsMissing(vEnable) Then
             'Enable AutoRecover
             .Enabled = vEnable
         End If

         'Only set the property if a value was passed
         If Not IsMissing(vPath) Then
             'Change the path to a central backup files area
             .Path = vPath
         End If
         'Only set the property if a value was passed
         If Not IsMissing(vTime) Then
             'Save every AutoRecover file every 2 minutes
             .Time = vTime
         End If
     End With
End Function
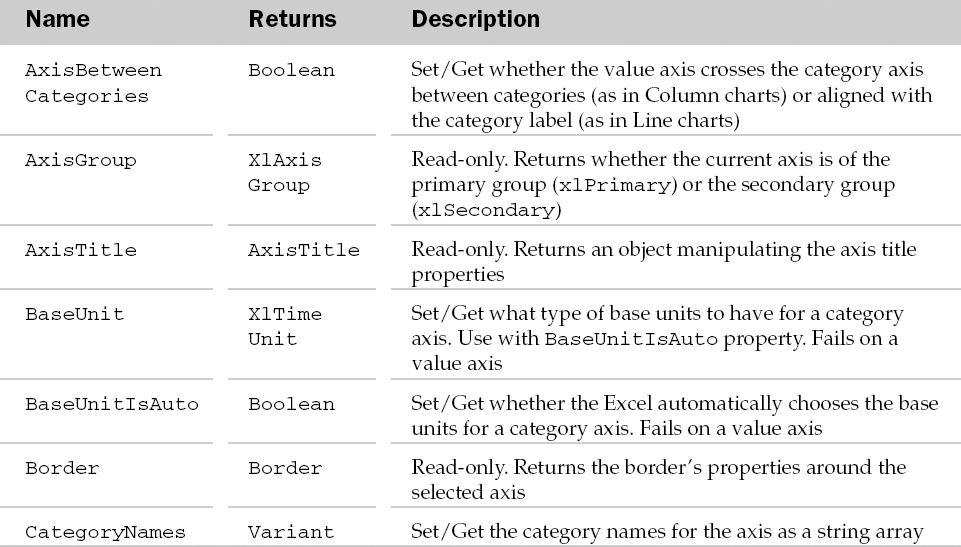
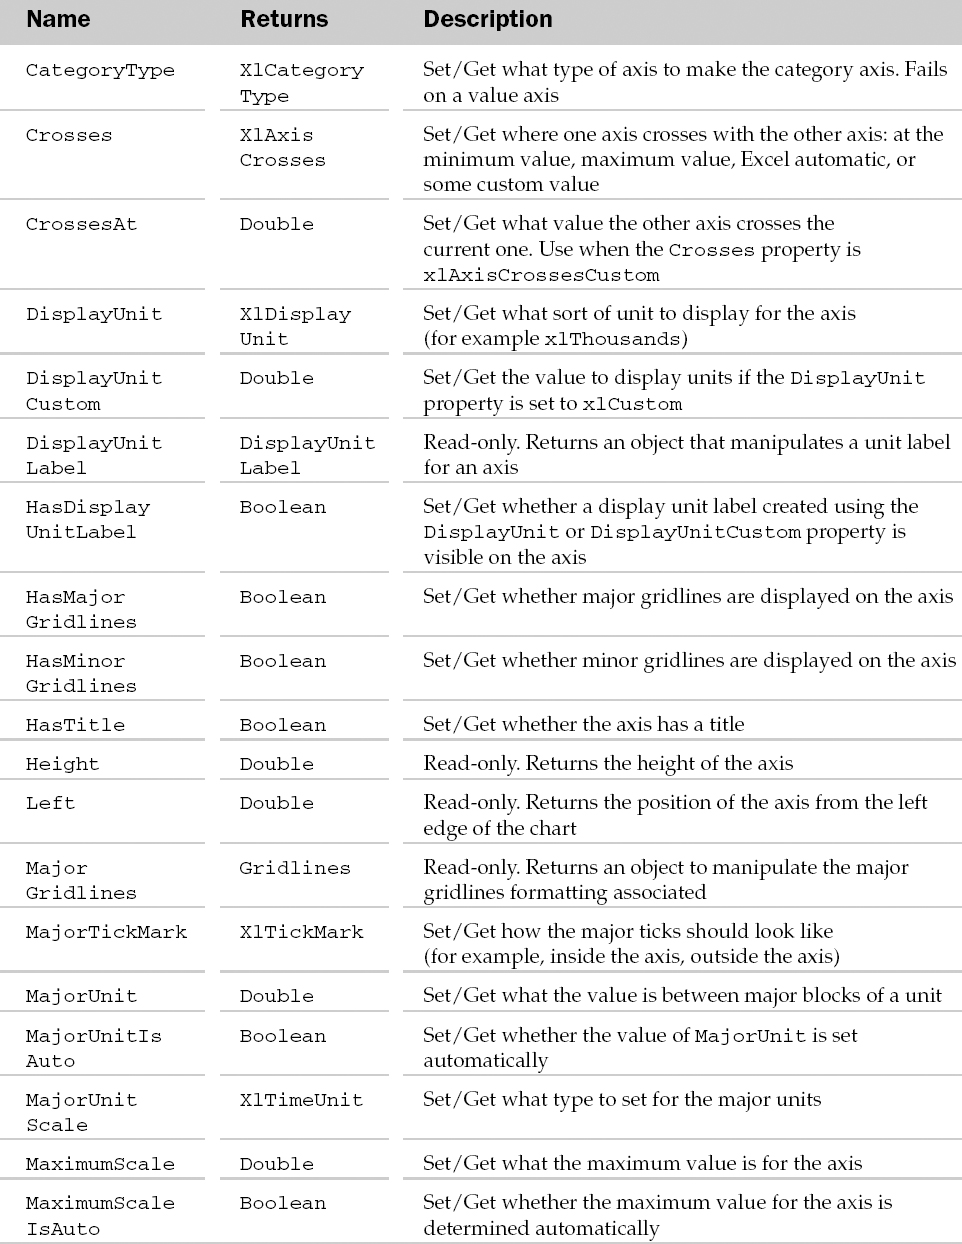
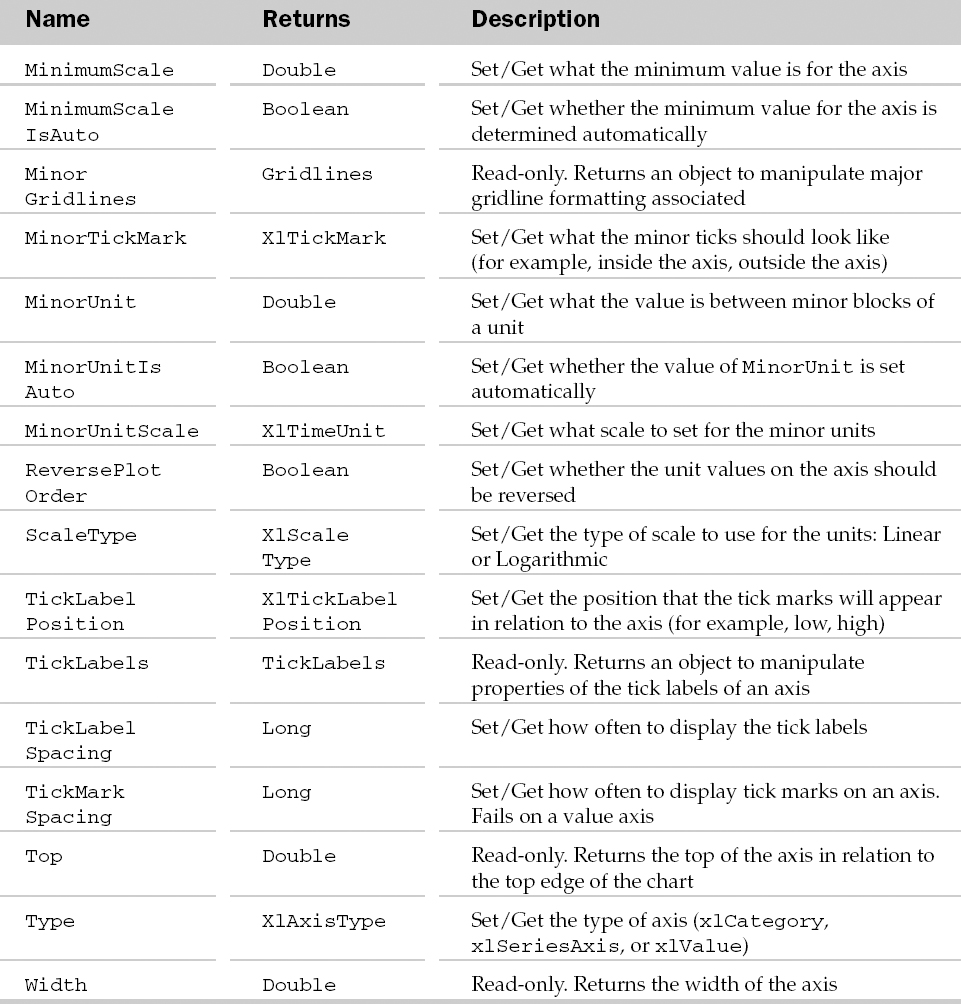
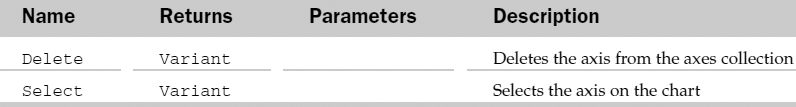
Axis Object and the Axes Collection
The Axes collection represents all of the Axes in an Excel chart. Each Axis object is equivalent to an axis in an Excel chart (for example, X axis, Y axis, etc.). The parent of the Axes collection is the Chart object.
Besides the typical properties and methods associated with a collection object, the Axes collection also has a Count property that returns the number of Axis objects in the collection. Also, unlike most other collections, the Item method of the Axes collection has two parameters: Type and AxisGroup. Use one of the xlAxisType constants for the Type parameter (xlValue, xlCategory, or xlSeriesAxis). The optional second parameter, AxisGroup, can take one of the xlAxisGroup constants (xlPrimary or xlSecondary).
Axis Common Properties
The Application, Creator, and Parent properties are defined at the beginning of this Appendix.
Axis Properties
Axis Methods
Example: Axis Object and the Axes Collection
This example sets the labels for the X-axis (independently of the data that's plotted) and applies some formatting:
Sub FormatXAxis()
   Dim oCht As Chart, oAxis As Axis
   'Get the first embedded chart on the sheet
   Set oCht = ActiveSheet.ChartObjects(1).Chart
   'Get it's X axis
   Set oAxis = oCht.Axes(xlCategory)
   'Format the X axis
   With oAxis
      .CategoryNames = Array(“Item 1”, “Item 2”, “Item 3”)
      .TickLabels.Orientation = 45
      .AxisBetweenCategories = True
      .ReversePlotOrder = False
      .MinorTickMark = xlTickMarkNone
   .MajorTickMark = xlTickMarkCross
     End With
End Sub
AxisTitle Object
The AxisTitle object contains the formatting and words associated with a chart axis title. The parent of the AxisTitle object is the Axis object. The AxisTitle object is used in coordination with the HasTitle property of the parent Axis object. The HasTitle property must be True for a child AxisTitle object to exist.
AxisTitle Common Properties
The Application, Creator, and Parent properties are defined at the beginning of this Appendix.
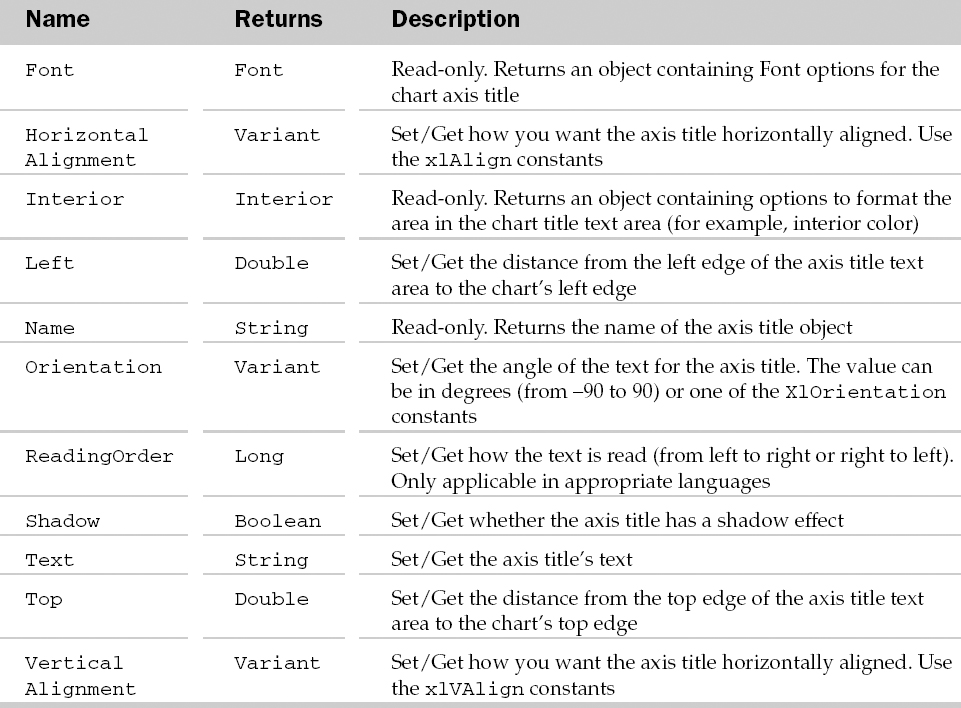
AxisTitle Properties
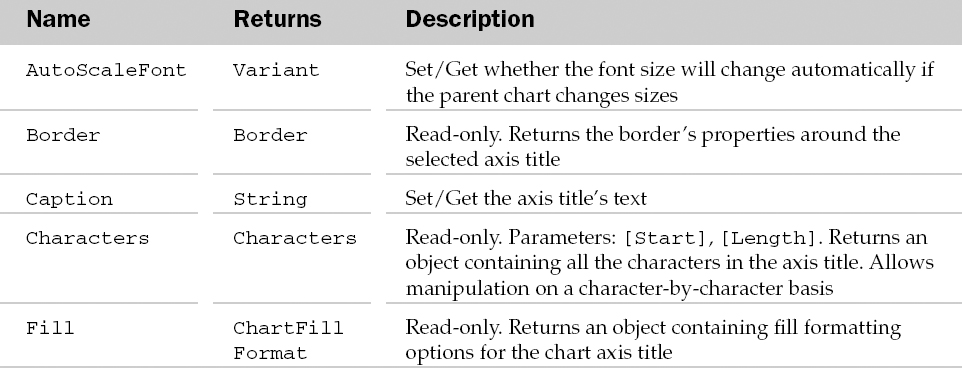
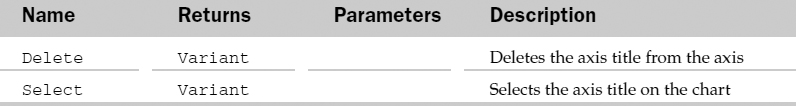
AxisTitle Methods
Example: AxisTitle Object
This example ensures the X-axis has a title and sets the X-axis title's caption and formatting:
Sub FormatXAxisTitle()
   Dim oCht As Chart, oAT As AxisTitle
   'Get the first embedded chart on the sheet
   Set oCht = ActiveSheet.ChartObjects(1).Chart
   'Give the X axis a title
   oCht.Axes(xlCategory).HasTitle = True
   'Get the title
   Set oAT = oCht.Axes(xlCategory).AxisTitle
   'Format the title
   With oAT
      .AutoScaleFont = False
      .Caption = “X Axis Title”
      .Font.Bold = True
   End With
End Sub
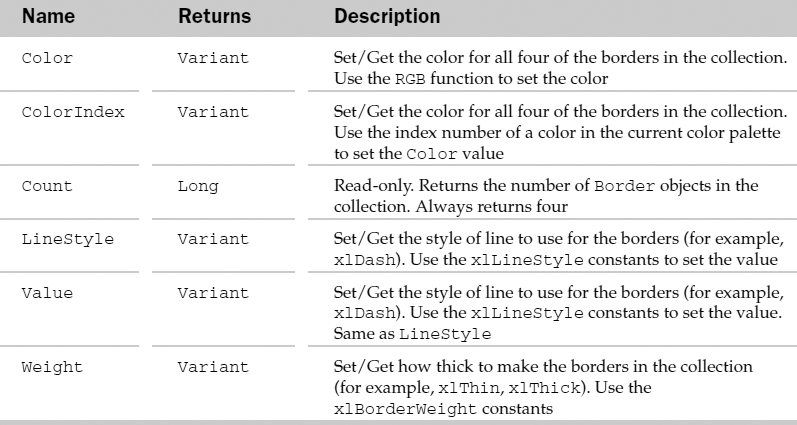
Border Object and the Borders Collection
The Borders collection contains the properties associated with four borders around the parent object. Parent objects of the Borders collection are the Range and the Style object. A Borders collection always has four borders. Use the xlBordersIndex constants with the Item property of the Borders collection to access one of the Border objects in the collection.
Each Border object corresponds to a side or some sides of a border around a parent object. Some objects only allow access to all four sides of a border as a whole (for example, left side of border can not be accessed independently). The following objects are parents of the Border object (not the Borders collection): Axis, AxisTitle, ChartArea, ChartObject, ChartTitle, DataLabel, DataTable, DisplayUnitLabel, Downbars, DropLines, ErrorBars, Floor, GridLines, HiLoLines, LeaderLines, Legend, LegendKey, OleObject, PlotArea, Point, Series, SeriesLines, TrendLine, UpBars, and Walls. The following collections are also possible parents of the Border object: DataLabels, ChartObjects, and OleObjects.
The Borders collection has a few properties besides the typical collection attributes. They are listed in the following table.
Borders Collection Properties
Border Common Properties
The Application, Creator, and Parent properties are defined at the beginning of this Appendix.
Border Properties
Example: Border Object and the Borders Collection
Applies a 3D effect to a range:
Sub TestFormat3D()
   'Format the selected range as 3D sunken
   Format3D Selection
End Sub
Sub Format3D(oRange As Range, Optional bSunken As Boolean = True)
   'Using the range…
   With oRange
       'Surround it with a white border
       .BorderAround Weight:=xlMedium, Color:=RGB(255, 255, 255)

       If bSunken Then
          'Sunken, so make the left and top dark-grey
          .Borders(xlEdgeLeft).Color = RGB(96, 96, 96)
          .Borders(xlEdgeTop).Color = RGB(96, 96, 96)
       Else
          'Raised, so make the right and bottom dark-grey
          .Borders(xlEdgeRight).Color = RGB(96, 96, 96)
          .Borders(xlEdgeBottom).Color = RGB(96, 96, 96)
       End If
   End With
End Sub
CalculatedFields Collection
See the PivotField Object, PivotFields Collection, and the CalculatedFields Collection section.
CalculatedItems Collection
See the PivotItem Object, PivotItems Collection, and the CalculatedItems Collection section.
CalculatedMember Object and the CalculatedMembers Collection
The CalculatedMembers collection is a collection of all the CalculatedMember objects on the specified PivotTable. Each CalculatedMember object represents a calculated field, or calculated item.
CalculatedMembers Common Properties
The Application, Creator, and Parent properties are defined at the beginning of this Appendix.
CalculatedMembers Collection Properties
CalculatedMembers Collection Methods

CalculatedMembers Collection Methods
The Application, Creator, and Parent properties are defined at the beginning of this Appendix.
CalculatedMember Properties
CalculatedMember Methods

Example: CalculatedMembers Collection and CalculatedMember Object
The following routine returns information about each CalculatedMember from the data source used by the PivotTable on the wksPivotTable worksheet. It returns messages if either the data source is not an OLAP type or if there are no CalculatedMembers:
Sub ReturnCalculatedMembers()
    Dim lIcon As Long, lCount As Long
    Dim ptTable As PivotTable
    Dim oCalcMember As CalculatedMember
    Dim oCalcMembers As CalculatedMembers
    Dim sInfo As String
    'Set the reference to the PivotTable
    Set ptTable = wksPivotTable.PivotTables(“WroxSales1”)
    On Error Resume Next
        Set oCalcMembers = ptTable.CalculatedMembers
    On Error GoTo 0

    'Did we return a reference to Calculated Members?
    If Not oCalcMembers Is Nothing Then
        'If there's at least one Calculated Member…
    If oCalcMembers.Count > 0 Then
            'Initialize the Count
        ' and message variables
        lCount = 1
            lIcon = vbInformation

            'Loop through each Calculated Member
        ' And store its name and formula
        For Each oCalcMember In oCalcMembers
                With oCalcMember
                   sInfo = sInfo & lCount & “) ” & .Name & “: ” & .    Formula
                   lCount = lCount + 1
                End With
            Next oCalcMember

        Else
            'It's a valid OLAP data source, but no
            ' Calculated Members are there
            lIcon = vbExclamation
            sInfo = “No Calculated Members found.”
        End If
    Else
        'oCalcMembers returned nothing. Not an OLAP data source
        lIcon = vbCritical
        sInfo = “Could not retrieve Calculated Members. Data Source may not be OLAP type.”
    End If

    MsgBox sInfo, lIcon, “Calculated Members”

End Sub
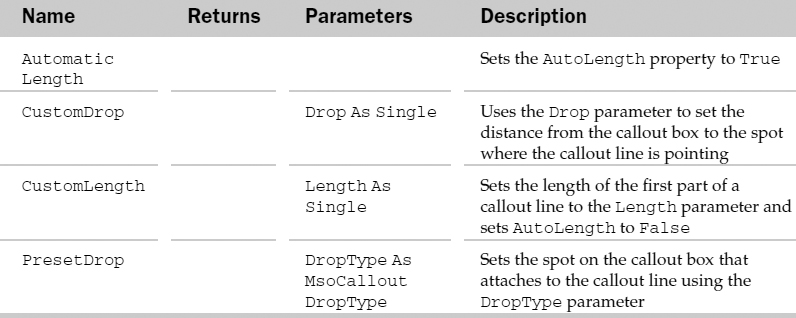
CalloutFormat Object
The CalloutFormat object corresponds to the line callouts on shapes. The parent of the CalloutFormat object is the Shape object.
CalloutFormat Common Properties
The Application, Creator, and Parent properties are defined at the beginning of this Appendix.
CalloutFormat Properties
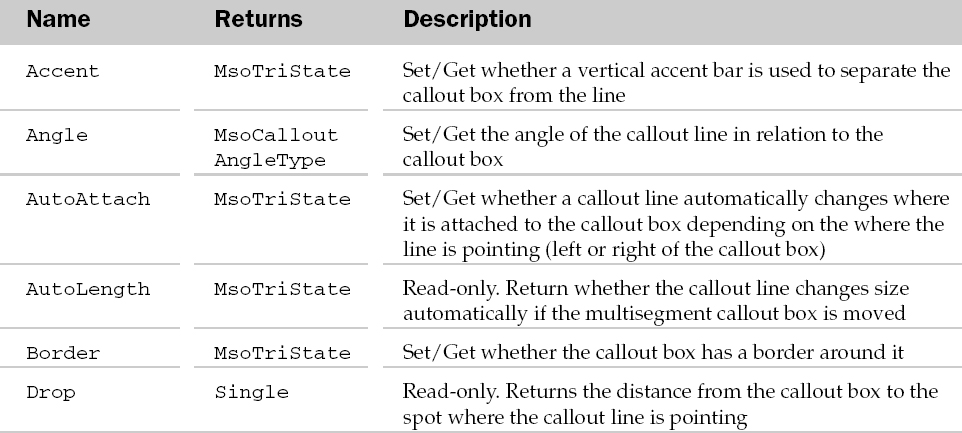
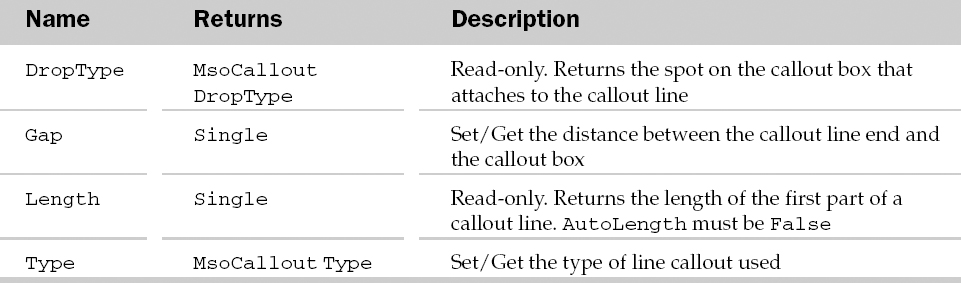
CalloutFormat Methods
Example: CalloutFormat Object
This example applies the same formatting to all the callouts in a worksheet:
Sub FormatAllCallouts()
   Dim oShp As Shape
   Dim oCF As CalloutFormat
   'Loop through all the shapes in the sheet
   For Each oShp In ActiveSheet.Shapes
      'Is this a callout?
      If oShp.Type = msoCallout Then
         'Yes - set its text box to autosize
     oShp.TextFrame.AutoSize = True

         'Get the CalloutFormat object
     Set oCF = oShp.Callout

         'Format the callout
     With oCF
            .Gap = 0
            .Border = msoFalse
            .Accent = msoTrue
            .Angle = msoCalloutAngle3 0
            .PresetDrop msoCalloutDropCenter
         End With
      End If
   Next
End Sub
CellFormat Object
Represents both the FindFormat and ReplaceFormat property settings of the Application object, which are then used by the Find and Replace methods (respectively) of the Range object.
Set the FindFormat property settings before using the Find method to search for cell formats within a range. Set the ReplaceFormat property settings if you want the Replace method to replace formatting in cells. Any values specified in the What or Replacement arguments of either the Find or Replace methods will involve an And condition. For example, if you are searching for the word “wrox” and have set the FindFormat property to search for Bold, only those cells containing both will be found.
When searching for formats, make sure the SearchFormat argument of the Find method is set to True. When replacing formats, make sure the ReplaceFormat argument of the Replace method is set to True.
When you want to search for formats only, make sure the What argument of the Find method contains nothing. When you only want to replace formats, make sure the Replace argument of the Replace method contains nothing.
When replacing one format with another, make sure you explicitly specify formats you no longer want. For example, if you are searching for cells containing both bold and red and want to replace both formats with just blue, you'll need to make sure you set the bold property of the ReplaceFormat property to False. If you don't, you'll end up with blue and bold text.
When you need to search or replace using different format settings (or none at all), be sure to use the Clear method of either the CellFormat object—if you've declared a variable as such, or by directly accessing the Clear methods of the FindFormat and ReplaceFormat properties. Setting the SearchFormat and ReplaceFormat arguments to False for the Find and Replace methods will not prevent the FindFormat and/or ReplaceFormat settings from being used.
CellFormat Common Properties
The Application, Creator, and Parent properties are defined at the beginning of this Appendix.
CellFormat Properties
CellFormat Methods
Example: CellFormat Object
The following routine searches through the used range in a worksheet replacing any cells containing both a Tahoma font and a light blue background with Arial light green background:
Sub ReplaceFormats()

    Dim oCellFindFormat As CellFormat
    Dim oCellReplaceFormat As CellFormat
    Dim rngReplace As Boolean, sMessage As String

    'Define variables for Find and Replace formats
    Set oCellFindFormat = Application.FindFormat
    Set oCellReplaceFormat = Application.ReplaceFormat

    'Set the Search criteria for the Find Formats
    With oCellFindFormat
         .Clear
         .Font.Name = “Tahoma”
         .Interior.ColorIndex = 34
    End With

    'Set the Replace criteria for the Replace Formats
    With oCellReplaceFormat
         .Clear
         .Font.Name = “Arial”
         .Interior.ColorIndex = 35
    End With

    'Perform the replace
    wksAllowEditRange.UsedRange.Replace What:=“”, Replacements“”,_
                                        SearchFormat:=True, _
                                        ReplaceFormat:=True

    'Reset the Find and Replace formats
    oCellFindFormat.Clear
    oCellReplaceFormat.Clear
End Sub
Characters Object
The Characters object allows access to individual characters in a string of text. Characters can have some of the visual properties modified with this object. Possible parents of the Characters object are the AxisTitle, ChartTitle, DataLabel, and the Range object. Each of the parent objects can use the Characters([Start], [Length]) property to access a part of their respective texts. The Start parameter can specify which character to start at and the Length parameter can specify how many to take from the Start position.
Characters Common Properties
The Application, Creator, and Parent properties are defined at the beginning of this Appendix.
Characters Properties
Characters Methods
Example: Characters Object
This example formats all the capital letters in the active cell in red with 16 point bold text:
Sub FormatCellCapitals()
   Dim sText As String
   Dim oChars As Characters
   Dim i As Integer
   'Get the text of the active cell
   sText = ActiveCell.Text
   'Loop through the text
   For i = 1 To Len(sText)
      'Is this character a capital letter?
      If Asc(Mid(sText, i, 1)) > 64 And Asc(Mid(sText, i, 1)) < 91 Then

         'Yes, so get the Characters object
     Set oChars = ActiveCell.Characters(i, 1)

         'Format the Characters object in Red, 16pt Bold.
     With oChars
            .Font.Color = RGB(255, 0, 0)
        .Font.Size = 16
        .Font.Bold = True
         End With
      End If
   Next
End Sub
Chart Object and the Charts Collection
The Charts collection holds the collection of chart sheets in a workbook. The Workbook object is always the parent of the Charts collection. The Charts collection only holds the chart sheets. Individual charts can also be embedded in worksheets and dialog sheets. The Chart objects in the Charts collection can be accessed using the Item property. Either the name of the chart can be specified as a parameter to the Item's parameter or an index number describing the position of the chart in the workbook (from left to right).
The Chart object allows access to all of the attributes of a specific chart in Excel. This includes chart formatting, chart types, and other charting properties. The Chart object also exposes events that can be used programmatically.
The Charts collection has a few properties and methods besides the typical collection attributes. These are listed in the following table.
Charts Collection Properties and Methods
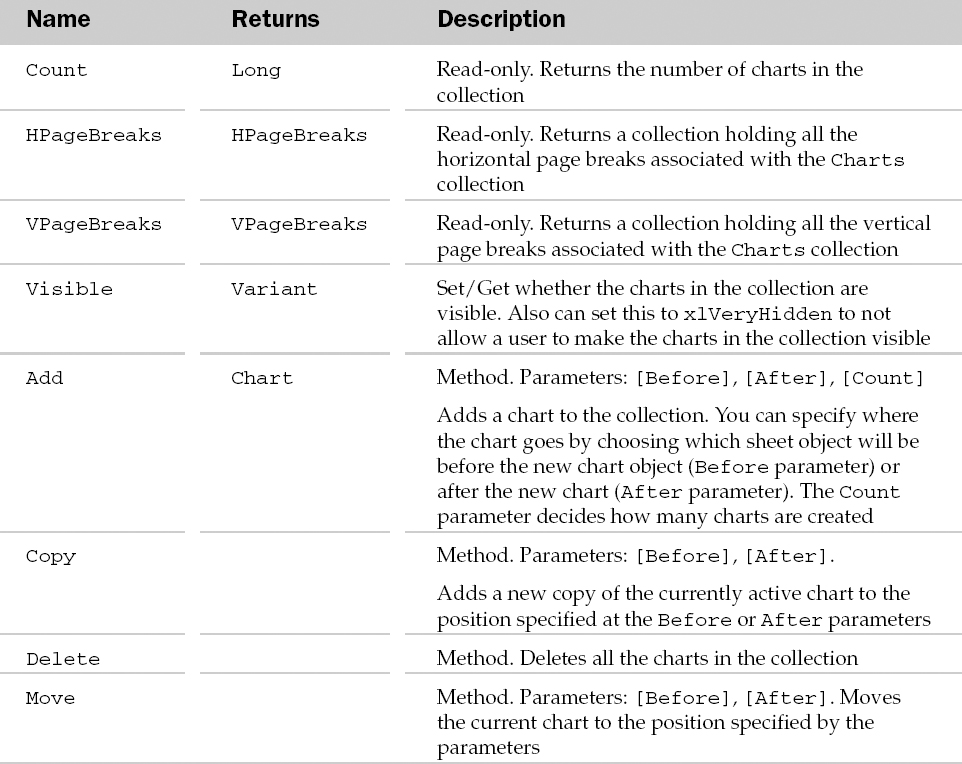
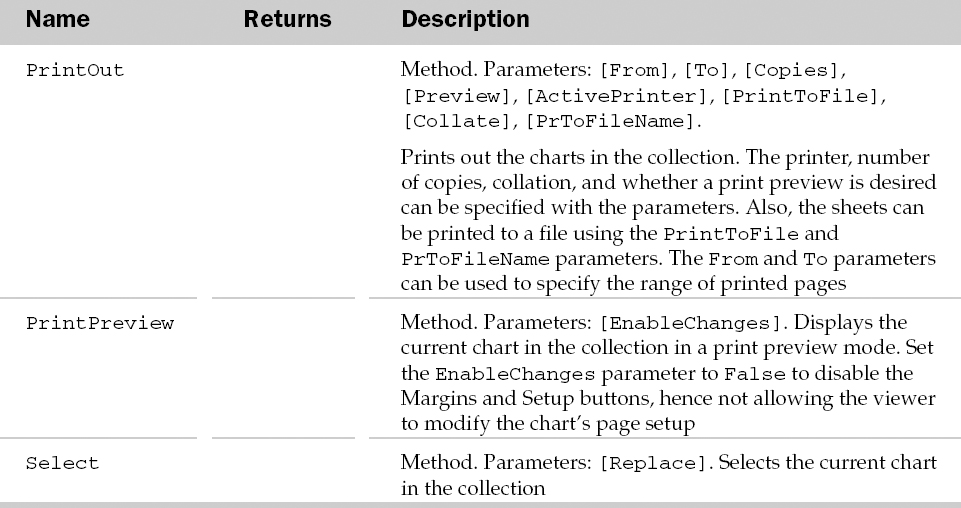
Chart Common Properties
The Application, Creator, and Parent properties are defined at the beginning of this Appendix.
Chart Properties
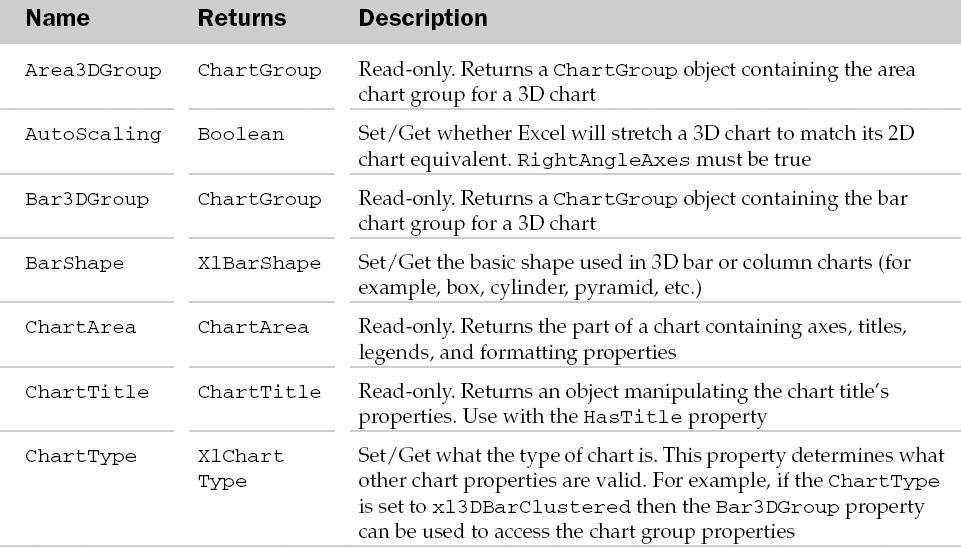
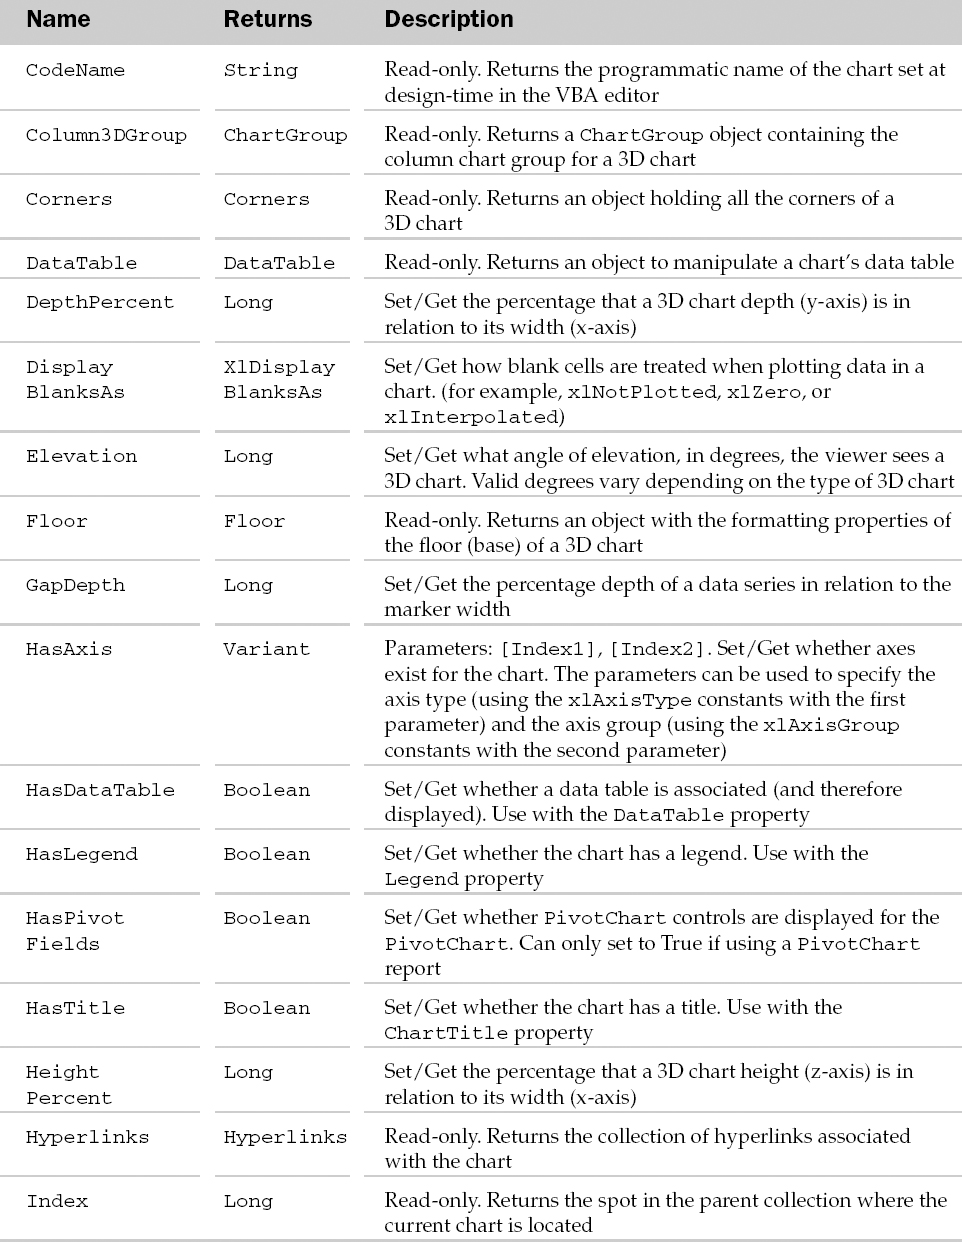
Chart Methods
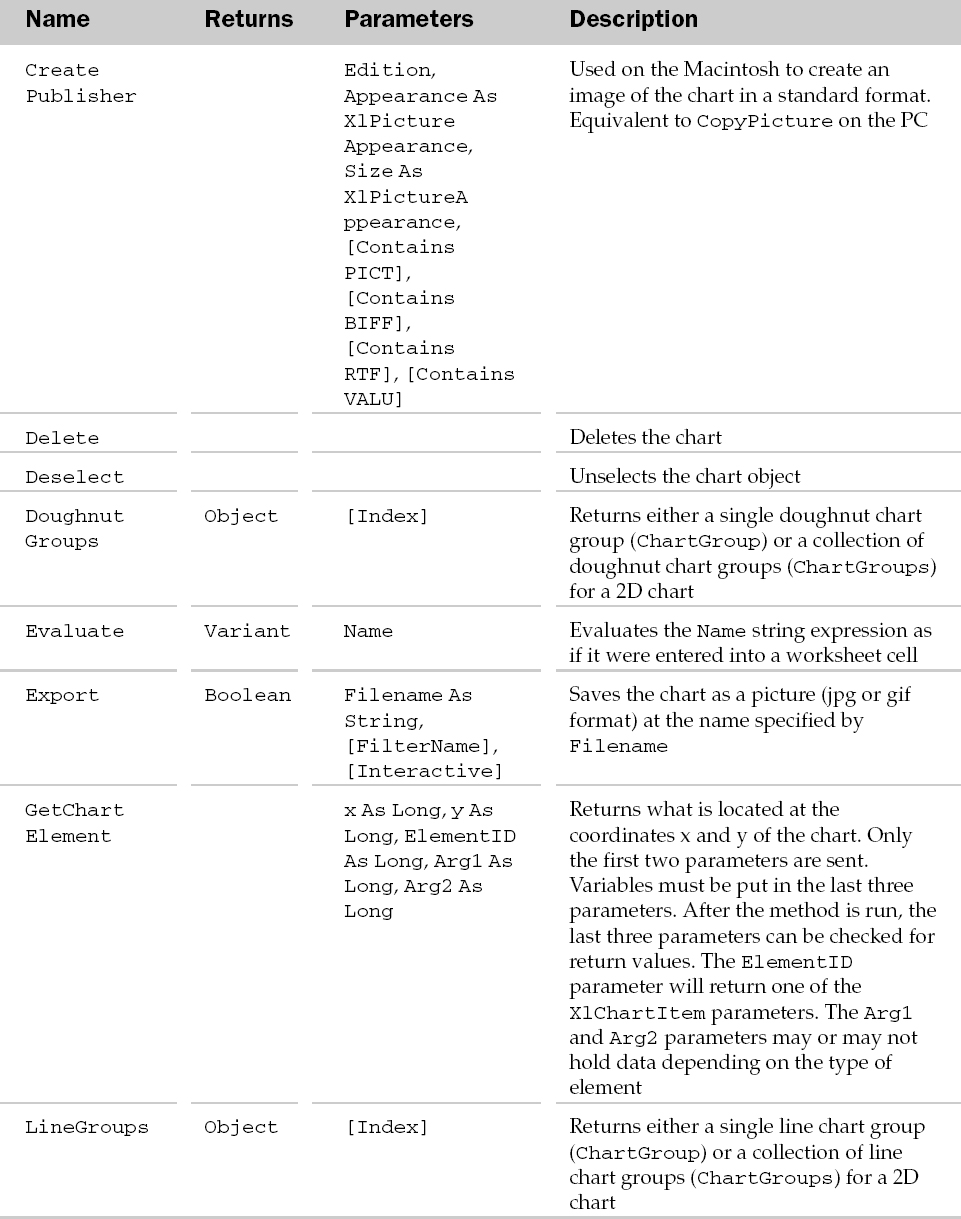
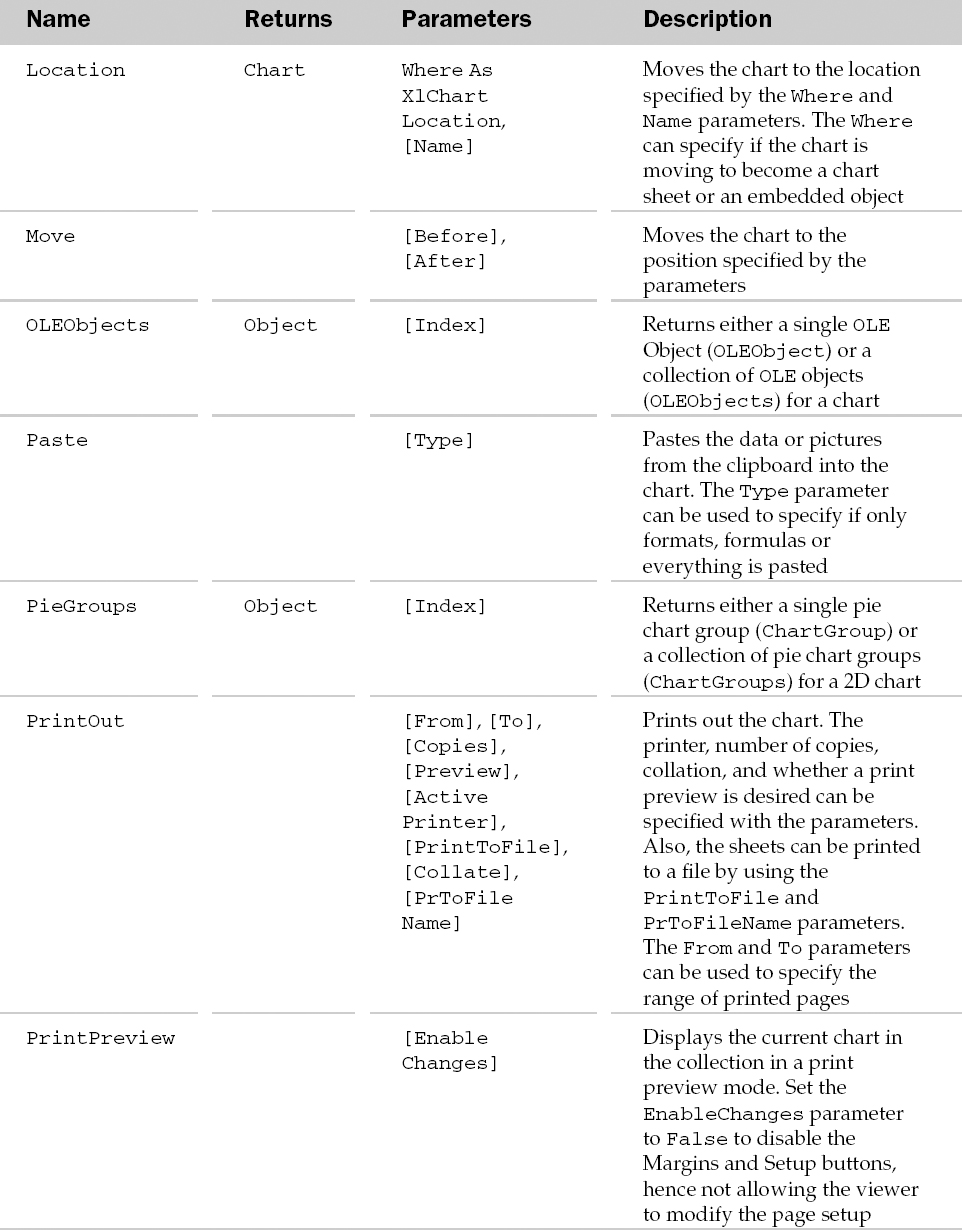
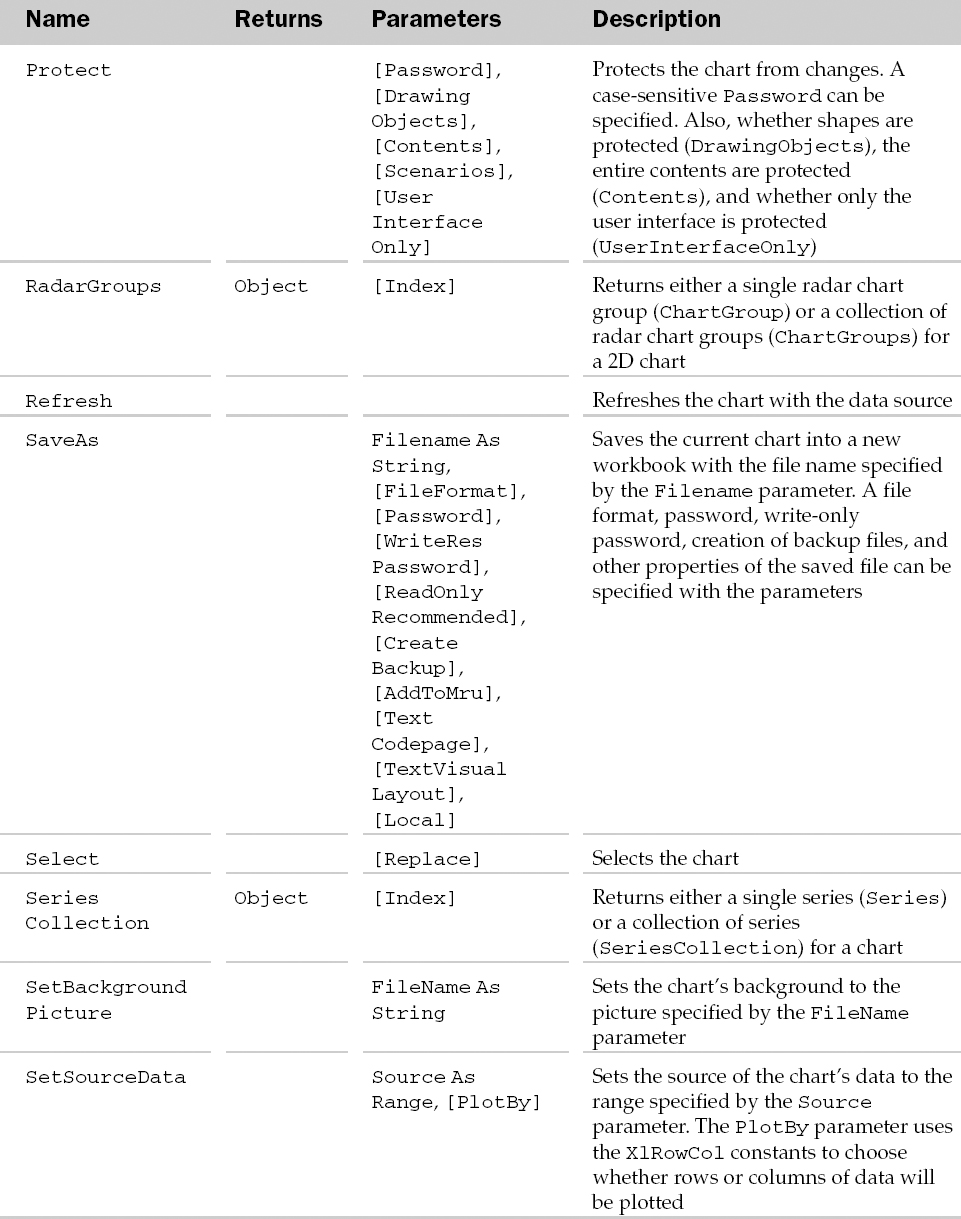
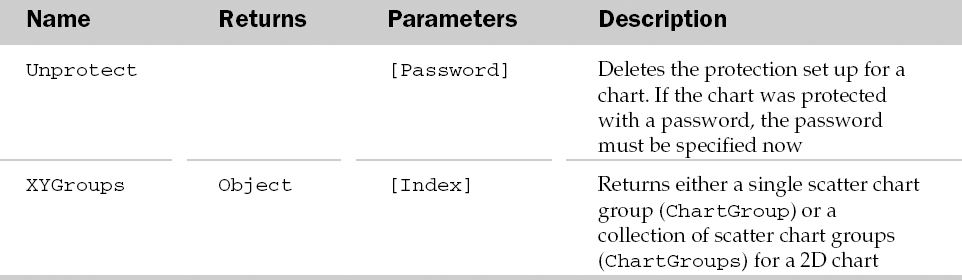
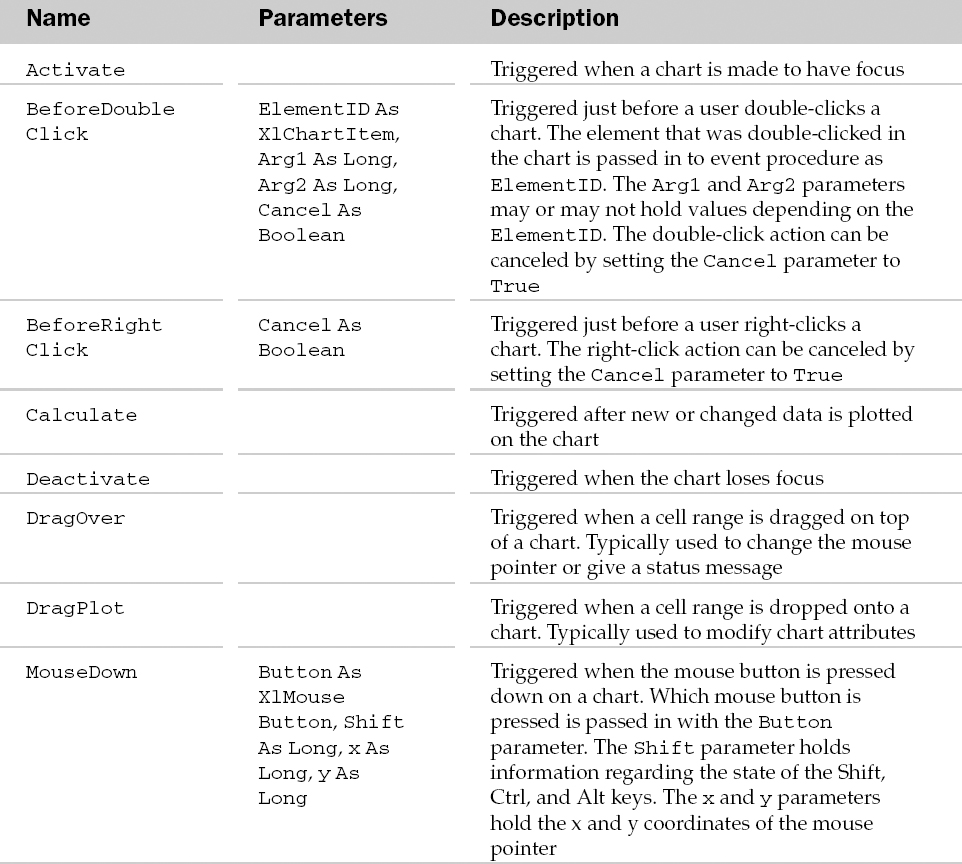
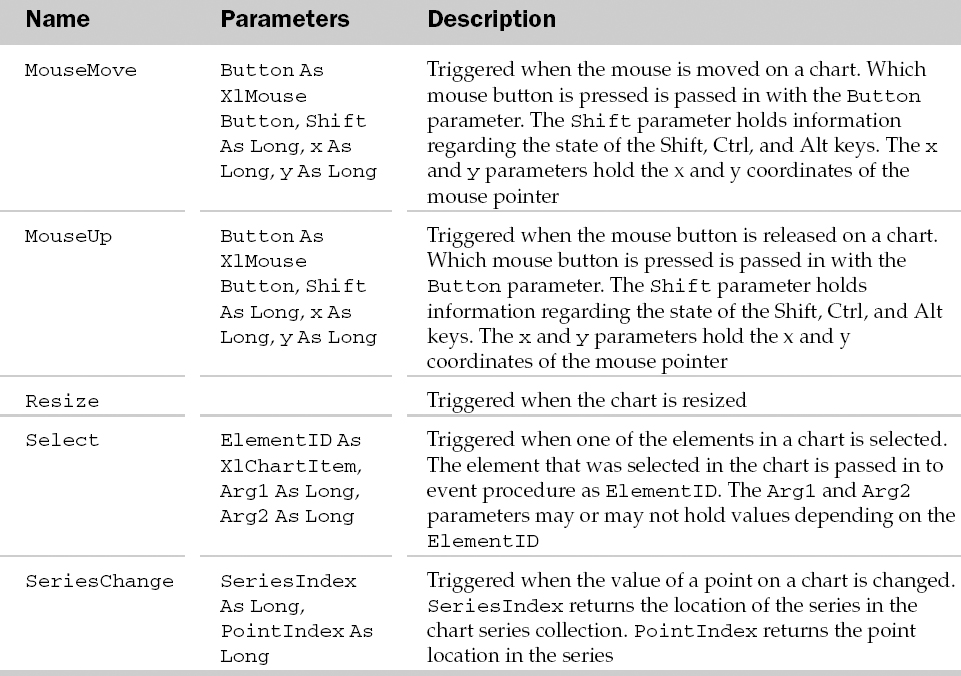
Chart Events
Example: Chart Object and the Charts Collection
This example creates a 3D chart from the table containing the active cell, formats it and saves a picture of it as a .jpg image:
Sub CreateAndExportChart()
   Dim oCht As Chart
   'Create a new (blank) chart
   Set oCht = Charts.Add
   'Format the chart
   With oCht
      .ChartType = xl3DColumnStacked
      'Set the data source and plot by columns
      .SetSourceData Source:=Selection.CurrentRegion, PlotBy:=xlColumns

      'Create a new sheet for the chart
      .Location Where:=xlLocationAsNewSheet
      'Size and shape matches the window it's in
      .SizeWithWindow = True
      'Turn of stretching of chart
      .AutoScaling = False
      'Set up a title
      .HasTitle = True
      .ChartTitle.Caption = “Main Chart”
      'No titles for the axes
      .Axes(xlCategory).HasTitle = False
      .Axes(xlSeries).HasTitle = False
      .Axes(xlValue).HasTitle = False
      'Set the 3D view of the chart
      .RightAngleAxes = False
      .Elevation = 50   'degrees
      .Perspective = 30 'degrees
      .Rotation = 20    'degrees
      .HeightPercent = 100
      'No data labels should appear
      .ApplyDataLabels Type:=xlDataLabelsShowNone
      'Save a picture of the chart as a jpg image
      .Export “c:” & .Name & “.jpg”, “jpg”, False
   End With
End Sub
ChartArea Object
The ChartArea object contains the formatting options associated with a chart area. For 2D charts ChartArea includes the axes, axes titles and chart titles. For 3D charts, ChartArea includes the chart title and its legend. The part of the chart where data is plotted (plot area) is not part of the ChartArea object. Please see the PlotArea object for formatting related to the plot area. The parent of the ChartArea is always the Chart object.
ChartArea Common Properties
The Application, Creator, and Parent properties are defined at the beginning of this Appendix.
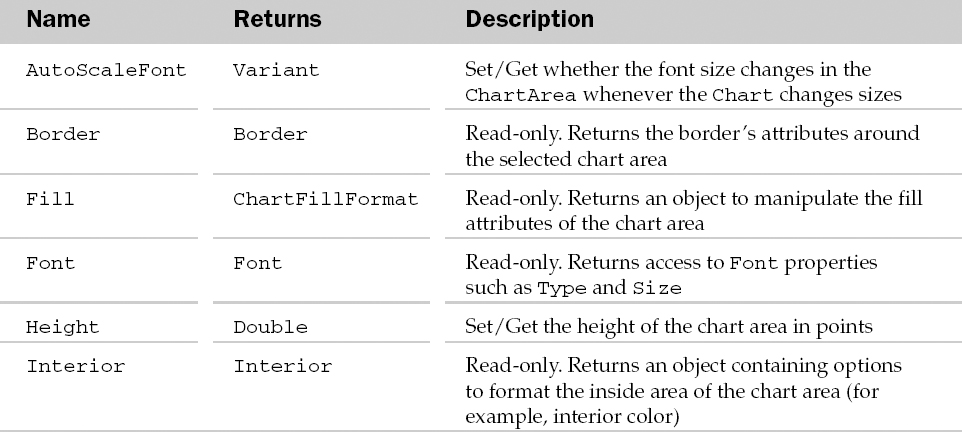
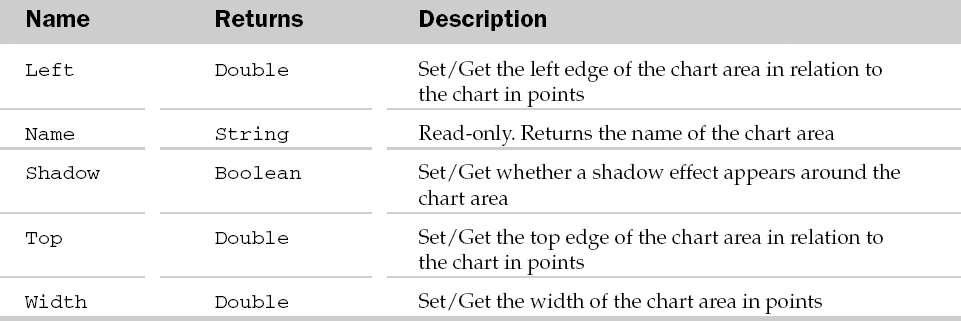
ChartArea Properties
ChartArea Methods
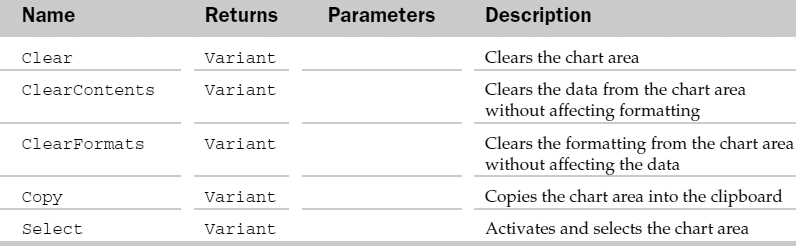
Example: ChartArea Object
Apply formatting to the chart area:
Sub FormatChartArea()
   Dim oCA As ChartArea
   Set oCA = Charts(1).ChartArea
   With oCA
      .Border.LineStyle = xlContinuous
      .Fill.PresetTextured msoTextureCanvas
      .Fill.Visible = msoTrue
   End With
End Sub
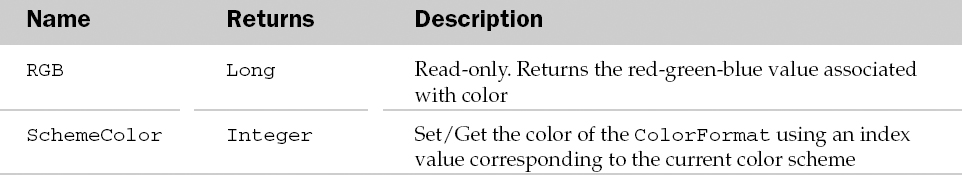
ChartColorFormat Object
The ChartColorFormat object describes a color of the parent ChartFillFormat. For example, the ChartFillFormat object contains a BackColor property that returns a ChartColorFormat object to set the color.
ChartColorFormat Common Properties
The Application, Creator, and Parent properties are defined at the beginning of this Appendix.
ChartColorFormat Properties
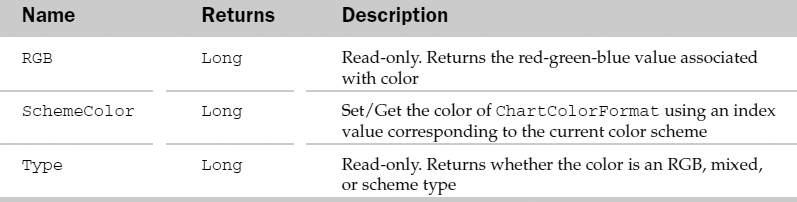
Example: ChartColorFormat Object
This example sets a chart's fill pattern to built-in colour number 6, then displays the RGB values for the color.
Sub SetChartColorFormat()
   Dim oCCF As ChartColorFormat
   With Charts(3).PlotArea.Fill
      'Make sure we're using a Fill pattern
      .Visible = True

      'Get the ChartColorFormat for the ForeColor
      Set oCCF = .ForeColor
      'Set it to built-in colour #6
      oCCF.SchemeColor = 6

      'Read off colour 6's RGB values
      MsgBox “ForeColor #6 RGB is:” & vbCrLf & _
      “Red = ” & ((oCCF.RGB And &HFF0000) / &H10000) & vbCrLf & _
      “Green = ” & ((oCCF.RGB And &HFF00) / &H100) & vbCrLf & _
      “Blue = ” & ((oCCF.RGB And &HFF))
   End With
End Sub
ChartFillFormat Object
The ChartFillFormat object represents the fill formatting associated with its parent object. This object allows manipulation of foreground colors, background colors and patterns associated with the parent object.
ChartFillFormat Common Properties
The Application, Creator, and Parent properties are defined at the beginning of this Appendix.
ChartFillFormat Properties
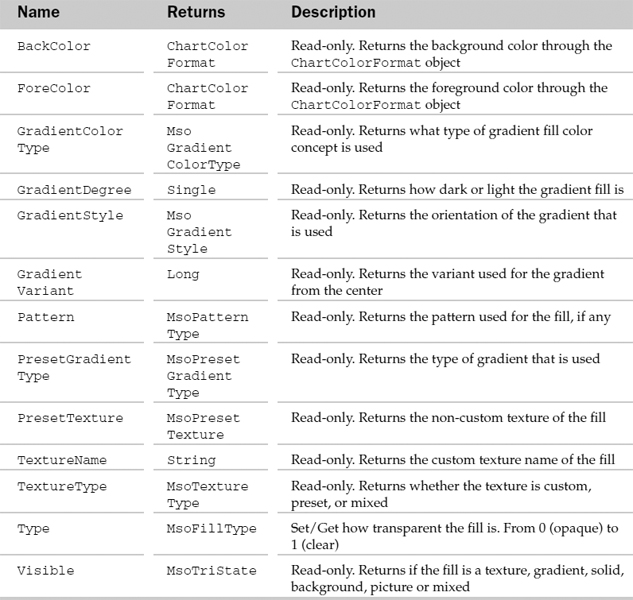
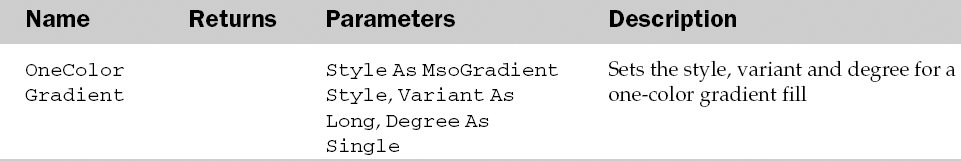
ChartFillFormat Methods
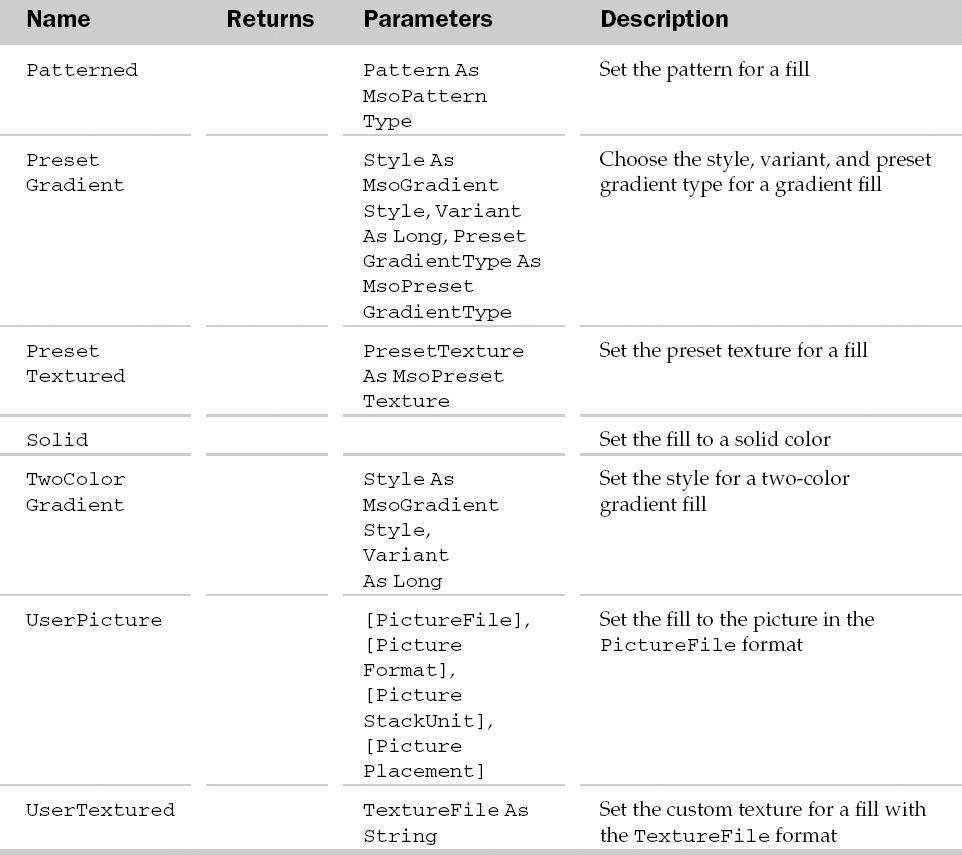
Example: ChartFillFormat Object
Sub FormatPlotArea()
   Dim oCFF As ChartFillFormat
   'Get the ChartFillFormat for the plot area
   Set oCFF = ActiveSheet.ChartObjects(1).Chart.PlotArea.Fill
   'Format the fill area
   With oCFF
       .TwoColorGradient Style:=msoGradientDiagonalUp, Variant:=1
       .Visible = True .ForeColor.SchemeColor = 6
       .BackColor.SchemeColor = 7
    End With
 End Sub
ChartGroup Object and the ChartGroups Collection
The ChartGroups collection holds all the plotting information associated with the parent chart. A chart can have more than one ChartGroup associated with it. For example, a single chart can contain both a line and a bar chart associated with it. The ChartGroups property of the Chart object can be used to access the ChartGroups collection. Also, the PieGroups and LineGroups properties of the Chart object will also return only chart groups of pie chart types and line chart types, respectively.
Besides the typical properties associated with a collection, the ChartGroups collection also has a Count property that returns the number of ChartGroup objects in the collection. The parent of the ChartGroups collection or the ChartGroup object is the Chart object.
The ChartGroup object includes all of the plotted points associated with a particular chart type. A ChartGroup can hold many series of points (each column or row of the original data). Each series can contain many points (each cell of the original data). A Chart can contain more than one ChartGroup associated with it. The Bar3DGroup, Column3DGroup, Line3DGroup, Pie3DGroup, and the SurfaceGroup properties of the Chart object can be used to access a particular chart group of the corresponding chart type. The AreaGroups, BarGroups, ColumnGroups, DoughnutGroups, LineGroups, PieGroups, RadarGroups, and XYGroups methods of the Chart object can be used to return either a ChartGroup object or a ChartGroups collection.
ChartGroup Common Properties
The Application, Creator, and Parent properties are defined at the beginning of this Appendix.
ChartGroup Properties
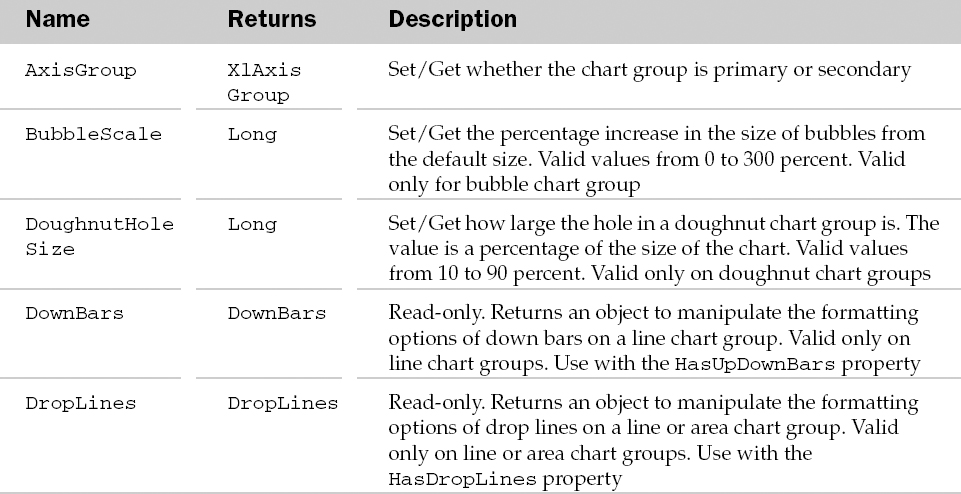
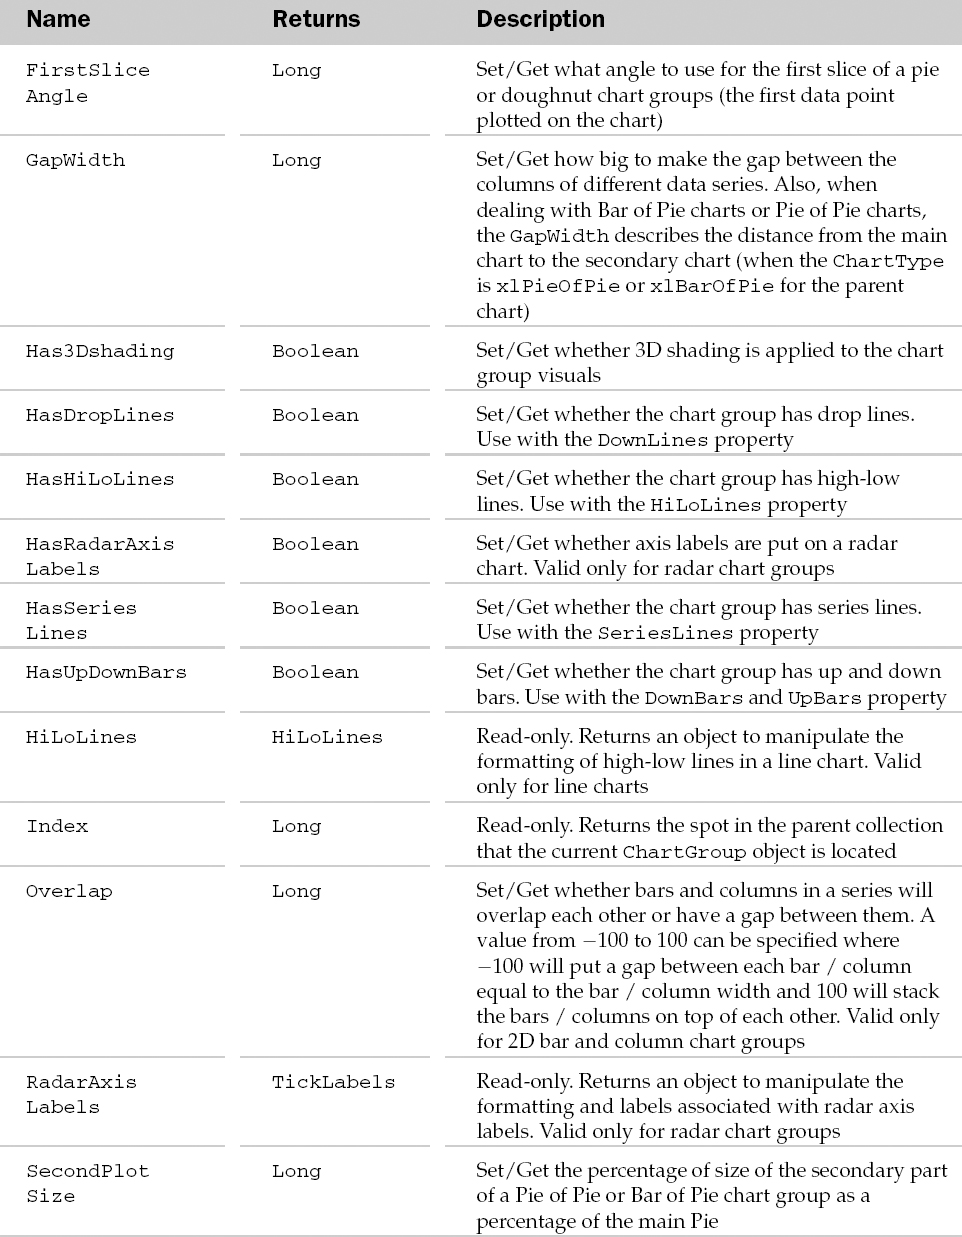
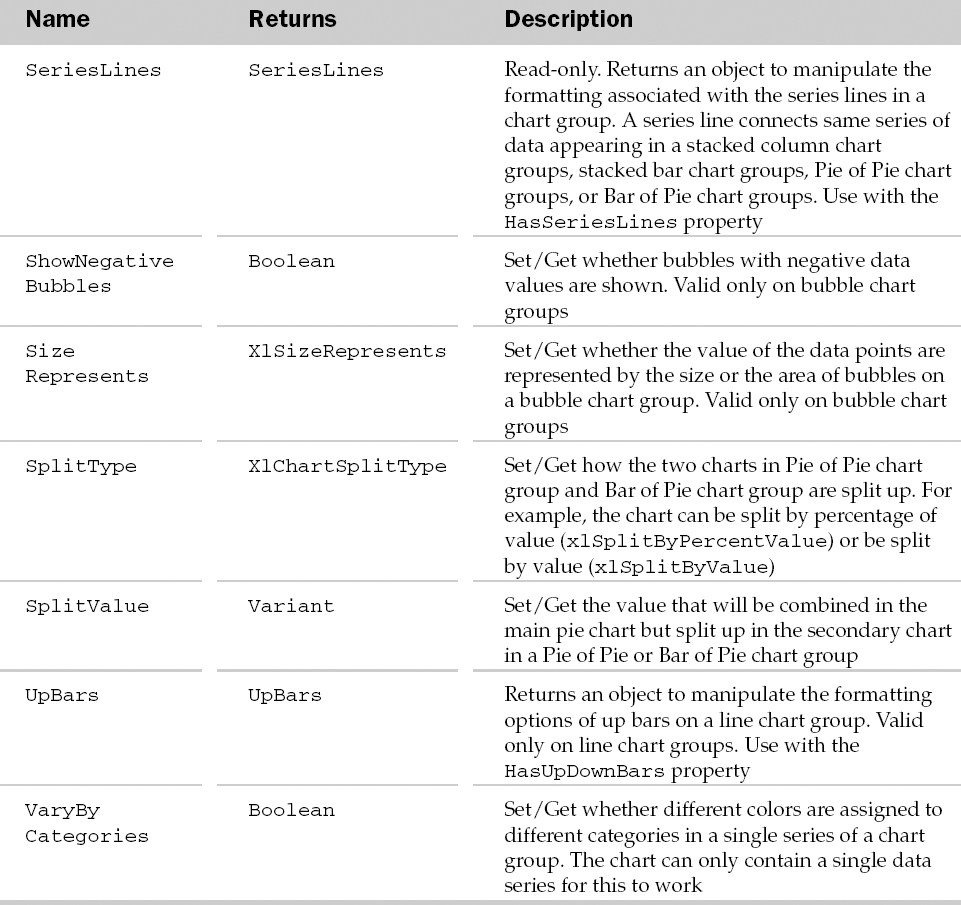
ChartGroup Methods
Example: ChartGroup Object and the ChartGroups Collection
This sets the gap width of all column groups in the chart to 10% and set each column to have a different color:
Sub FormatColumns()
  Dim oCht As Chart
  Dim oCG As ChartGroup
  For Each oCG In Charts(1) .ColumnGroups
     oCG.GapWidth =10
     oCG.VaryByCategories = True
 Next
End Sub
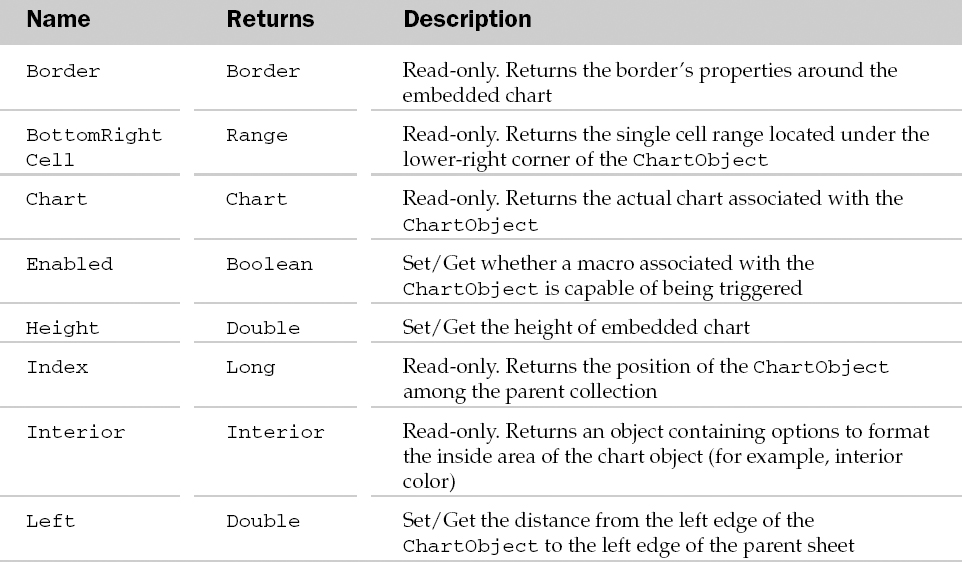
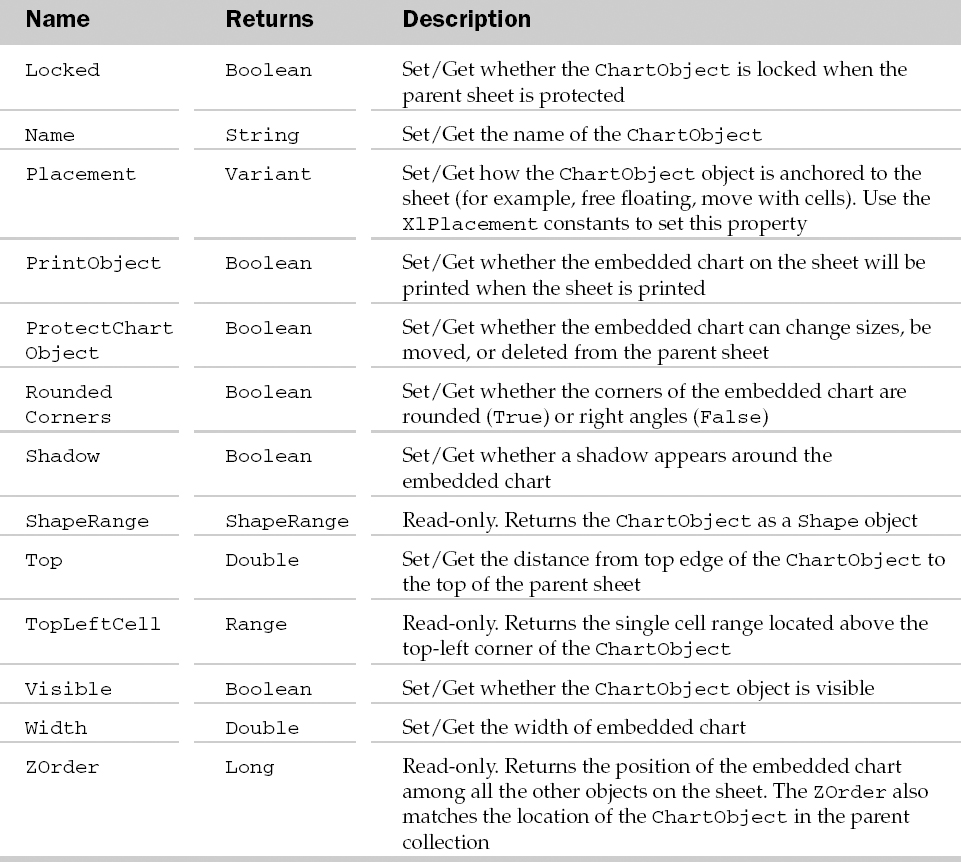
ChartObject Object and the ChartObjects Collection
The ChartObjects collection holds all of the embedded Chart objects in a worksheet, chart sheet, or dialog sheet. This collection does not include the actual chart sheets themselves. Chart sheets can be accessed through the Charts collection. Each Chart in the ChartObjects collection is accessed through the ChartObject object. The ChartObject acts as a wrapper for the embedded chart itself. The Chart property of the ChartObject is used to access the actual chart. The ChartObject object also contains properties to modify the formatting of the embedded chart (for example, Height, Width).
The ChartObjects collection contains many properties besides the typical collection attributes. These properties are listed next.
ChartObjects Collection Properties and Methods
ChartObject Common Properties
The Application, Creator, and Parent properties are defined at the beginning of this Appendix.
ChartObject Properties
ChartObject Methods
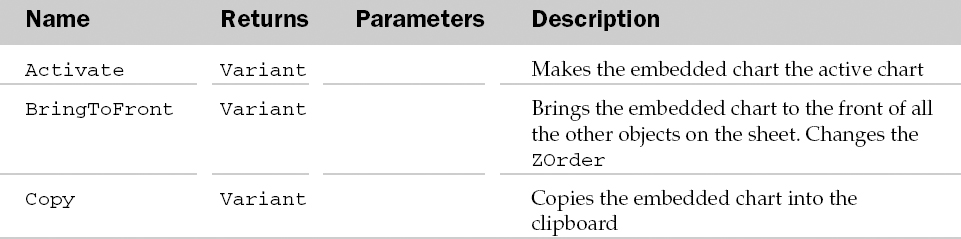
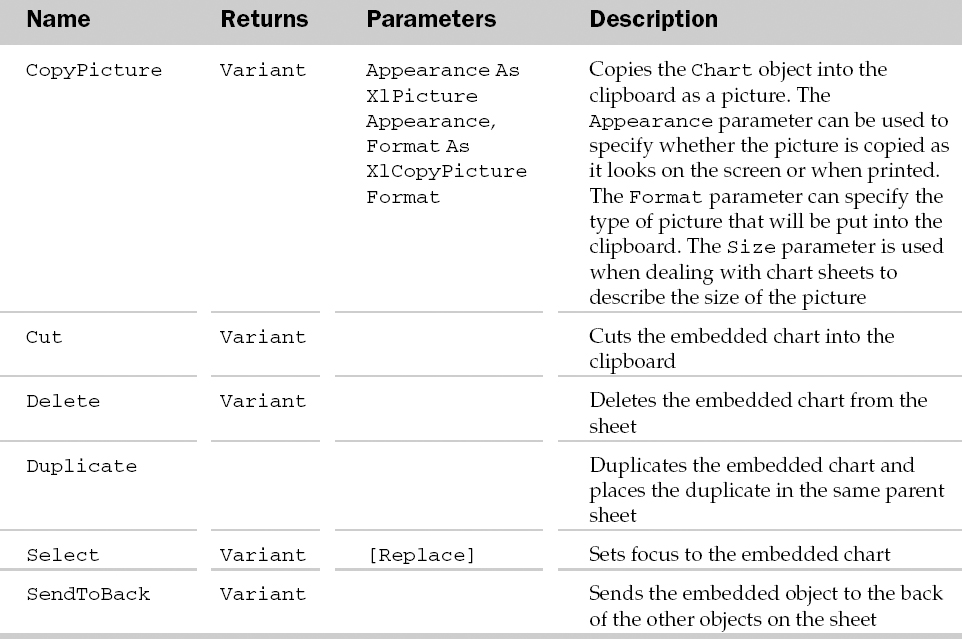
Example: ChartObject Object and the ChartObjects Collection
This example creates .jpg images from all the embedded charts in the active worksheet:
Sub ExportChartObjects()
   Dim oCO As ChartObject
   For Each oCO In ActiveSheet.ChartObjects
     'Export the chart as a jpg image, giving it    the
     'name of the embedded object
     oCO.Chart.Export “c:” & oCO.Name & “.jpg”, “jpg”
  Next
End Sub
ChartTitle Object
The ChartTitle object contains all of the text and formatting associated with a chart's title. The parent of the ChartTitle object is the Chart object. This object is usually used along with the HasTitle property of the parent Chart object.
ChartTitle Common Properties
The Application, Creator, and Parent properties are defined at the beginning of this Appendix.
ChartTitle Properties
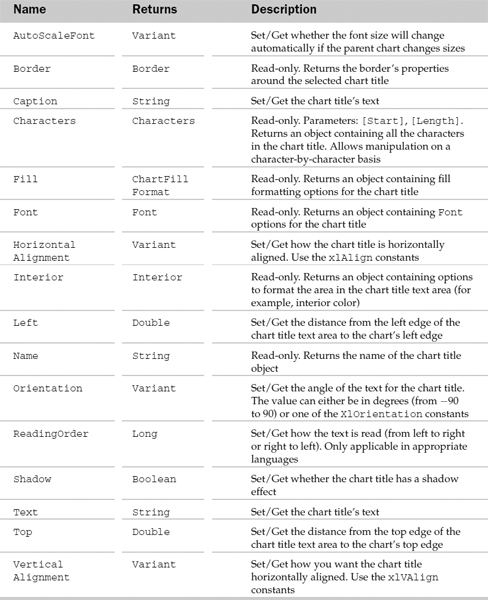
ChartTitle Methods
Example: ChartTitle Object
This example adds a chart title to a chart and formats it:
Sub AddAndFormatChartTitle()
   Dim oCT As ChartTitle
   'Make sure the chart has a title
   Charts(1).HasTitle = True
   'Get the ChartTitle object
   Set oCT = Charts(1).ChartTitle
   'Format the chart title
   With oCT
      .Caption = “Hello World”
      .Font.Name = “Times New Roman”
      .Font.Size = 16
      .Characters(1, 1).Font.Color = RGB(255,    0, 0)
      .Characters(7, 1).Font.Color = RGB(255,    0, 0)
      .Border.LineStyle = xlContinuous
      .Border.Weight = xlThin
      .Shadow = True
   End With
End Sub
ColorFormat Object
The ColorFormat object describes a single color used by the parent object. Possible parents of the ColorFormat object are the FillFormat, LineFormat, ShadowFormat, and ThreeDFormat objects.
ColorFormat Common Properties
The Application, Creator, and Parent properties are defined at the beginning of this Appendix.
ColorFormat Properties
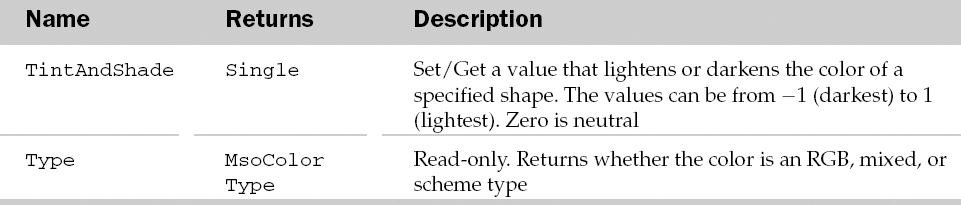
Example: ColorFormat Object
Set the ForeColor of a shape's fill effect:
Sub FormatShapeColour()
  Dim oShp As Shape
  Dim oCF As ColorFormat
  Set oShp = ActiveSheet.Shapes(1)
  Set oCF = oShp.Fill.ForeColor
  oCF.SchemeColor = 53
End Sub
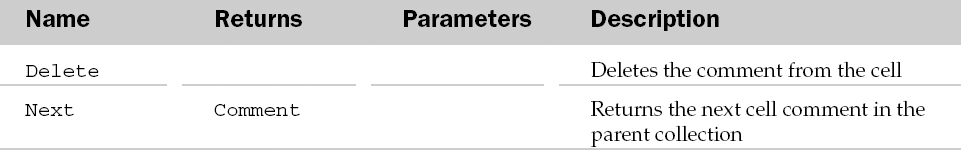
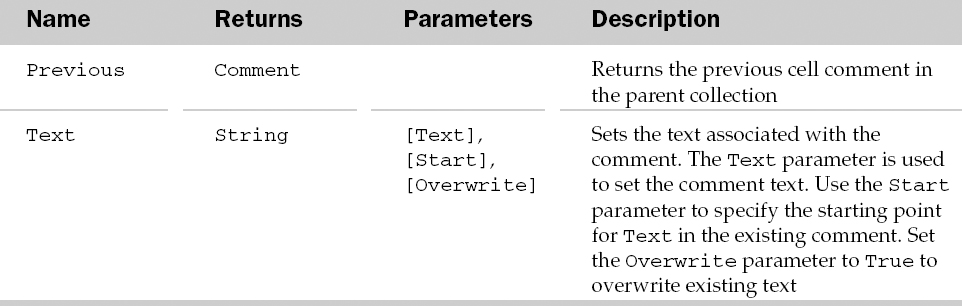
Comment Object and the Comments Collection
The Comments collection holds all of the cell comments in the parent Range object. Each Comment object represents a single cell comment.
Comment Common Properties
The Application, Creator, and Parent properties are defined at the beginning of this Appendix.
Comment Properties
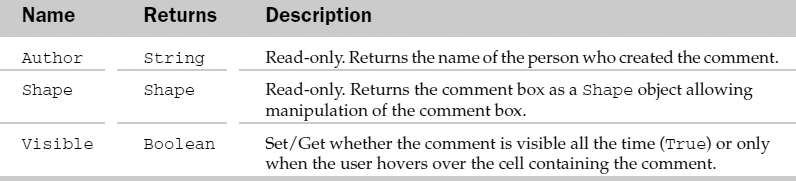
Comment Methods
Example: Comment Object and the Comments Collection
This example removes the user name added by Excel at the start of the comment and formats the comment to make it more readable:
Sub FormatComments()
  Dim oComment As Comment, i As Integer
  'Loop through all the comments in the sheet
  For Each oComment In ActiveSheet.Comments
     'Using the text of the comment…
     With oComment.Shape.TextFrame.Characters

         'Find and remove the user name inserted by Excel
     i = InStr(1, .Text, “:”& vbLf)
     If i > 0 Then
            .Text = Mid(.Text, i + 2)

     'Increase the font size
     With .Font
            .Name = “Arial”
        .Size = 10
        .Bold = False
       End With
     End With

      'Make the text frame auto-fit
     oComment.Shape.TextFrame.AutoSize = True
   Next
 End Sub
ConnectorFormat Object
The ConnectorFormat object represents the connector line used between shapes. This connector line connects two shapes together. If either of the shapes are moved, the connector automatically readjusts so the shapes still look visually connected. The parent of a ConnectorFormat object is the Shape object.
ConnectorFormat Common Properties
The Application, Creator, and Parent properties are defined at the beginning of this Appendix.
ConnectorFormat Properties
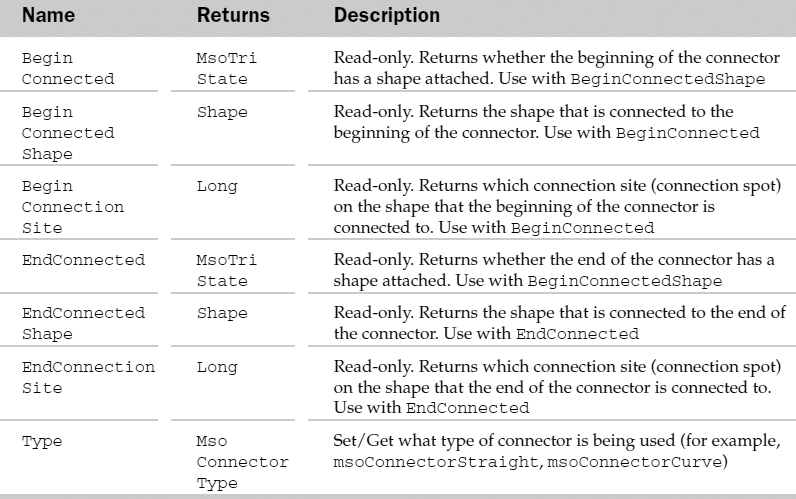
ConnectorFormat Methods
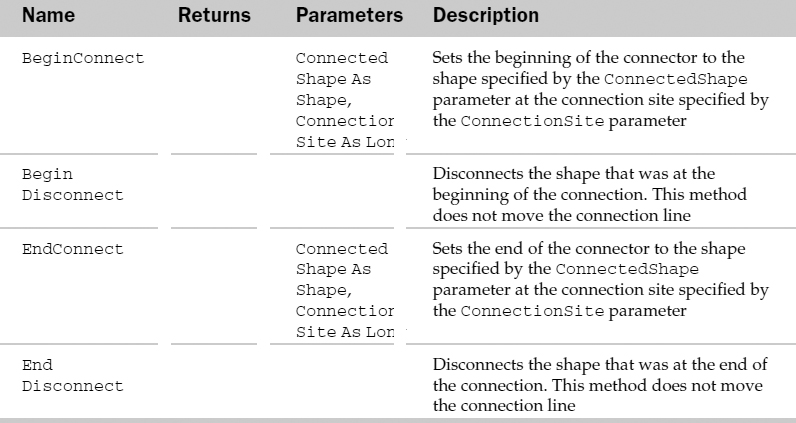
Example: ConnectorFormat Object
This example formats all fully-connected connectors as curved lines:
Sub FormatConnectors()
  Dim oShp As Shape
  Dim oCF As ConnectorFormat
  'Loop through all the Shapes in the sheet
  For Each oShp In ActiveSheet.Shapes
     'Is it a Connector?
     If oShp.Connector Then

     'Yes, so get the ConnectorFormat object
     Set oCF = oShp.ConnectorFormat

     'If the connector is connected at both ends,
     'make it a curved line.
     With oCF
         If .BeginConnected And .EndConnected Then
           .Type = msoConnectorCurve
     End If
      End With
   End If
  Next
End Sub
ControlFormat Object
The ControlFormat object contains properties and methods used to manipulate Excel controls such as textboxes and listboxes. This object's parent is always the Shape object.
ControlFormat Common Properties
The Application, Creator, and Parent properties are defined at the beginning of this Appendix.
ControlFormat Properties
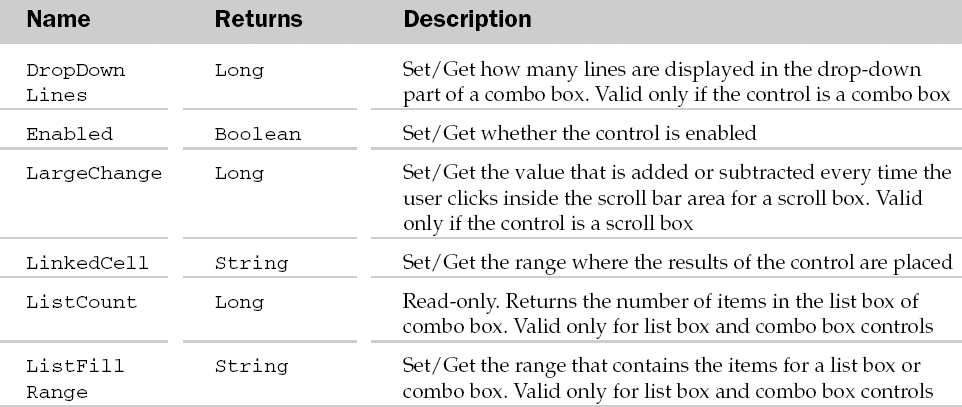
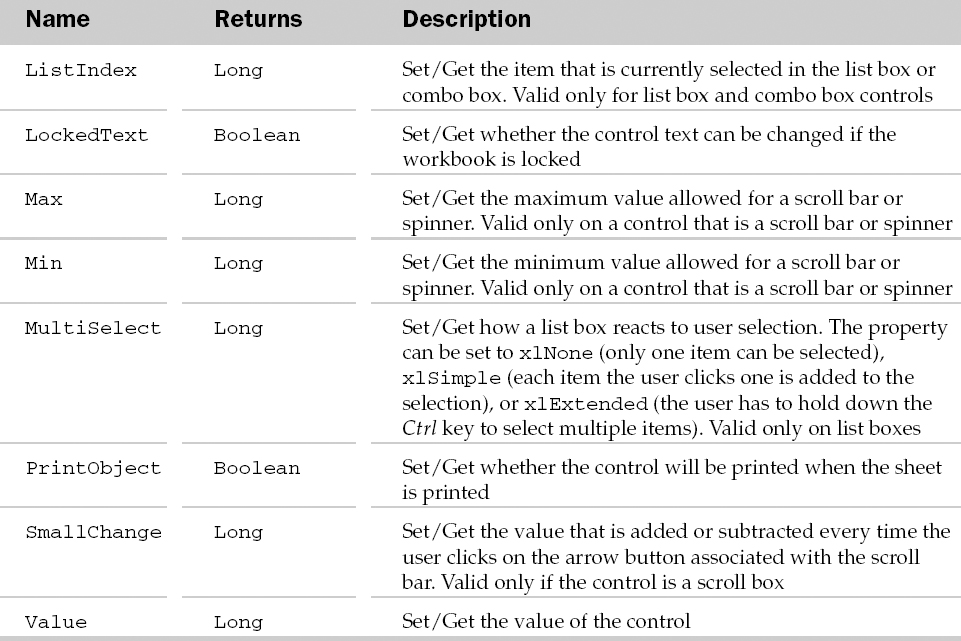
ControlFormat Methods
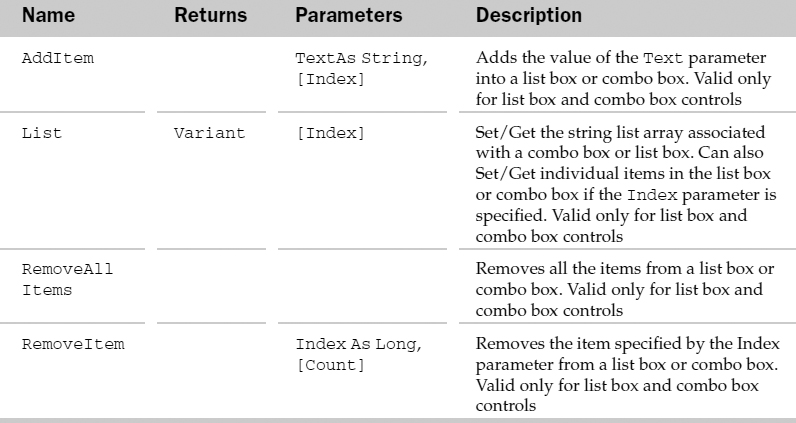
Example: ControlFormat Object
This example resets all the list boxes, drop-downs, scrollbars, spinners, and check boxes on the sheet:
Sub ResetFormControls()
  Dim oShp As Shape
  Dim oCF As ControlFormat
  'Loop through all the shapes in the sheet
  For Each oShp In ActiveSheet.Shapes
     'Is this a Forms control?
     If oShp.Type = msoFormControl Then

   'Yes, so get the ControlFormat object
   Set oCF = oShp.ControlFormat
   'Reset the control as appropriate
   Select Case oShp.FormControlType
     Case xlListBox, xlDropDown
       oCF.RemoveAllItems

     Case xlSpinner, xlScrollBar
       oCF.Value = oCF.Min

     Case xlCheckBox
      oCF.Value = xlOff

     End Select
   End If
  Next
End Sub
Corners Object
The Corners object represents the corners of a 3D chart. The parent of the Corners object is the Chart object. The parent chart must be a 3D chart. Individual corners cannot be accessed.
Corners Common Properties
The Application, Creator, and Parent properties are defined at the beginning of this Appendix.
Corners Properties
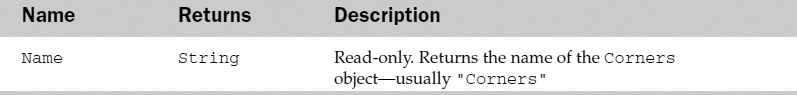
Corners Methods

Example: Corners Object
No example—its only method is to select it, which is not particularly useful.
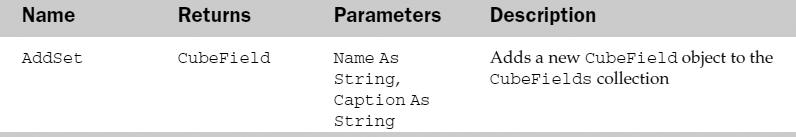
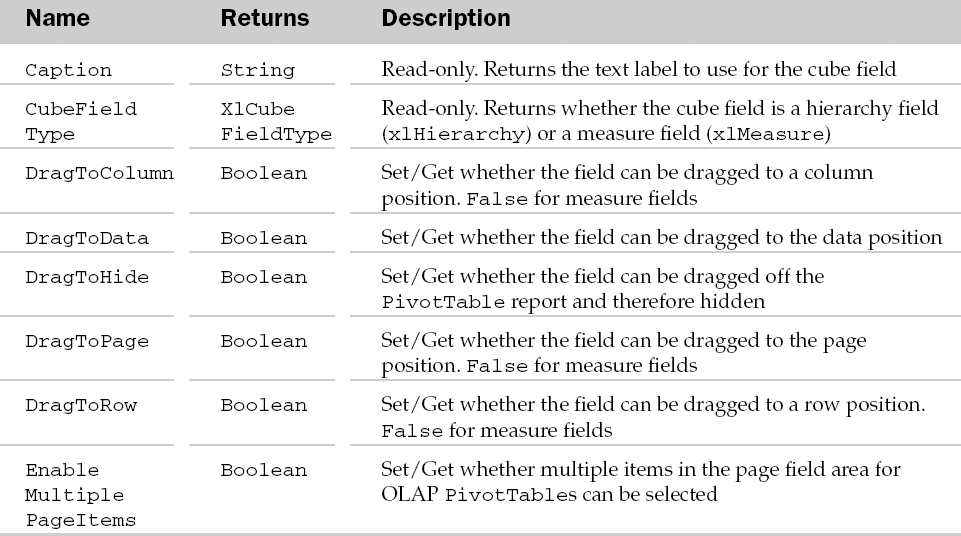
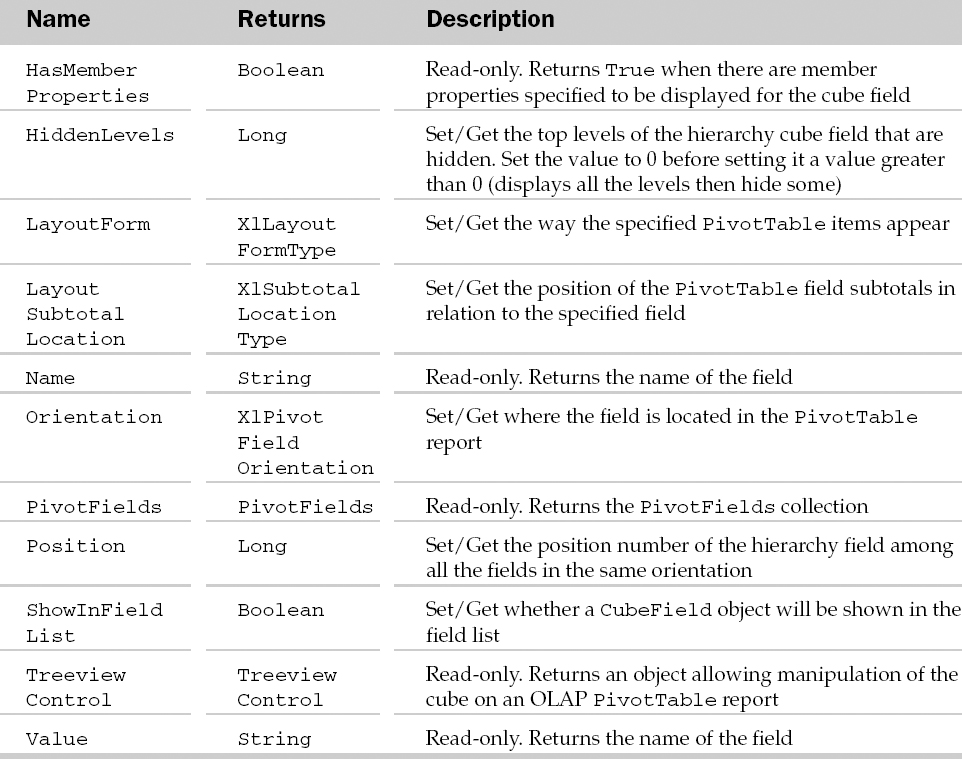
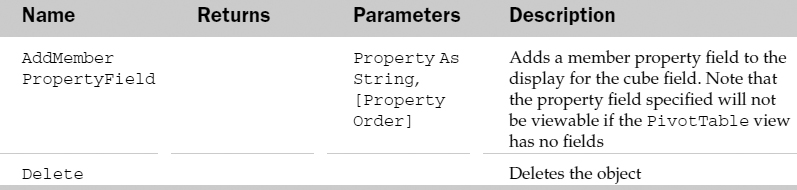
CubeField Object and the CubeFields Collection
The CubeFields collection holds all of the PivotTable report fields based on an OLAP cube. Each CubeField object represents a measure or hierarchy field from the OLAP cube. The parent of the CubeFields collection is the PivotTable object.
The CubeFields collection contains a Count property besides the typical collection attributes. The Count property returns the number of objects in the collection.
CubeFields Collection Methods
CubeField Common Properties
The Application, Creator, and Parent properties are defined at the beginning of this Appendix.
CubeField Properties
CubeField Methods
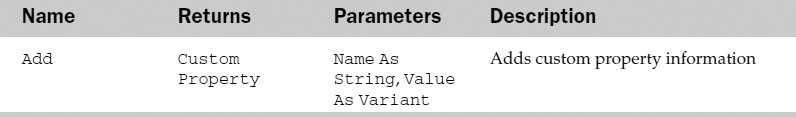
CustomProperty Object and the CustomProperties Collection
This object allows you to store information within a worksheet or SmartTag. This information can then be used as metadata for XML, or can be accessed by any routine that needs information specific to the worksheet or SmartTag.
More important to a developer is the ability of this new object to store specifics regarding a worksheet or group of worksheets so that any routine can call up the CustomProperty, analyze the information contained within, then make decisions on how to handle that worksheet. In the past, many developers used worksheet level range names to store information about a worksheet. Worksheet level range names only reside in that worksheet, enabling each worksheet to have the same range name, but store different values.
For example, each worksheet in a workbook containing a dozen budget worksheets and three report worksheets could contain the same range name called IsBudget. All of the budget sheets would store the value of True in the range name while the report sheets would store False. Routines that need to loop through the worksheets applying different formats or calculations to budget sheets can call on the value of the range name to determine if it's a budget sheet before running code on it.
This new CustomProperty object makes storing such information (or any information for that matter) simpler than creating worksheet level range names, or storing such information in a hidden worksheet or in the Registry.
The CustomProperties collection represents CustomProperty objects for either worksheets or SmartTags. CustomProperties can store information within either a worksheet or SmartTag. They are similar to the DocumentProperties object in the Office XP model, except they are stored with a worksheet or SmartTag instead of the whole document.
CustomProperties Common Properties
The Application, Creator, and Parent properties are defined at the beginning of this Appendix.
CustomProperties Collection Properties
CustomProperties Collection Methods
CustomProperty Common Properties
The Application, Creator, and Parent properties are defined at the beginning of this Appendix.
CustomProperty Properties
CustomProperty Methods

Example: CustomProperty Object
This routine loops through the worksheets in a workbook and creates a CustomProperty called IsBudget. The value of IsBudget depends on whether or not the worksheet contains the phrase “Budget Analysis”. It then lists the results:
Sub CreateCustomProperties()
  Dim bBudget As Boolean
  Dim lRow As Long
  Dim oCustomProp As CustomProperty
  Dim rng As Range, wks As Worksheet

   'Turn off the screen and clear the search formats
   With Application
       .FindFormat.Clear
       .ScreenUpdating = False
   End With

   'Clear the worksheet that will contain the
   ' Custom Property list
   wksCustomProperties.UsedRange.Offset(1, 0).ClearContents

   'Initialize the row counter
   lRow = 2 'Row 1 contains the Column Headings

   'Loop through the worksheet in this workbook
   For Each wks In ThisWorkbook.Worksheets

       'Supress errors resulting in no cells found and
       ' no Custom Property
       On Error Resume Next
          bBudget = False
          bBudget = _
                    (Len(wks.UsedRange.Find(What:=“Budget
   Analysis”).Address) > 0)
          'Unfortunately, we cannot refer to a Custom Property by
      ' its name, only its numeric index
      Set oCustomProp = wks.CustomProperties(1)
      On Error GoTo 0

      'If the Custom Property exists, delete it and
      ' add it again
      If Not oCustomProp Is Nothing Then oCustomProp.Delete

      'Note the value of bBudget is encased in double quotes.
      'If we don't, True will be stored as -1 and False 0 (their
      'numeric values).
      Set oCustomProp = wks.CustomProperties.Add(Name:=
 “IsBudget”, Value:=“” _

                                                                & bBudget & “”)

    'List the Custom Property settings on the worksheet
    With wksCustomProperties
           'Parent.Name returns the name of the object
           ' holding the Custom Property - the worksheet name in this case
       .Cells(lRow, 1).Value = oCustomProp.Parent.Name
       .Cells(lRow, 2).Value = oCustomProp.Name
       .Cells(lRow, 3).Value = oCustomProp.Value
       End With

       'Move down one row
       lRow = lRow + 1

     Next wks

End Sub
CustomView Object and the CustomViews Collection
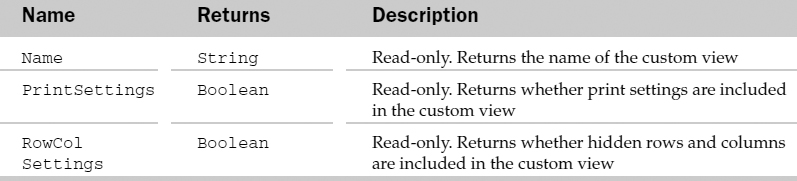
The CustomViews collection holds the list of custom views associated with a workbook. Each CustomView object holds the attributes associated with a workbook custom view. A custom view holds settings such as window size, window position, column widths, hidden columns, and print settings of a workbook. The parent object of the CustomViews collection is the Workbook object.
The CustomViews collection has two other properties besides the typical collection attributes. The Count property returns the number of CustomView objects in the collection. The Add method adds a custom view to the CustomViews collection. The Add method accepts a name for the view with the ViewName parameter. Optionally, the Add method accepts whether print settings are included (PrintSettings) and whether hidden rows and columns are included (RowColSettings).
CustomView Common Properties
The Application, Creator, and Parent properties are defined at the beginning of this Appendix.
CustomView Properties
CustomView Methods

Example: CustomView Object and the CustomViews Collection
Display all the custom views in the workbook as a screen-show, pausing for two seconds between each one:
Sub ShowCustomView()
    Dim oCV As CustomView
    'Cycle through all the custom views in the    sheet
    'that contain row/column information
    For Each oCV In ActiveWorkbook.CustomViews
      If oCV.RowColSettings Then
         oCV.Show
      End If

    'Pause for 2 seconds between each view
    Application.Wait Now + TimeValue(“00:00:: 02”)
  Next
End Sub
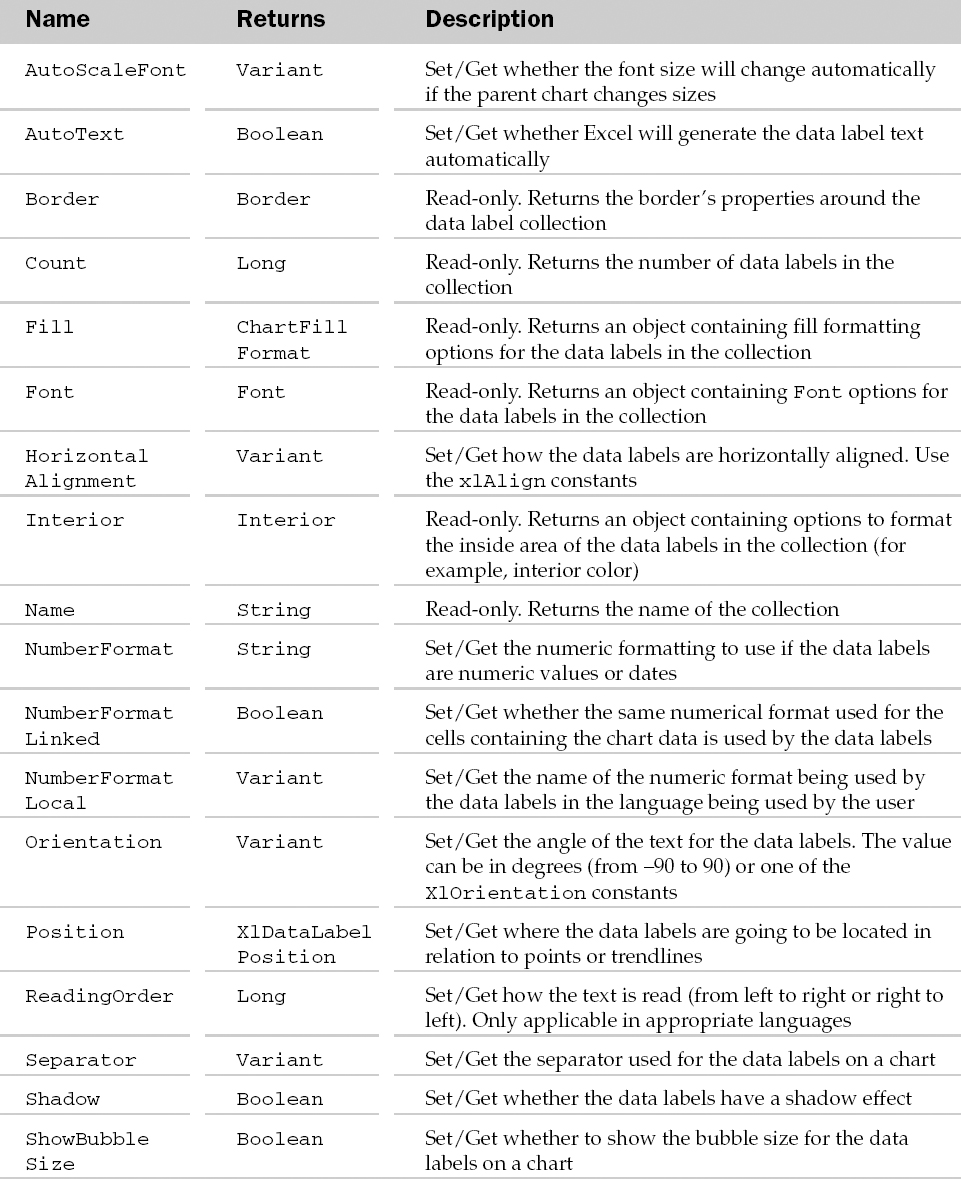
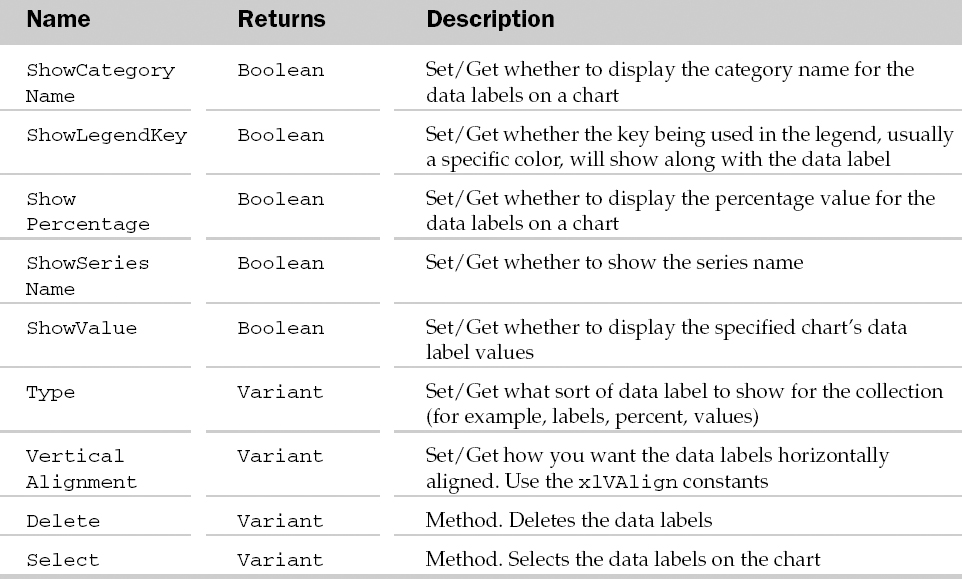
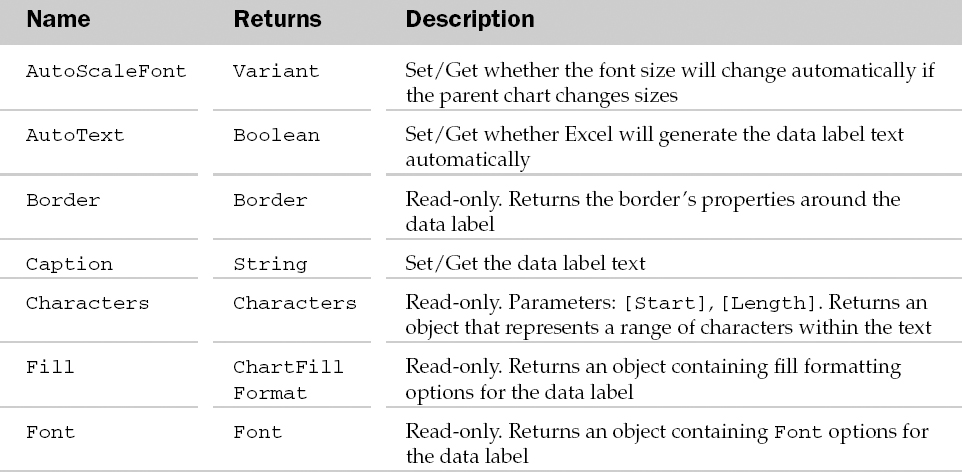
DataLabel Object and the DataLabels Collection
The DataLabels collection holds all the labels for individual points or trendlines in a data series. Each series has only one DataLabels collection. The parent of the DataLabels collection is the Series object. Each DataLabel object represents a single data label for a trendline or a point. The DataLabels collection is used with the HasDataLabels property of the parent Series object.
The DataLabels collection has a few properties and methods besides the typical collection attributes. They are listed in the following table.
DataLabels Collection Properties and Methods
DataLabel Common Properties
The Application, Creator, and Parent properties are defined at the beginning of this Appendix.
DataLabel Properties
DataLabel Methods

Example: DataLabel Object and the DataLabels Collection
This example adds data labels to all the points on the chart, using the column to the left of the X values range:
Sub AddDataLabels()
    Dim oSer As Series
    Dim vaSplits As Variant
    Dim oXRng As Range
    Dim oLblRng As Range
    Dim oLbl As DataLabel
    'Loop through all the series in the chart
    For Each oSer In Charts(1).SeriesCollection
    'Get the series formula and split it into its
    'constituent parts (Name, X range, Y range, order)
    vaSplits = Split(oSer.Formula, “,”)

    'Get the X range
    Set oXRng = Range(vaSplits(LBound(vaSplits) + 1))

    'Get the column to the left of the X range
    Set oLblRng = oXRng.Offset(0, -1)

    'Show data labels for the series
    oSer.ApplyDataLabels

    'Loop through the points
    For i = 1 To oSer.Points.Count

    'Get the DataLabel object
    Set oLbl = oSer.Points(i).DataLabel
    'Set its text    and alignment
    With oLbl
       .Caption = oLblRng.Cells(i)
       .Position= xlLabelPositionAbove
   End With
  Next
  Next
End Sub
DataTable Object
A DataTable object contains the formatting options associated with a chart's data table. The parent of the DataTable object is the Chart object.
DataTable Common Properties
The Application, Creator, and Parent properties are defined at the beginning of this Appendix.
DataTable Properties
DataTable Methods
Example: DataTable Object
Adds a data table to a chart and formats it to only have vertical lines between the values:
Sub FormatDataTable()
   Dim oDT As DataTable
   'Display the data table
   Charts(1).HasDataTable = True
   'Get the DataTable object
   Set oDT = Charts(1).DataTable
   'Format the data table to only have vertical lines
   With oDT
       .HasBorderOutline = False
       .HasBorderHorizontal = False
       .HasBorderVertical = True
   End With
End Sub
DefaultWebOptions Object
Allows programmatic changes to items associated with the default settings of the Web Options dialog box. These options include what Excel does when opening an HTML page and when saving a sheet as an HTML page.
DefaultWebOptions Common Properties
The Application, Creator, and Parent properties are defined at the beginning of this Appendix.
DefaultWebOptions Properties
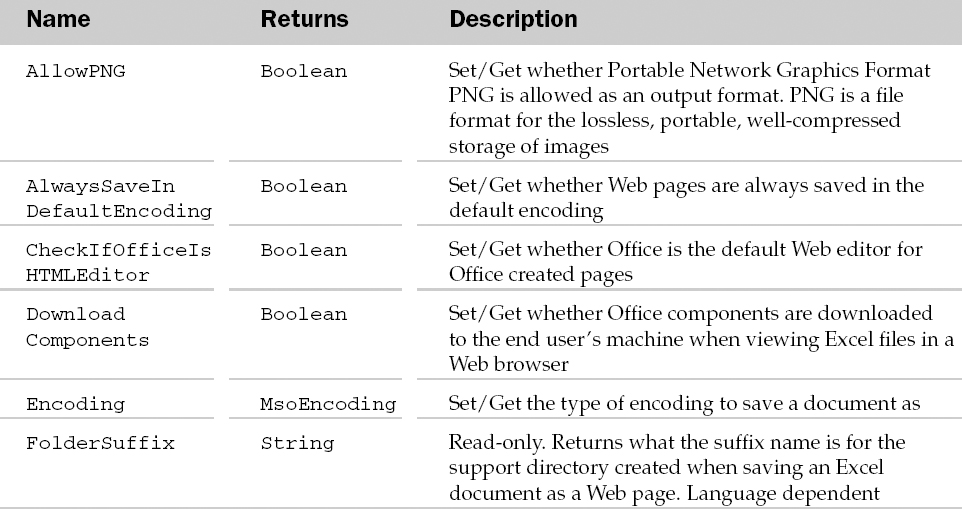
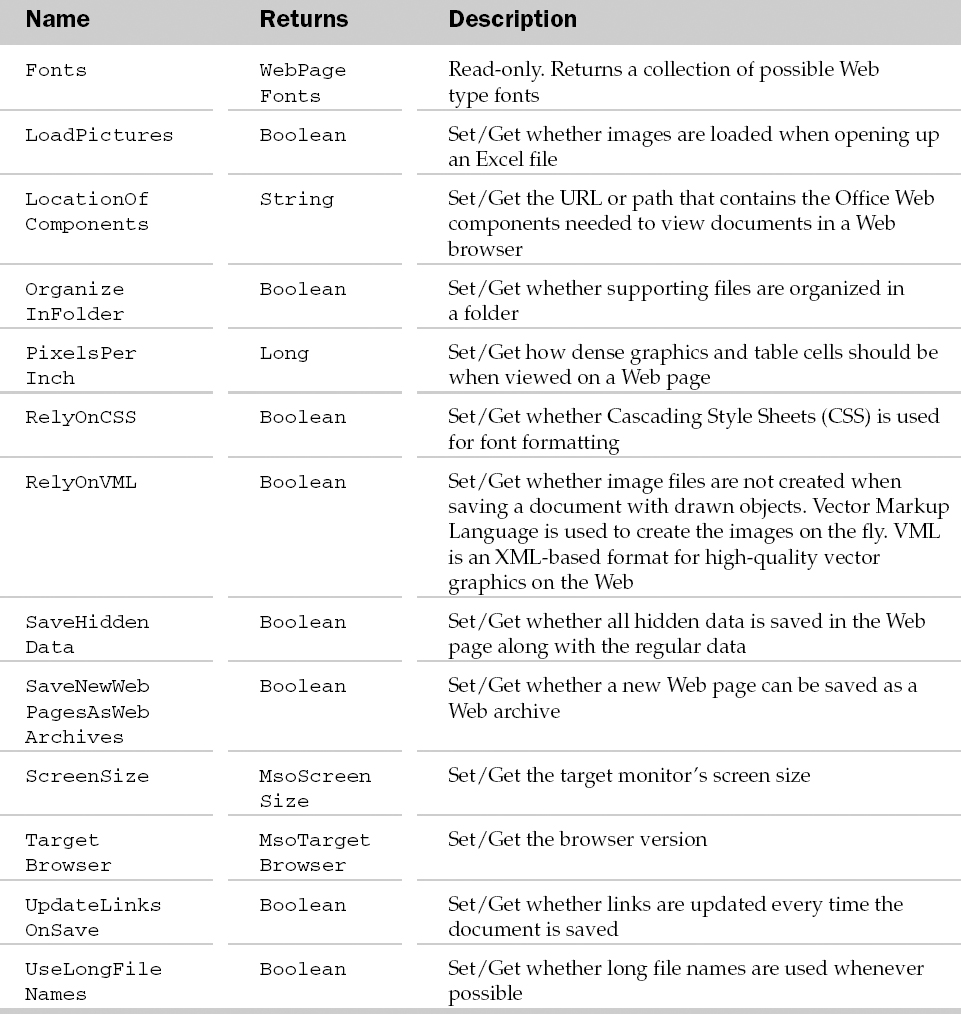
Example: DefaultWebOptions Object
This example shows how to open a Web page, without loading the pictures:
Sub OpenHTMLWithoutPictures()
   Dim bLoadImages As Boolean
   Dim oDWO As DefaultWebOptions
   'Get the Default Web options
   Set oDWO = Application.DefaultWebOptions
   'Remember whether to load pictures
   bLoadImages = oDWO.LoadPictures
   'Tell Excel not to load pictures, for faster opening
   oDWO.LoadPictures = False
   'Open a web page, without pictures
   Workbooks.Open “http://www.wrox.com”
   'Restore the setting
   oDWO.LoadPictures = bLoadImages
End Sub
Diagram Object
A Diagram represents a preset collection of shapes surrounded by an invisible border. It's a cross between adding shapes using the Drawing toolbar and an enhanced version of the Org Chart program used in previous versions of Microsoft Office. Within each Diagram are Nodes. Each Node represents an individual shape in the Diagram.
There are several different types of preset Diagrams you can choose from: Cycle, Target, Radial, Venn, Pyramid, and OrgChart.
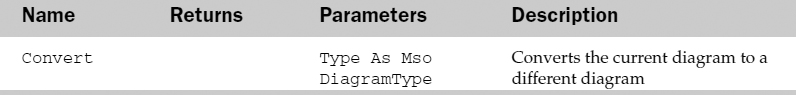
It's important to note that the Diagram object belongs to the Shape(s) object, which, in turn, belongs to the Worksheet object. Consequently, to add a Diagram object to a worksheet, you go through the Shapes collection using the AddDiagram method:
ActiveSheet.Shapes.AddDiagram(msoDiagramOrgChart, 2, 2, 400, 300)
If you set the preceding code to an object variable, it returns a Shape object. To add shapes to the Diagram, use the DiagramNode object within the Shape object:
ActiveSheet.Shapes(1).DiagramNode.Children.AddNode
To reference the properties and methods of the Diagram object itself (listed next), you access the Diagram object through the Shape object, like so:
ActiveSheet.Shapes(1).Diagram.Nodes(1).TextShape.Fill.BackColor.
SchemeColor = 17
Diagram Common Properties
The Application, Creator, and Parent properties are defined at the beginning of this Appendix.
Diagram Properties
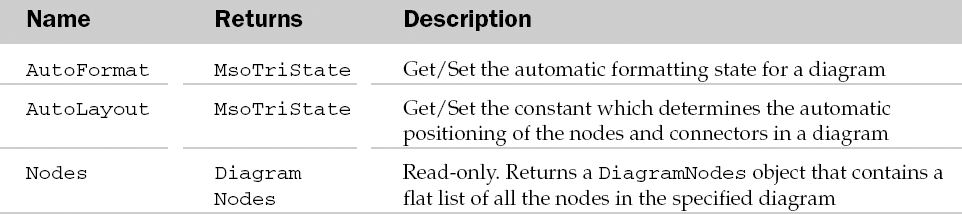
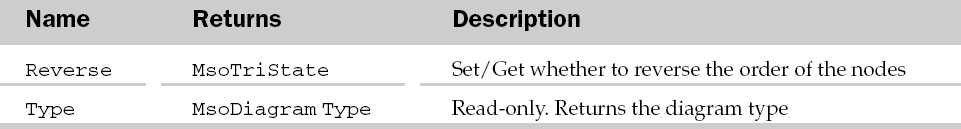
Diagram Methods
Example: Diagram Object
The following routine creates a diagram and adds and formats several shapes (called nodes) to the diagram. The shape color and font name come from a table on a worksheet, allowing you to easily experiment with different looks.
As of this writing, any attempt to programmatically add text to nodes in a Diagram results in an error:
Sub CreateDiagram()

     Const sRANGE_LEVELS As String = “Levels”

     Dim lCount As Long
     Dim oDiagramShape As Shape
     Dim oDiagramNode As DiagramNode
     Dim oDiagramNodeChild As DiagramNode

     'Clear the current shapes (except the Command Button)
     On Error Resume Next
         For Each oDiagramShape In wksDiagrams.Shapes
             If oDiagramShape.HasDiagram Then oDiagramShape.Delete
     Next oDiagramShape
     On Error GoTo 0

     'Turn off the screen
     Application.ScreenUpdating = False

     'Create the Diagram
     Set oDiagramShape = wksDiagrams.Shapes.AddDiagram(msoDiagramOrgChart, 2, 2,
 300, 250)

   'Remove the transparent background
   oDiagramShape.Fill.Visible = msoTrue

    'Create the top level node
    Set oDiagramNode = oDiagramShape.DiagramNode.Children.AddNode

    With oDiagramNode
    'Format the top level node
  With .Shape
     .AutoShapeType = msoShapeBevel
     .TextFrame.Characters.Font.Name = _
     wksDiagrams.Range(sRANGE_LEVELS).Cells(1, 2)    .Text
     .Fill.ForeColor.SchemeColor = _
     wksDiagrams.Range(sRANGE_LEVELS).Cells(1, 3)    .Value
  End With

  'Create a child node under the top level node
  Set oDiagramNodeChild = .Children.AddNode

  'Format the child node
  With oDiagramNodeChild
      .Shape.TextFrame.Characters.Font.Name = _
          wksDiagrams.Range(sRANGE_LEVELS).Cells(2, 2)    .Text
      .Shape.Fill.ForeColor.SchemeColor = _
      wksDiagrams.Range(sRANGE_LEVELS).Cells(2, 3)    .Value
  End With

  'Place two child nodes under the top level's child
  For lCount = 1 To 2
      With oDiagramNodeChild.Children.AddNode
      .Shape.TextFrame.Characters.Font.Name = _
          wksDiagrams.Range(sRANGE_LEVELS).Cells(3    , 2).Text
      .Shape.Fill.ForeColor.SchemeColor = _
          wksDiagrams.Range(sRANGE_LEVELS).Cells(3    , 3).Value
       End With
   Next lCount

   'Create another child under the top level node
   Set oDiagramNodeChild = .Children.AddNode

   With oDiagramNodeChild
       .Shape.TextFrame.Characters.Font.Name = _
       wksDiagrams.Range(sRANGE_LEVELS).Cells(2, 2)    .Text
       .Shape.Fill.ForeColor.SchemeColor = _
       wksDiagrams.Range(sRANGE_LEVELS).Cells(2, 3)    .Value
   End With

   'Place two child nodes under this child
   '(which is under top level)
   For lCount = 1 To 2
       With oDiagramNodeChild.Children.AddNode
            .Shape.TextFrame.Characters.Font.Name = _
                wksDiagrams.Range(sRANGE_LEVELS).Cells(3    , 2).Text
            .Shape.Fill.ForeColor.SchemeColor = _
                wksDiagrams.Range(sRANGE_LEVELS).Cells(3    , 3).Value
       End With
   Next lCount
End With

End Sub
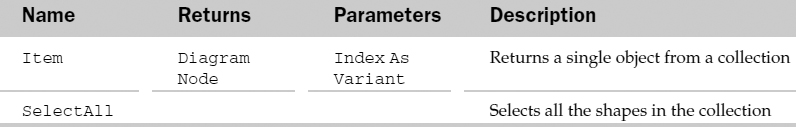
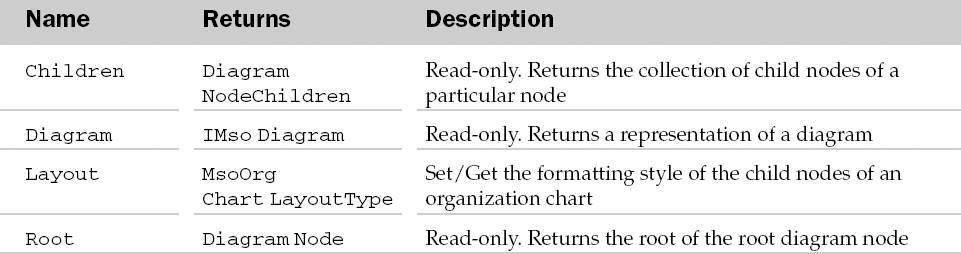
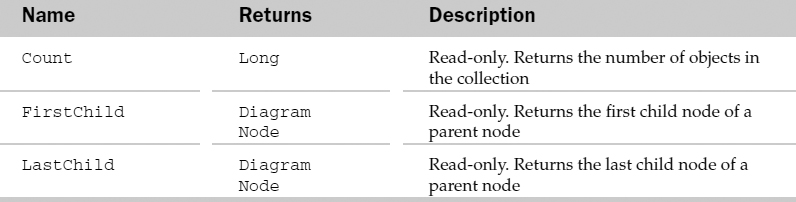
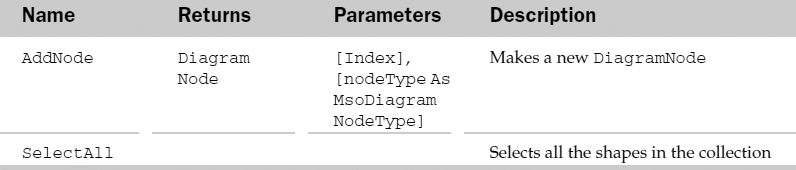
DiagramNode Object and the DiagramNodes Collection
The DiagramNode object represents one shape inside a Diagram. Shapes underneath a specific node are called children. Use the AddNode method of the Children property of this object to add nodes to the current node.
The DiagramNodes collection consists of all of the Nodes in a Diagram object. Each Node is a shape within the Diagram.
DiagramNodes Common Properties
The Application, Creator, and Parent properties are defined at the beginning of this Appendix.
DiagramNodes Collection Properties

DiagramNodes Collection Methods
DiagramNode Common Properties
The Application, Creator, and Parent properties are defined at the beginning of this Appendix.
DiagramNode Properties
DiagramNode Methods
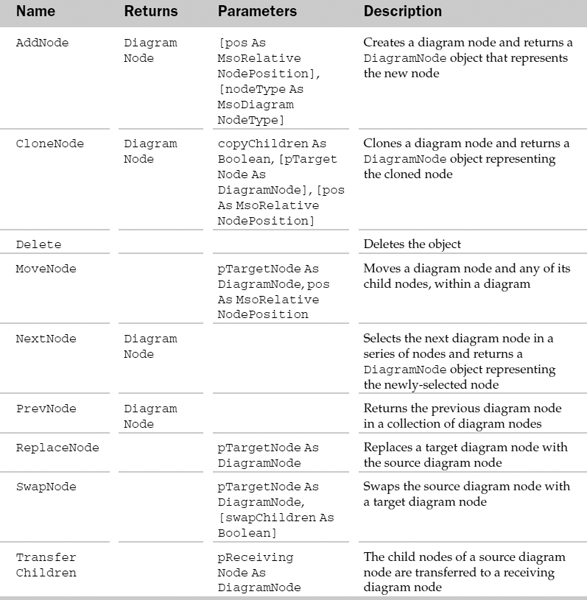
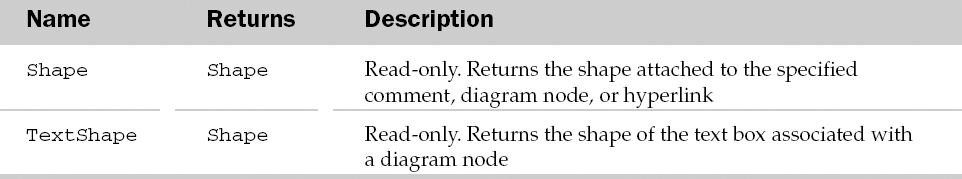
DiagramNodeChildren Object
The DiagramNodeChildren object represents a Child shape one level below a DiagramNode object. Each DiagramNodeChildren object is a DiagramNode object itself. If a DiagramNodeChildren object contains Children below it (in the hiercharchy), then each of those would be considered DiagramNodeChildren objects.
DiagramNodeChildren Common Properties
The Application, Creator, and Parent properties are defined at the beginning of this Appendix.
DiagramNodeChildren Properties
DiagramNodeChildren Methods
Dialog Object and the Dialogs Collection
The Dialogs collection represents the list of dialog boxes that are built-in to Excel. The XlBuiltinDialog constants are used to access an individual Dialog object in the Dialogs collection. A Dialog object represents a single built-in Excel dialog box. Each Dialog object will have additional custom properties depending on what type of Dialog object it is. Besides the typical collection attributes, the Dialogs collection also has a Count property that returns the number of Dialog objects in the collection.
Dialog Common Properties
The Application, Creator, and Parent properties are defined at the beginning of this Appendix.
Dialog Methods
Example: Dialog Object and the Dialogs Collection
Sub ShowPrinterSelection()
   'Show printer selection dialog
   Application.Dialogs(xlDialogPrinterSetup).Show
End Sub
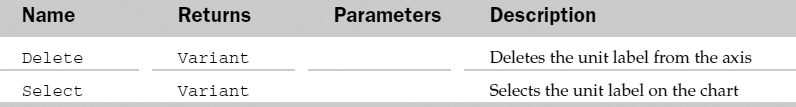
DisplayUnitLabel Object
The DisplayUnitLabel object contains all of the text and formatting associated with the label used for units on axes. For example, if the values on an axis are in the millions it would be messy to display such large values on the axis. Using a unit label such as “Millions” would allow much smaller numbers to be used. The parent of the DisplayUnitLabel object is the Axis object. This object is usually used along with the HasDisplayUnit property of the parent Axis object.
DisplayUnitLabel Common Properties
The Application, Creator, and Parent properties are defined at the beginning of this Appendix.
DisplayUnitLabel Properties

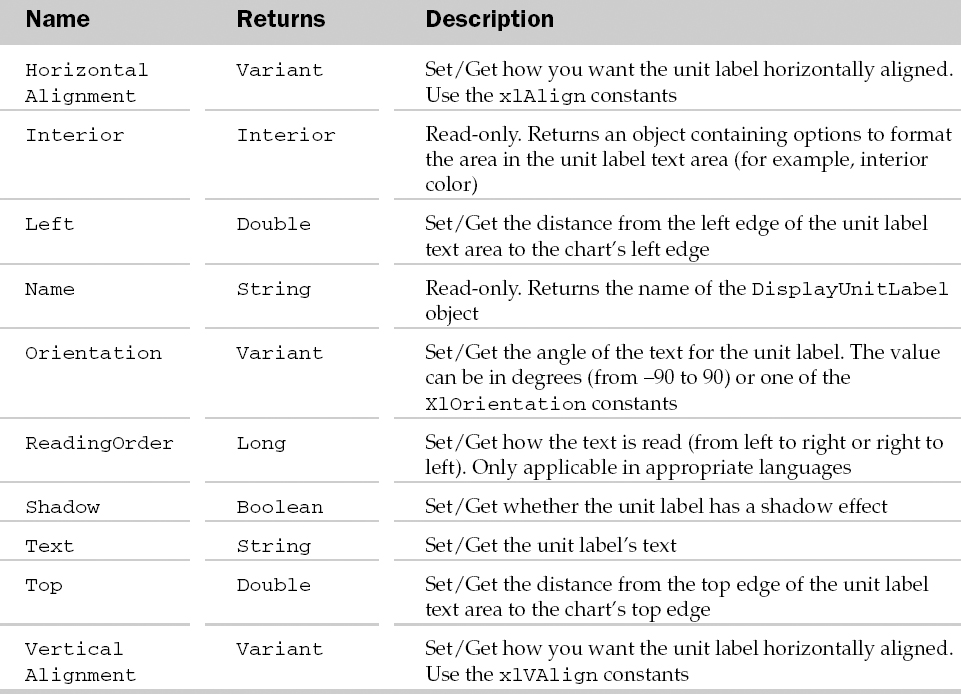
DisplayUnitLabel Methods
Example: DisplayUnitLabel Object
Sub AddUnitLabel()
   Dim oDUL As DisplayUnitLabel
   'Format the Y axis to have a unit label
   With Charts(1).Axes(xlValue)
      .DisplayUnit = xlThousands
      .HasDisplayUnitLabel = True
      'Get the unit label
      Set oDUL = .DisplayUnitLabel
   End With
   'Format the unit label
   With oDUL
      .Caption = “Thousands”
      .Font.Name = “Arial”
      .VerticalAlignment = xlCenter
   End With
End Sub
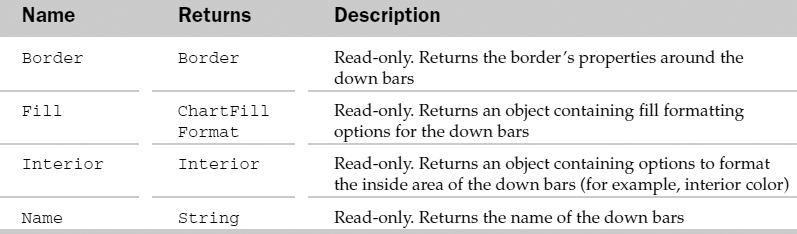
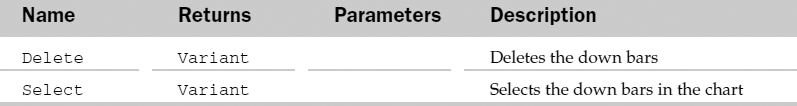
DownBars Object
The DownBars object contains formatting options for down bars on a chart. The parent of the DownBars object is the ChartGroup object. To see if this object exists, use the HasUpDownBars property of the ChartGroup object.
DownBars Common Properties
The Application, Creator, and Parent properties are defined at the beginning of this Appendix.
DownBars Properties
DownBars Methods
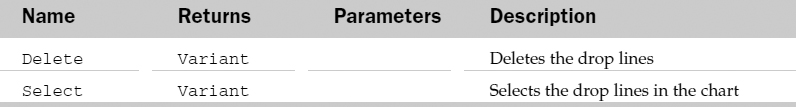
DropLines Object
The DropLines object contains formatting options for drop lines in a chart. The parent of the DropLines object is the ChartGroup object. To see if this object exists, use the HasDropLines property of the ChartGroup object.
DropLines Common Properties
The Application, Creator, and Parent properties are defined at the beginning of this Appendix.
DropLines Properties
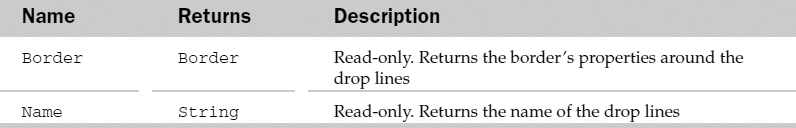
DropLines Methods
Example: DropLines Object
Sub AddAndFormatDropLines()
   Dim oDLine As DropLines
   'Show the drop lines
   Charts(1).ChartGroups(1).HasDropLines = True
   'Get the DropLines object
   Set oDLine = Charts(1).ChartGroups(1).DropLines
   'Format the drop lines
   With oDLine
      .Border.Weight = xlMedium
      .Border.LineStyle = xlDash
      .Border.ColorIndex = 3
   End With
End Sub
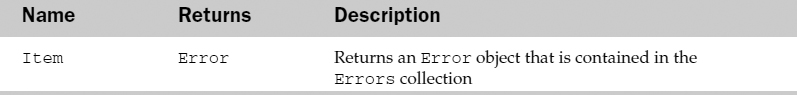
Error Object and the Errors Collection
The Error object contains one error in the Errors collection representing one error in a cell containing possible errors.
The Errors collection represents all the errors contained within a cell. Each cell can contain multiple errors.
These errors are analogous to the new Error Checking feature in Excel 2003. The different types of errors that Excel can check can be found on the Error Checking Tab of the Tools ![]() Options command. In the Excel application, cells containing errors appear with a small triangle in their upper left corner. The default color of the triangle on most systems is green, but can be changed using the Error Indicator Color option on the Error Checking Tab of the Options command.
Options command. In the Excel application, cells containing errors appear with a small triangle in their upper left corner. The default color of the triangle on most systems is green, but can be changed using the Error Indicator Color option on the Error Checking Tab of the Options command.
When a user selects a range containing an error, a drop-down icon containing an exclamation point inside a yellow diamond appears. The user can then click the icon and choose how to handle the errors in the range. If action was taken, like ignoring the error or clicking one of the recommended choices, the green indicator disappears for all cells containing that error. Any cells still containing the green triangle indicate other error types are still present in those cells.
As of this writing, the Errors Collection object and Error object do not have the ability to handle multiple errors in a multicell range as described earlier. The Help file and object model indicate that the Parent object of the Errors Collection is a Range object. However, any attempt to reference the Errors in a multicell range results in an error. Since each cell can contain multiple errors, for all intent and purposes, the Error Collection object stores all the errors contained within one cell, not a range of cells. This requires that you loop through a range of cells if you need to programmatically handle errors in a multicell range.
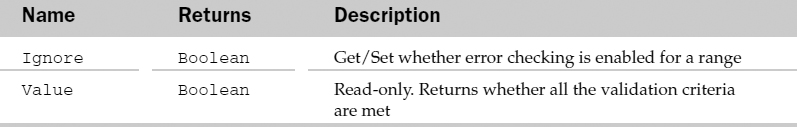
Note that neither the Error nor Errors objects contains a count or Boolean property that would allow us to test whether an error even exists in a cell. For this reason, additional code would be needed to loop through each error type for every desired cell checking for the Error object's Value property, which returns True if that type of error occurs in the cell.
Use the Item property of the Errors Collection object to loop through the error types to determine which errors might have occurred.
Errors Common Properties
The Application, Creator, and Parent properties are defined at the beginning of this Appendix.
Errors Collection Properties
Error Common Properties
The Application, Creator, and Parent properties are defined at the beginning of this Appendix.
Error Properties
ErrorBars Object
The ErrorBars object contains formatting options for error bars in a chart. The parent of the Errors object is the SeriesCollection object.
ErrorBars Common Properties
The Application, Creator, and Parent properties are defined at the beginning of this Appendix.
ErrorBars Properties
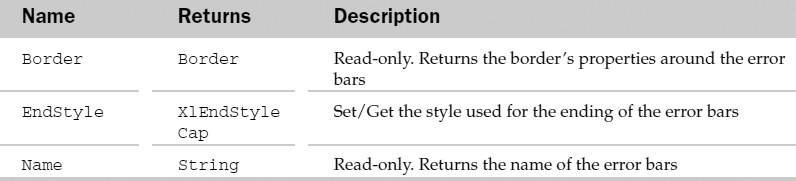
ErrorBars Methods
Example: ErrorBars Object
Sub AddAndFormatErrorBars()
   Dim oSer As Series
   Dim oErrBars As ErrorBars
   'Add error bars to the first series (at +/- 10% of the value)
   Set oSer = Charts(1).SeriesCollection(1)
   oSer.ErrorBar xlY, xlErrorBarIncludeBoth, xlErrorBarTypePercent, 10
   'Get the ErrorBars object
   Set oErrBars = oSer.ErrorBars
   'Format the error bars
   With oErrBars
      .Border.Weight = xlThick
      .Border.LineStyle = xlContinuous
      .Border.ColorIndex = 7
      .EndStyle = xlCap
   End With
End Sub
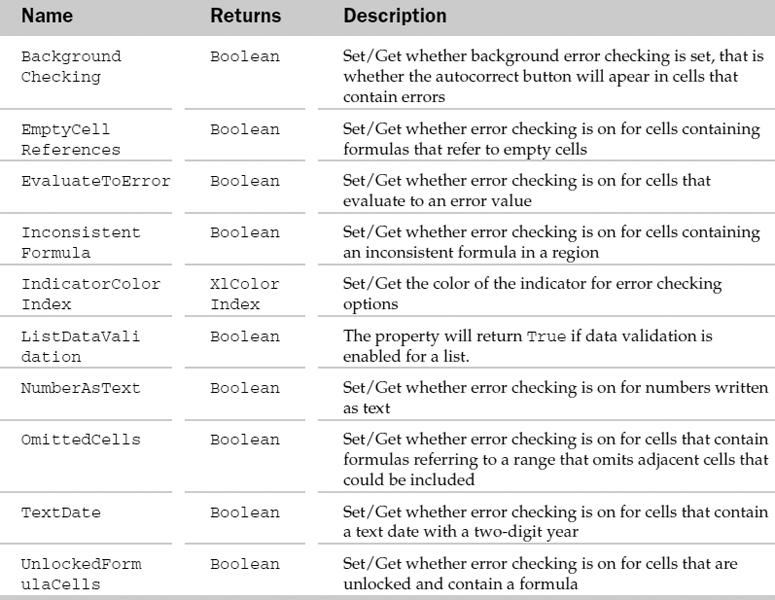
ErrorCheckingOptions Collection Object
Represents all of the Error Checking possibilities found on the Error Checking Tab of the Tools ![]() Options command. Using the BackgroundChecking property of this object hides all of the error indicators (small triangle in the upper right corner of cells).
Options command. Using the BackgroundChecking property of this object hides all of the error indicators (small triangle in the upper right corner of cells).
Use the other properties in this object to specify which type of error checking you want Excel to perform.
The ErrorCheckingOptions object can be referenced through the Application object and therefore affect all open workbooks.
ErrorCheckingOptions Common Properties
The Application, Creator, and Parent properties are defined at the beginning of this Appendix.
ErrorCheckingOptions Collection Properties
Example: ErrorCheckingOptions Object
The following routine uses a table on a worksheet to set the Error Checking Options:
Sub SetErrorCheckingOptions()

    Dim rngSettings As Range
    Dim vSetting As Variant
   'Locate the start of the Settings table
   Set rngSettings = wksErrors.Range(“ErrorSettings”)

   'Go through each ErrorChecking Property and
   ' set it according to the values placed in teh table
   With Application.ErrorCheckingOptions

       vSetting = rngSettings.Cells(1, 2).Value
      If Len(vSetting) And (vSetting = True Or vSetting = False) Then
          .BackgroundChecking = vSetting
      End If

      vSetting = rngSettings.Cells(2, 2).Value
      If Len(vSetting) And (vSetting = True Or vSetting = False) Then
          .EvaluateToError = vSetting
      End If

      vSetting = rngSettings.Cells(3, 2).Value
      If Len(vSetting) And (vSetting = True Or vSetting = False) Then
          .TextDate = vSetting
      End If

      vSetting = rngSettings.Cells(4, 2).Value
      If Len(vSetting) And (vSetting = True Or vSetting = False) Then
          .NumberAsText = vSetting
      End If

      vSetting = rngSettings.Cells(5, 2).Value
      If Len(vSetting) And (vSetting = True Or vSetting = False) Then
          .InconsistentFormula = vSetting
      End If

      vSetting = rngSettings.Cells(6, 2).Value
      If Len(vSetting) And (vSetting = True Or vSetting = False) Then
          .OmittedCells = vSetting
      End If

      vSetting = rngSettings.Cells(7, 2).Value
      If Len(vSetting) And (vSetting = True Or vSetting = False) Then
          .UnlockedFormulaCells = vSetting
      End If

      vSetting = rngSettings.Cells(8, 2).Value
      If Len(vSetting) And (vSetting = True Or vSetting = False) Then
          .EmptyCellReferences = vSetting
     End If

     vSetting = rngSettings.Cells(9, 2).Value
     If LCase(vSetting) = “xlcolorindexautomatic” Then
         .IndicatorColorIndex = xlColorIndexAutomatic
     ElseIf Len(vSetting) And (vSetting > 1 And vSetting < 100) Then
         .IndicatorColorIndex = vSetting
     End If
 End With
    'Indicators sometimes don't appear
    ' after the routine finishes unless you
    ' update the screen
    Application.ScreenUpdating = True
End Sub
FillFormat Object
The FillFormat object represents the fill effects available for shapes. For example, a FillFormat object defines solid, textured, and patterned fill of the parent shape. A FillFormat object can only be accessed through the parent Shape object.
FillFormat Common Properties
The Application, Creator, and Parent properties are defined at the beginning of this Appendix.
FillFormat Properties
FillFormat Methods
Example: FillFormat Object
Sub FormatShape()
   Dim oFF As FillFormat
   'Get the Fill format of the first shape
   Set oFF = ActiveSheet.Shapes(1).Fill
   'Format the shape
   With oFF
      .TwoColorGradient msoGradientFromCorner, 1
      .ForeColor.SchemeColor = 3
      .BackColor.SchemeColor = 5
   End With
End Sub
Filter Object and the Filters Collection
The Filters collection holds all of the filters associated with the specific parent AutoFilter. Each Filter object defines a single filter for a single column in an autofiltered range. The parent of the Filters collection is the AutoFilter object.
The Filters collection has one other property besides the typical collection attributes. The Count property returns the number of Filter objects in the collection.
Filter Common Properties
The Application, Creator, and Parent properties are defined at the beginning of this Appendix.
Filter Properties
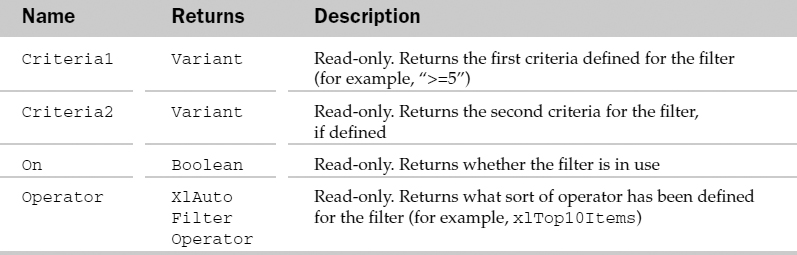
Example: Filter Object and the Filters Collection
See the AutoFormat object for an example of using the Filter object and the Filters collection.
Floor Object
The Floor object contains formatting options for the floor area of a 3D chart. The parent of the Floor object is the Chart object.
Floor Common Properties
The Application, Creator, and Parent properties are defined at the beginning of this Appendix.
Floor Properties
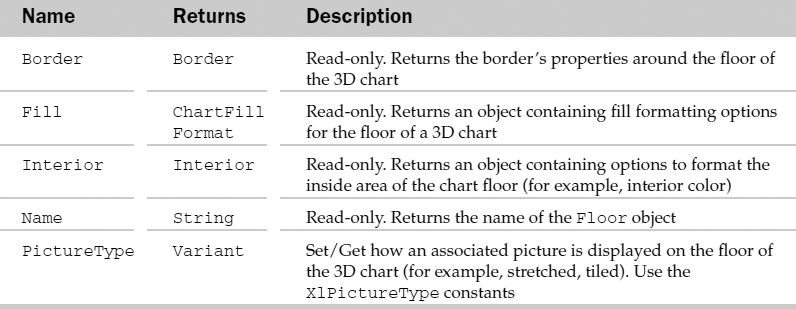
Floor Methods
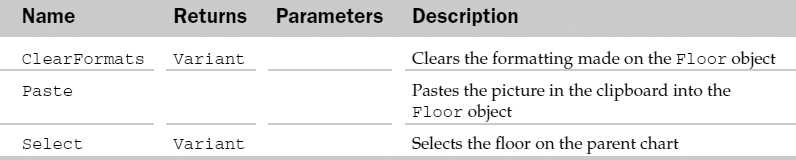
Example: Floor Object
Sub FormatFloor()
   Dim oFlr As Floor
   'Get the chart's Floor
   Set oFlr = Charts(1).Floor
   'Format the floor in white marble
   With oFlr
       .Fill.PresetTextured msoTextureWhiteMarble
       .Fill.Visible = True
   End With
End Sub
Font Object
The Font object contains all of the formatting attributes related to fonts of the parent including font type, size and color. Possible parents of the Font object are the AxisTitle, Characters, ChartArea, ChartTitle, DataLabel, Legend, LegendEntry, Range, Style, and TickLabels objects. Also, the DataLabels collection is another possible parent of the Font object.
Font Common Properties
The Application, Creator, and Parent properties are defined at the beginning of this Appendix.
Font Properties
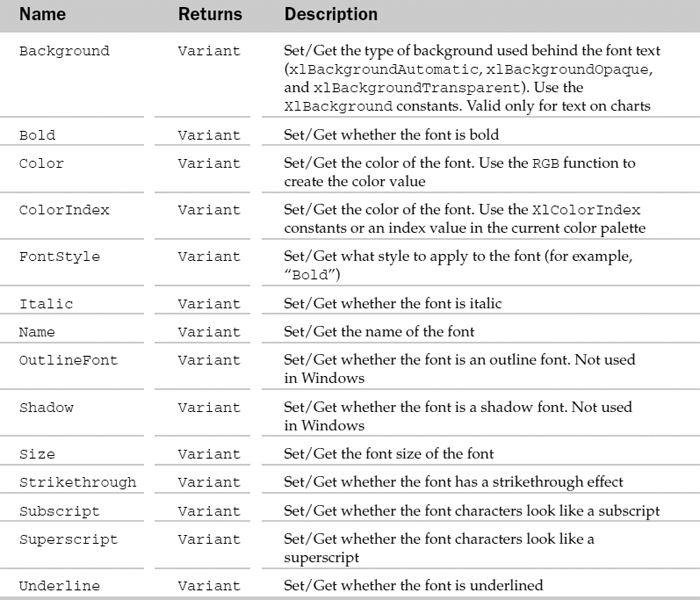
Example: Font Object
Sub FormatCellFont()
  Dim oFont As Font
  'Get the font of the currently selected range
  Set oFont = Selection.Font
  'Format the font
  With oFont
      .Name = “Times New Roman”
      .Size = 16    'Points
      .ColorIndex = 5    'Blue
      .Bold = True
      .Underline = xlSingle
  End With
End Sub
FormatCondition Object and the FormatConditions Collection
The FormatConditions collection contains the conditional formatting associated with the particular range of cells. The Parent of the FormatConditions collection is the Range object. Up to three FormatCondition objects can be contained in the FormatConditions collection. Each FormatCondition object represents some formatting that will be applied if the condition is met.
The FormatConditions collection has one property and two methods besides the typical collection attributes. The Count property returns how many FormatCondition objects are in the collection. The Add method can be used to add a formatting condition to the collection. The Type parameter must be specified (XlFormatConditionType constants) and the condition maybe specified with the Operator, Formula1, and Formula2 parameters.
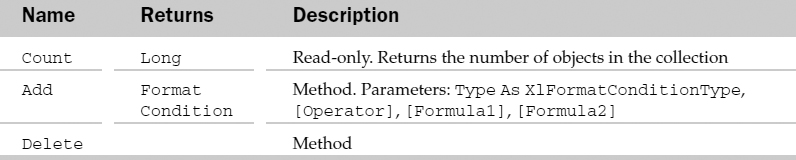
FormatCondition Common Properties
The Application, Creator, and Parent properties are defined at the beginning of this Appendix.
FormatCondition Properties
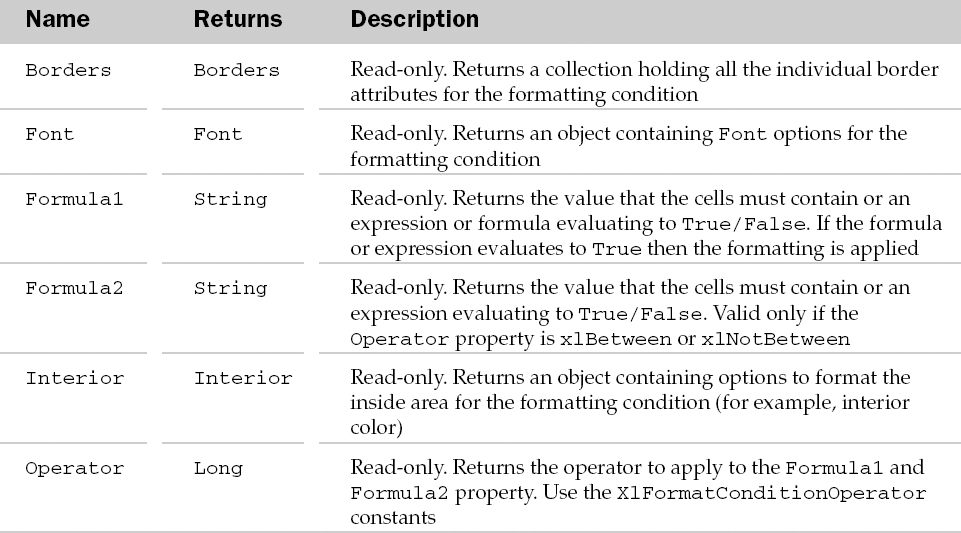
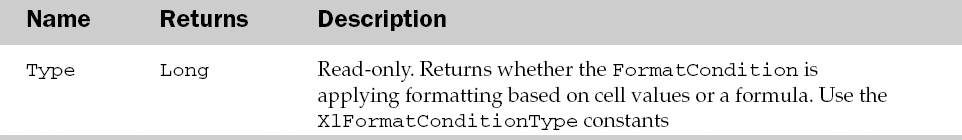
FormatCondition Methods
Example: FormatCondition Object and the FormatConditions Collection
Sub AddConditionalFormat()
   Dim oFC As FormatCondition
   'Remove any existing conditions
   For Each oFC In Selection.FormatConditions
      Selection.FormatConditions(1).Delete
   Next
    'Add first condition
    Set oFC = Selection.FormatConditions.Add(Type :=xlCellValue,
Operator:=xlLess, _                                          Formula1:=“10”)
   With oFC
        .Font.ColorIndex = 2                'white
        .Font.Bold = True
        .Interior.Pattern = xlSolid
        .Interior.Color = RGB(255, 0, 0)    'red
  End With
  'Add second condition
  Set oFC = Selection.FormatConditions.Add(Type    :=xlCellValue,
  Operator:=xlBetween, _
                                                 Formula1:=“10”,    Formula2:=“40”)
  With oFC
    .Font.Color = RGB(0, 255, 0)
    .Font.Bold = False
    .Interior.Pattern = xlNone
  End With
  'Add third condition
  Set oFC = Selection.FormatConditions.Add(Type    :=xlCellValue,
Operator:=xlGreater, _
                                                               Formula1:=“40”)
  With oFC
     .Font.Color = RGB(0, 0, 255)
     .Font.Bold = True
     .Interior.Pattern = xlNone
  End With
End Sub
FreeformBuilder Object
The FreeformBuilder object is used by the parent Shape object to create new “free hand” shapes. The BuildFreeform method of the Shape object is used to return a FreeformBuilder object.
FreeformBuilder Common Properties
The Application, Creator, and Parent properties are defined at the beginning of this Appendix.
FreeformBuilder Methods
Example: FreeformBuilder Object
Sub MakeArch()
   Dim oFFB As FreeformBuilder
   'Create a new freeform builder
   Set oFFB = ActiveSheet.Shapes.BuildFreeform(msoEditingCorner, 100, 300)
   'Add the lines to the builder
   With oFFB
      .AddNodes msoSegmentLine, msoEditingAuto, 100, 200
      .AddNodes msoSegmentCurve, msoEditingCorner, 150, 150, 0, 0, 200, 200
      .AddNodes msoSegmentLine, msoEditingAuto, 200, 300
      .AddNodes msoSegmentLine, msoEditingAuto, 100, 300

      'Convert it to a shape
      .ConvertToShape
   End With
End Sub
Graphic Object
Represents a picture that can be placed in any one of the six locations of the Header and Footer in the Page Setup of a sheet. It's analogous to using both the Insert Picture and Format Picture buttons in the Header or Footer dialogs inside the Page Setup command.
It's important to note that none of the Property settings of this object will result in anything appearing in the Header or Footer unless you insert “&G” (via VBA code) in any of the six different areas of the Header or Footer.
Graphic Common Properties
The Application, Creator, and Parent properties are defined at the beginning of this Appendix.
Graphic Properties
Example: Graphic Object
The following routine prompts the user for a graphic file. If chosen, it places the graphic in the header of the active sheet as a Watermark and sizes it to fit the page:
Sub AddWatermark()
    Dim oSheet As Object
    Dim sFile As String

    On Error Resume Next
        Set oSheet = ActiveSheet
    On Error GoTo 0

    'Make sure there is an active sheet
    If Not oSheet Is Nothing Then

         'Set the properties of the File Open dialog
         With Application.FileDialog(msoFileDialogFilePicker)

     'Change the default dialog title
     .Title = “Insert Graphic In Center Header”

         'Allow only one file
     .AllowMultiSelect = False

     'Clear the filters and create your own
         'Switch to the custom filter before showing the dialog
     .Filters.Add “All Pictures”, “*.gif; *-jpg; *.jpeg; *.bmp;
                                                    *.gif; *.emf; *.dib; *.jfif; *.wmf; _ *.jpe”, 1

       'Show thumbnails to display small representations
       ' of the images
       .InitialView = msoFileDialogViewThumbnail

       'Show the dialog
       '-1 means they didn't cancel
       If .Show = -1 Then
          'Store the chosen file
      sFile = .SelectedItems(1)

      'Set up the graphic in the Header
      With oSheet.PageSetup
          With .CenterHeaderPicture
          .Filename = sFile
          .ColorType = msoPictureWatermark
          .LockAspectRatio = True

          'Make it fill the page
          'c Assumes a letter size portrait)
          .Width = Application.InchesToPoints(17)
      End With

      'Make the graphic appear
      'Without this, nothing happens
      .CenterHeader = “&G”
       End With
       End If
       'Remove the filter when done
       .Filters.Clear

      End With

   End If

End Sub
Gridlines Object
The Gridlines object contains formatting properties associated with the major and minor gridlines on a chart's axes. The gridlines are an extension of the tick marks seen in the background of a chart allowing the end user to more easily see what a chart object's value is. The parent of the Gridlines object is the Axis object. To make sure the object is valid and to create the Gridlines object use the HasMajorGridlines and HasMinorGridlines properties of the Axis object first.
Gridlines Common Properties
The Application, Creator, and Parent properties are defined at the beginning of this Appendix.
Gridlines Properties
Gridlines Methods
Example: Gridlines Object
Sub FormatGridlines()
   Dim oGL As Gridlines
   'Make sure the Y axis has gridlines
   With Charts(1).Axes(xlValue)
      .HasMajorGridlines = True

      'Get the Gridlines object for the major gridlines
      Set oGL = .MajorGridlines
   End With
   'Format the gridlines
   With oGL
      .Border.ColorIndex = 5
      .Border.LineStyle = xlDash
      .Border.Weight = xlThin
   End With
End Sub
GroupShapes Collection
The GroupShapes collection holds all of the shapes that make up a grouped shape. The GroupShapes collection holds a collection of Shape objects. The parent of the GroupShapes object is the Shape object.
The GroupShapes collection only has two properties besides the typical collection attributes. The Count property returns the number of Shape objects in the GroupShapes collection, and the Range property returns a subset of the shapes in the Shapes collection.
HiLoLines Object
The HiLoLines object contains formatting attributes for a chart's high-low lines. The parent of the HiLoLines object is the ChartGroup object. High-low lines connect the largest and smallest points on a 2D line chart group.
HiLoLines Common Properties
The Application, Creator, and Parent properties are defined at the beginning of this Appendix.
HiLoLines Properties
HiLoLines Methods
Example: HiLoLines Object
Sub AddAndFormatHiLoLines()
   Dim oHLL As HiLoLines
   'Add high-low lines to the first group
   Charts(1).ChartGroups(1).HasHiLoLines = True
   'Get the HiLoLines object
   Set oHLL = Charts(1).ChartGroups(1).HiLoLines
   'Format the lines
   With oHLL
      .Border.Weight = xlMedium
      .Border.LineStyle = xlContinuous
      .Border.ColorIndex = 3
   End With
End Sub
HPageBreak Object and the HPageBreaks Collection
The HPageBreaks collection contains all of the horizontal page breaks in the printable area of the parent object. Each HPageBreak object represents a single horizontal page break for the printable area of the parent object. Possible parents of the HPageBreaks collection are the WorkSheet and the Chart objects.
The HPageBreaks collection contains one property and one method besides the typical collection attributes. The Count property returns the number of HPageBreak objects in the collection. The Add method is used to add a HPageBreak object to the collection (and horizontal page break to the sheet). The Add method has a Before parameter to specify the range above where the horizontal page break will be added.
HPageBreak Common Properties
The Application, Creator, and Parent properties are defined at the beginning of this Appendix.
HPageBreak Properties
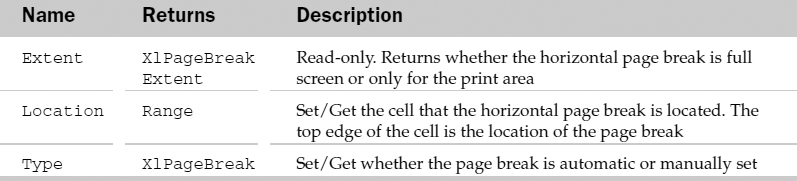
HPageBreak Methods
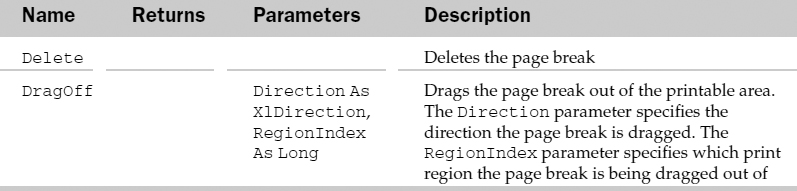
Example: HPageBreak Object and the HPageBreaks Collection
Sub AddHPageBreaks()
   Dim oCell As Range
   'Loop through all the cells in the first column of the sheet
   For Each oCell In ActiveSheet.UsedRange.Columns(1). Cells
      'If the font size is 16, add a page break above the cell
      If oCell.Font.Size = 16 Then
         ActiveSheet.HPageBreaks.Add oCell
      End If
   Next
End Sub
Hyperlink Object and the Hyperlinks Collection
The Hyperlinks collection represents the list of hyperlinks in a worksheet or range. Each Hyperlink object represents a single hyperlink in a worksheet or range. The Hyperlinks collection has an Add and Delete method besides the typical collection of properties and methods. The Add method takes the text or graphic that is to be converted into a hyperlink (Anchor) and the URL address or filename (Address) and creates a Hyperlink object. The Delete method deletes the Hyperlinks in the collection. The Hyperlinks collection also has a Count property that returns the number of Hyperlink objects in the collection.
Hyperlink Common Properties
The Application, Creator, and Parent properties are defined at the beginning of this Appendix.
Hyperlink Properties
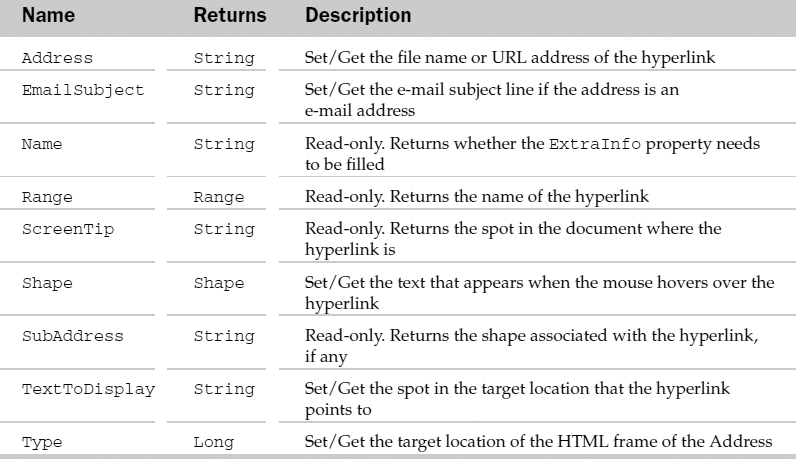
Hyperlink Methods
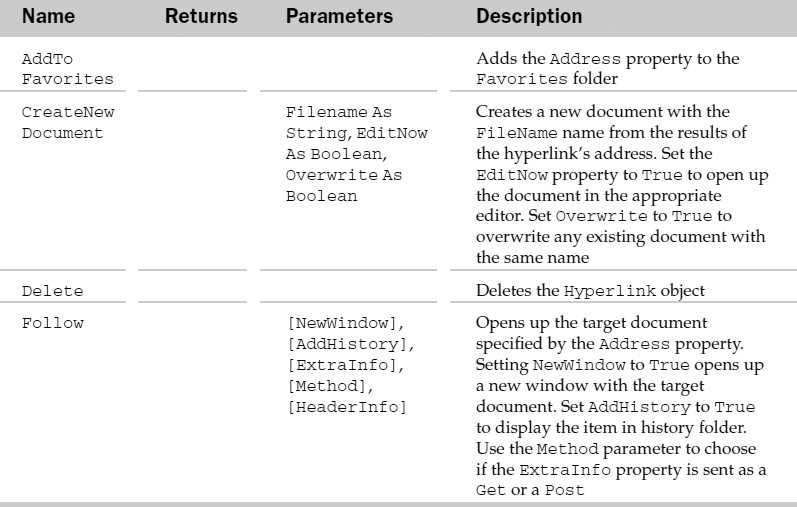
Example: Hyperlink Object and the Hyperlinks Collection
This example creates a hyperlink-based “Table of Contents” worksheet:
Sub CreateHyperlinkTOC()
   Dim oBk As Workbook
   Dim oShtTOC As Worksheet, oSht As Worksheet
   Dim iRow As Integer
   Set oBk = ActiveWorkbook
   'Add a new sheet to the workbook
   Set oShtTOC = oBk.Worksheets.Add
   With oShtTOC
      'Add the title to the sheet
      .Range(“A1”).Value = “Table of Contents”

      'Add Mail and web hyperlinks
      .Hyperlinks.Add .Range(“A3”), “mailto:[email protected]”, _
                    TextToDisplay:=“Email your comments”
      .Hyperlinks.Add .Range(“A4”), “http://www.wrox.com”, _
                    TextToDisplay:=“Visit Wrox Press”
   End With
   'Loop through the sheets in the workbook
   'adding location hyperlinks
   iRow = 6
   For Each oSht In oBk.Worksheets
      If oSht.Name <> oShtTOC.Name Then
         oShtTOC.Hyperlinks.Add oShtTOC.Cells(iRow, 1), “”, _
                   SubAddress:=“'”  & oSht.Name & “'!A1”, _
                   TextToDisplay:=oSht.Name
         iRow = iRow + 1
      End If
   Next
End Sub
Interior Object
The Interior object contains the formatting options associated with the inside area of the parent object. Possible parents of the Interior object are the AxisTitle, ChartArea, ChartObject, ChartTitle, DataLabel, DownBars, Floor, FormatCondition, Legend, LegendKey, OLEObject, PlotArea, Point, Range, Series, Style, Upbars, and Walls objects. The ChartObjects, DataLabels, and OLEObjects collections also are possible parents of the Interior object.
Interior Common Properties
The Application, Creator, and Parent properties are defined at the beginning of this Appendix.
Interior Properties
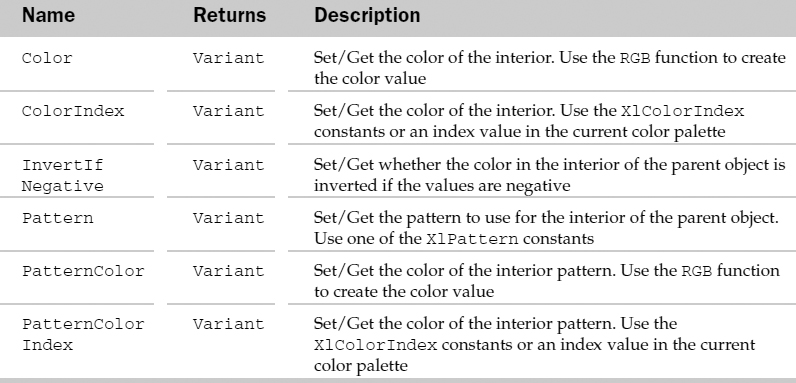
Example: Interior Object
Sub FormatRange()
   Dim oInt As Interior
   'Get the interior of the current selection
   Set oInt = Selection. Interior
   'Format the interior in    solid yellow
   '(colour depends on the workbook palette)
   With oInt
      .Pattern = xlSolid
      .ColorIndex = 6
   End With
End Sub
IRtdServer Object
This object allows the ability to connect to a Real-Time Data Server (RTD). This type of server allows Excel to receive timed interval data updates without the need for extra coding. In prior versions of Excel, when regular updates were needed, you could use the OnTime method to set up regular data update intervals. RTDs send updates automatically based on an interval set within the server or by using the HeartbeatInterval method of the IRTDUpdateEvent object.
This object is similar in nature to using the RTD worksheet function, which displays data at regular intervals in a worksheet cell.
Note that to use this object you must instantiate it using the Implements keyword.
IRtdServer Methods
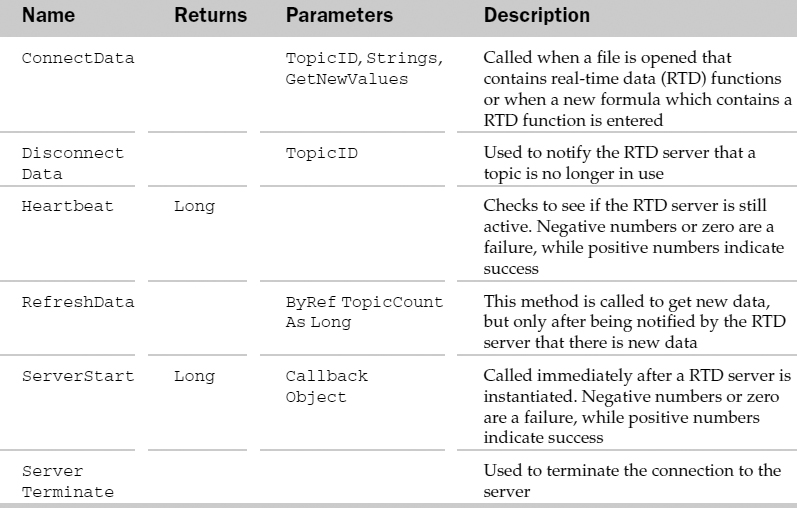
IRTDUpdateEvent Object
Represents Real-Time update events. This object is used to set the interval between updates for an IrtdServer object using the HeartbeatInterval property. This object is returned when you use the ServerStart method of the IrtdServer object to connect to a Real-Time Data server.
IRTDUpdateEvent Properties

IRTDUpdateEvent Methods
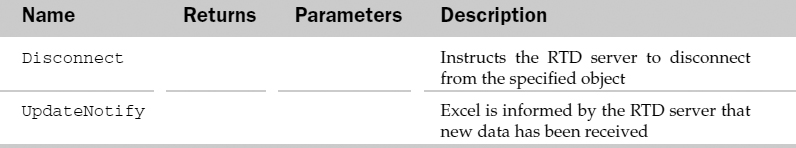
LeaderLines Object
The LeaderLines object contains the formatting attributes associated with leader lines on charts connecting data labels to the actual points. The parent of the LeaderLines object is the Series object. Use the HasLeaderLines property of the Series object to create a LeaderLines object and make sure one exists.
LeaderLines Common Properties
The Application, Creator, and Parent properties are defined at the beginning of this Appendix.
LeaderLines Properties

LeaderLines Methods
Example: LeaderLines Object
Sub AddAndFormatLeaderLines()
   Dim oLL As LeaderLines
   'Using the first series of the PIE chart
   With Charts(1).SeriesCollection(1)
      'Add labels with leader lines (if required)
      .ApplyDataLabels HasLeaderLines:=True

      'Position the labels
      .DataLabels.Position = xlLabelPositionBestFit

      'Get the LeaderLines Object. If all labels are
      'in their default position, this will give an error
      Set oLL = .LeaderLines
   End With
   'Format the leader lines
   With oLL
      .Border.LineStyle = xlContinuous
      .Border.ColorIndex = 5
   End With
End Sub
Legend Object
The Legend object contains the formatting options and legend entries for a particular chart. The parent of the Legend object is the Chart object. Use the HasLegend property of the Chart object to create a Legend object and to make sure one exists.
Legend Common Properties
The Application, Creator, and Parent properties are defined at the beginning of this Appendix.
Legend Properties
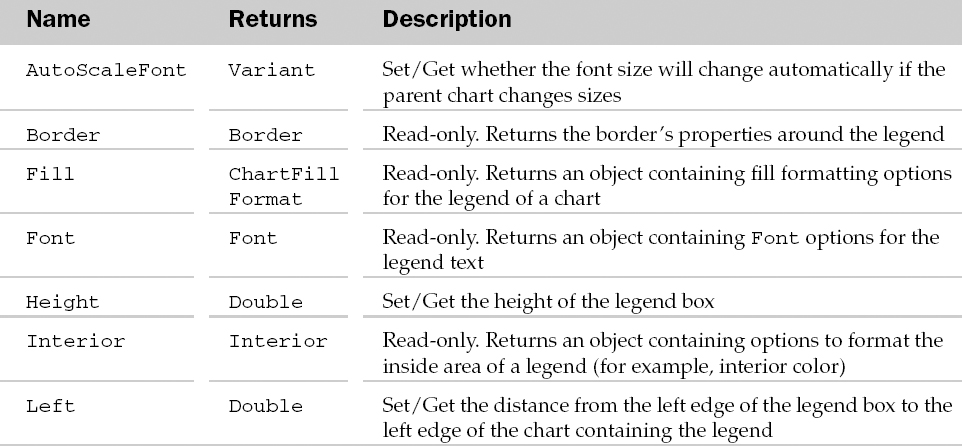
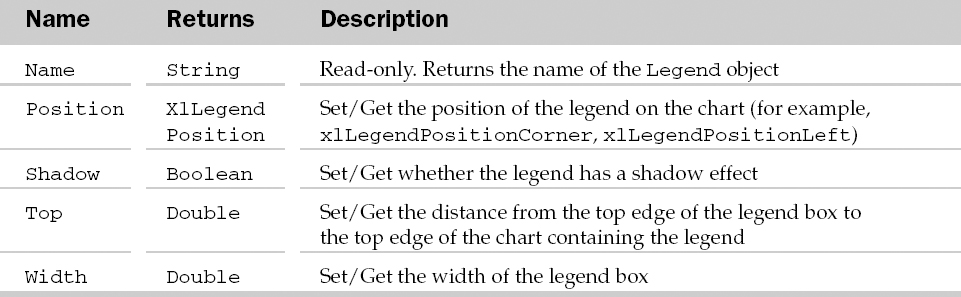
Legend Methods
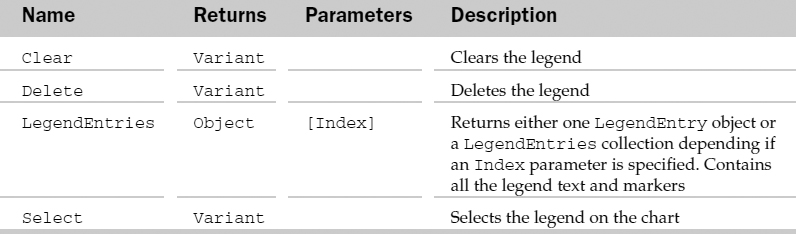
Example: Legend Object
Sub PlaceLegend()
   Dim oLgnd As Legend
   'Make sure the chart has a legend
   Charts(1).HasLegend = True
   'Get the Legend
   Set oLgnd = Charts(1).Legend
   'Position and format the legend
   With oLgnd
      .Position = xlLegendPositionRight
      .Border.LineStyle = xlNone
      .AutoScaleFont = False
   End With
End Sub
LegendEntry Object and the LegendEntries Collection
The LegendEntries collection contains the collection of entries in a legend. Each LegendEntry object represents a single entry in a legend. This consists of the legend entry text and the legend entry marker. The legend entry text is always the associated series name or trendline name. The parent of the LegendEntries collection is the Legend object.
The LegendEntries collection contains one property besides the typical collection attributes. The Count property returns the number of LegendEntry objects in the collection.
LegendEntry Common Properties
The Application, Creator, and Parent properties are defined at the beginning of this Appendix.
LegendEntry Properties
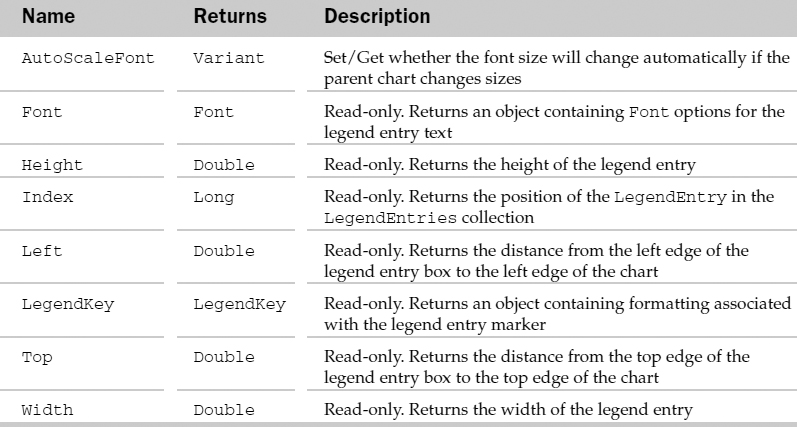
LegendEntry Methods
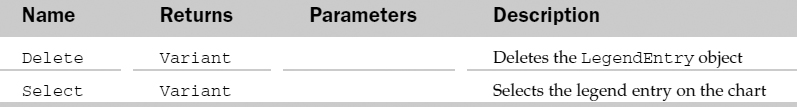
Example: LegendEntry Object and the LegendEntries Collection
Sub FormatLegendEntries()
   Dim oLE As LegendEntry
   'Make sure the chart has a legend
   Charts(1).HasLegend = True
   'Loop through all the legend entries
   For Each oLE In Charts(1).Legend.LegendEntries
      'Format each entry with a different font style
      With oLE
         .Font.Size = 10 + .Index * 4
     .Font.Bold = (.Index Mod 2) = 0
         .Font.ColorIndex = .Index
      End With
   Next
End Sub
LegendKey Object
The LegendKey object contains properties and methods to manipulate the formatting associated with a legend key entry marker. A legend key is a visual representation, such as a color, that identifies a specific series or trendline.
LegendKey Common Properties
The Application, Creator, and Parent properties are defined at the beginning of this Appendix.
LegendKey Properties
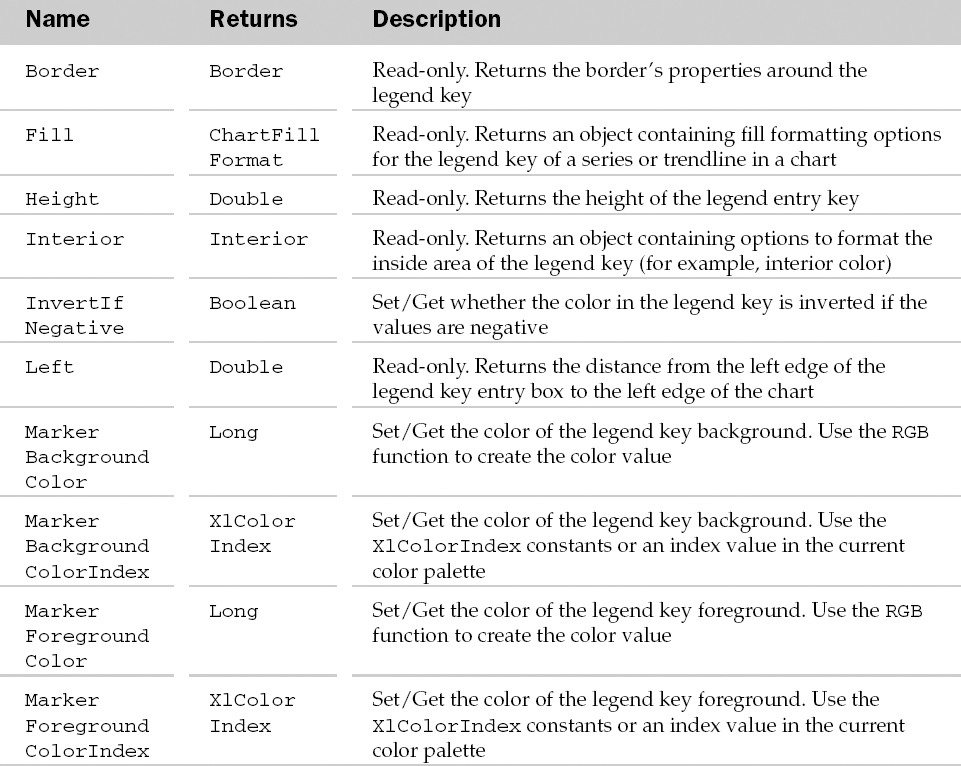
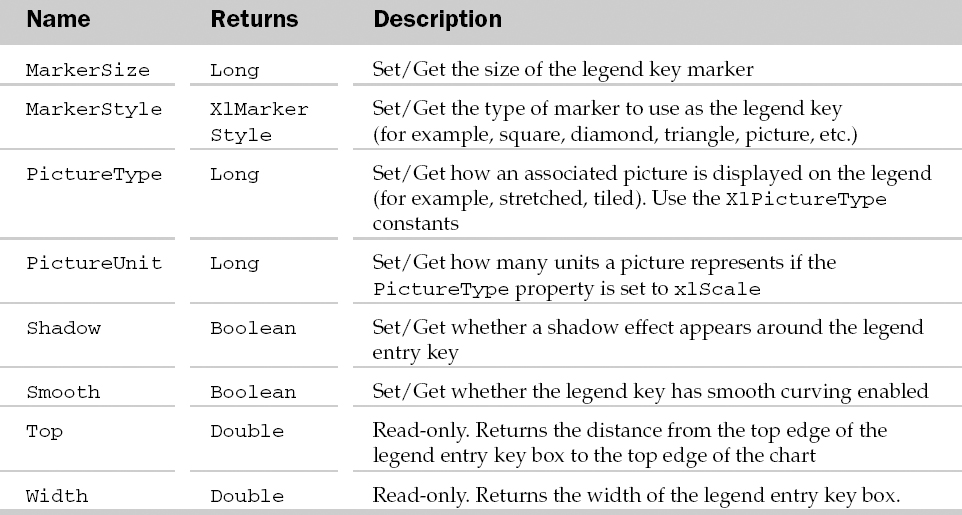
LegendKey Methods
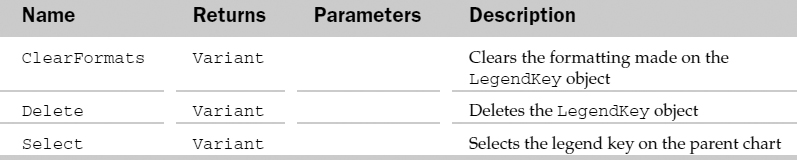
Example: LegendKey Object
Sub FormatLegendKeys()
   Dim oLE As LegendEntry
   Dim oLK As LegendKey
   'Make sure the chart has a legend
   Charts(1).HasLegend = True
   'Loop through all the legend entries
   For Each oLE In Charts(1).Legend.LegendEntries
      'Get the legend key for the entry
      Set oLK = oLE.LegendKey

      'Format each legend key with a different colour and size
      With oLK
         .MarkerForegroundColor = oLE.Index
     .MarkerSize = oLE.Index * 2 + 1
      End With
   Next
End Sub
LineFormat Object
The LineFormat object represents the formatting associated with the line of the parent Shape object. The Line property of the Shape object is used to access the LineFormat object. The LineFormat object is commonly used to change line properties such as arrowhead styles and directions.
LineFormat Common Properties
The Application, Creator, and Parent properties are defined at the beginning of this Appendix.
LineFormat Properties
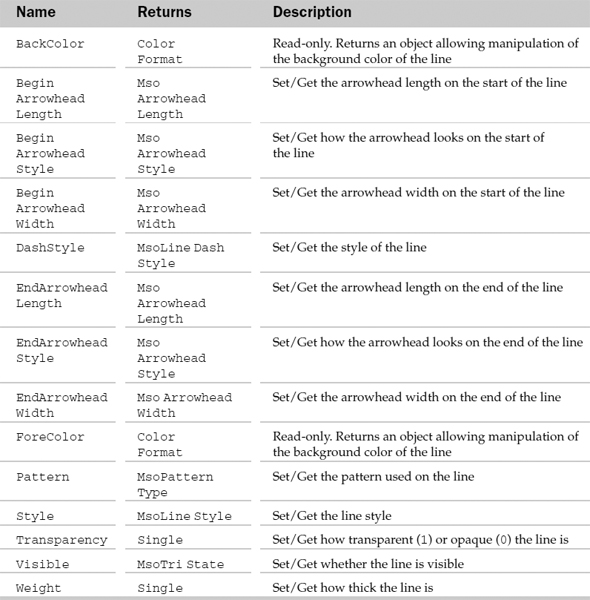
Example: LineFormat Object
Sub AddAndFormatLine()
   Dim oShp As Shape
   Dim oLF As LineFormat
   'Add a line shape
   Set oShp = ActiveSheet.Shapes.AddLine(100, 100, 200, 250)
   'Get the line format object
   Set oLF = oShp.Line
   'Set the line format
   With oLF
      .BeginArrowheadStyle = msoArrowheadOval
      .EndArrowheadStyle = msoArrowheadTriangle
      .EndArrowheadLength = msoArrowheadLong
      .EndArrowheadWidth = msoArrowheadWide
      .Style = msoLineSingle
   End With
End Sub
LinkFormat Object
The LinkFormat object represents the linking attributes associated with an OLE object or picture. The LinkFormat object is associated with a Shape object. Only Shape objects that are valid OLE objects can access the LinkFormat object.
LinkFormat Common Properties
The Application, Creator, and Parent properties are defined at the beginning of this Appendix.
LinkFormat Properties
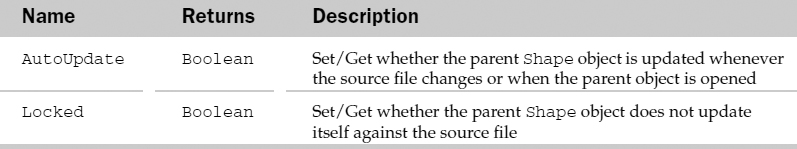
LinkFormat Methods
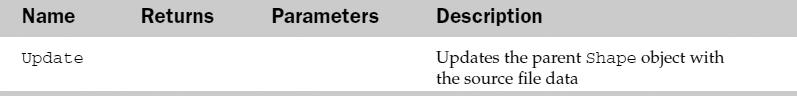
Example: LinkFormat Object
Sub UpdateShapeLinks()
   Dim oShp As Shape
   Dim oLnkForm As LinkFormat
   'Loop through all the shapes in the sheet
   For Each oShp In ActiveSheet.Shapes
      'Is it a linked shape?
      If oShp.Type = msoLinkedOLEObject Or oShp.Type = msoLinkedPicture Then

         'Yes, so get the link format
         Set oLnkForm = oShp.LinkFormat

         'and update the link
     oLnkForm.Update
      End If
   Next
End Sub
ListColumn Object
The ListColumn object represents a column in a List. The ListColumns Collection contains all columns within in list, represented by many ListColumn objects.
ListColumn Common Properties
The Application, Creator, and Parent properties are defined at the beginning of this Appendix.
ListColumn Properties
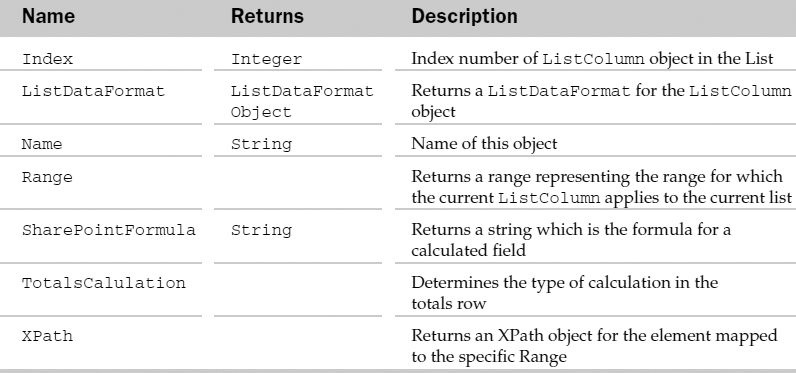
ListColumn Methods

ListDataFormat Object
The ListDataFormat holds all of the data type properties for a ListColumn object.
ListDataFormat Common Properties
The Application, Creator, and Parent properties are defined at the beginning of this Appendix.
ListDataFormat Properties
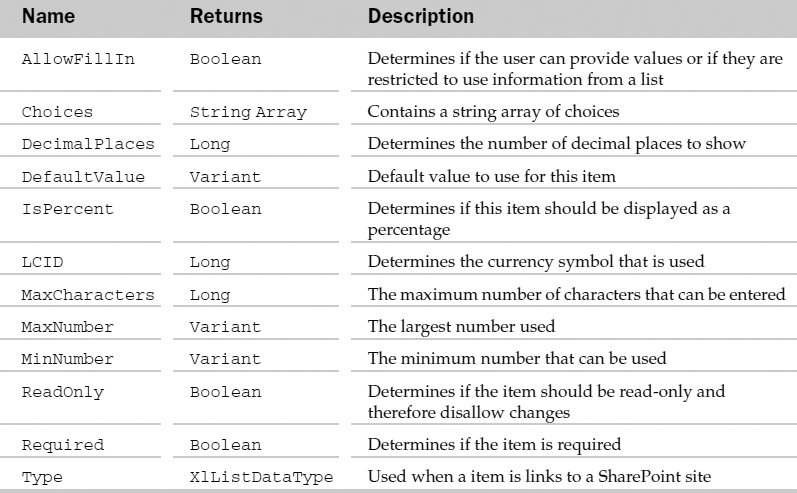
ListObject Object
The ListObject represents a list object within a workbook.
ListObject Properties
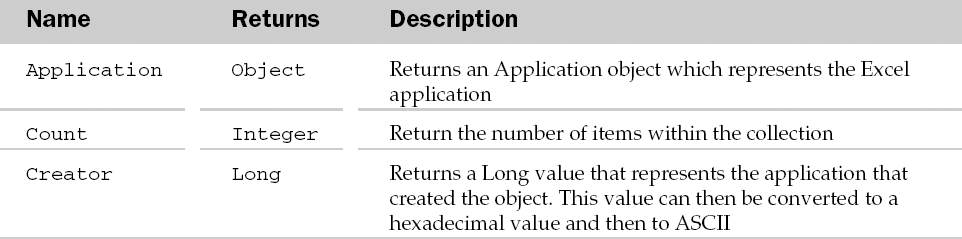
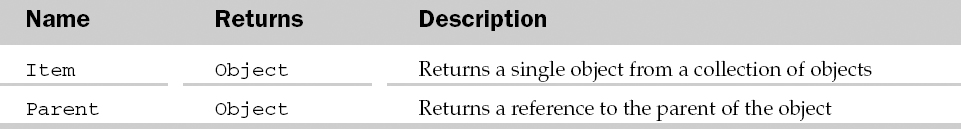
ListObject Methods
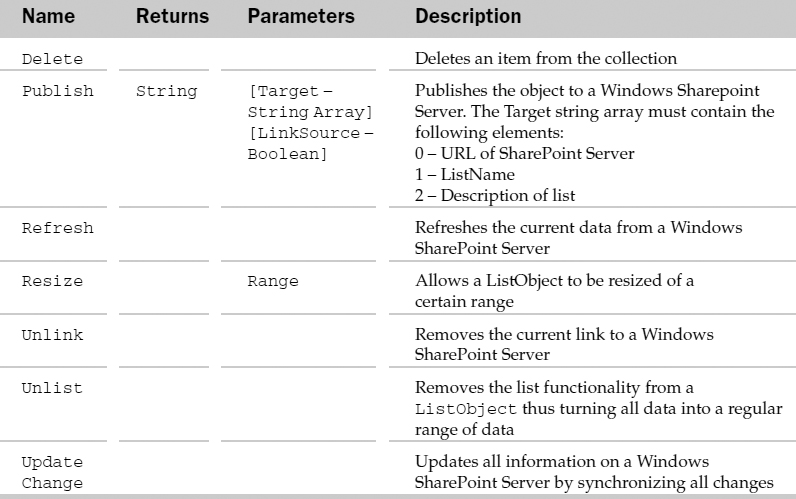
ListRow Object
The ListRow, as the name implies, represents a Row within a List object.
ListRow Properties
ListRow Methods

Mailer Object
The Mailer object is used on the Macintosh to mail Excel files using the PowerTalk Mailer.
Mailer Common Properties
The Application, Creator, and Parent properties are defined at the beginning of this Appendix.
Mailer Properties
Name Object and the Names Collection
The Names collection holds the list of named ranges in a workbook. Each Name object describes a range of cells in a workbook that can be accessed by the name. Some Name objects are built-in (for example, Print_Area) and others are user defined. The parent of the Names collection can be the WorkBook, Application, and Worksheet object. The Name object can also be accessed through the Range object.
The Names collection has an Add method besides the typical collection attributes. The Add method adds a Name object to the collection. The parameters of the Add method correspond to the properties of the Name object.
Name Common Properties
The Application, Creator, and Parent properties are defined at the beginning of this Appendix.
Name Properties
Name Methods

Example: Name Object and the Names Collection
Sub DeleteInvalidNames()
   Dim oName As Name
   'Loop through all the names in the active workbook
   For Each oName In ActiveWorkbook.Names
      'Is it an invalid name?
      If InStr(1, oName.RefersTo, “#REF”) > 0 Then

         'Yes, so log it
         Debug.Print “Deleted name ” & oName.Name & “ - ” & oName.RefersToLocal

         'and delete it from the collection
         oName.Delete
      End If
   Next
End Sub
ODBCError Object and the ODBCErrors Collection
The ODBCErrors collection contains a list of errors that occurred by the most recent query using an ODBC connection. Each ODBCError object contains information describing an error that occurred on the most recent query using an ODBC connection. If the most recent query against an ODBC source did not generate any errors then the collection is empty.
The ODBCErrors collection has a Count property besides the typical collection attributes. The Count property returns the number of ODBCError objects in the collection.
ODBCError Common Properties
The Application, Creator, and Parent properties are defined at the beginning of this Appendix.
ODBCError Properties
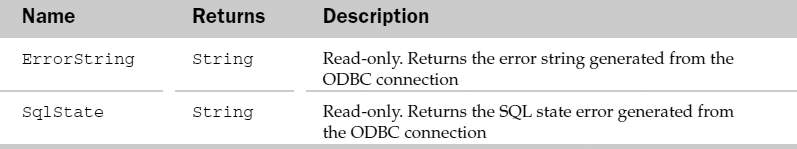
Example: ODBCError Object and the ODBCErrors Collection
Sub CheckODBCErrors()
   Dim oErr As ODBCError
   Dim sMsg As String
   'Continue after errors
   On Error Resume Next
   'Don't show logon prompts etc
   Application.DisplayAlerts = False
   'Update an ODBC query table
   ActiveSheet.QueryTables(1).Refresh
   'Any errors?
   If Application.ODBCErrors.Count = 0 Then
      'No, so all OK
      MsgBox “Updated OK”
   Else
      'Yes, so list them all
      sMsg = “The following error(s) occured during the update”
      For Each oErr In Application.ODBCErrors
         sMsg = sMsg & vbCrLf & oErr.ErrorString & “ (” & oErr.SqlState & “)”
      Next
      MsgBox sMsg
   End If
End Sub
OLEDBError Object and the OLEDBErrors Collection
The OLEDBErrors collection contains a list of errors that occurred by the most recent query using an OLE DB provider. Each OLEDBError object contains information describing an error that occurred on the most recent query using an OLE DB provider. If the most recent query against an OLE DB provider did not generate any errors then the collection is empty.
The OLEDBErrors collection has a Count property besides the typical collection attributes. The Count property returns the number of OLEDBError objects in the collection.
OLEDBError Common Properties
The Application, Creator, and Parent properties are defined at the beginning of this Appendix.
OLEDBError Properties
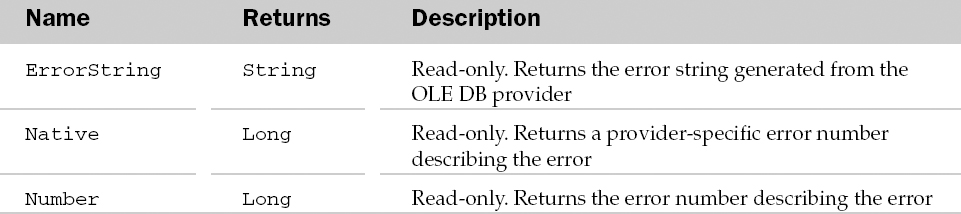
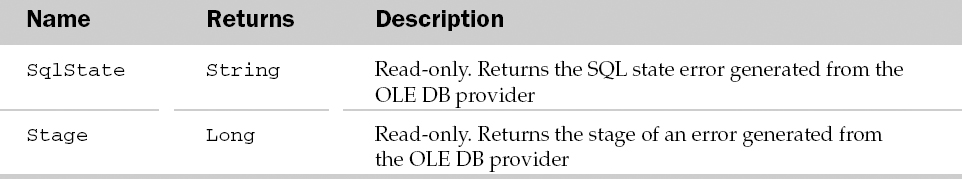
Example: OLEDBError Object and the OLEDBErrors Collection
Sub CheckOLEDbErrors()
   Dim oErr As OLEDBError
   Dim sMsg As String
   'Continue after errors
   On Error Resume Next
   'Don't show logon prompts etc
   Application.DisplayAlerts = False
   'Update an OLE DB pivot table
   ActiveSheet.PivotTables(1).Refresh
   'Any errors?
   If Application.OLEDBErrors.Count = 0 Then
      'No, so all OK
      MsgBox “Updated OK”
   Else
      'Yes, so list them all
      sMsg = “The following error(s) occured during the update”
      For Each oErr In Application.OLEDBErrors
         sMsg = sMsg & vbCrLf & oErr.ErrorString & “ (” & oErr.SqlState & “)”
      Next
      MsgBox sMsg
   End If
End Sub
OLEFormat Object
The OLEFormat object represents all attributes associated with an OLE object or ActiveX object for linking. Linking characteristics are taken care of by the LinkFormat object. The Shape object is the parent of the OLEFormat object. The parent Shape object must be a linked or embedded object to be able to use this object.
OLEFormat Common Properties
The Application, Creator, and Parent properties are defined at the beginning of this Appendix.
OLEFormat Properties
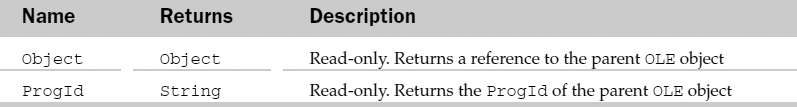
OLEFormat Methods
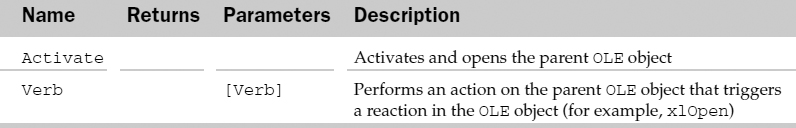
Example: OLEFormat Object
Sub PrintEmbeddedWordDocuments1()
   Dim oShp As Shape
   Dim oOF As OLEFormat
   'Loop through all the shapes in the sheet
   For Each oShp In ActiveSheet.Shapes
      'Is it an embedded object
      If oShp.Type = msoEmbeddedOLEObject Then
         'Get the embedded object's format
         Set oOF = oShp.OLEFormat

         'Is it a Word document?
         If oOF.ProgId Like “Word.Document*” Then

            'Yes, so print the Word document.
            'The first .Object gives us the generic
            'OLEObject contained in the Shape.
            'The second .Object gives us the Word object
            'contained within the OLEObject
            oOF.Object.Object.PrintOut
         End If
      End If
   Next
End Sub
OLEObject Object and the OLEObjects Collection
The OLEObjects collection holds all the ActiveX controls, linked OLE objects and embedded OLE objects on a worksheet or chart. An OLE object represents an ActiveX control, a linked OLE object, or an embedded OLE object on a worksheet or chart.
The OLEObjects collection has many properties and methods besides the typical collection attributes. These are listed in the following table.
OLEObjects Collection Properties and Methods
OLEObject Common Properties
The Application, Creator, and Parent properties are defined at the beginning of this Appendix.
OLEObject Properties
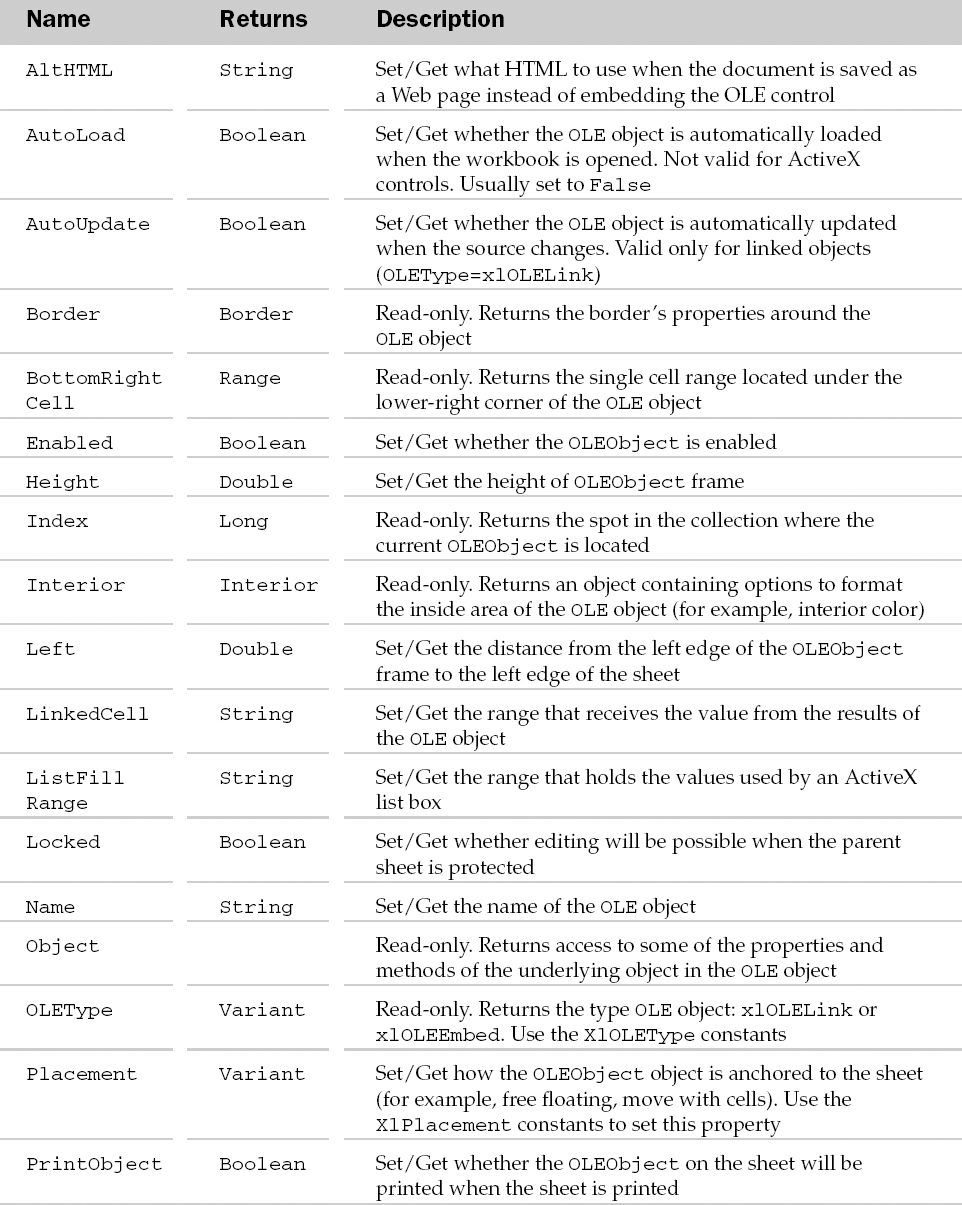
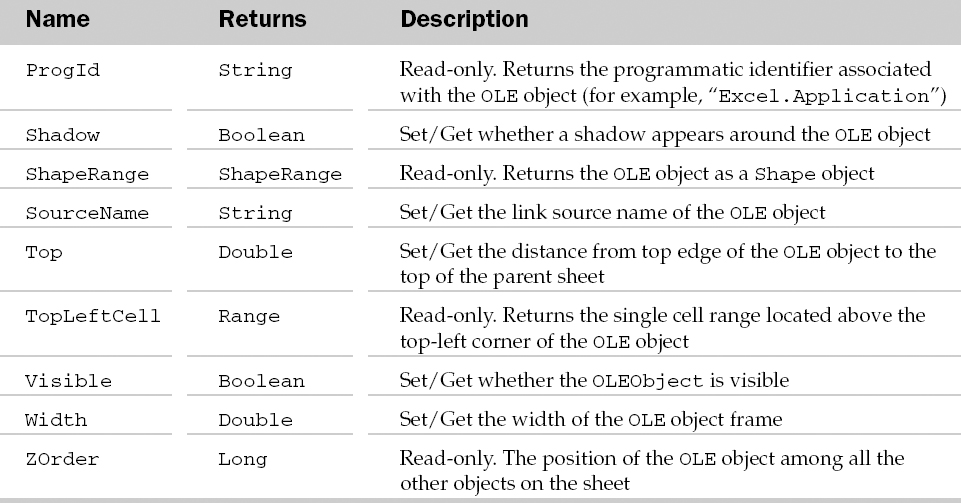
OLEObject Methods
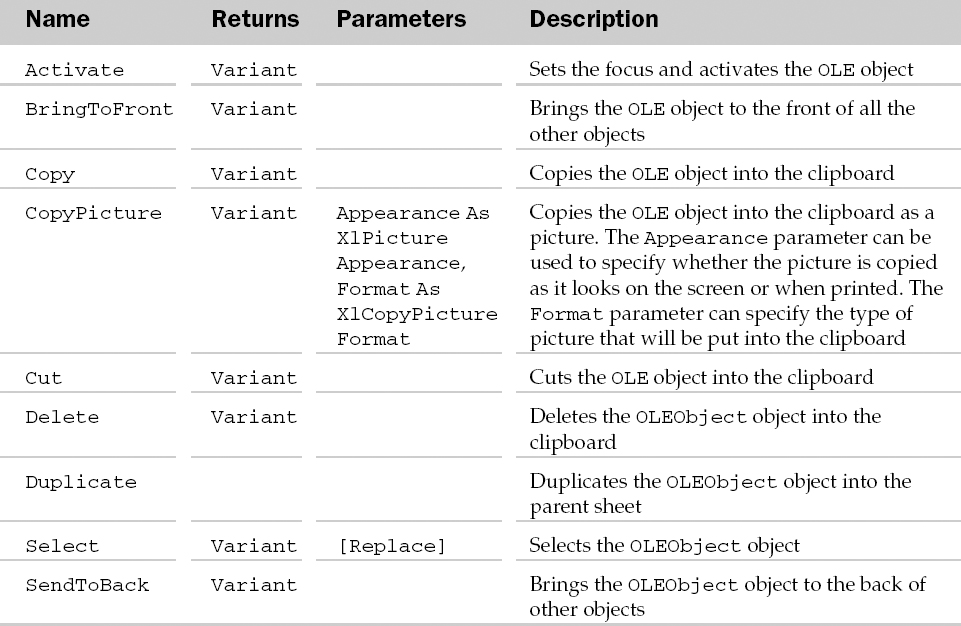
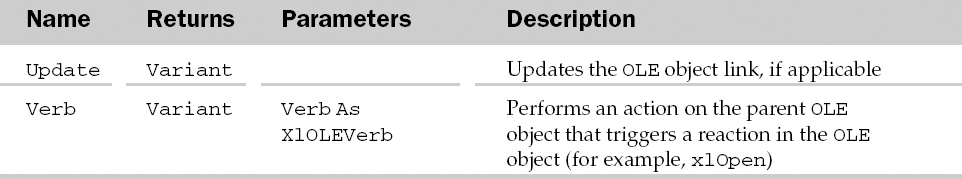
OLEObject Events
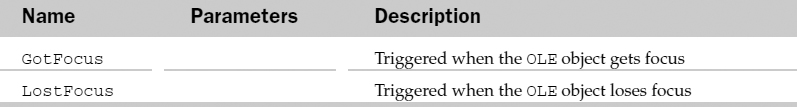
Example: OLEObject Object and the OLEObjects Collection
Sub PrintEmbeddedWordDocuments2()
   Dim oOLE As OLEObject
   'Loop through all the shapes in the sheet
   For Each oOLE In ActiveSheet.OLEObjects
      'Is it a Word document?
      If oOLE.ProgId Like “Word.Document*” Then
         'Yes, so print the Word document.
         oOLE.Object.PrintOut
      End If
   Next
End Sub
Outline Object
The Outline object represents the outline feature in Excel. The parent of the Outline object is the WorkSheet object.
Outline Common Properties
The Application, Creator, and Parent properties are defined at the beginning of this Appendix.
Outline Properties
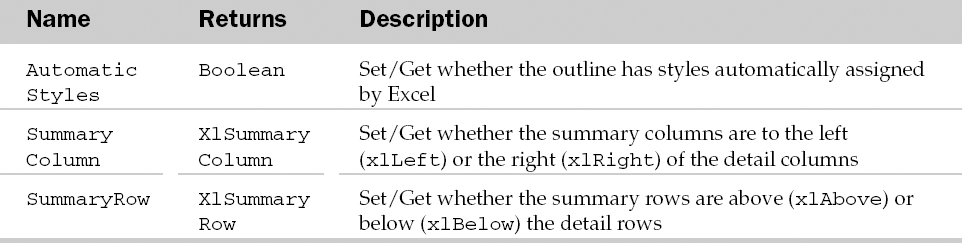
Outline Methods
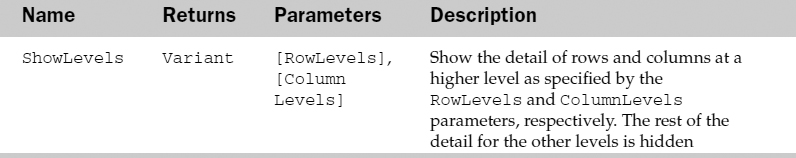
Example: Outline Object
Sub ShowOutlines()
   Dim oOutl As Outline
   'Group some rows
   ActiveSheet.Range(“4:5”).Group
   'Get the Outline object
   Set oOutl = ActiveSheet.Outline
   'Format the outline display
   With oOutl
      .ShowLevels 1
      .SummaryRow = xlSummaryAbove
   End With
End Sub
PageSetup Object
The PageSetup object contains the functionality of the Page Setup dialog box. Possible parents of the PageSetup object are the Chart and Worksheet object.
PageSetup Common Properties
The Application, Creator, and Parent properties are defined at the beginning of this Appendix.
PageSetup Properties
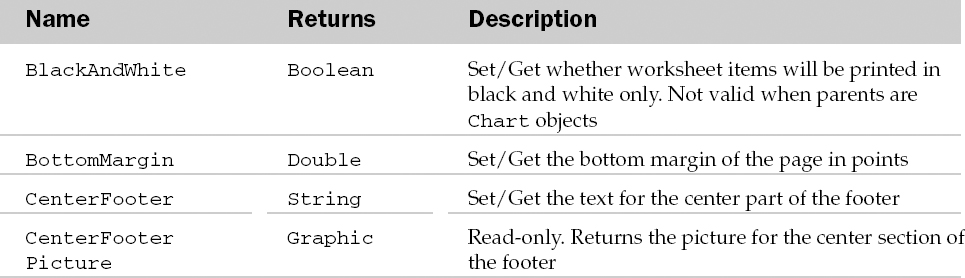
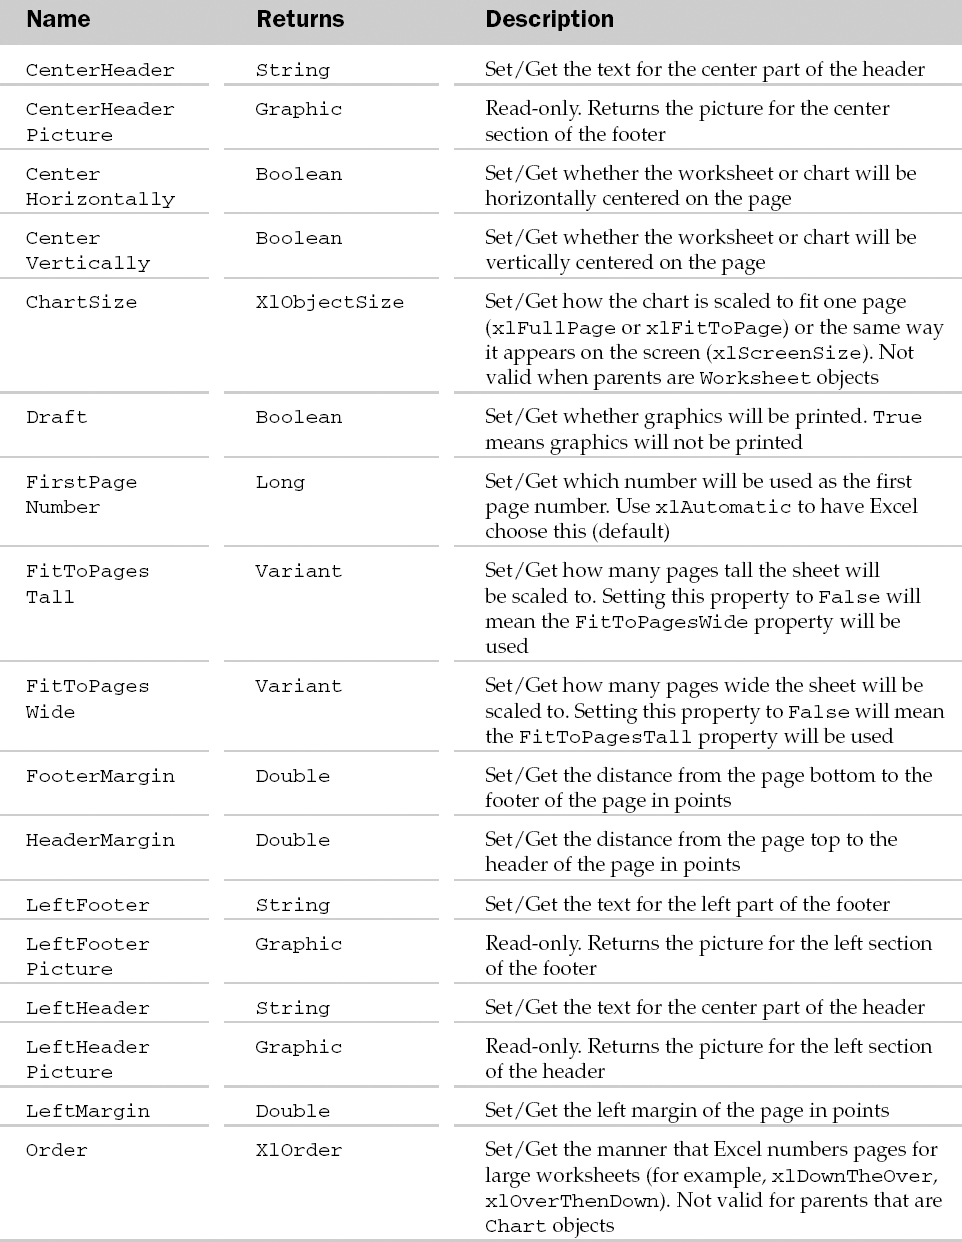
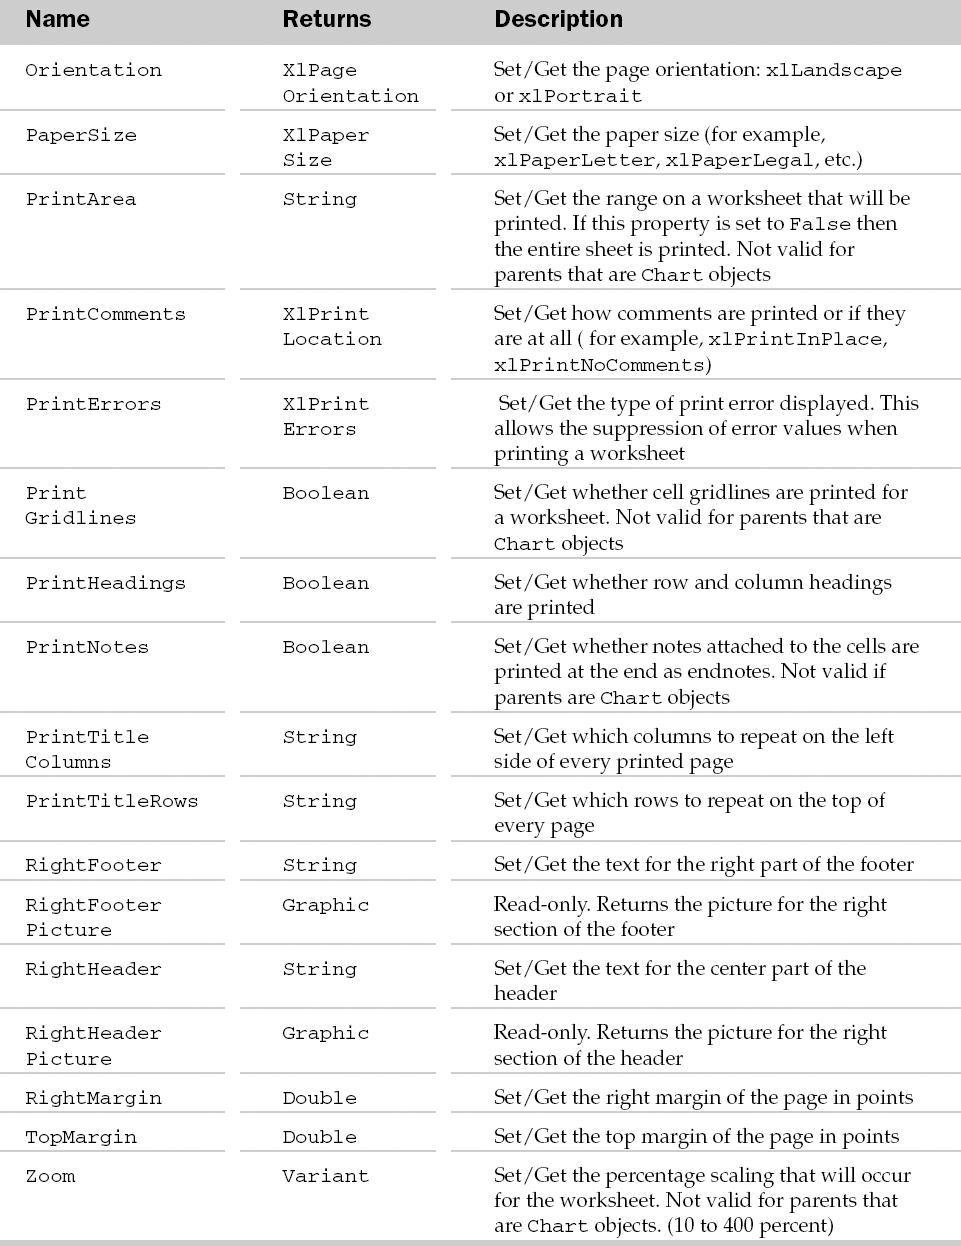
PageSetup Methods
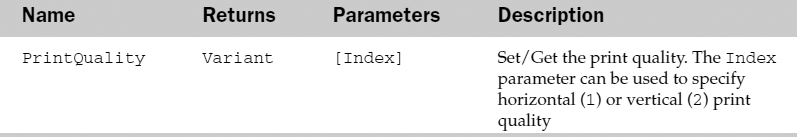
Example: PageSetup Object
Sub SetUpPage()
   Dim oPS As PageSetup
   'Get the sheet's PageSetup object
   Set oPS = ActiveSheet.PageSetup
   'Set up the page
   With oPS
      'Set the paper size to the local default
      .PaperSize = fnLocalPaperSize
      .Orientation = xlPortrait
      'etc.
   End With
End Sub
Function fnLocalPaperSize() As XlPaperSize
   'Remember the paper size when we've read it
   Static iPaperSize As XlPaperSize
   'Is it set?
   If iPaperSize = 0 Then
      'No, so create a new workbook and read off the paper size
      With Workbooks.Add
         iPaperSize = .Worksheets(1).PageSetup.PaperSize
         .Close False
      End With
   End If
   'Return the paper size
   fnLocalPaperSize = iPaperSize
End Function
Pane Object and the Panes Collection
The Panes collection allows manipulation of the different panes of a window. A Pane object is equivalent to the single pane of a window. The parent object of the Panes collection is the Window object.
Besides the typical collection properties and methods, the Panes collection has a Count property. The Count property returns the number of Pane objects in the collection.
Pane Common Properties
The Application, Creator, and Parent properties are defined at the beginning of this Appendix.
Pane Properties
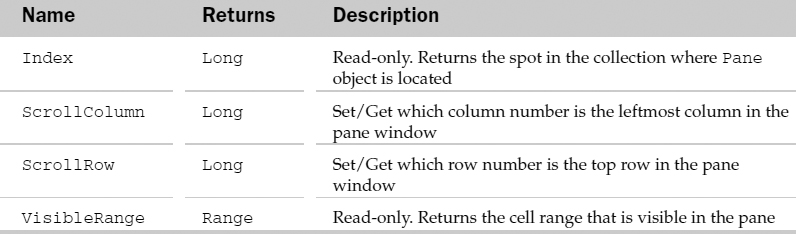
Pane Methods
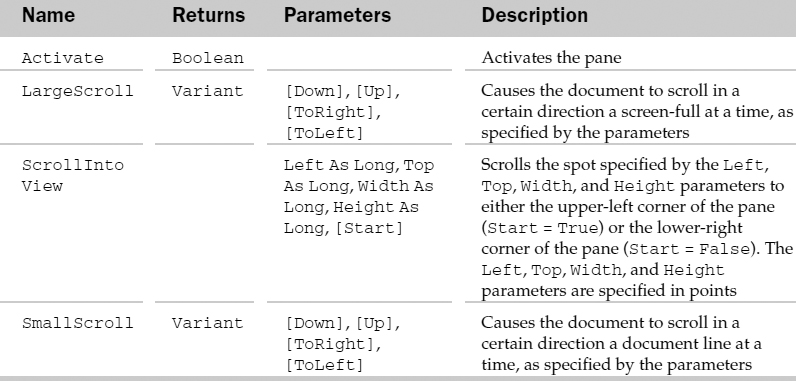
Example: Pane Object and the Panes Collection
Sub ScrollActivePane()
   Dim oPane As Pane
   Dim oRNg As Range
   'The range to show in the pane
   Set oRNg = Range(“G3:J10”)
   'Get the active pane
   Set oPane = Application.ActiveWindow.ActivePane
   'Scroll the pane to show the range in the top-left corner
   oPane.ScrollColumn = oRNg.Column
   oPane.ScrollRow = oRNg.Row
End Sub
Parameter Object and the Parameters Collection
The Parameters collection holds the list of parameters associated with a query table. If no parameters exist then the collection has no Parameter objects inside of it. Each Parameter object represents a single parameter for a query table. The parent of the Parameters collection is the QueryTable object.
The Parameters collection has a few extra properties and methods besides the typical collection attributes. They are listed in the following table.
Parameters Collection Properties and Methods
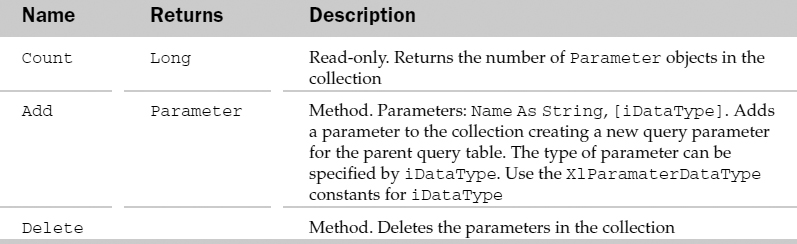
Parameter Common Properties
The Application, Creator, and Parent properties are defined at the beginning of this Appendix.
Parameter Properties
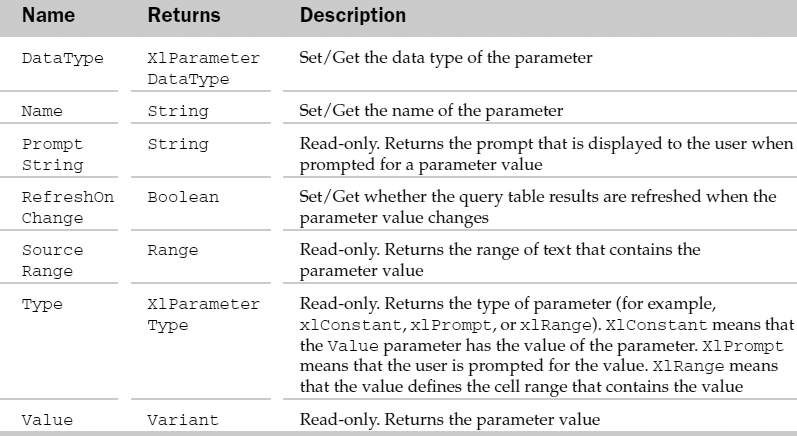
Parameter Methods
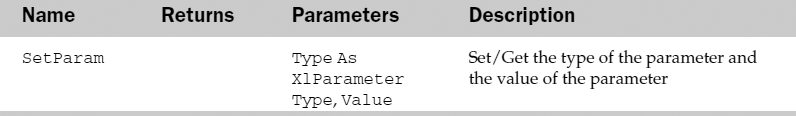
Example: Parameter Object and the Parameters Collection
Sub UpdateQuery()
   Dim oParam As Parameter
   'Using the Query Table…
   With ActiveSheet.QueryTables(1)
      'Get the first parameter
      Set oParam = .Parameters(1)

      'Set its value
      oParam.SetParam xlConstant, “Company”

      'Refresh the query
      .Refresh
   End With
End Sub
Phonetic Object and the Phonetics Collection
The Phonetics collection holds all of the phonetic text in a range. The Phonetic object represents a single phonetic text string. The parent of the Phonetics object is the Range object.
The Phonetics collection has a few properties and methods besides the typical collection attributes. They are listed in the following table.
Phonetics Collection Properties and Methods
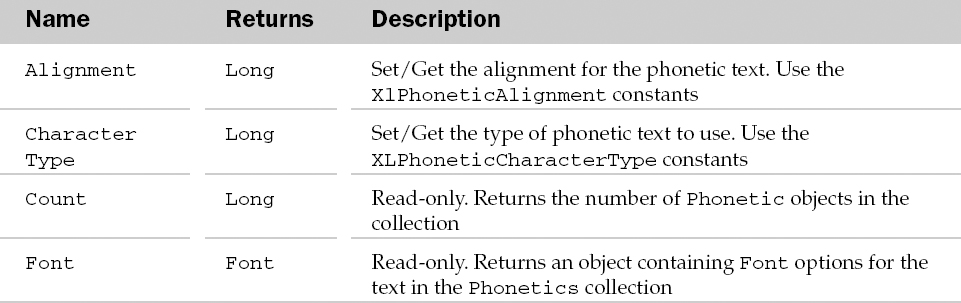
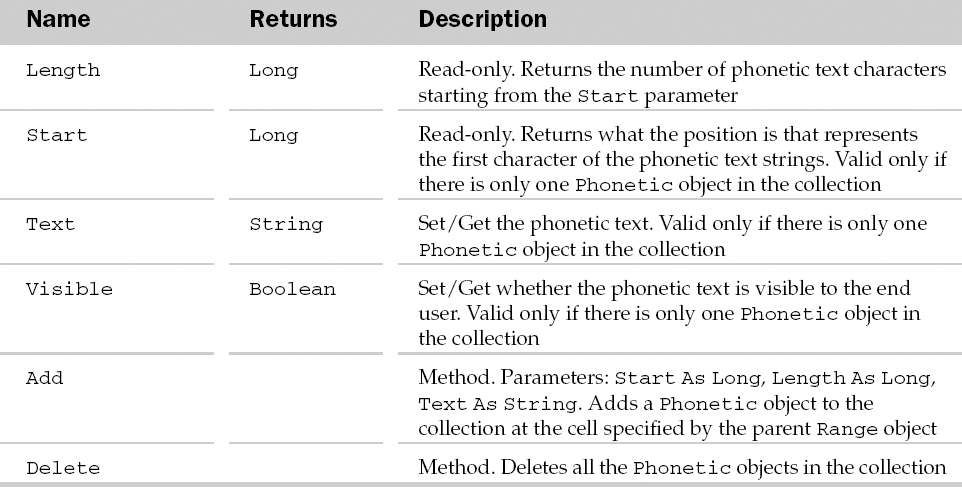
Phonetic Common Properties
The Application, Creator, and Parent properties are defined at the beginning of this Appendix.
Phonetic Properties
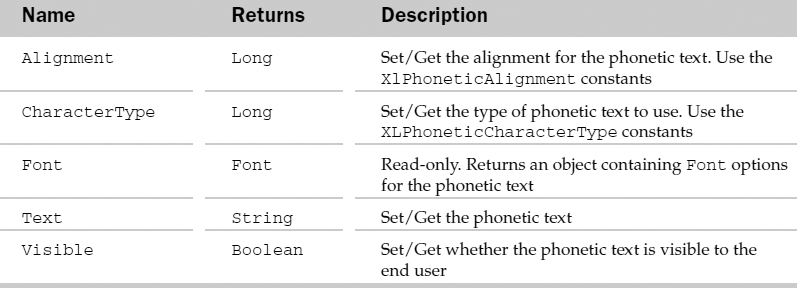
PictureFormat Object
The PictureFormat object allows manipulation of the picture properties of the parent Shape object.
PictureFormat Common Properties
The Application, Creator, and Parent properties are defined at the beginning of this Appendix.
PictureFormat Properties
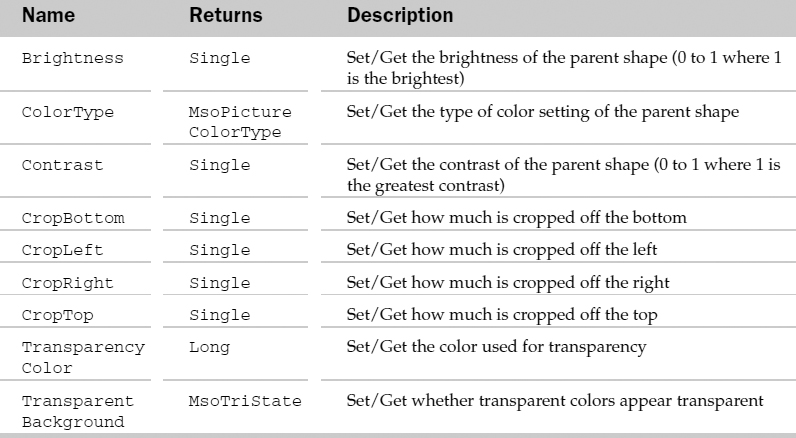
PictureFormat Methods
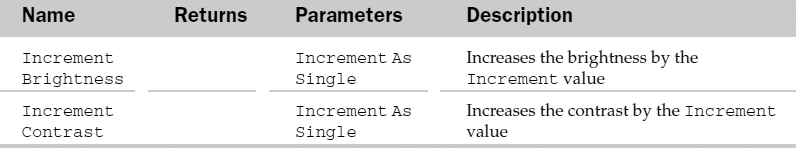
Example: PictureFormat Object
Sub SetPictureFormat()
   Dim oShp As Shape
   Dim oPF As PictureFormat
   For Each oShp In ActiveSheet.Shapes
      If oShp.Type = msoPicture Then

         'Get the PictureFormat
         Set oPF = oShp.PictureFormat

         'Format the picture
         With oPF
            .TransparentBackground = msoTrue
            .TransparencyColor = RGB(255, 0, 0)
            .ColorType = msoPictureWatermark
         End With
      End If
   Next
End Sub
PivotCache Object and the PivotCaches Collection
The PivotCaches collection holds the collection of memory “caches” holding the data associated with a PivotTable report. Each PivotCache object represents a single memory cache for a PivotTable report. The parent of the PivotCaches collection is the Workbook object. Also a possible parent of the PivotCache object is the PivotTable object.
The PivotCaches has a Count property and Add method besides the typical collection attributes. The Count property returns the number of items in the collection. The Add method takes a SourceType constant (from the XlPivotTableSourceType constants) and SourceData to add a PivotCache to the collection.
PivotCache Common Properties
The Application, Creator, and Parent properties are defined at the beginning of this Appendix.
PivotCache Properties
PivotCache Methods
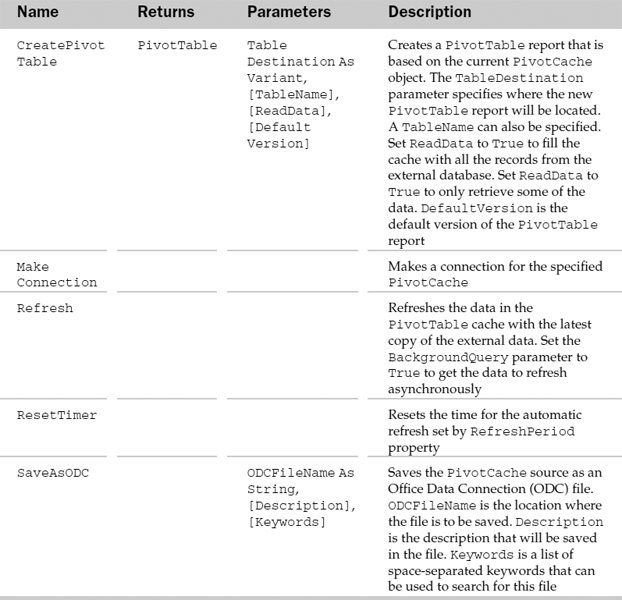
Example: PivotCache Object and the PivotCaches Collection
Sub RefreshPivotCache()
   Dim oPC As PivotCache
   Set oPC = ActiveWorkbook.PivotCaches(1)
   With oPC
      'Refresh in the foreground
      .BackgroundQuery = False

      'Only refresh if the data is over 1 hour old
      If .RefreshDate < Now - TimeValue(“01:00:00”) Then
         .Refresh
      End If
   End With
End Sub
PivotCell Object
Represents a cell somewhere inside a PivotTable. Use access the PivotCell object through the range object. Once obtained, you can use the various properties of the PivotCell object to retrieve data from a PivotTable. For example, you can use the PivotCellType, ColumnItems, and RowItems properties to locate a particular sales person's total sales for a specific region.
This object mirrors the functionality of the GETPIVOTDATA worksheet function and the GetPivotData method of the PivotTable object. The difference is the PivotCell object can render information about where the cell is in the report. The GETPIVOTDATA worksheet function and the GetPivotData method do just the opposite. They yield the value associated with row and column heading you provide.
PivotCell Common Properties
The Application, Creator, and Parent properties are defined at the beginning of this Appendix.
PivotCell Properties

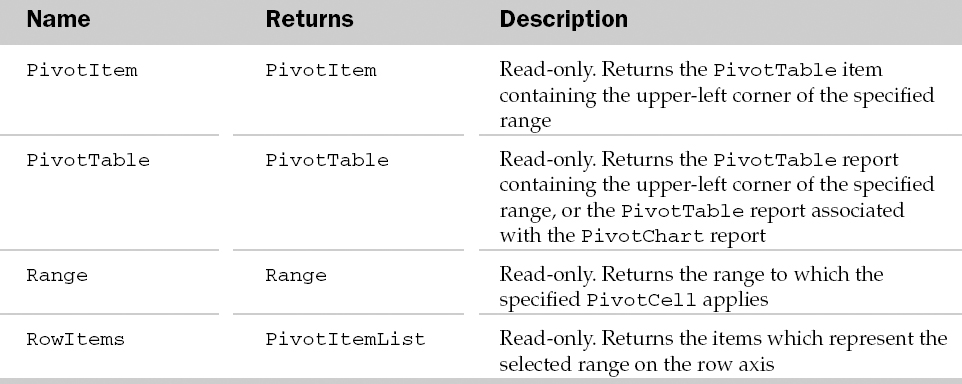
PivotField Object, PivotFields Collection and the CalculatedFields Collection
The PivotFields collection holds the collection of fields associated with the parent PivotTable report. The CalculatedFields collection holds the collection of calculated fields associated with the parent PivotTable report. Each PivotField object represents single field in a PivotTable report. The parent of the PivotFields and CalculatedFields collection is the PivotTable object.
The PivotFields and CalculatedFields collections have one extra property besides the typical collection attributes. The Count property returns the number of fields in the parent collection. The CalculatedFields collection also has an Add method that adds a new calculated field to the collection given a Name and a Formula.
PivotField Common Properties
The Application, Creator, and Parent properties are defined at the beginning of this Appendix.
PivotField Properties
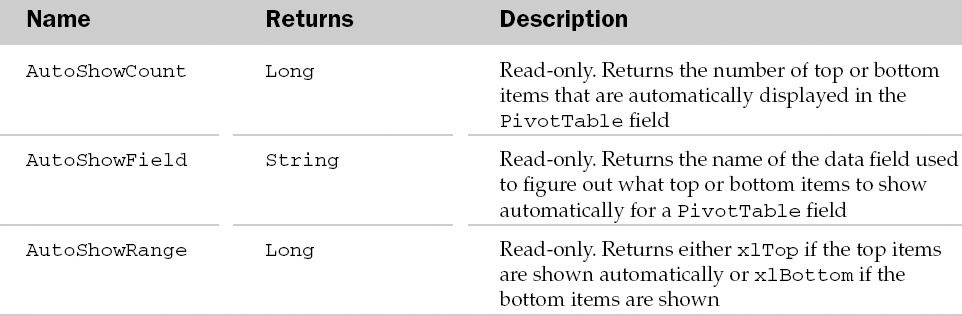
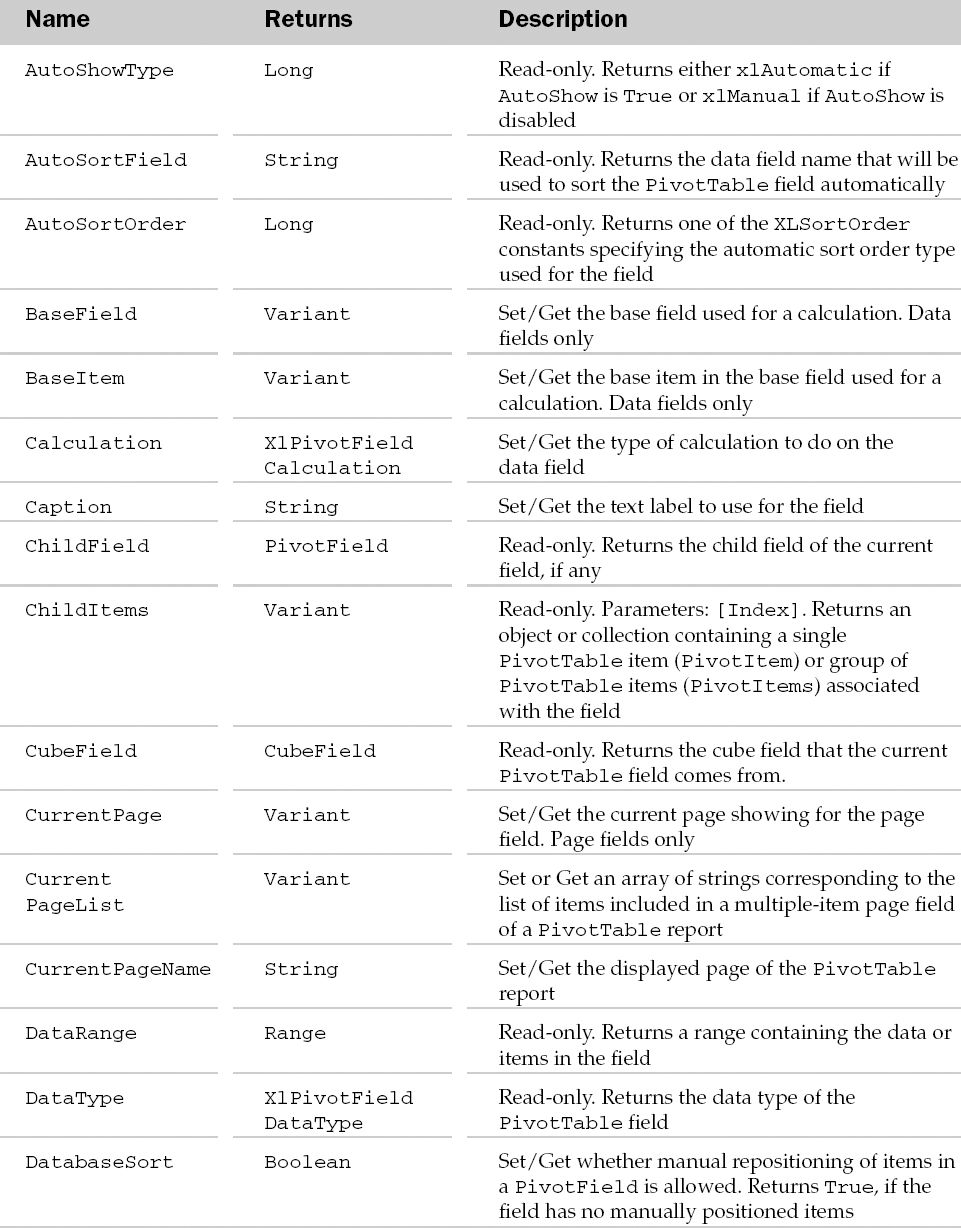
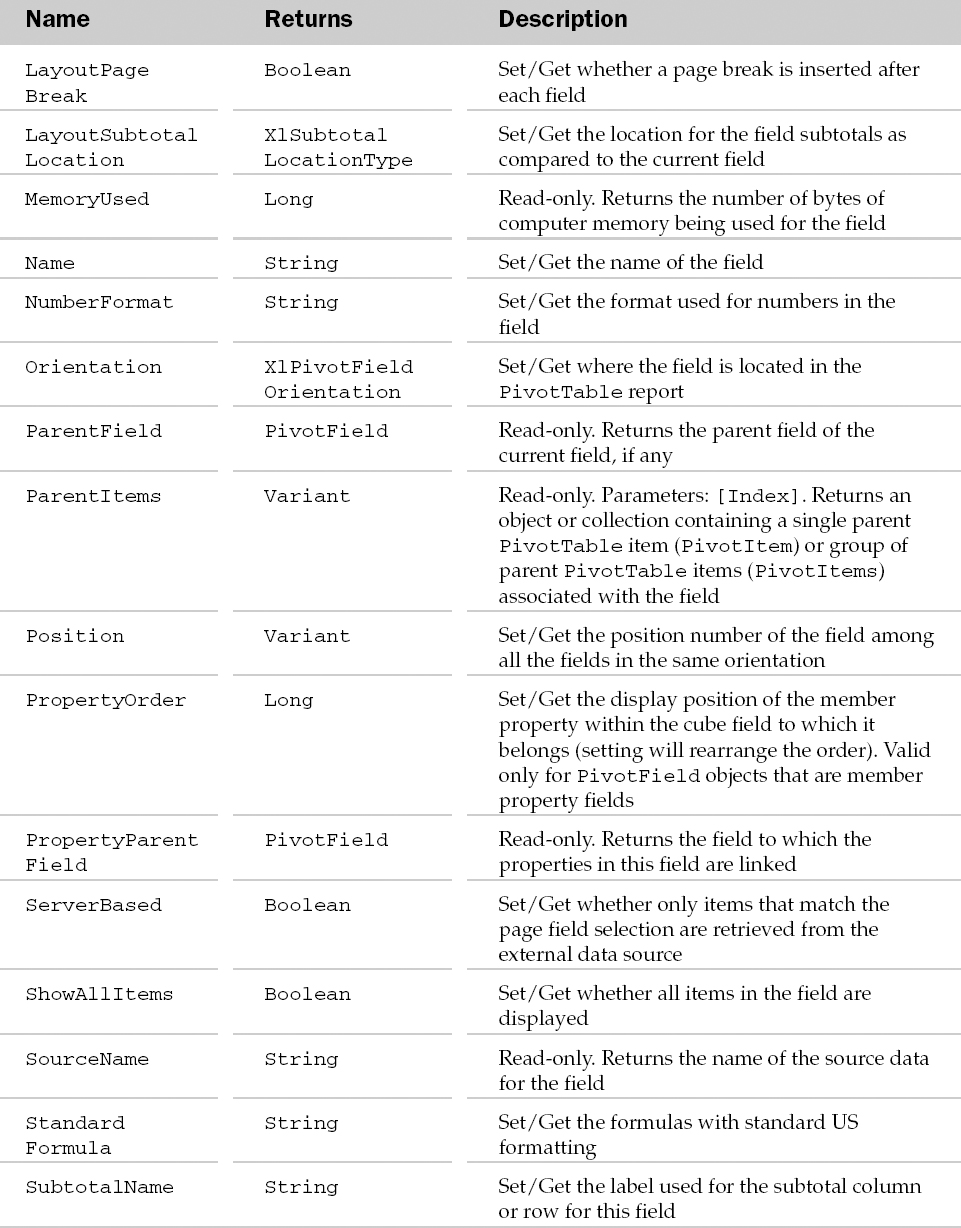
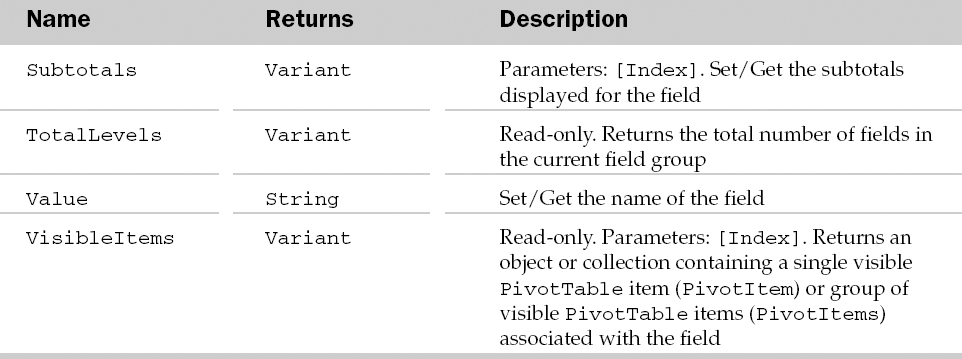
PivotField Methods
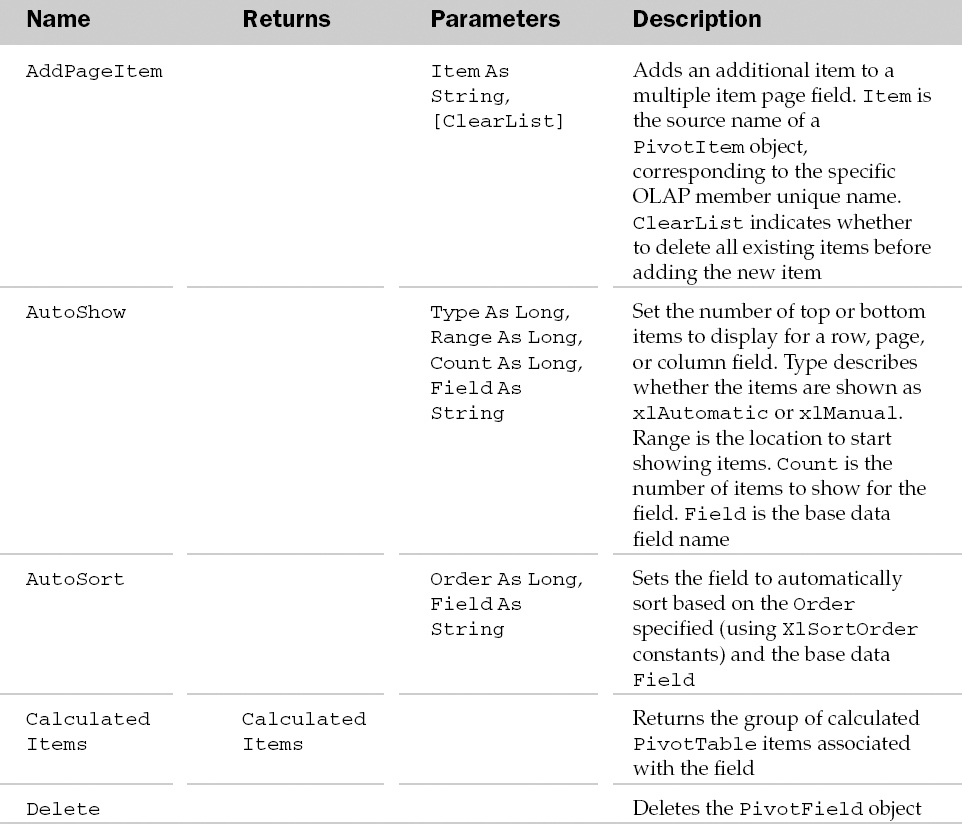
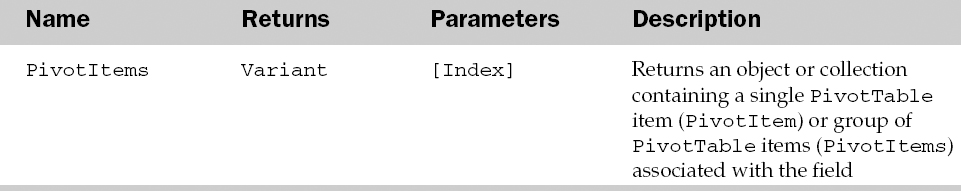
Example: PivotField Object, PivotFields Collection and the CalculatedFields
Sub AddField()
   Dim oPT As PivotTable
   Dim oPF As PivotField
   Set oPT = ActiveSheet.PivotTables(1)
   'Set the UseStandardFormula argument to true
   'This will format the field names in the formula for
   ' Standard U.S.English instead of using Local    Settings
   'Note that running/debugging this workbook in    versions of Excel
   ' prior to Excel 2003 will result in a “Wrong    number of arguments” error.
   Set oPF = oPT.CalculatedFields.Add(“Total”, “=Price * Volume”, True)
   oPF.Orientation = xlDataField
End Sub
PivotFormula Object and the PivotFormulas Collection
The PivotFormulas collection holds the formulas associated with the PivotTable. Each PivotFormula object represents a formula being used in a PivotTable report. The parent of the PivotFormulas collection is the PivotTable object.
The PivotFormulas collection has a Count property and an Add method besides the typical collection attributes. The Count property returns the number of items in the collection. The Add method takes a Formula string and adds a PivotFormula to the collection.
PivotFormula Common Properties
The Application, Creator, and Parent properties are defined at the beginning of this Appendix.
PivotFormula Properties
PivotFormula Methods
PivotItem Object, PivotItems Collection, and the CalculatedItems Collection
The PivotItems collection holds the collection of individual data entries in a field. The CalculatedItems collection holds the collection of individual calculated entries in a field. Each PivotItem object represents a single entry in a data field. The parent of the PivotItems and CalculatedItems collections is the PivotField object.
The PivotItems and CalculatedItems have one extra property besides the typical collection attributes. The Count property returns the number of objects in the collection. Also, the Add method of the PivotItems collection adds another item to the collection (only a Name is required). The Add method of the CalculatedItems collection adds another item to the collection but requires a Name and a Formula to be specified.
PivotItem Common Properties
The Application, Creator, and Parent properties are defined at the beginning of this Appendix.
PivotItem Properties

PivotItem Methods
Example: PivotItem Object, PivotItems Collection, and the CalculatedItems Collection
Sub ShowPivotItemData()
   Dim oPT As PivotTable
   Dim oPI As PivotItem
   'Get the pivot table
   Set oPT = ActiveSheet.PivotTables(1)
   'Get the pivot item
   Set oPI = oPT.PivotFields(“Product”).PivotItems(“Oranges”)
   'Show all the source data rows for that pivot item
   oPI.ShowDetail = True
End Sub
PivotItemList Object
Represents a list of PivotItems associated with a particular cell in a PivotTable. You access the list through the PivotCell object. PivotItemLists are accessed either through the ColumnItems or RowItems properties of the PivotCell object. How many row and column items in the PivotItemList depends on the structure of the PivotTable.
For example, cell D5 is in a PivotTable called WroxSales1. In the row area to the left of cell D5 is the row heading OR (Oregon). To the left of OR is another row label called Region1. Based on this information the following will yield 2:
MsgBox wksPivotTable.Range(“D5”).PivotCell.RowItems.Count
The following will yield Region1, the farthest label to the left of cell D5:
MsgBox wksPivotTable.Range(“D5”).PivotCell.RowItems(1)
Finally, the following will yield OR, the second farthest label to the left of cell D5:
MsgBox wksPivotTable.Range(“D5”).PivotCell.RowItems(2)
We have yet to find a use for both the PivotItemList and PivotCell objects. Normally, we are looking for the opposite. We want to retrieve information based on row or column items (headings) we provide, something the GetPivotData method and the GETPIVOTDATA worksheet function can obtain.
PivotItemList Common Properties
The Application, Creator, and Parent properties are defined at the beginning of this appendix.
PivotItemList Properties

PivotItemList Methods
PivotLayout Object
The PivotLayout object describes how the fields of a PivotChart are placed in the parent chart. Either the Chart object or the ChartGroup object is the parent of the PivotChart object.
PivotLayout Common Properties
The Application, Creator, and Parent properties are defined at the beginning of this Appendix.
PivotLayout Properties
PivotLayout Methods
Example: PivotLayout Object
Sub SetPivotLayout()
   Dim oPL As PivotLayout
   'Get the pivot layout
   Set oPL = Charts(1).PivotLayout
   'Show sales of Oranges by region
   With oPL
      .AddFields RowFields:=“Region”, PageFields:=“Product”
      .PageFields(“Product”).CurrentPage = “Oranges”
   End With
End Sub
PivotTable Object and the PivotTables Collection
The PivotTables collection contains the collection of PivotTables in the parent worksheet. Each PivotTable object in the collection allows manipulation and creation of Excel PivotTables. The parent of the PivotTables collection is the Worksheet object.
The PivotTables collection has a Count property and an Add method besides the typical collection attributes. The Count property returns the number of PivotTable objects in the collection. The Add method takes a new PivotTable cache (containing the data) and the destination single cell range determining the upper-left corner of the PivotTable report to create a new PivotTable report. The name of the new PivotTable report can also be specified in the Add method.
PivotTable Common Properties
The Application, Creator, and Parent properties are defined at the beginning of this Appendix.
PivotTable Properties
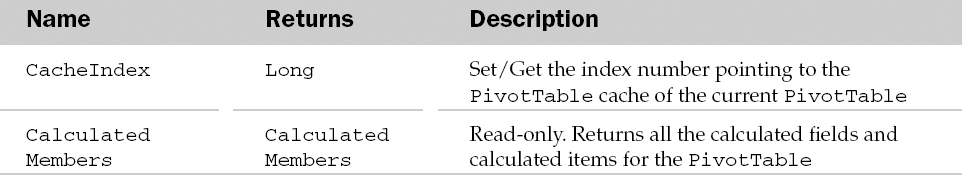
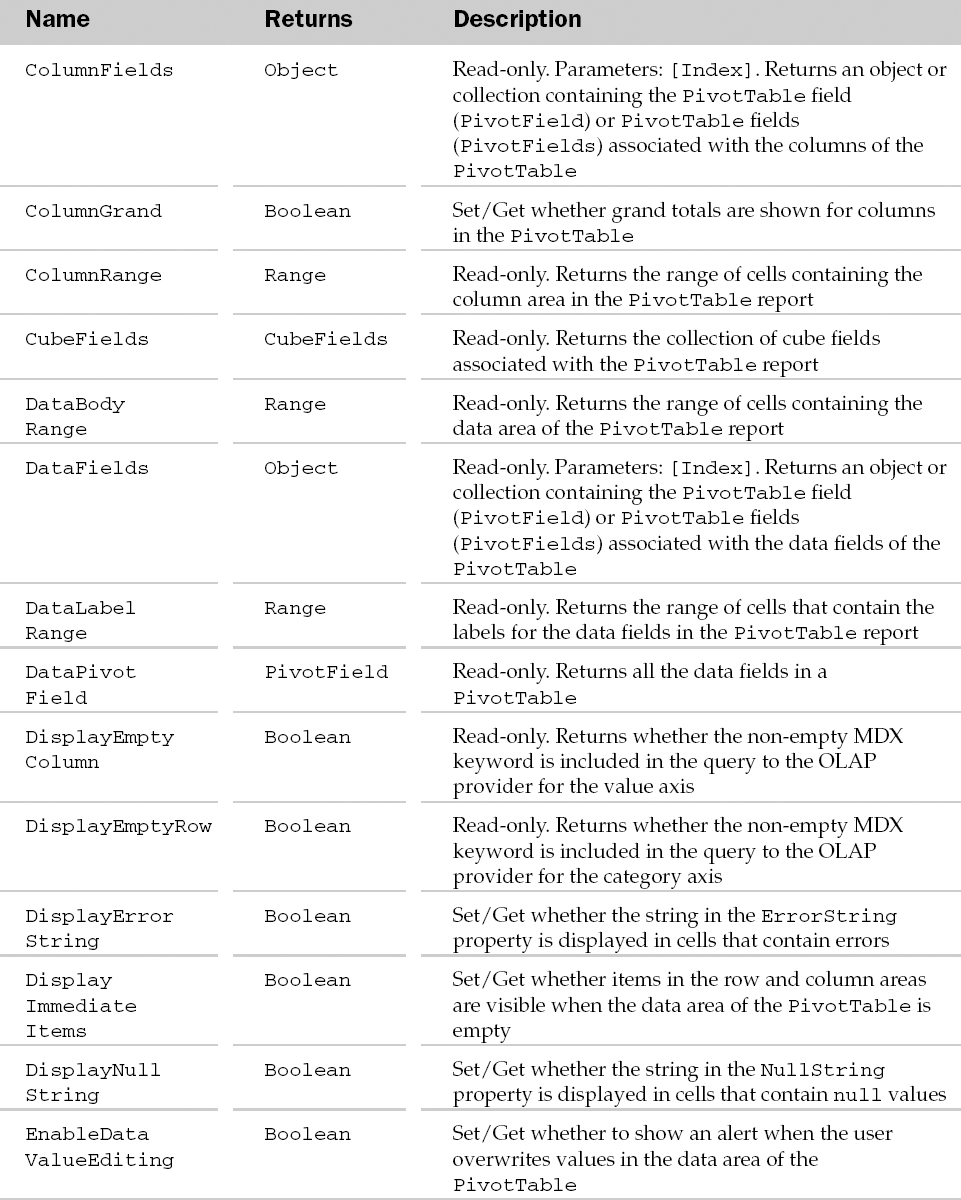
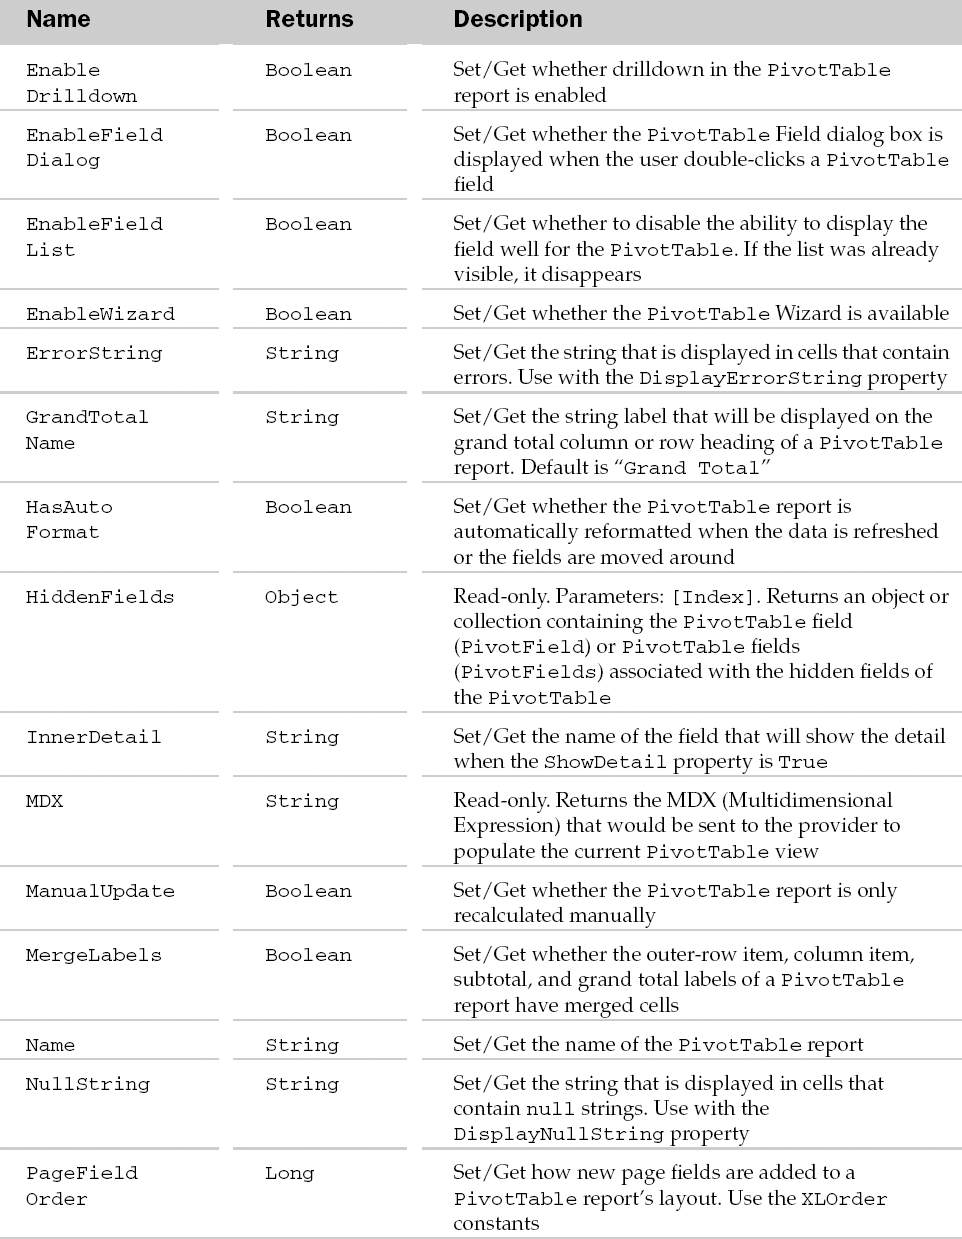
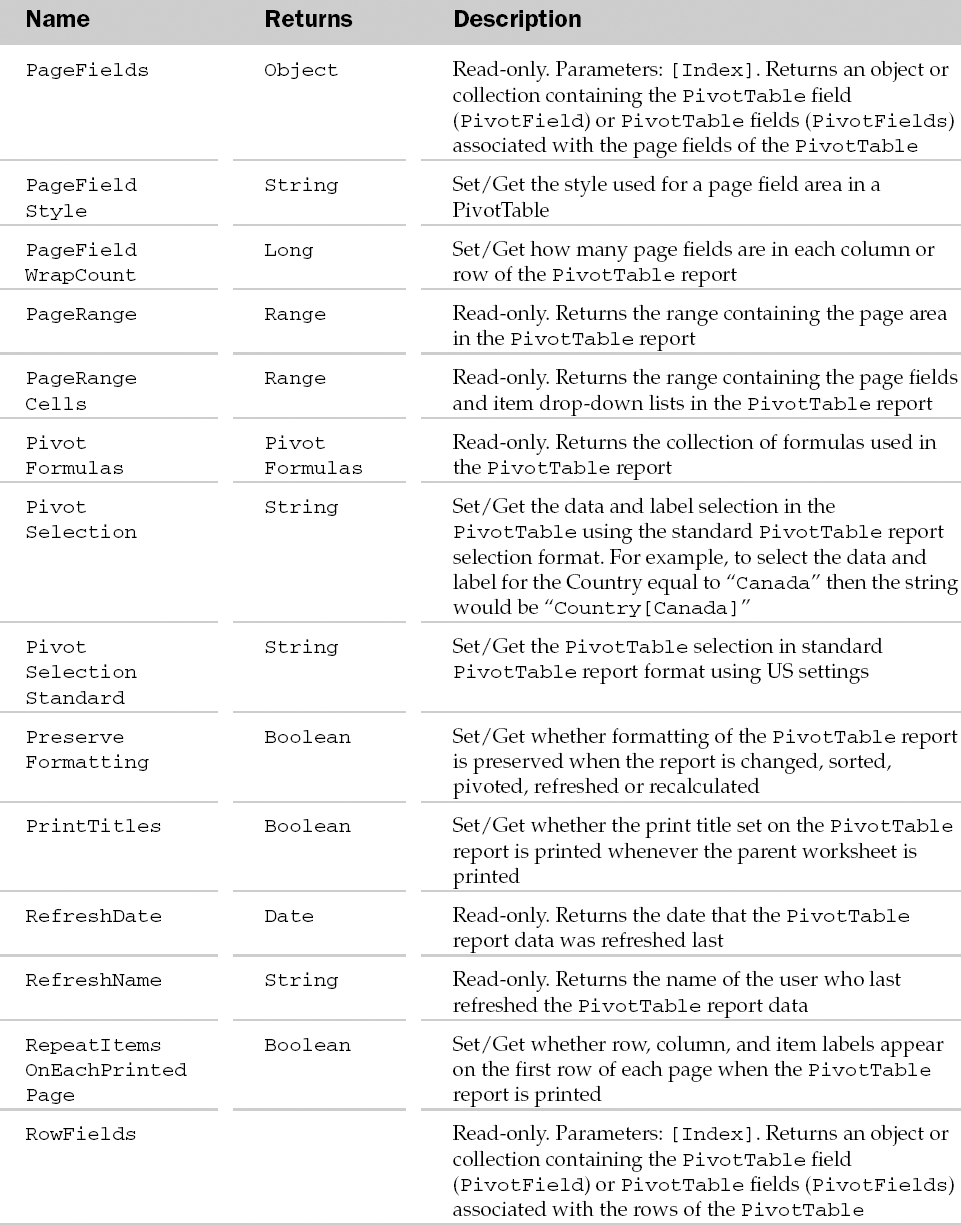
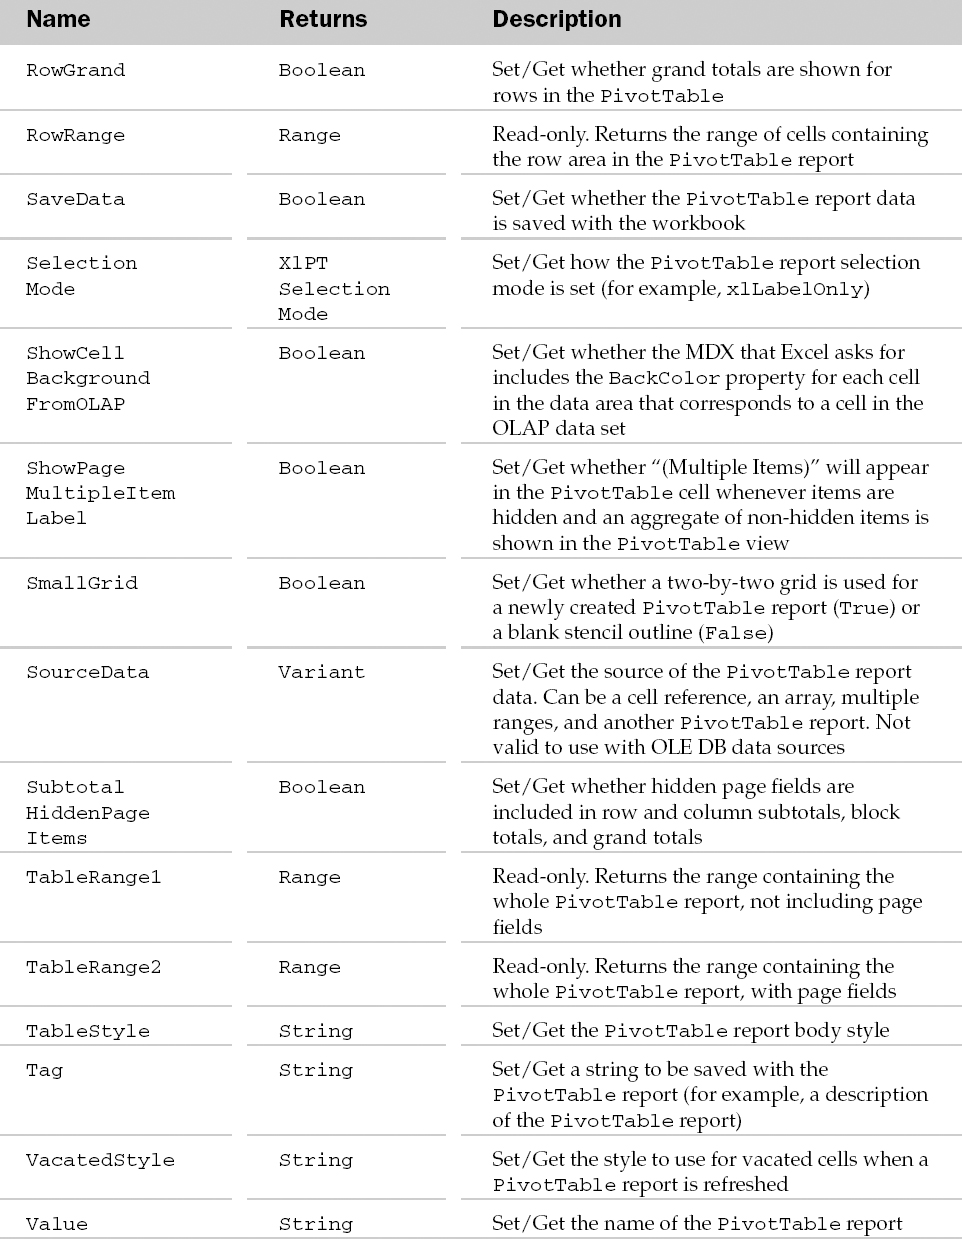
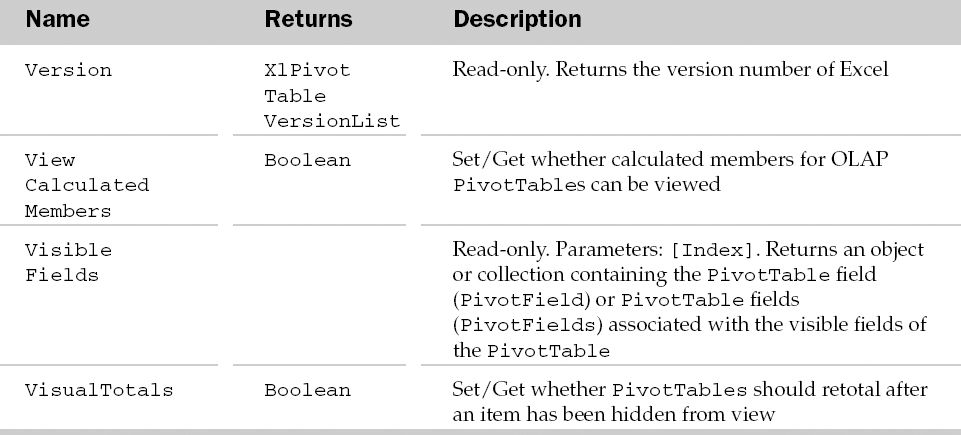
PivotTable Methods
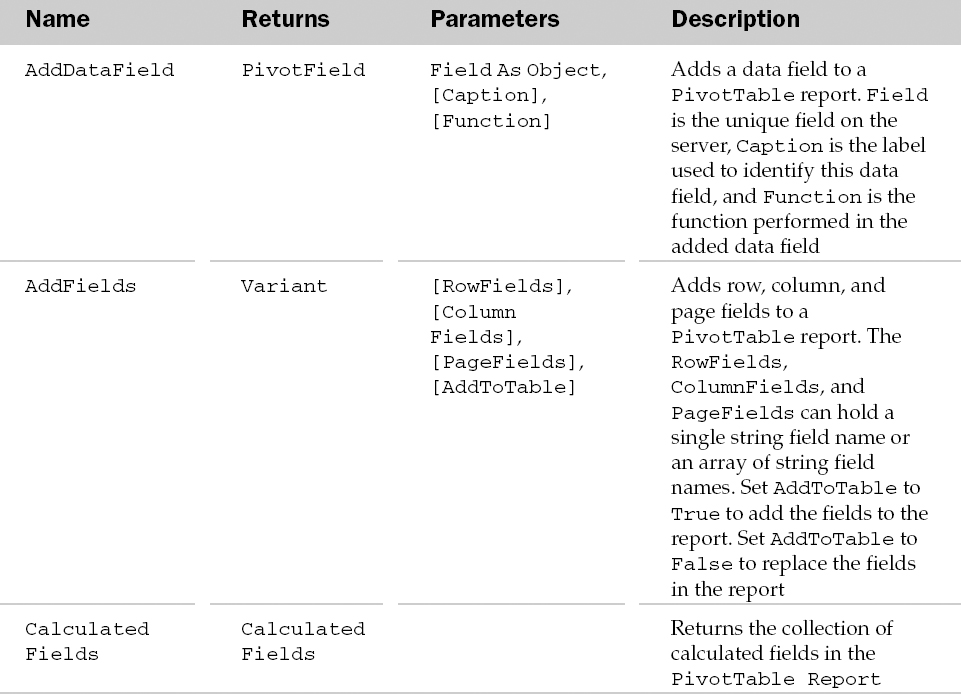
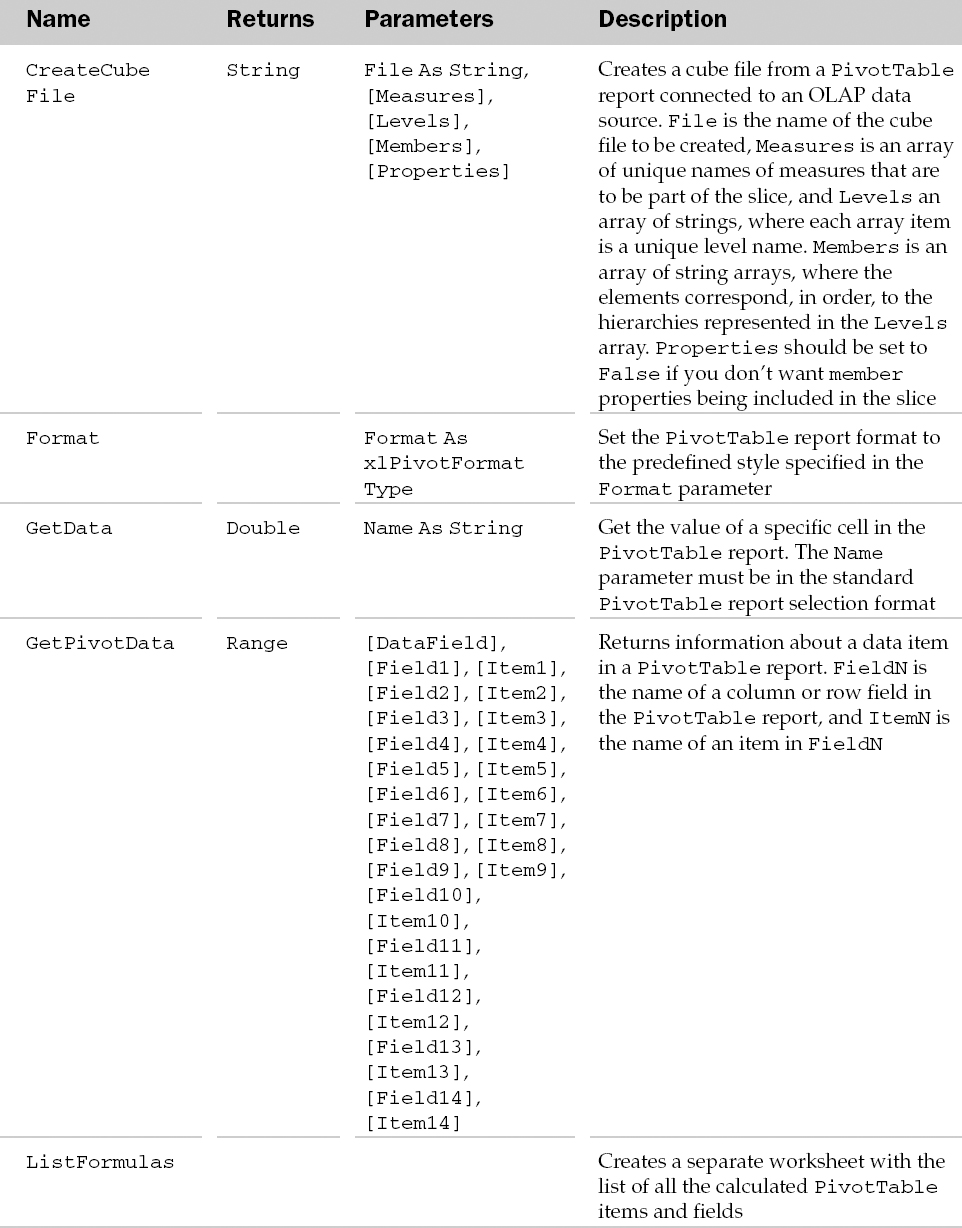
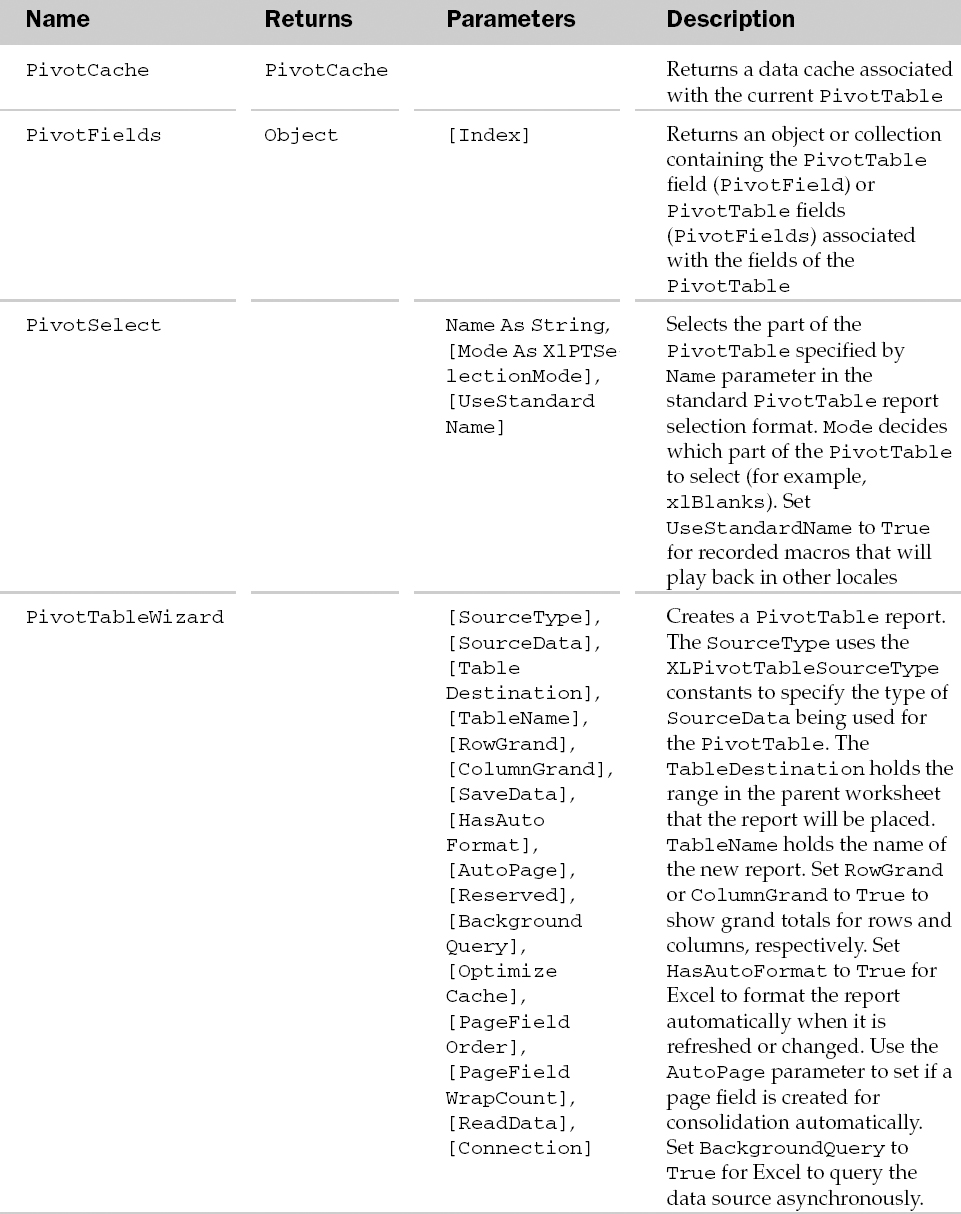
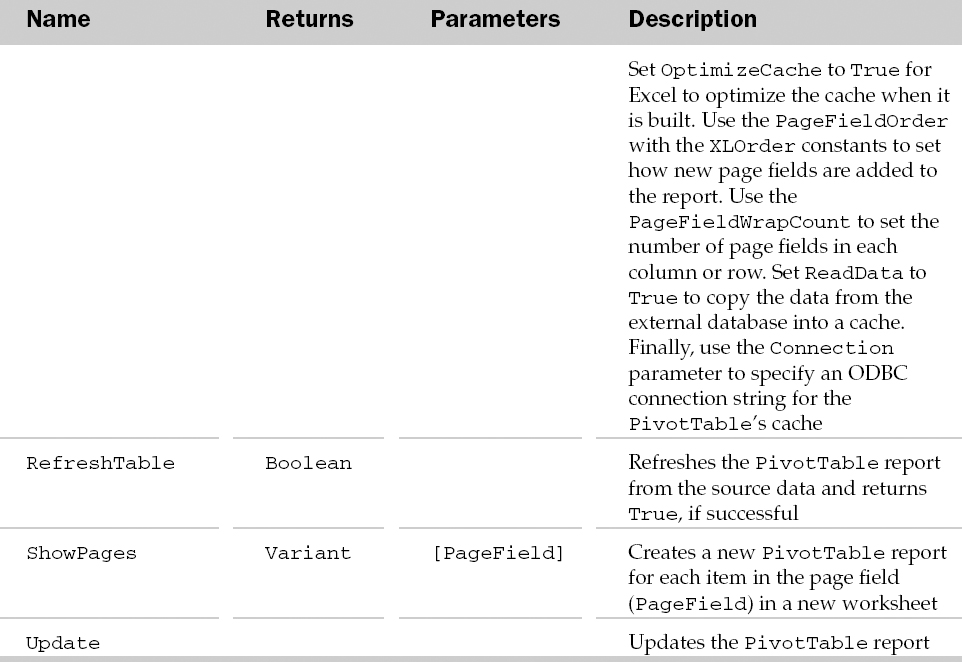
Example: PivotTable Object and the PivotTables Collection
Sub PreviewPivotTable()
   Dim oPT As PivotTable
   'Get the pivot layout
   Set oPT = ActiveSheet.PivotTables(1)
   'Add column and row titles, then printpreview the table
   With oPT
      .ColumnGrand = False
      .RowGrand = True
      .TableRange2.PrintPreview
   End With
End Sub
PlotArea Object
The PlotArea object contains the formatting options associated with the plot area of the parent chart. For 2D charts the PlotArea includes trendlines, data markers, gridlines, data labels, and the axis labels—but not titles. For 3D charts the PlotArea includes the walls, floor, axes, axis titles, tick-marks, and all of the items mentioned for the 2D charts. The area surrounding the plot area is the chart area. Please see the ChartArea object for formatting related to the chart area. The parent of the PlotArea is always the Chart object.
PlotArea Common Properties
The Application, Creator, and Parent properties are defined at the beginning of this Appendix.
PlotArea Properties
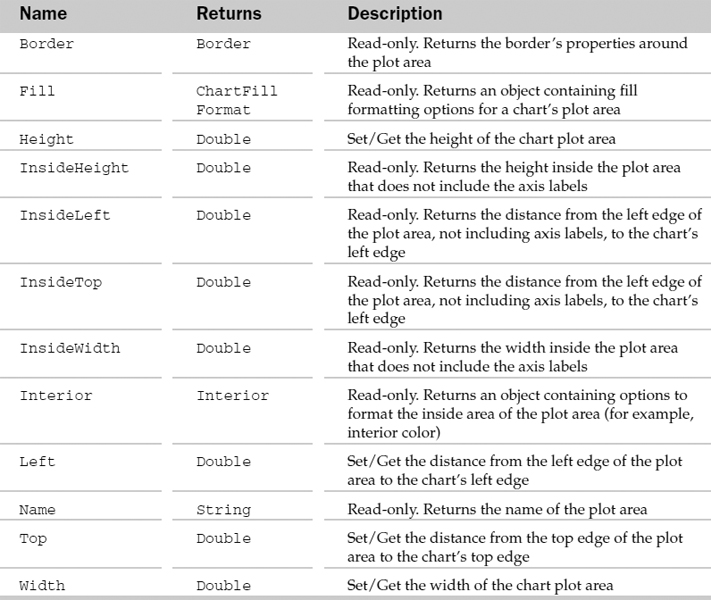
PlotArea Methods
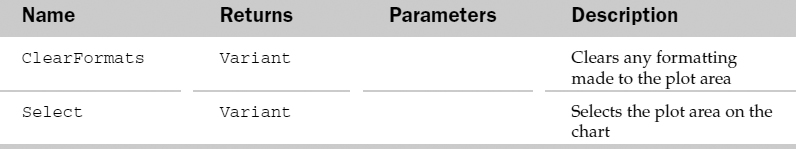
Example: PlotArea Object
This example uses the PlotArea object to make all the charts in the workbook have the same size and position plot area, regardless of the formatting of the axes (for example, different fonts and number scales):
Sub MakeChartAreasSameSizeAsFirst()
   Dim oCht As Chart, oPA As PlotArea
   Dim dWidth As Double, dHeight As Double
   Dim dTop As Double, dLeft As Double
   'Get the dimensions of the inside of the
   'plot area of the first chart
   With Charts(1).PlotArea
      dWidth = .InsideWidth
      dHeight = .InsideHeight
      dLeft = .InsideLeft
      dTop = .InsideTop
   End With
   'Loop through the charts in the workbook
   For Each oCht In Charts
      'Get the PlotArea
      Set oPA = oCht.PlotArea

      'Size and move the plot area
      With oPA
         If .InsideWidth > dWidth Then
            'Too big, make it smaller
            .Width = .Width - (.InsideWidth - dWidth)
         Else
            'Too small, move it left and make bigger
            .Left = .Left - (dWidth - .InsideWidth)
            .Width = .Width + (dWidth - .InsideWidth)
         End If

         If .InsideHeight > dHeight Then
            'Too big, make it smaller
            .Height = .Height - (.InsideHeight - dHeight)
         Else
            'Too small, move it left and make bigger
            .Top = .Top - (dHeight - .InsideHeight)
            .Height = .Height + (dHeight - .InsideHeight)
         End If
         'Set the position of the inside of the plot area
         .Left = .Left + (dLeft - .InsideLeft)
         .Top = .Top + (dTop - .InsideTop)
      End With
   Next
End Sub
Point Object and the Points Collection
The Points collection holds all of the data points of a particular series of a chart. In fact, a chart (Chart object) can have many chart groups (ChartGroups / ChartGroup) that can contain many series (SeriesCollection / Series), which, in turn, can contain many points (Points / Point). A Point object describes the particular point of a series on a chart. The parent of the Points collection is the Series object.
The Points collection contains a Count property besides the typical collection attributes. The Count property returns the number of Point objects in the collection.
Point Common Properties
The Application, Creator, and Parent properties are defined at the beginning of this Appendix.
Point Properties
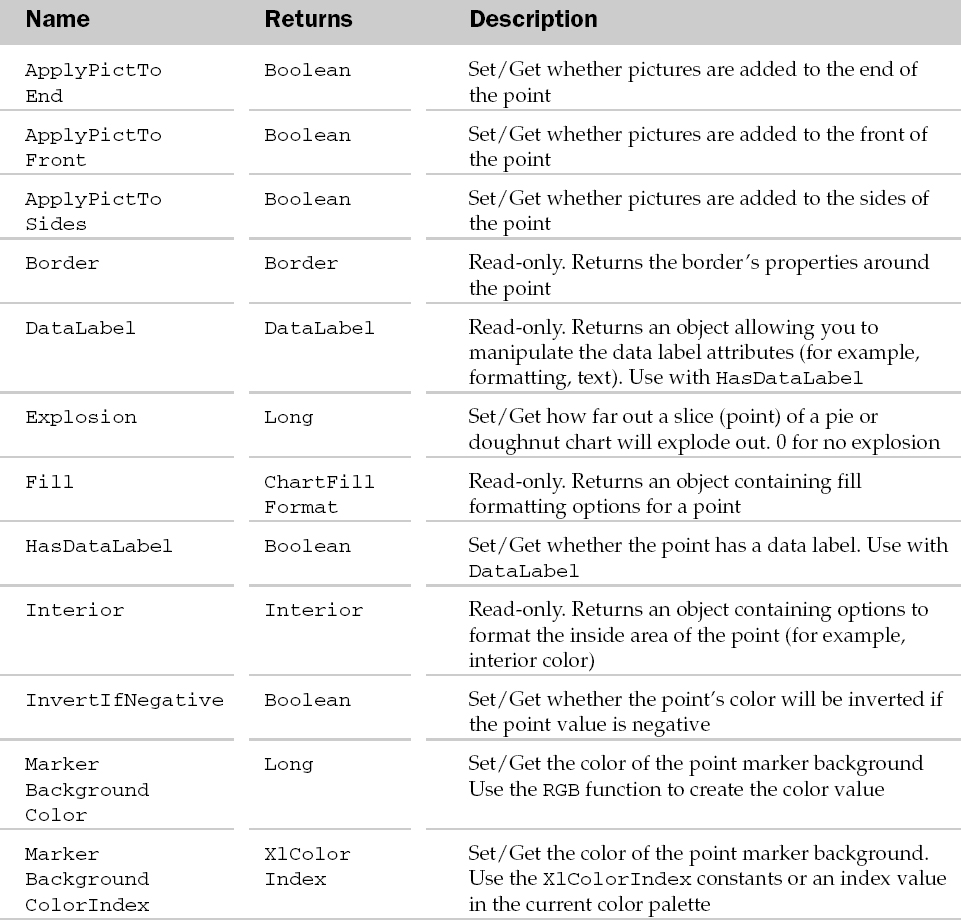
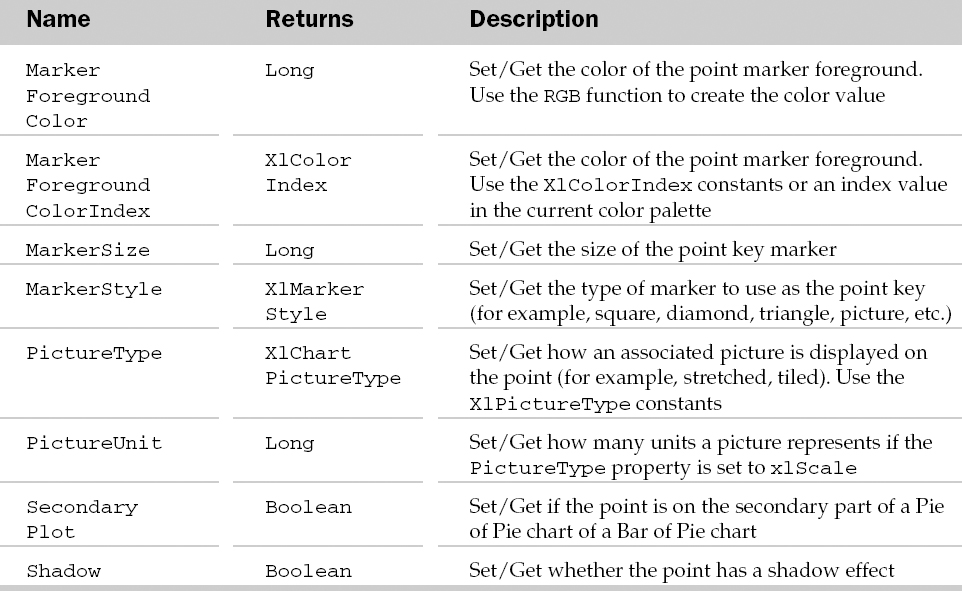
Point Methods
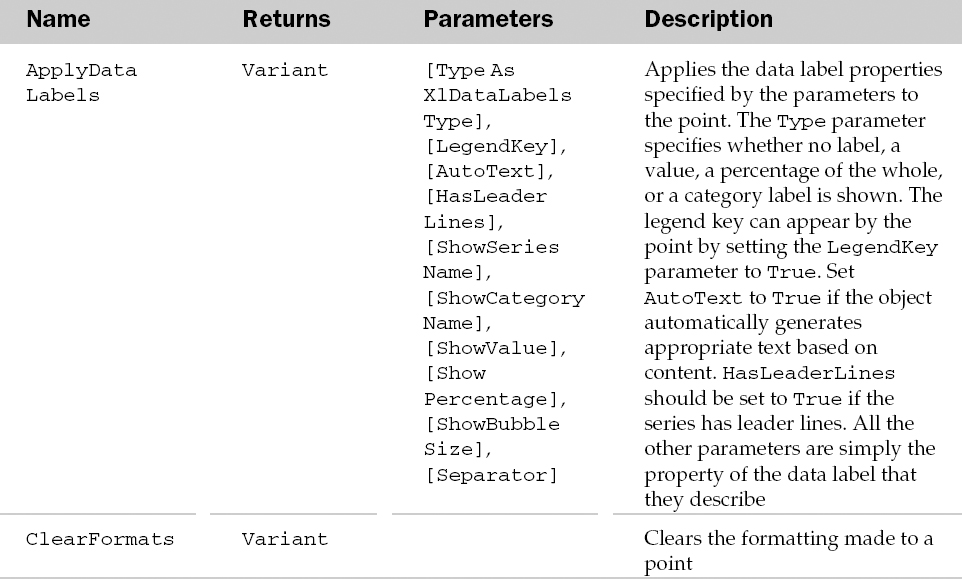
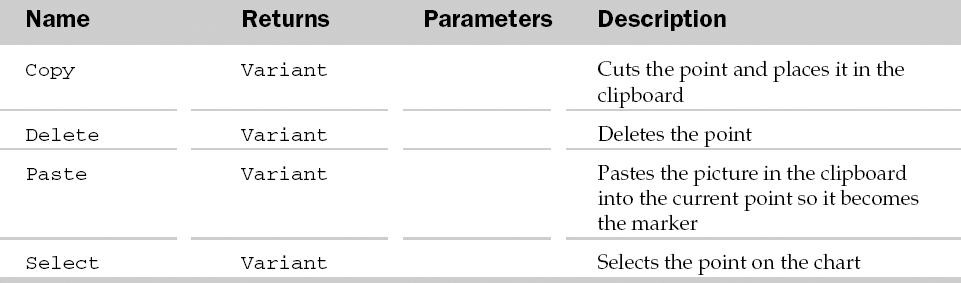
Example: Point Object and the Points Collection
Sub ExplodePie()
   Dim oPt As Point
   'Get the first data point in the pie chart
   Set oPt = Charts(1).SeriesCollection(1).Points(1)
   'Add a label to the first point only and
   'set it away from the pie
   With oPt
      .ApplyDataLabels xlDataLabelsShowLabelAndPercent
      .Explosion = 20
   End With
End Sub
Protection Object
Represents the group of the much-needed sheet protection options new to Excel 2003. When you protect a sheet, you now have the option to only allow unlocked cells selected, allow cell, column, and row formatting, allow insertion and deletion of rows and columns, allow sorting, and more.
Setting Protection options is done via the Protect method of the Worksheet object. Use the Protection property of the Worksheet object to check the current protection settings:
MsgBox ActiveSheet.Protection.AllowFormattingCells
Protection Properties
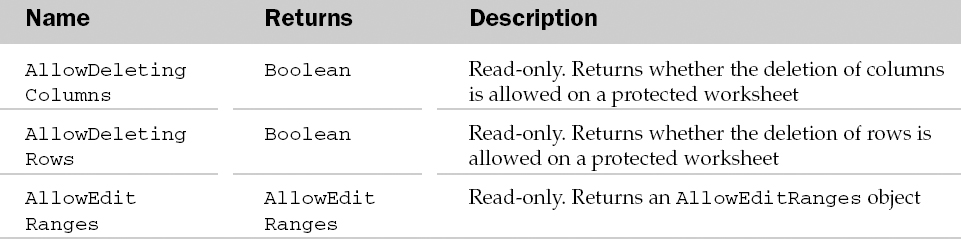
Example: Protection Object
The following routine sets Protection options based on the user name found on the General tab of the Tools ![]() Options command and that user's settings on a table on the worksheet. If the user isn't found, a message appears and the default settings are used:
Options command and that user's settings on a table on the worksheet. If the user isn't found, a message appears and the default settings are used:
Sub ProtectionSettings()
   Dim rngUsers As Range, rngUser As Range
   Dim sCurrentUser As String

   'Grab the current username
   sCurrentUser = Application.UserName

   'Define the list of users in the table
   With wksAllowEditRange
       Set rngUsers = .Range(.Range(“Users”), .Range(“Users”).End(xlToRight))
   End With

   'Locate the current user on the table
   Application.FindFormat.Clear
   Set rngUser = rngUsers.Find(What:=sCurrentUser, SearchOrder:=xlByRows, MatchCase:=False, SearchFormat:=False)

   'If current user is found on the table…
   If Not rngUser Is Nothing Then
       'Set the Protection properties based
       ' on a table
       wksAllowEditRange.Protect Password:=“wrox1”, _
       DrawingObjects:=True, _
       Contents:=True, _
       AllowFormattingCells:=rngUser.Offset(1, 0).Value, _
       AllowFormattingColumns:=rngUser.Offset(2, 0).Value, _
       AllowFormattingRows:=rngUser.Offset(3, 0).Value, _
       AllowSorting:=rngUser.Offset(4, 0).Value, _
       UserInterfaceOnly:=True

       'Select Unlocked cells, Locked and Unlocked cells, or neither
       ' is NOT part of the Protection object
       If rngUser.Offset(5, 0).Value = True Then
           wksAllowEditRange.EnableSelection = xlUnlockedCells
       Else
           wksAllowEditRange.EnableSelection = xlNoRestrictions
       End If
   Else
       'Current user is not on the table
       MsgBox “User not found on User Table. Default Options will be used.”, vbExclamation, “Protection Settings”
       wksAllowEditRange.Protect , True, True, False, False, False, _
                                   False, False, False, False, False, _
                                   False, False, False, False, False

       wksAllowEditRange.EnableSelection = xlNoRestrictions

   End If

End Sub
PublishObject Object and the PublishObjects Collection
The PublishObjects collection holds all of the things in a workbook that have been saved to a Web page. Each PublishObject object contains items from a workbook that have been saved to a Web page and may need some occasional refreshing of values on the Web page side. The parent of the PublishObjects collection is the Workbook object.
The PublishObjects collection has a few properties and methods besides the typical collection attributes. The unique attributes are listed in the following table.
PublishObjects Properties and Methods
PublishObject Common Properties
The Application, Creator, and Parent properties are defined at the beginning of this Appendix.
PublishObject Properties
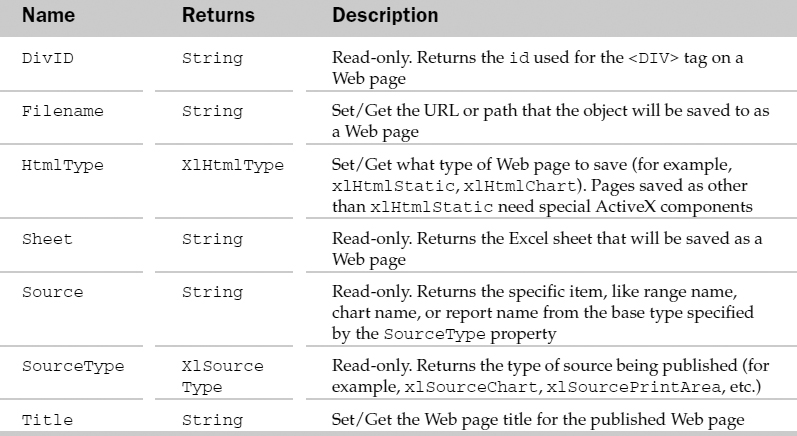
PublishObject Methods
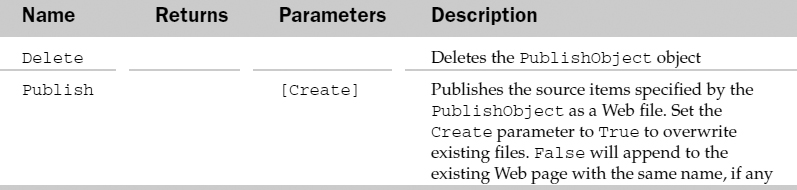
Example: PublishObject Object and the PublishObjects Collection
Sub UpdatePublishedCharts()
   Dim oPO As PublishObject
   For Each oPO In ActiveWorkbook.PublishObjects
      If oPO.SourceType = xlSourceChart Then
         oPO.Publish
      End If
   Next
End Sub
QueryTable Object and the QueryTables Collection
The QueryTables collection holds the collection of data tables created from an external data source. Each QueryTable object represents a single table in a worksheet filled with data from an external data source. The external data source can be an ODBC source, an OLE DB source, a text file, a Data Finder, a Web-based query, or a DAO/ADO recordset. The parent of the QueryTables collection is the Worksheet object.
The QueryTables collection has a few properties and methods not typical of a collection. These atypical attributes are listed next.
QueryTables Properties and Methods
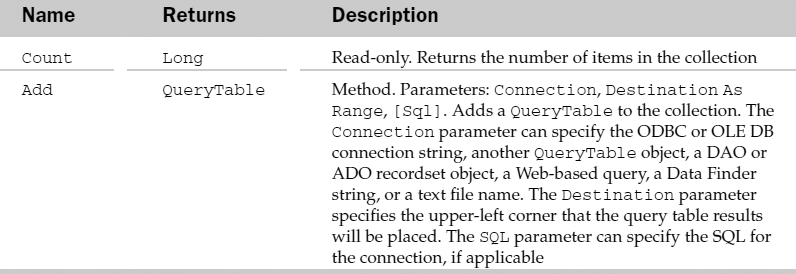
QueryTable Common Properties
The Application, Creator, and Parent properties are defined at the beginning of this Appendix.
QueryTable Properties
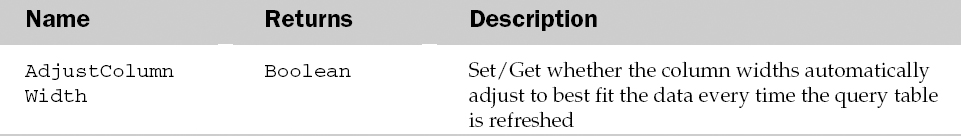
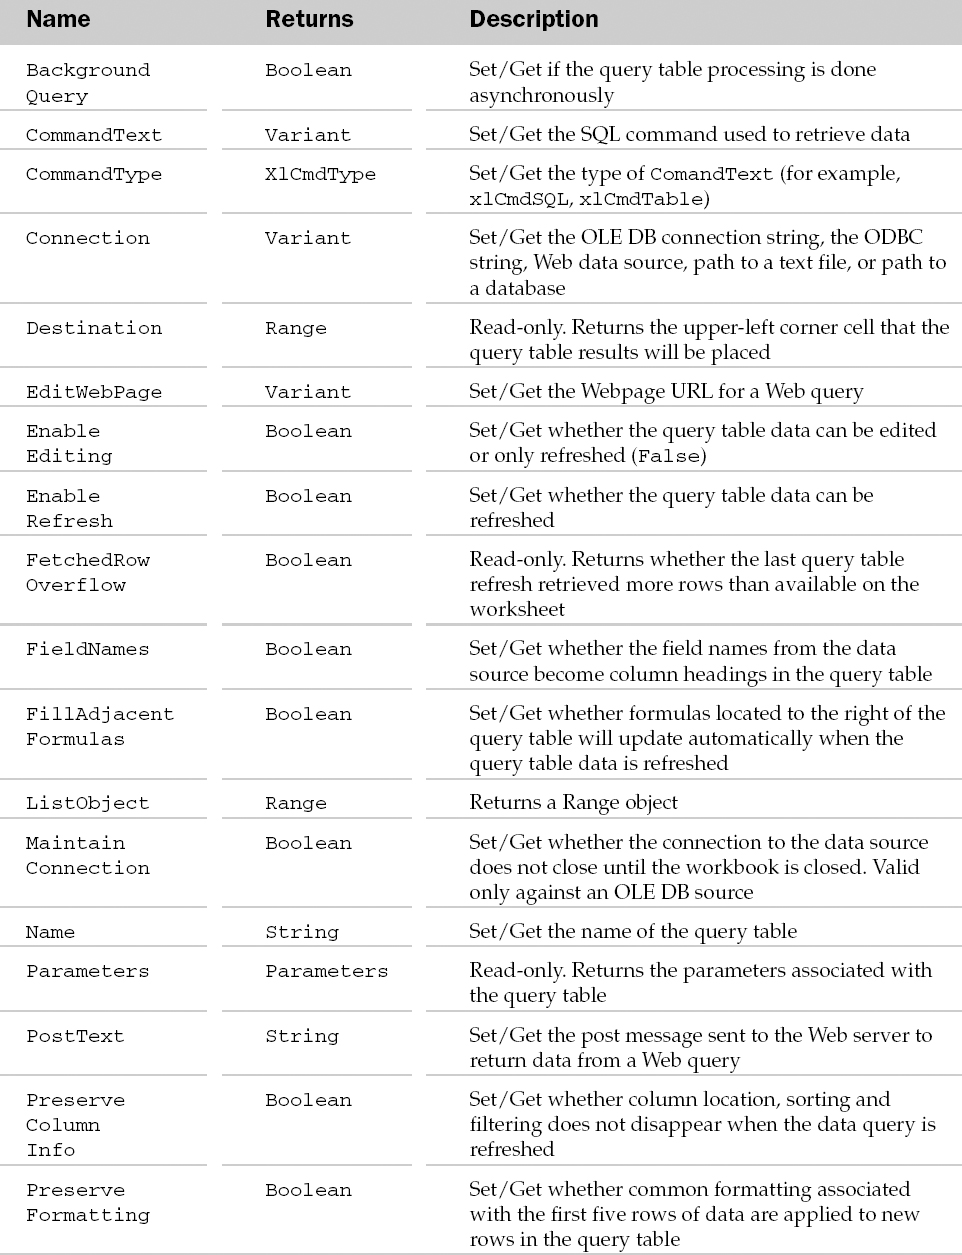
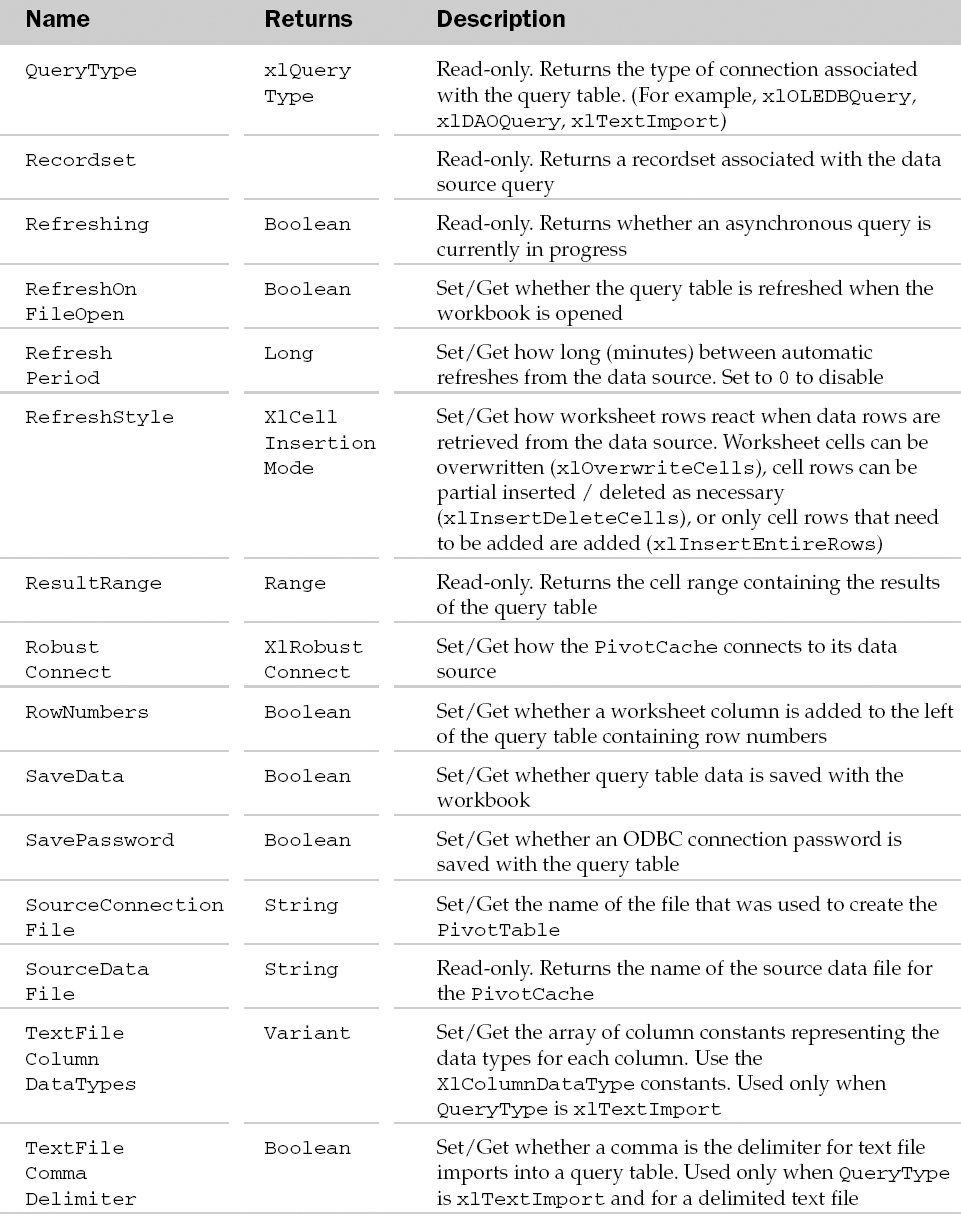
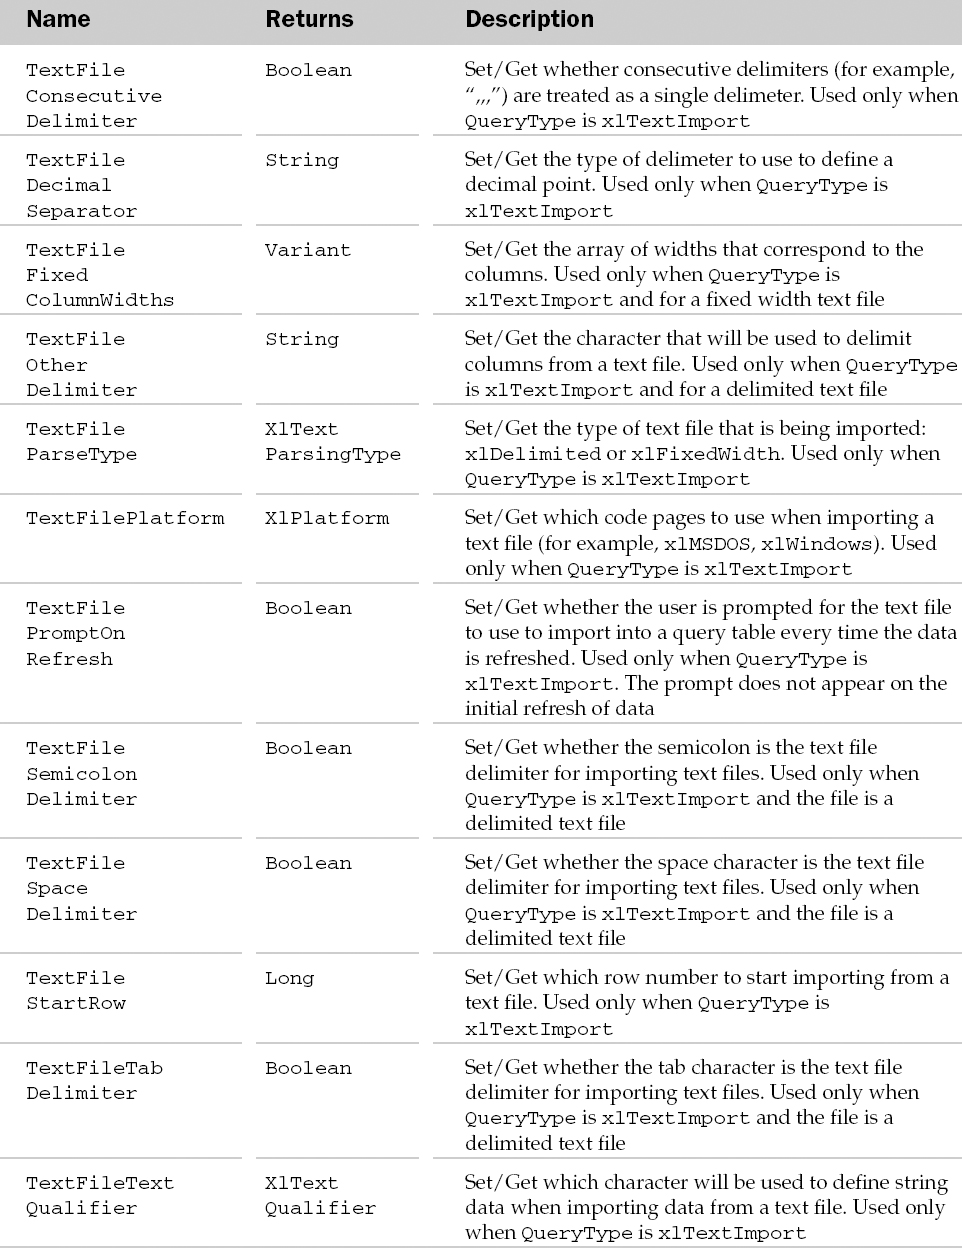
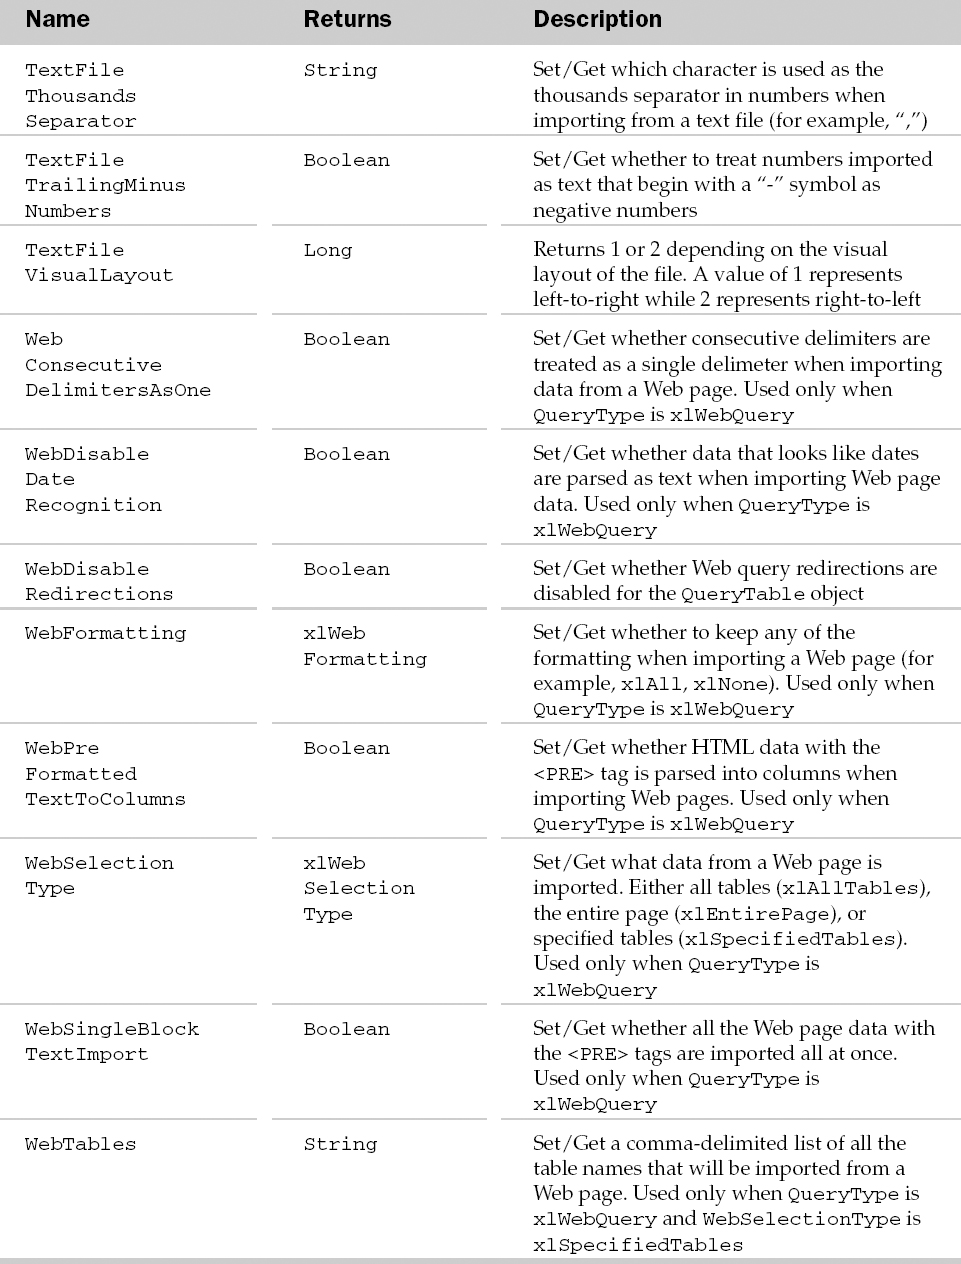
QueryTable Methods
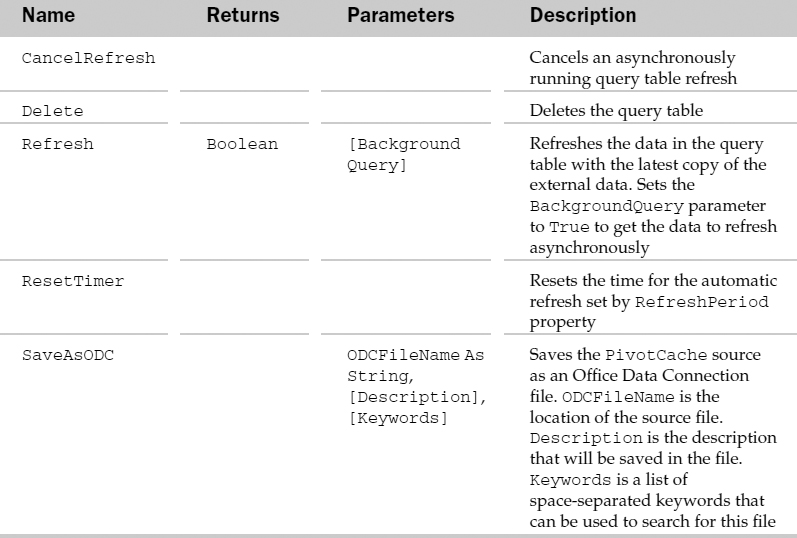
Example: QueryTable Object and the QueryTables Collection
Sub UpdateAllWebQueries()
   Dim oQT As QueryTable
   For Each oQT In ActiveSheet.QueryTables
      If oQT.QueryType = xlWebQuery Then
         oQT.BackgroundQuery = False
         oQT.Refresh
      End If
   Next
End Sub
Range Object
The Range object is one of the more versatile objects in Excel. A range can be a single cell, a column, a row, a contiguous block of cells, or a non-contiguous range of cells. The main parent of a Range object is the Worksheet object. However, most of the objects in the Excel Object Model use the Range object. The Range property of the Worksheet object can be used to choose a certain range of cells using the Cell1 and Cell2 parameters.
Range Common Properties
The Application, Creator, and Parent properties are defined at the beginning of this Appendix.
Range Properties
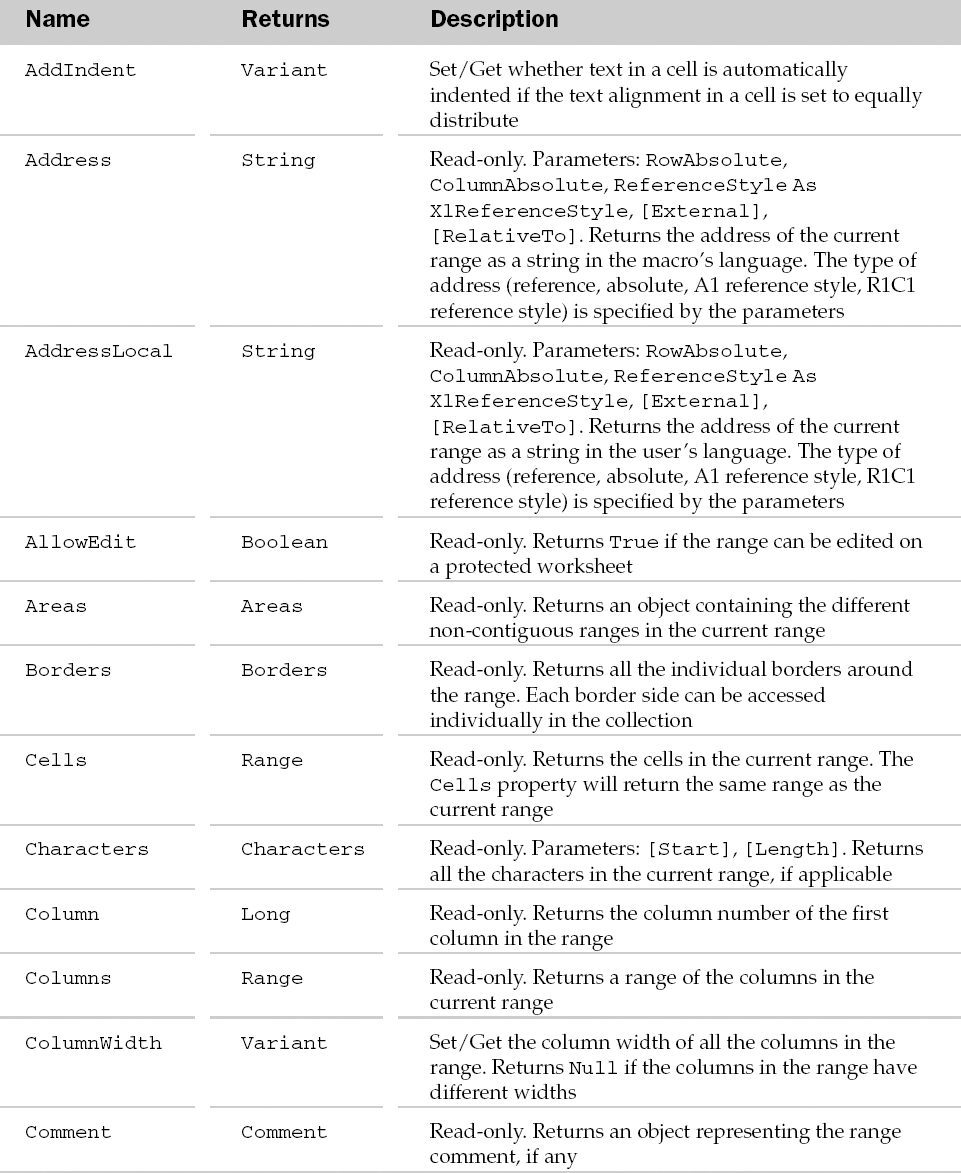
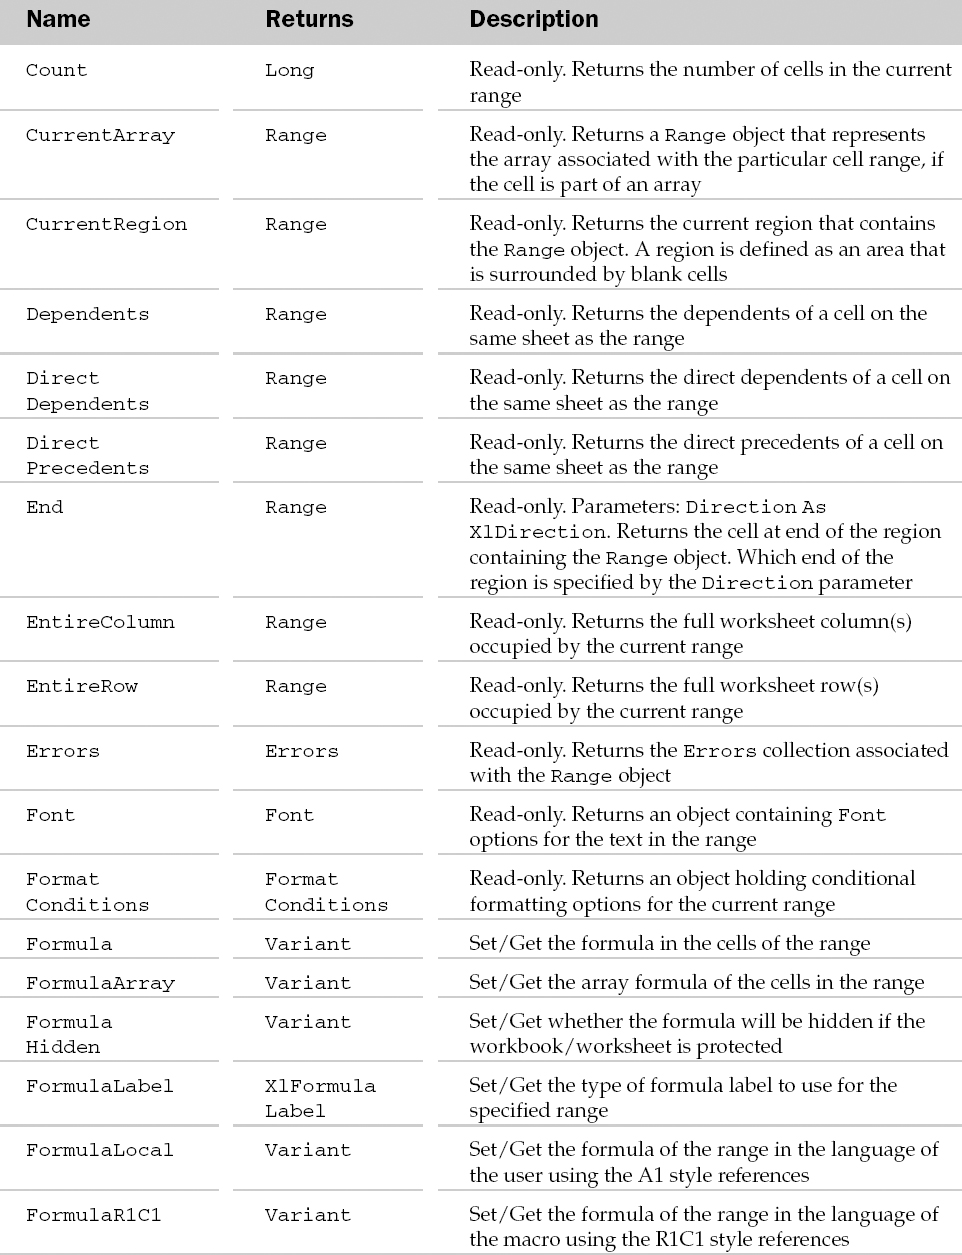
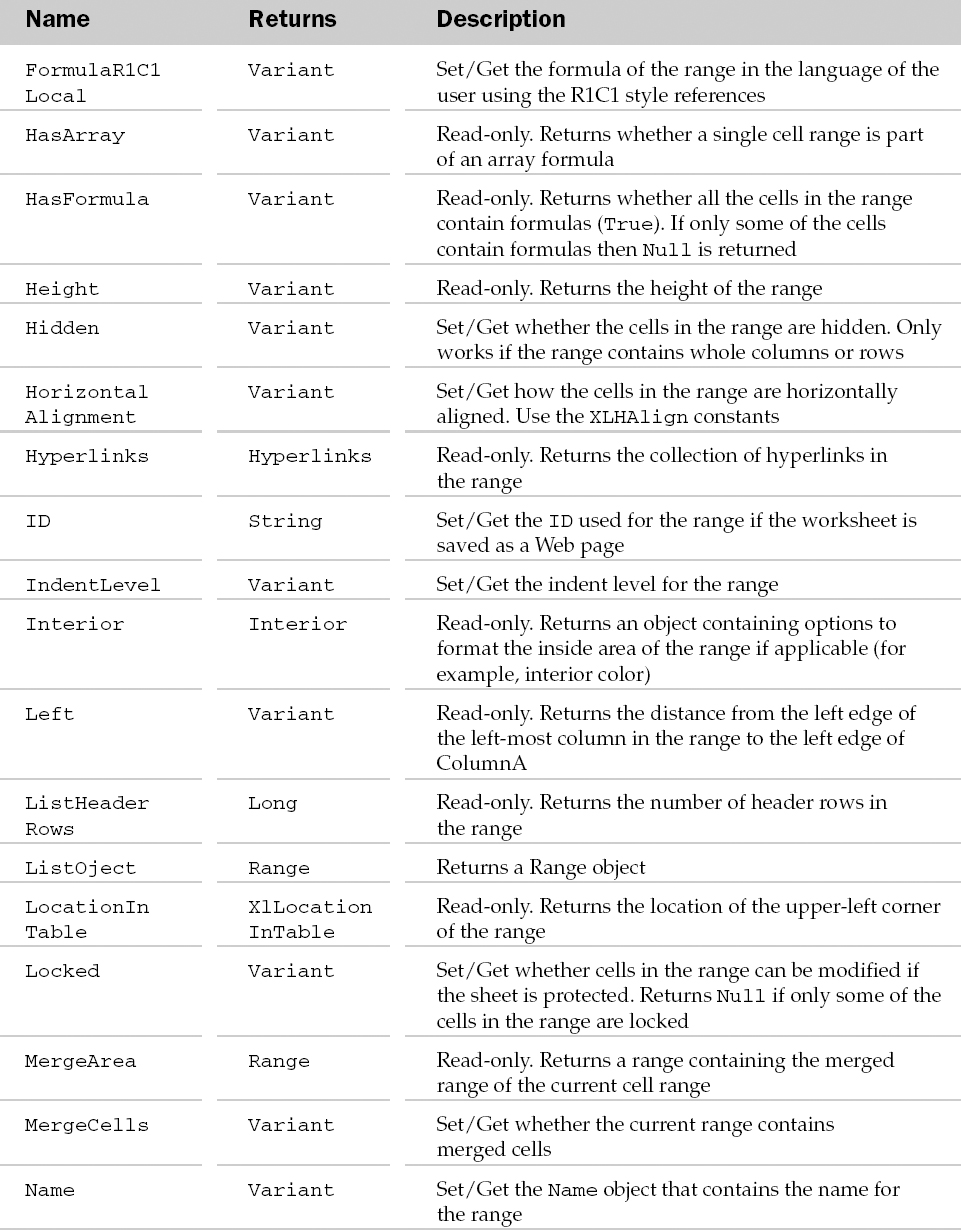
Range Methods
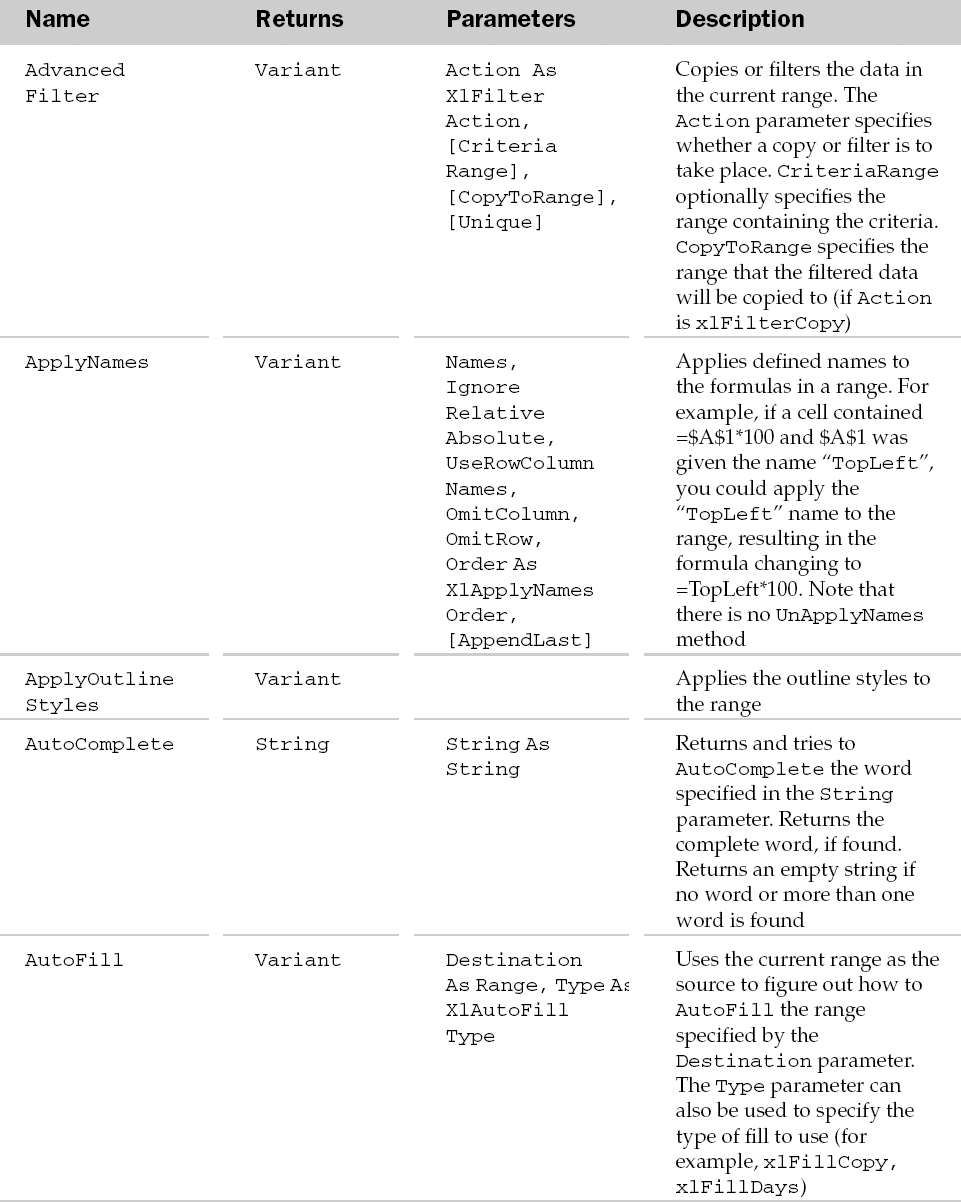
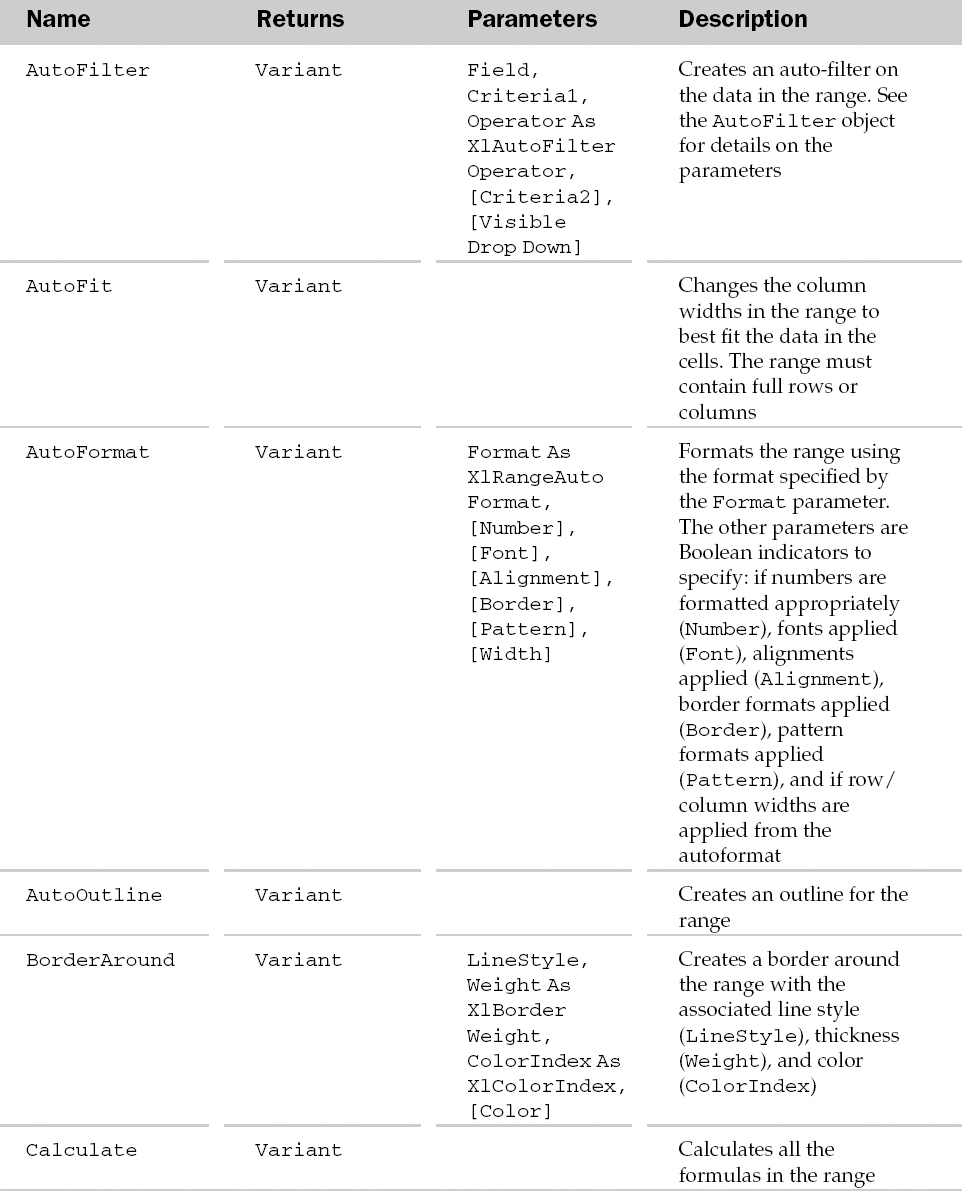
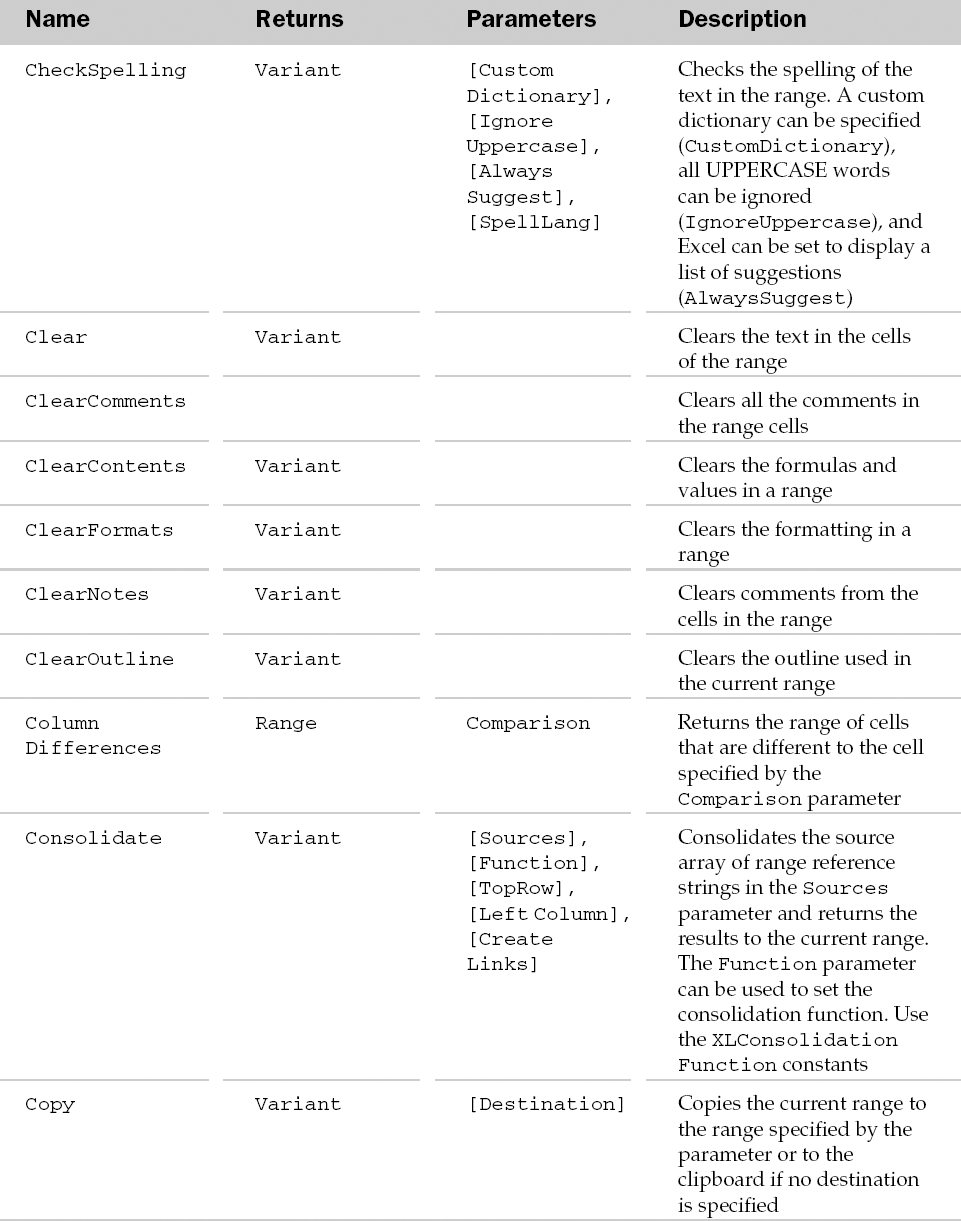
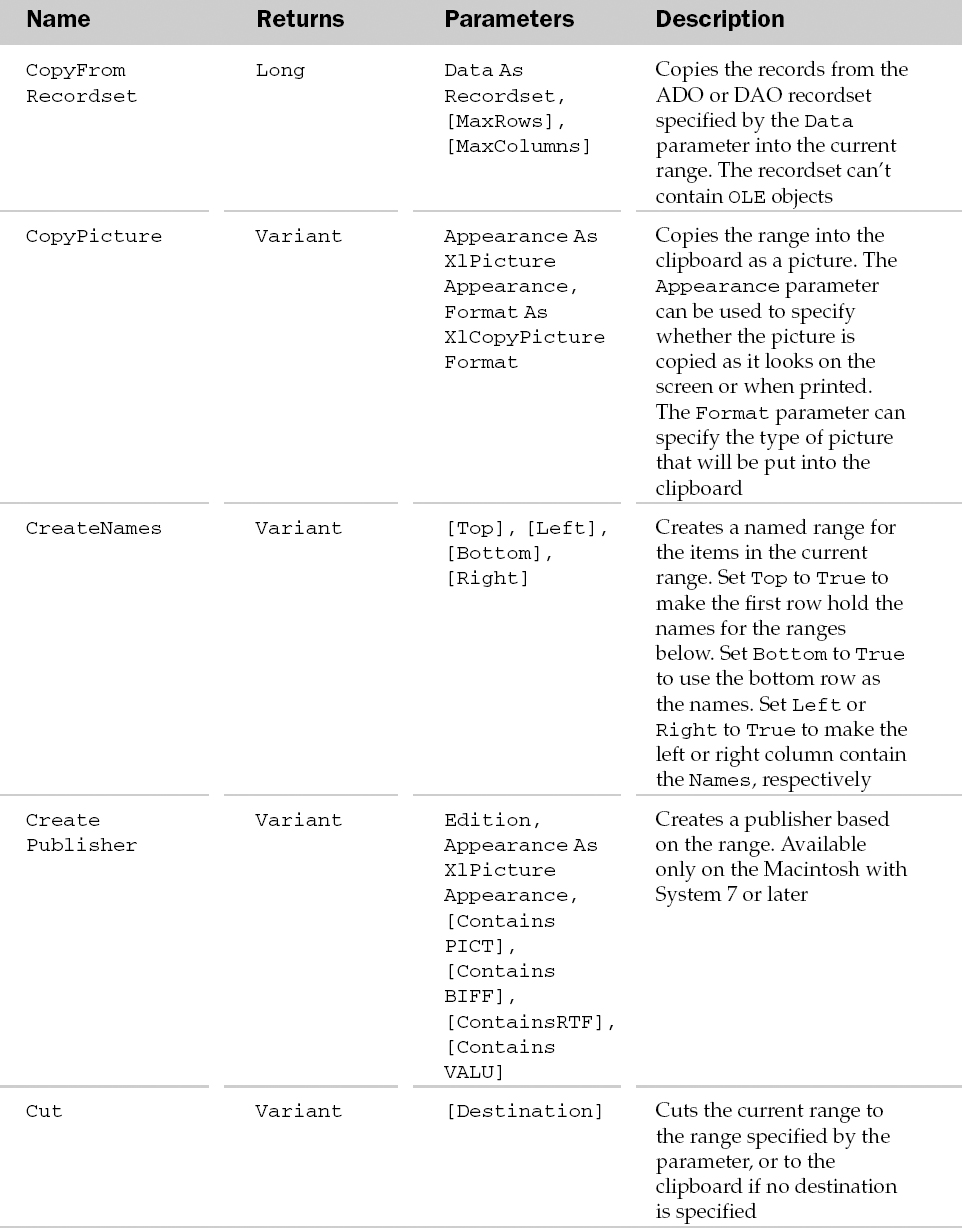
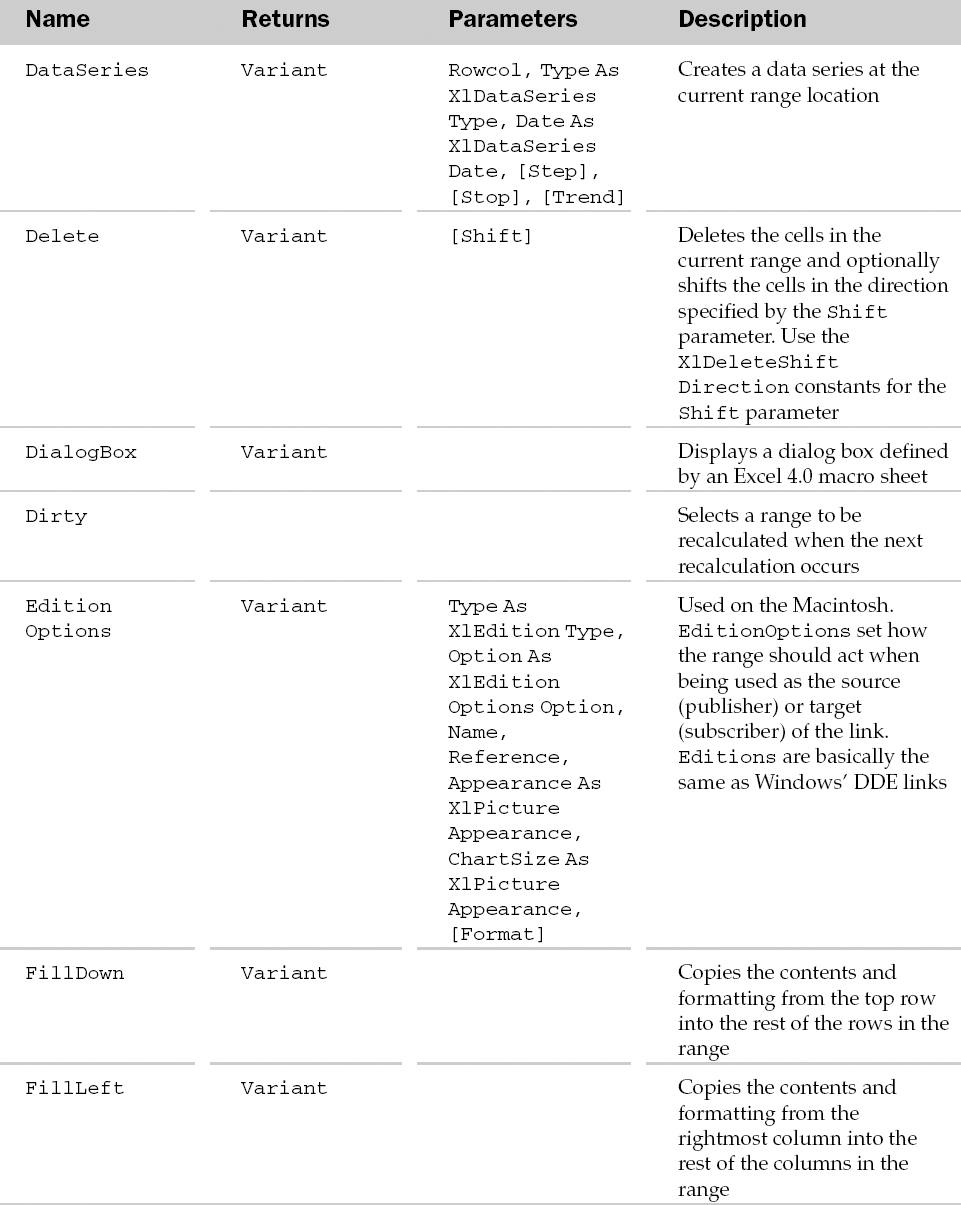
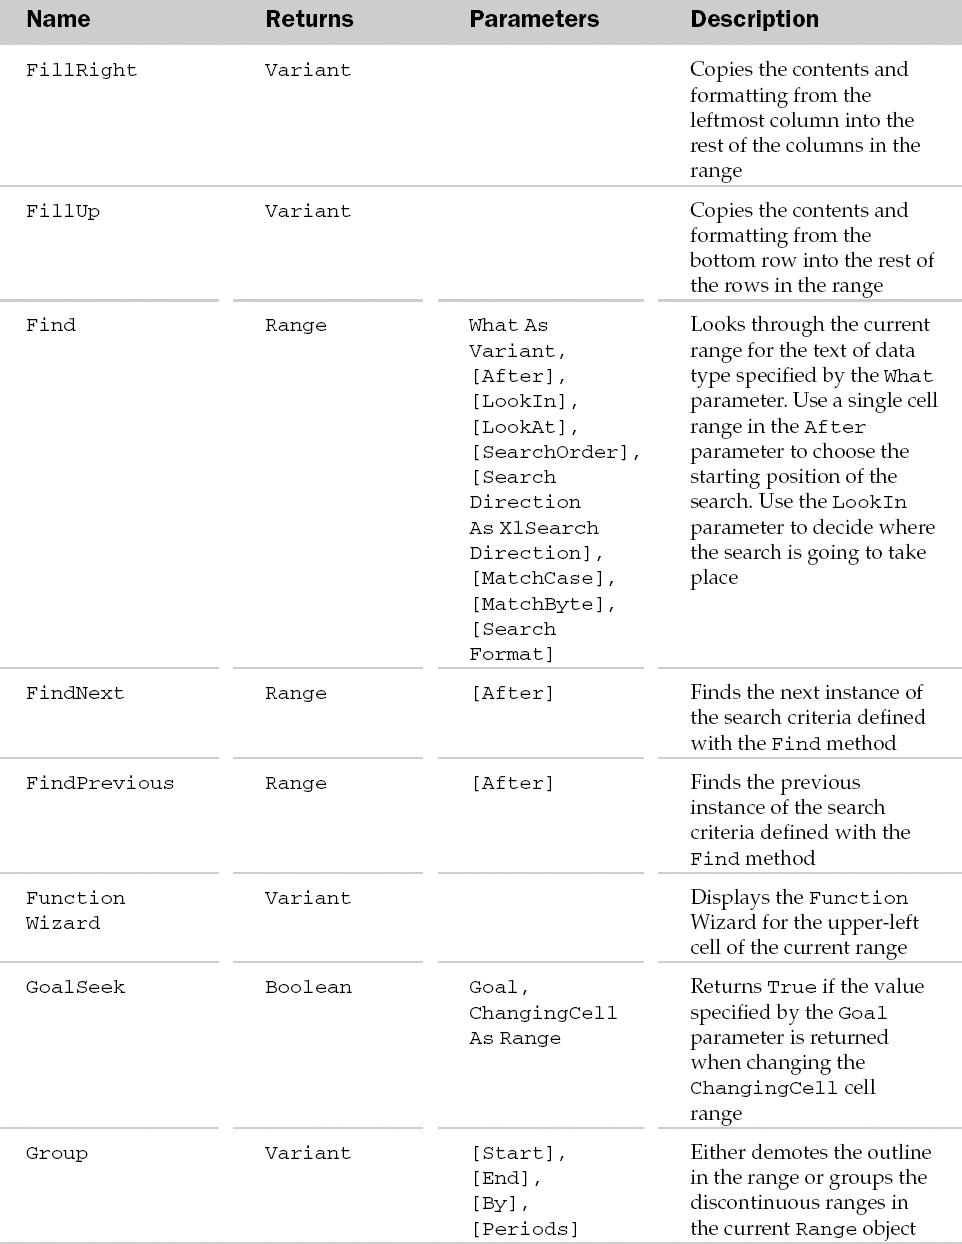
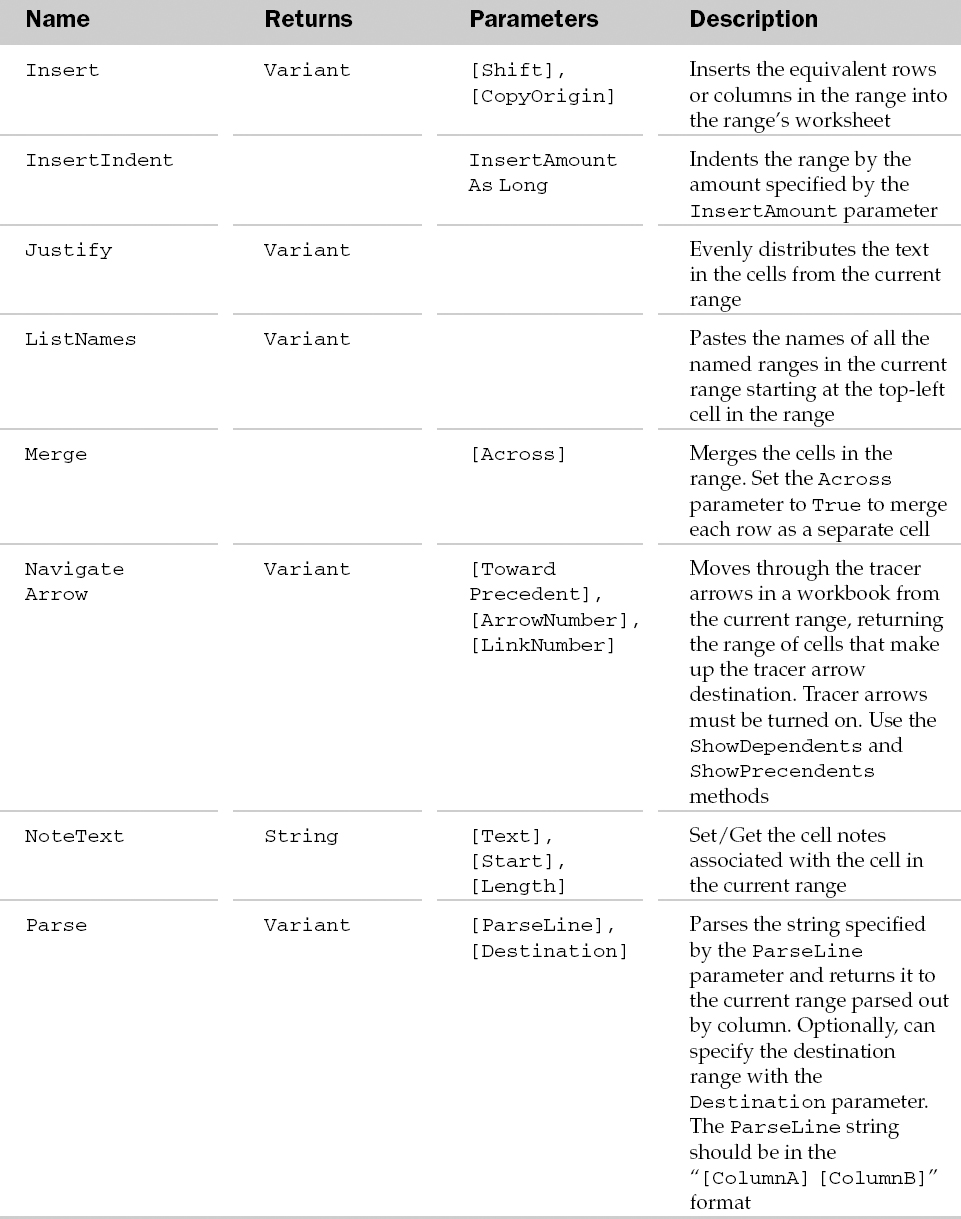
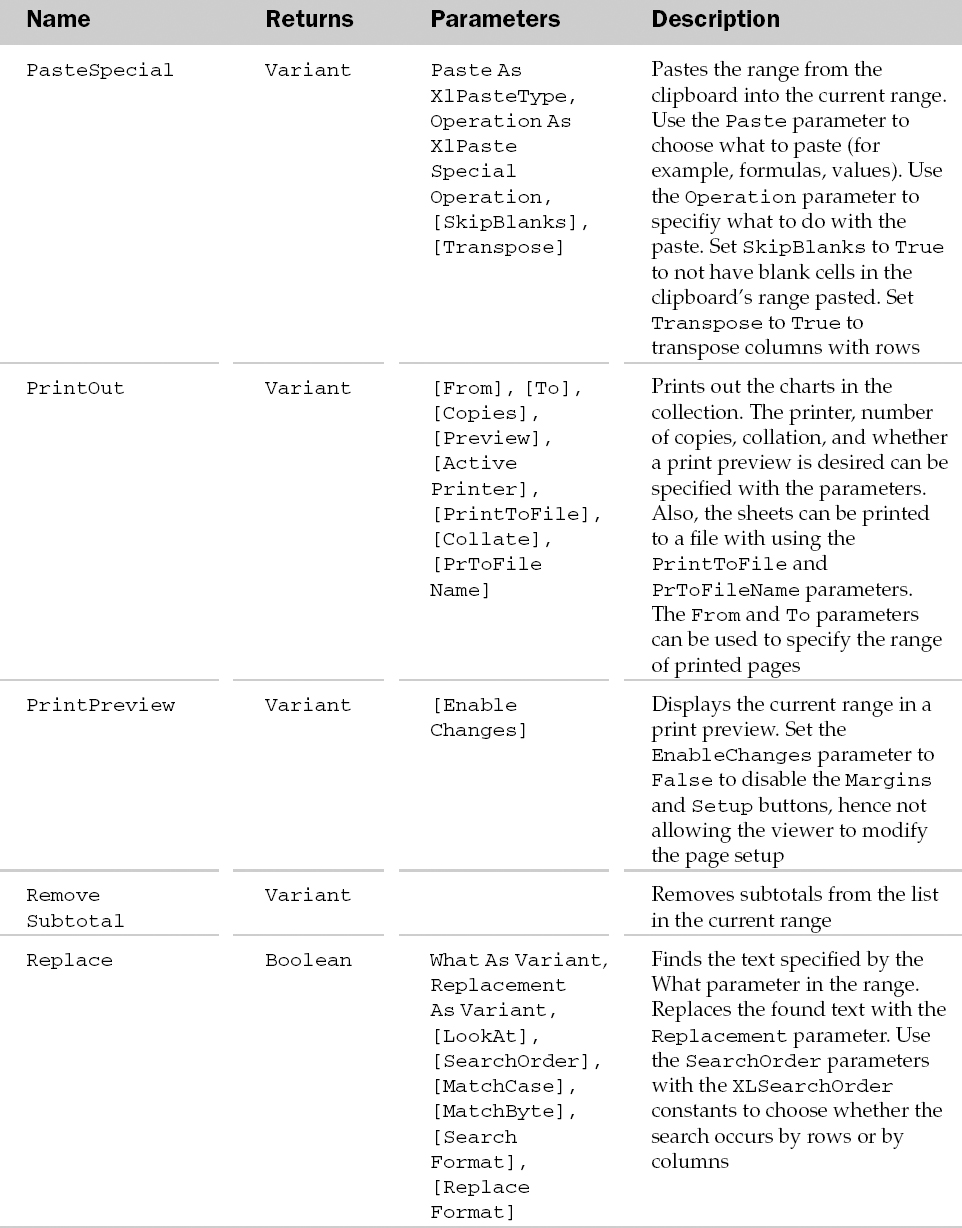
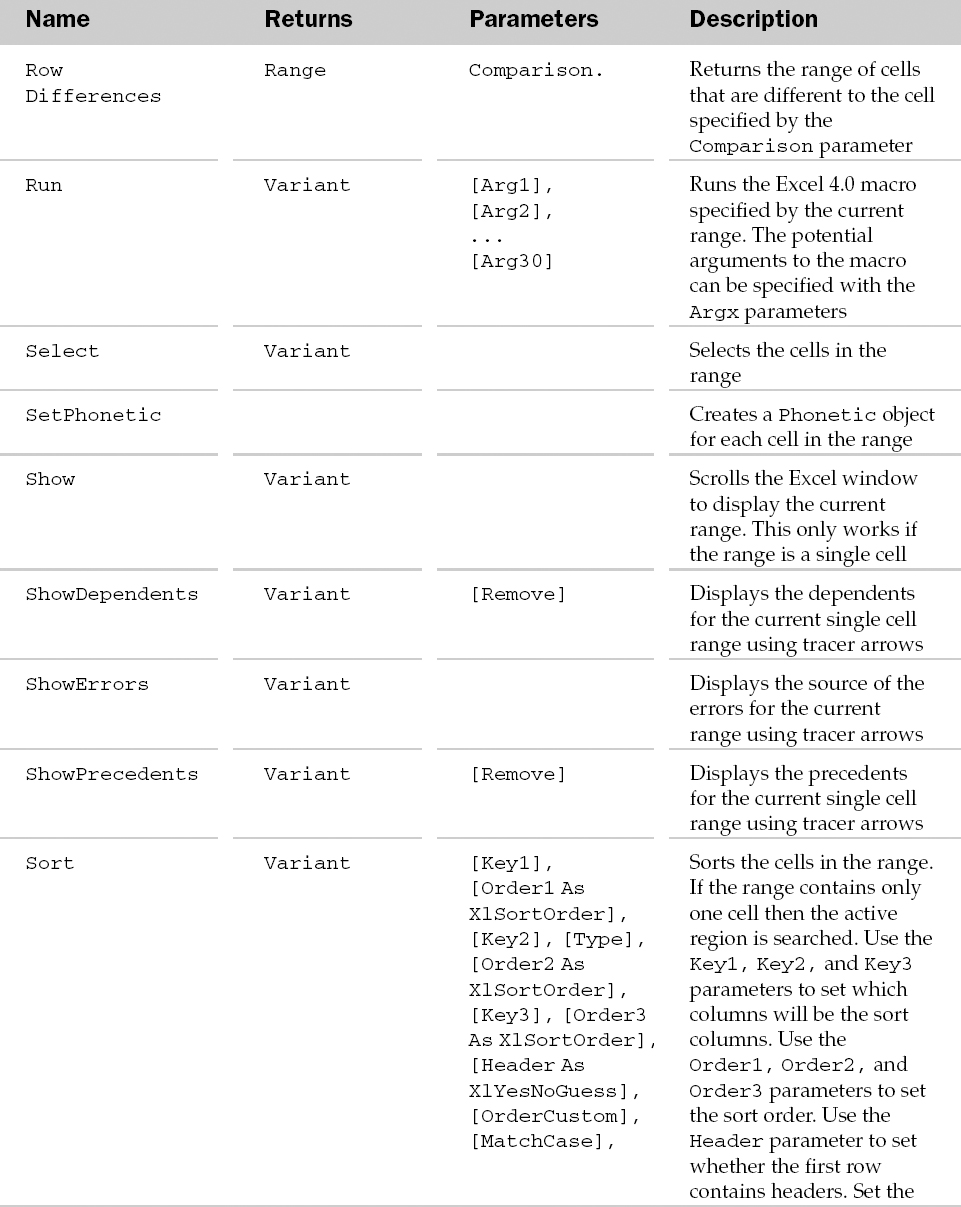
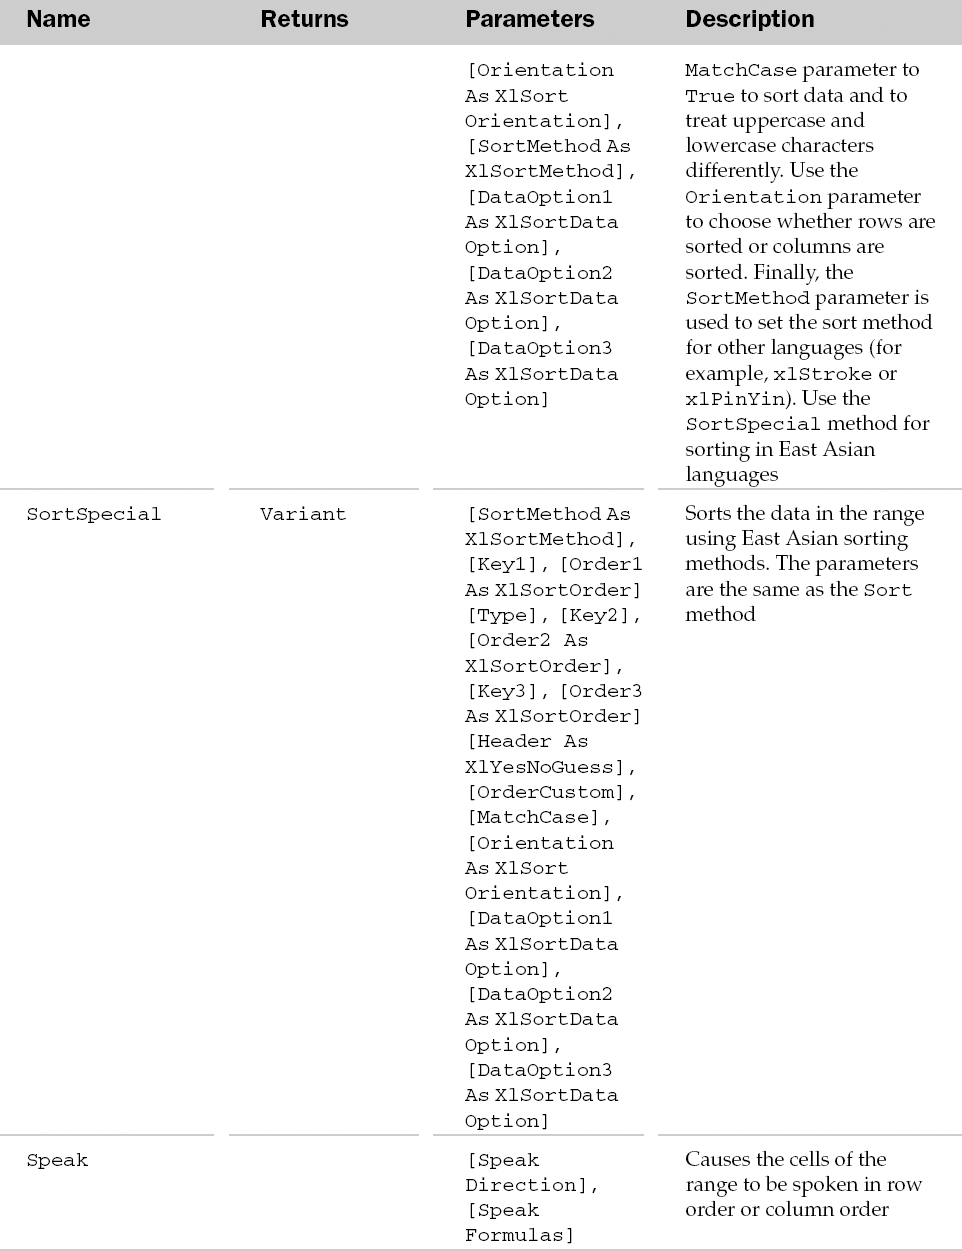
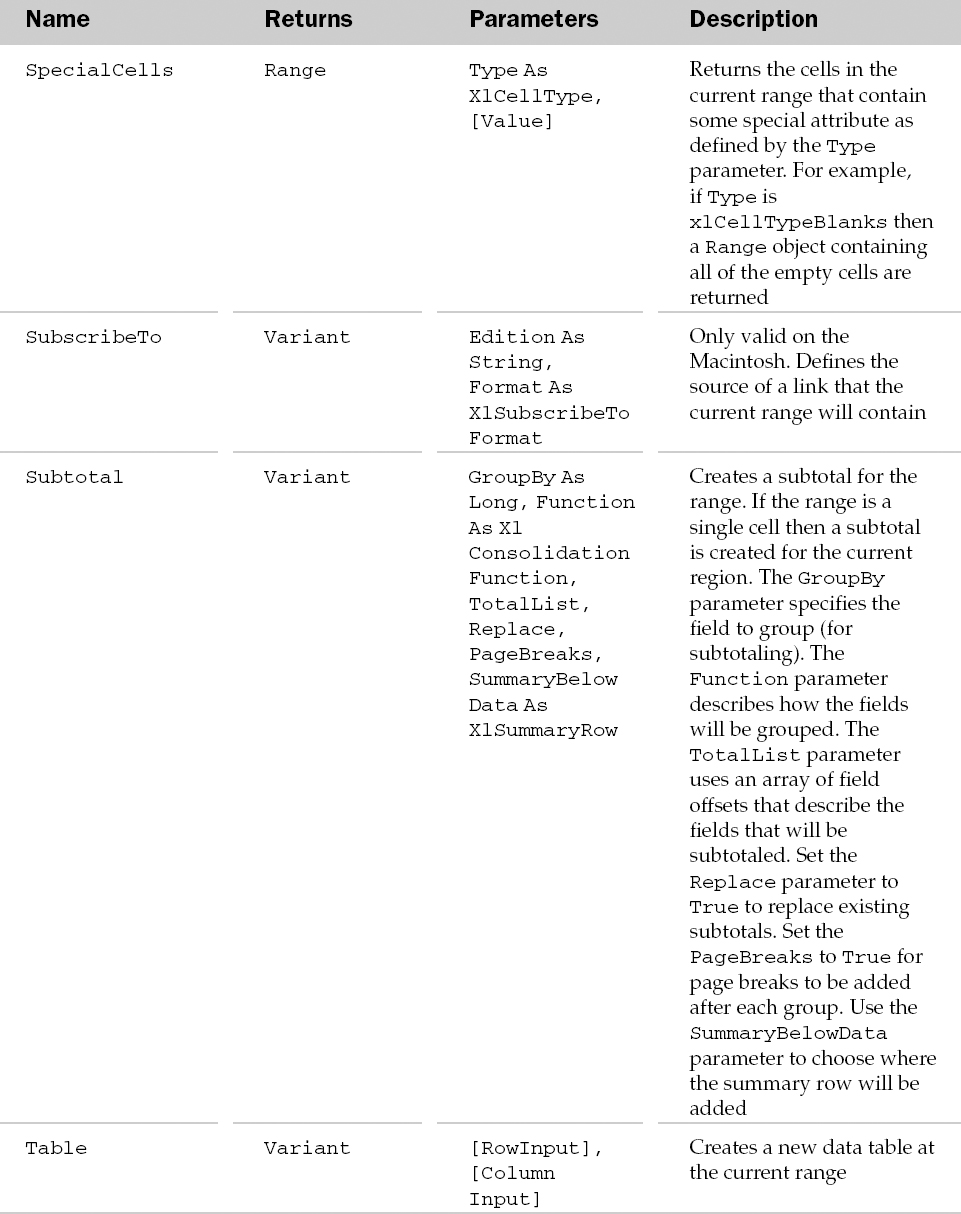
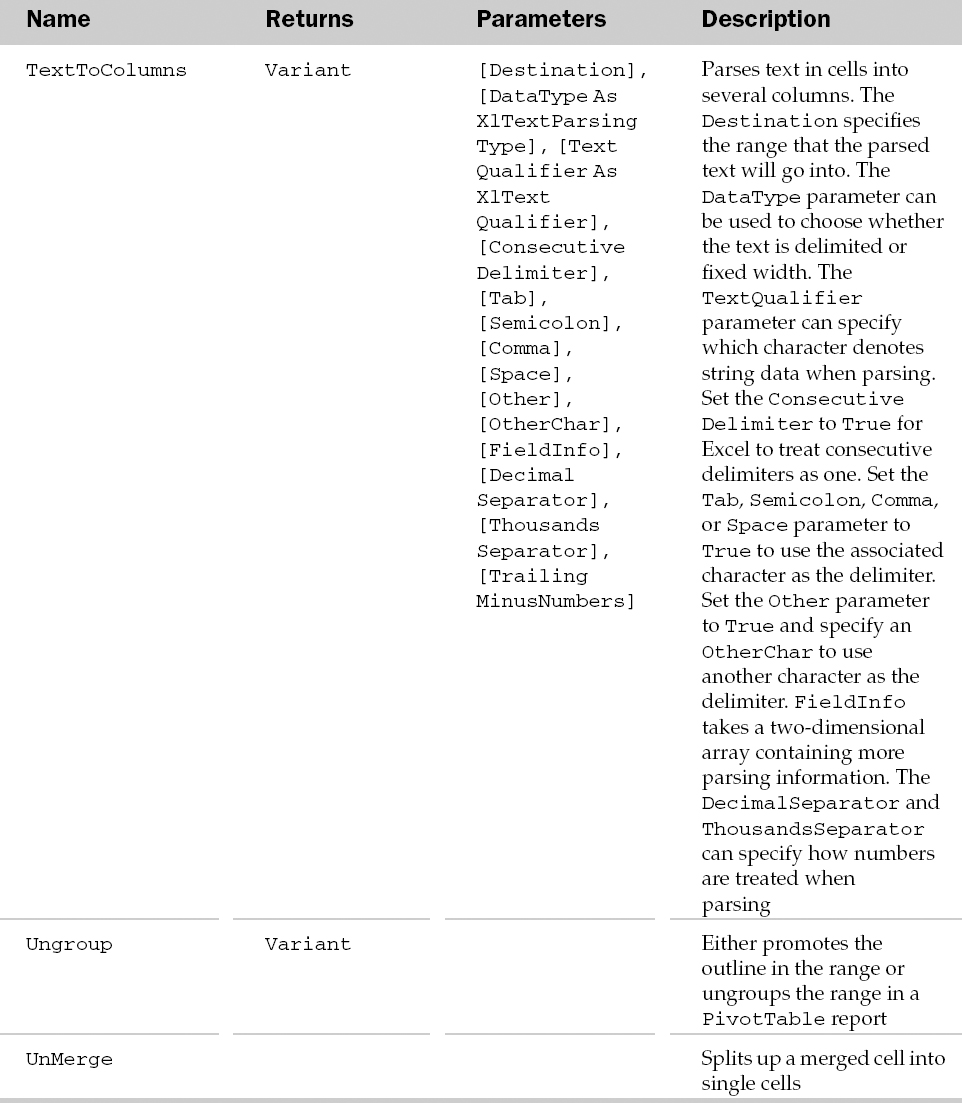
Example: Range Object
See Chapter 5 for examples of working with the Range object.
RecentFile Object and the RecentFiles Collection
The RecentFiles collection holds the list of recently modified files. Equivalent to the files listed under the File menu in Excel. Each RecentFile object represents one of the recently modified files.
RecentFiles has a few attributes besides the typical collection ones. The Maximum property can be used to set or return the maximum number of files that Excel will “remember” modifying. The value can range from 0 to 9. The Count property returns the number of RecentFile objects in the collection. The Add method is used to add a file (with the Name parameter) to the collection.
RecentFile Common Properties
The Application, Creator, and Parent properties are defined at the beginning of this Appendix.
RecentFile Properties
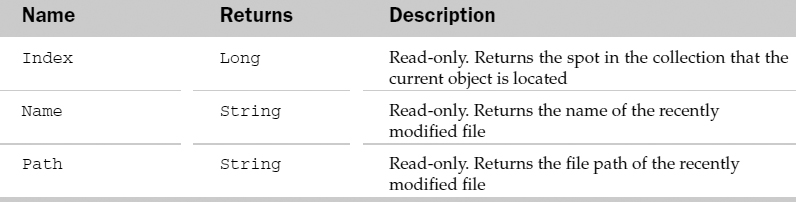
RecentFile Methods
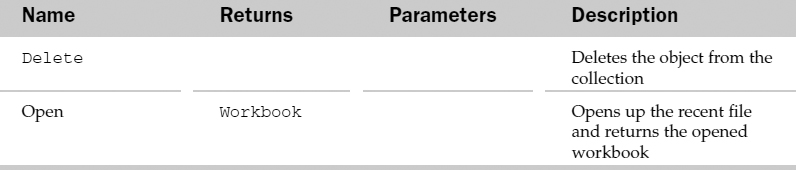
Example: RecentFile Object and the RecentFiles Collection
Sub CheckRecentFiles()
   Dim oRF As RecentFile
   'Remove any recent files that refer to the floppy drive
   For Each oRF In Application.RecentFiles
      If Left(oRF.Path, 2) = “A:” Then
         oRF.Delete
      End If
   Next
End Sub
RoutingSlip Object
The RoutingSlip object represents the properties and methods of the routing slip of an Excel document. The parent object of the RoutingSlip object is the Workbook object. The HasRoutingSlip property of the Workbook object has to set to True before the RoutingSlip object can be manipulated.
RoutingSlip Common Properties
The Application, Creator, and Parent properties are defined at the beginning of this Appendix.
RoutingSlip Properties
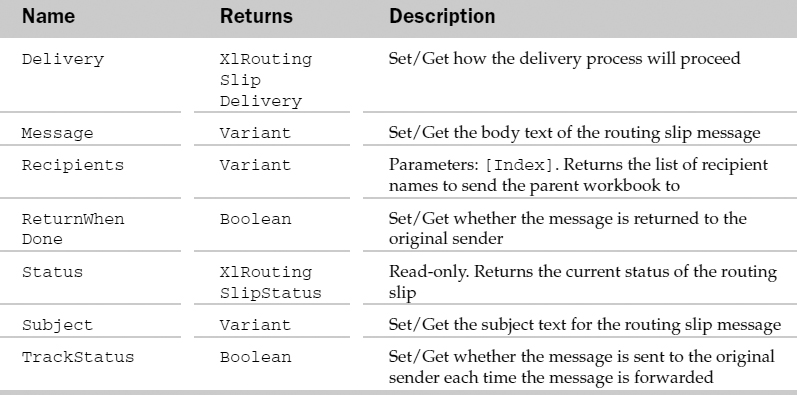
RoutingSlip Methods

RTD Object
Represents a Real-Time Data object, like one referenced using the IrtdServer object. As of this writing, there was very little documentation.
RTD Properties
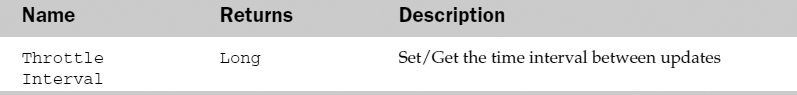
RTD Methods
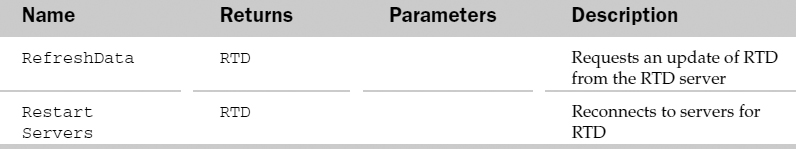
Scenario Object and the Scenarios Collection
The Scenarios collection contains the list of all the scenarios associated with a worksheet. Each Scenario object represents a single scenario in a worksheet. A scenario holds the list of saved cell values that can later be substituted into the worksheet. The parent of the Scenarios collection is the Worksheet object.
The Scenarios collection has a few extra properties and methods besides the typical collection attributes. These are listed in the following table.
Scenarios Properties and Methods
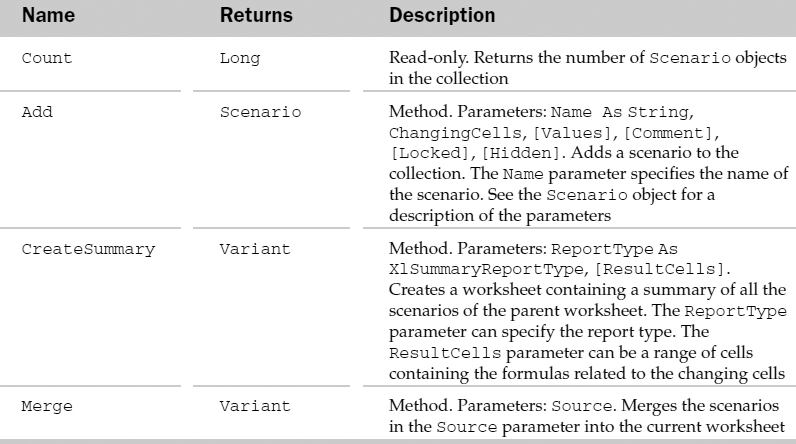
Scenario Common Properties
The Application, Creator, and Parent properties are defined at the beginning of this Appendix.
Scenario Properties
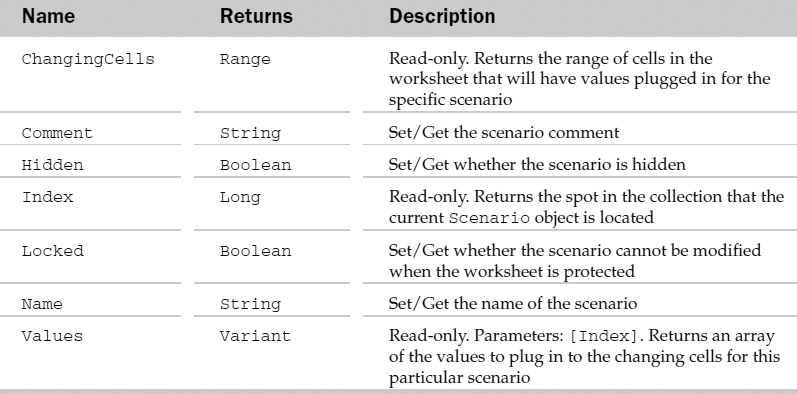
Scenario Methods
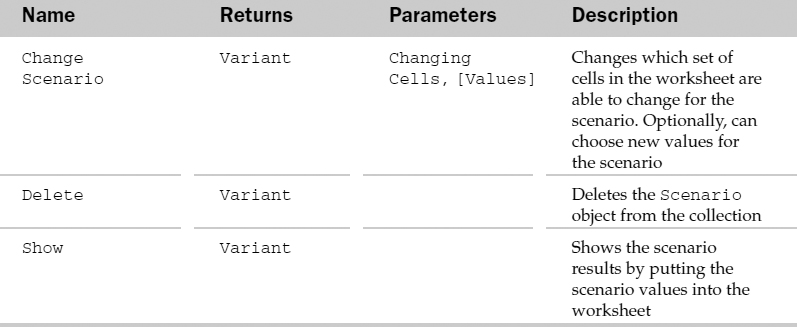
Example: Scenario Object and the Scenarios Collection
Sub GetBestScenario()
   Dim oScen As Scenario
   Dim oBestScen As Scenario
   Dim dBestSoFar As Double
   'Loop through the scenarios in the sheet
   For Each oScen In ActiveSheet.Scenarios
      'Show the secnario
      oScen.Show

      'Is it better?
      If Range(“Result”).Value > dBestSoFar Then
         dBestSoFar = Range(“Result”).Value

         'Yes - remember it
         Set oBestScen = oScen
      End If
   Next
   'Show the best scenario
   oBestScen.Show
   MsgBox “The best scenario is ” & oBestScen.Name
End Sub
Series Object and the SeriesCollection Collection
The SeriesCollection collection holds the collection of series associated with a chart group. Each Series object contains a collection of points associated with a chart group in a chart. For example, a simple line chart contains a series (Series) of points brought in from the originating data. Since some charts can have many series plotted on the same chart, the SeriesCollection is used to hold that information. The parent of the SeriesCollection is the ChartGroup.
The SeriesCollection has a few attributes that are not typical of a collection. These are listed in the following table.
SeriesCollection Properties and Methods
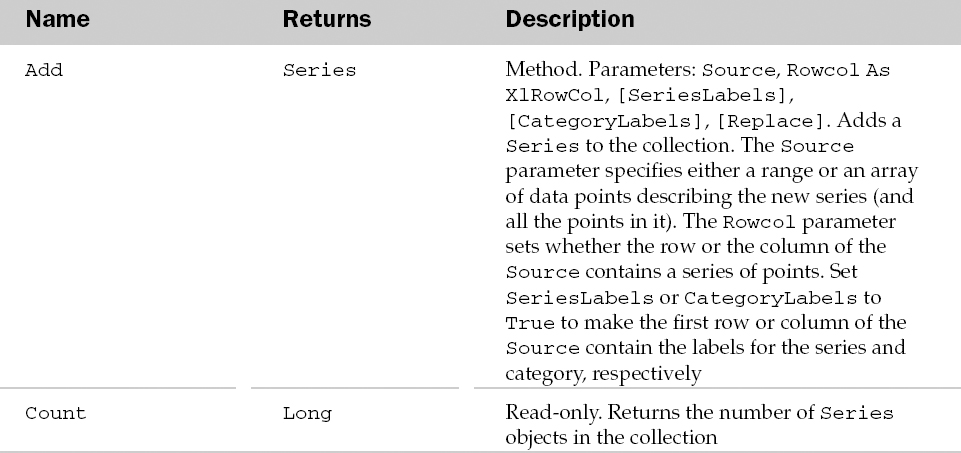
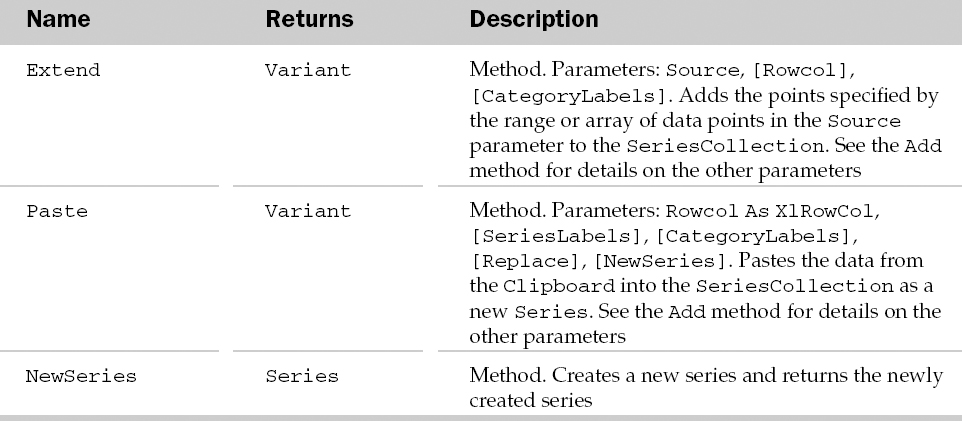
Series Common Properties
The Application, Creator, and Parent properties are defined at the beginning of this Appendix.
Series Properties
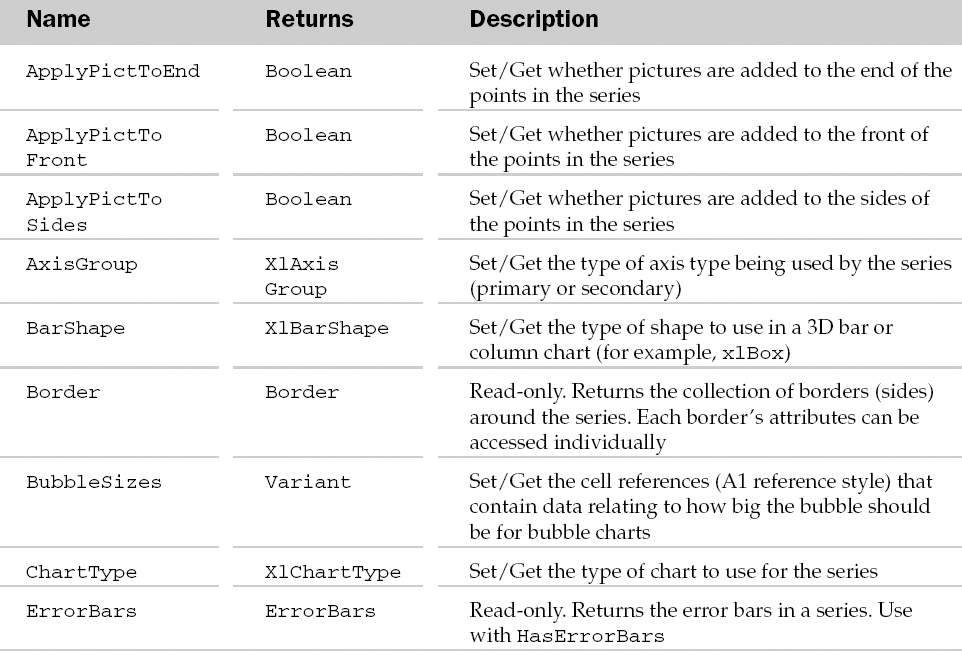
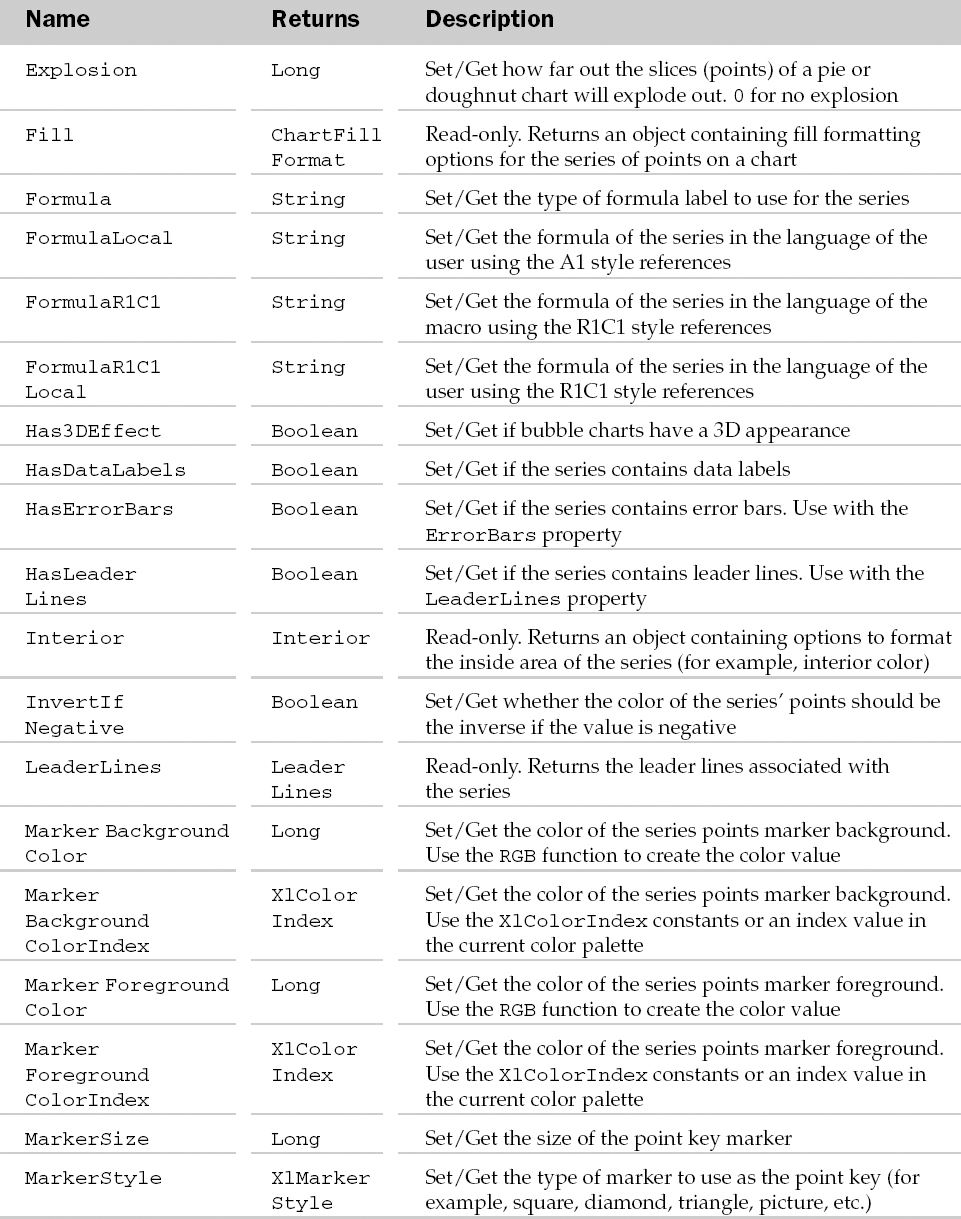
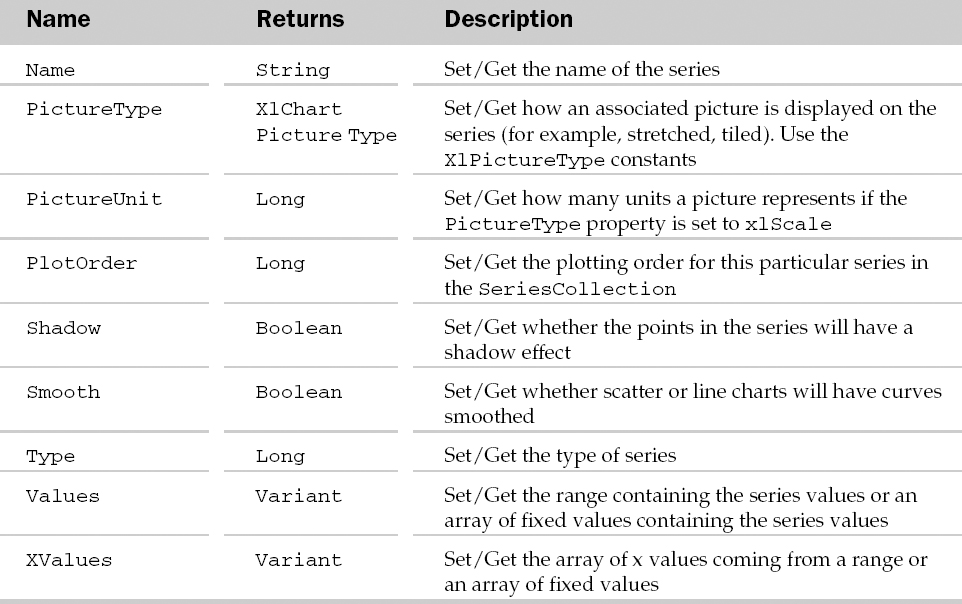
Series Methods
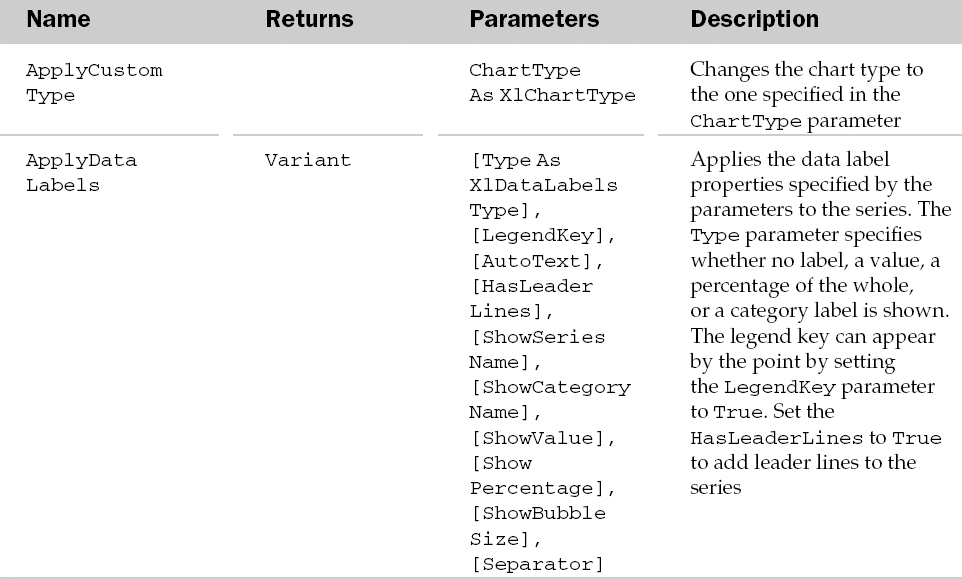
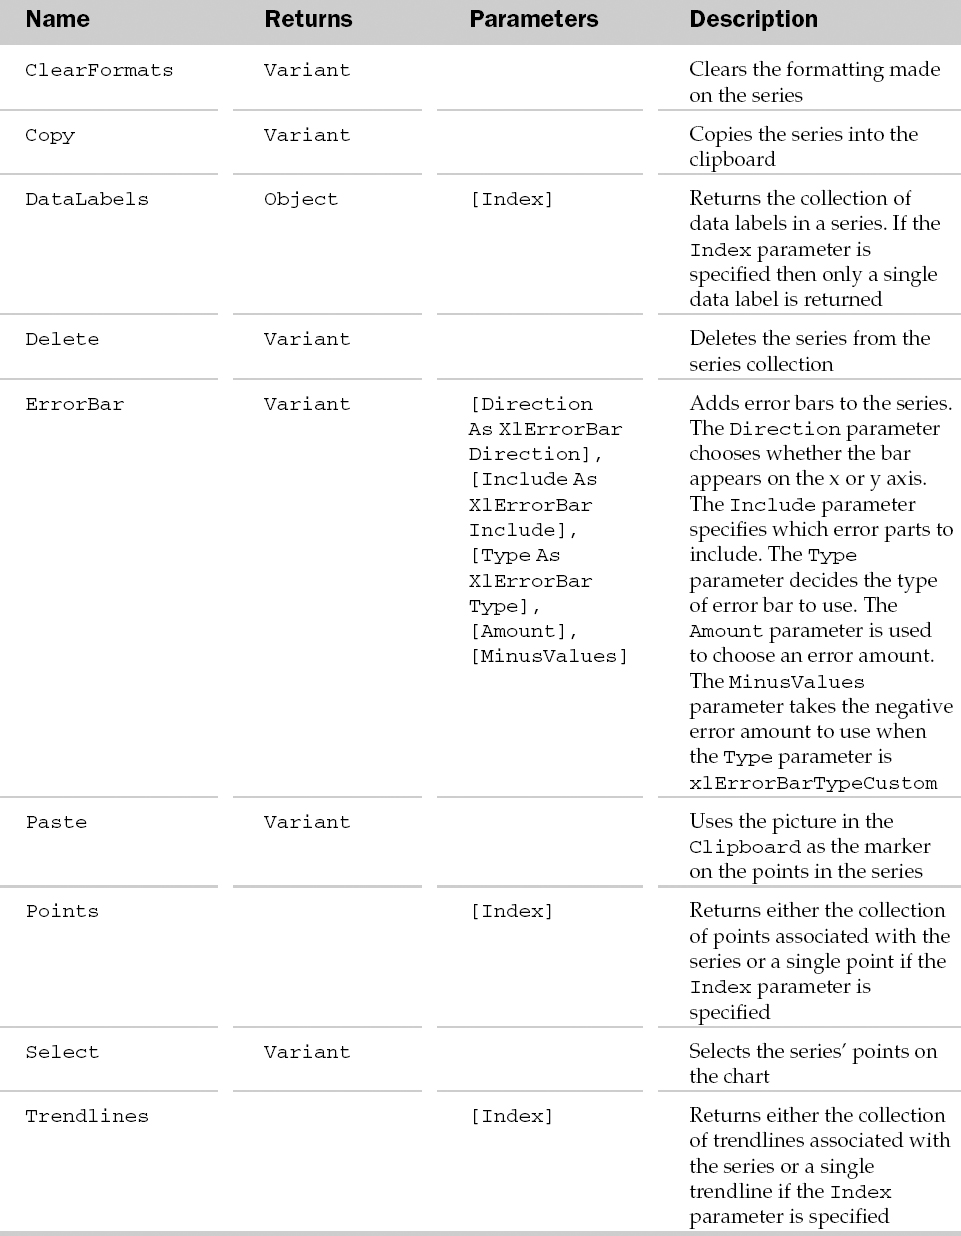
Example: Series Object and the SeriesCollection Collection
See the DataLabel object for an example of using the Series object.
SeriesLines Object
The SeriesLines object accesses the series lines connecting data values from each series. This object only applies to 2D stacked bar or column chart groups. The parent of the SeriesLines object is the ChartGroup object.
SeriesLines Common Properties
The Application, Creator, and Parent properties are defined at the beginning of this Appendix.
SeriesLines Properties
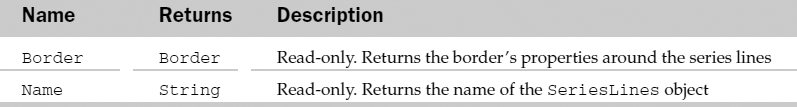
SeriesLines Methods
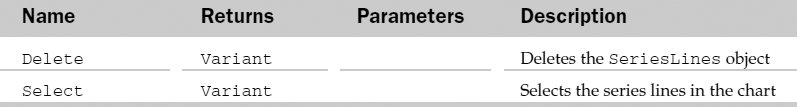
Example: SeriesLines Object
Sub FormatSeriesLines()
   Dim oCG As ChartGroup
   Dim oSL As SeriesLines
   'Loop through the column groups on the chart
   For Each oCG In Charts(1).ColumnGroups
      'Make sure we have some series lines
      oCG.HasSeriesLines = True
      'Get the series lines
      Set oSL = oCG.SeriesLines
      'Format the lines
      With oSL
         .Border.Weight = xlThin
         .Border.ColorIndex = 5
      End With
   Next
End Sub
ShadowFormat Object
The ShadowFormat object allows manipulation of the shadow formatting properties of a parent Shape object. Use the Shadow property of the Shape object to access the ShadowFormat object.
ShadowFormat Common Properties
The Application, Creator, and Parent properties are defined at the beginning of this Appendix.
ShadowFormat Properties
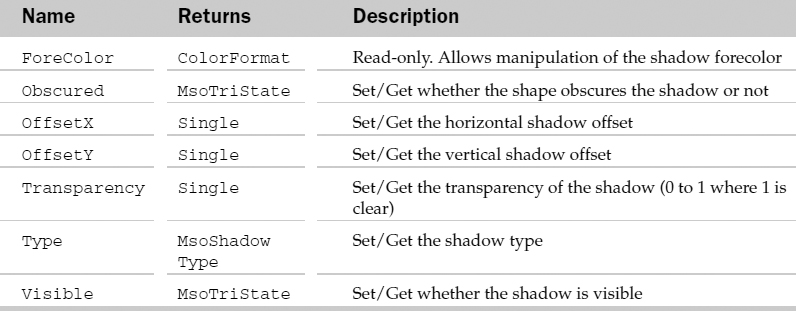
ShadowFormat Methods
Example: ShadowFormat Object
Sub AddShadow()
   Dim oSF As ShadowFormat
   Set oSF = ActiveSheet.Shapes.Range(1).Shadow
   With oSF
     .Type = msoShadow6
     .OffsetX = 5
     .OffsetY = 5
     .ForeColor.SchemeColor = 2
     .Visible = True
   End With
End Sub
Shape Object and the Shapes Collection
The Shapes collection holds the list of shapes for a sheet. The Shape object represents a single shape such as an AutoShape, a free-form shape, an OLE object (like an image), an ActiveX control or a picture. Possible parent objects of the Shapes collection are the Worksheet and Chart object.
The Shapes collection has a few methods and properties besides the typical collection attributes. They are listed in the following table.
Shapes Collection Properties and Methods
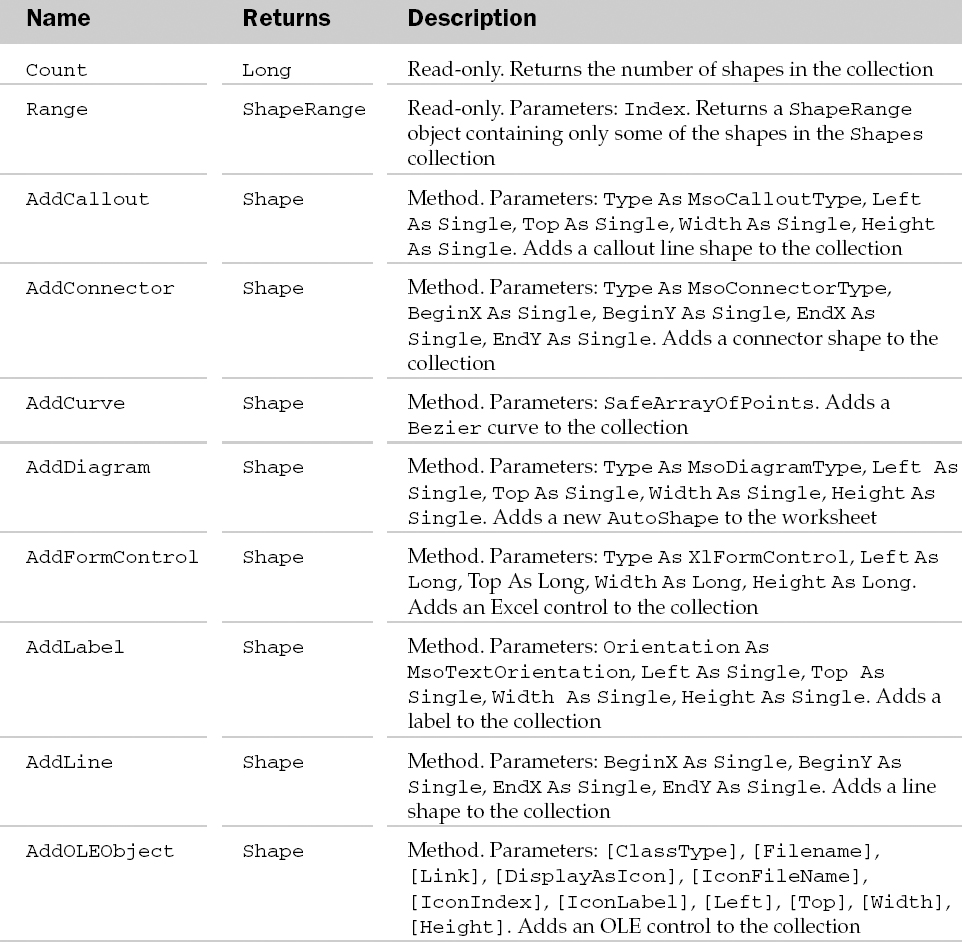
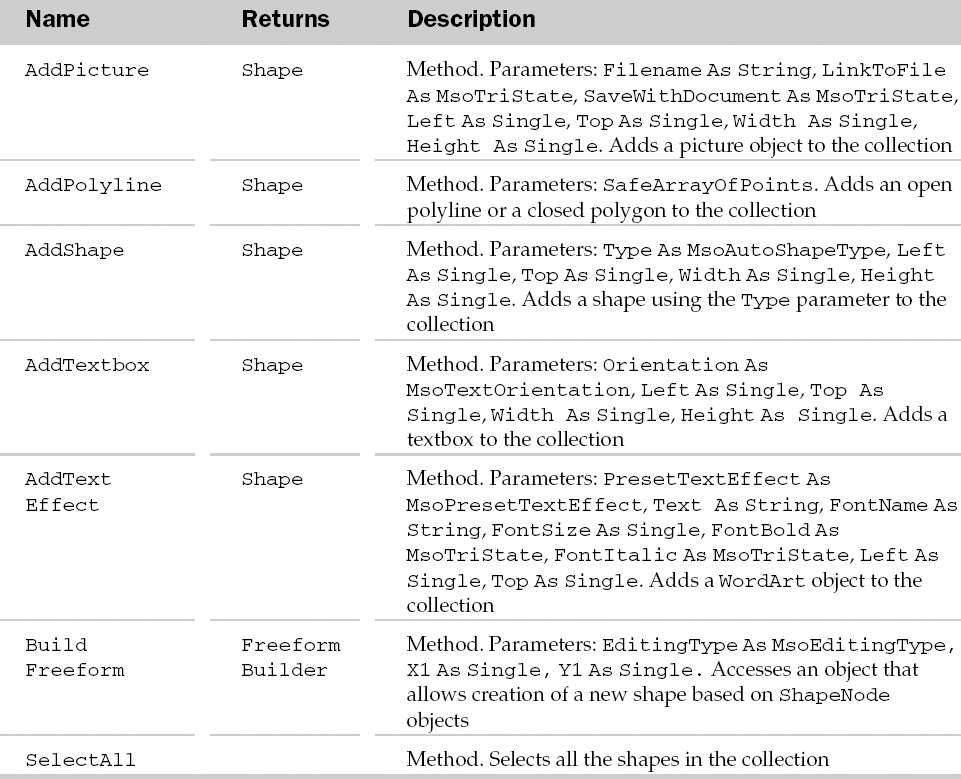
Shape Common Properties
The Application, Creator, and Parent properties are defined at the beginning of this Appendix.
Shape Properties
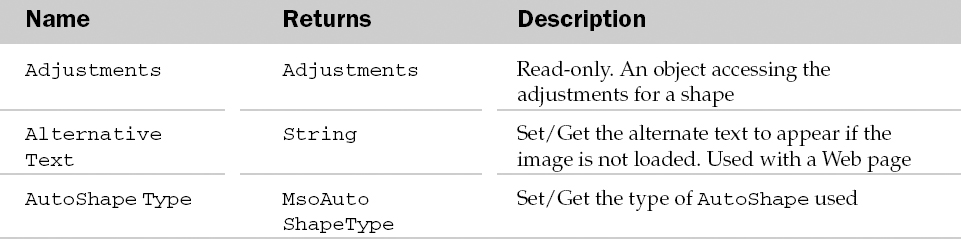
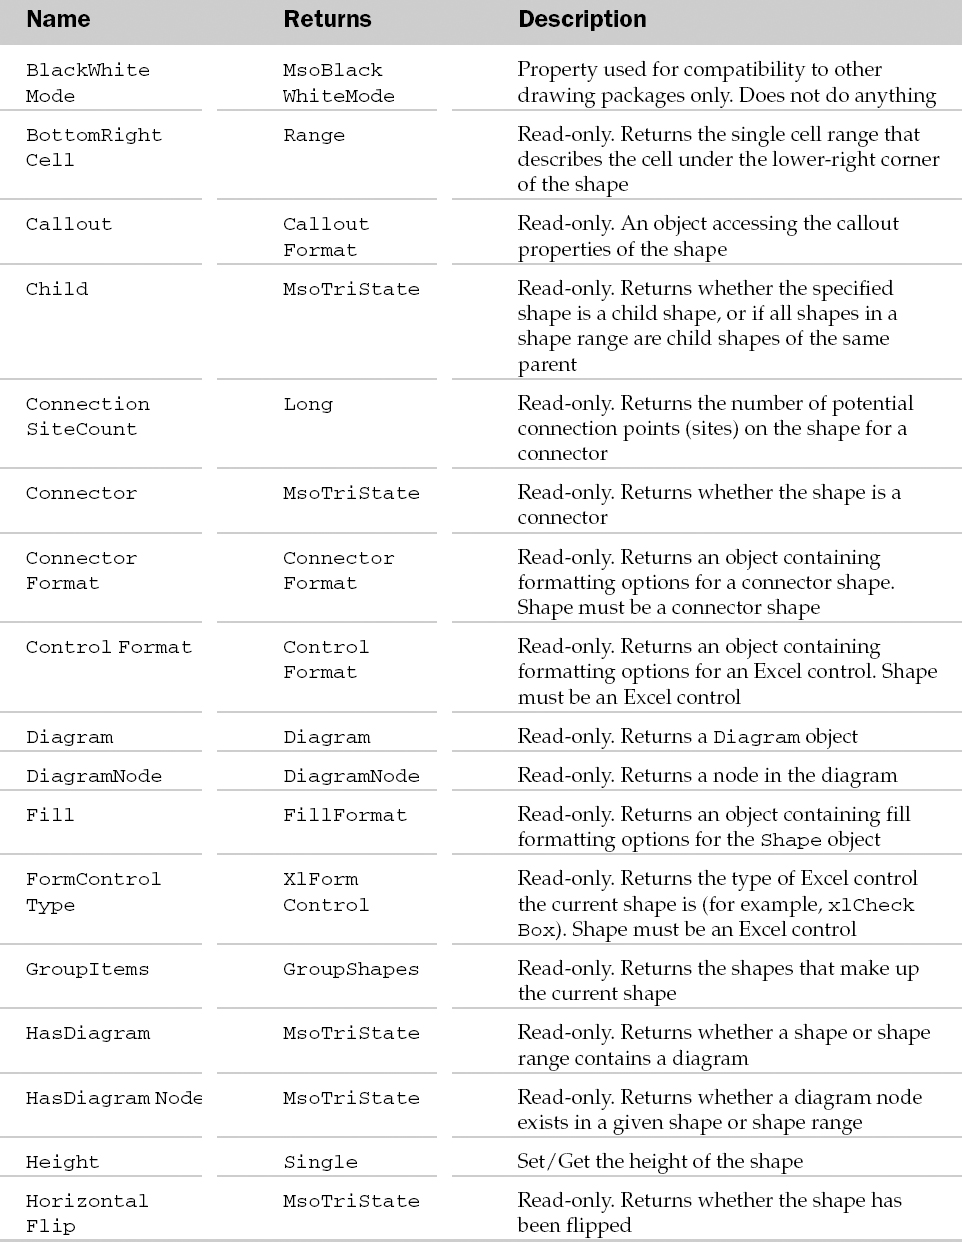
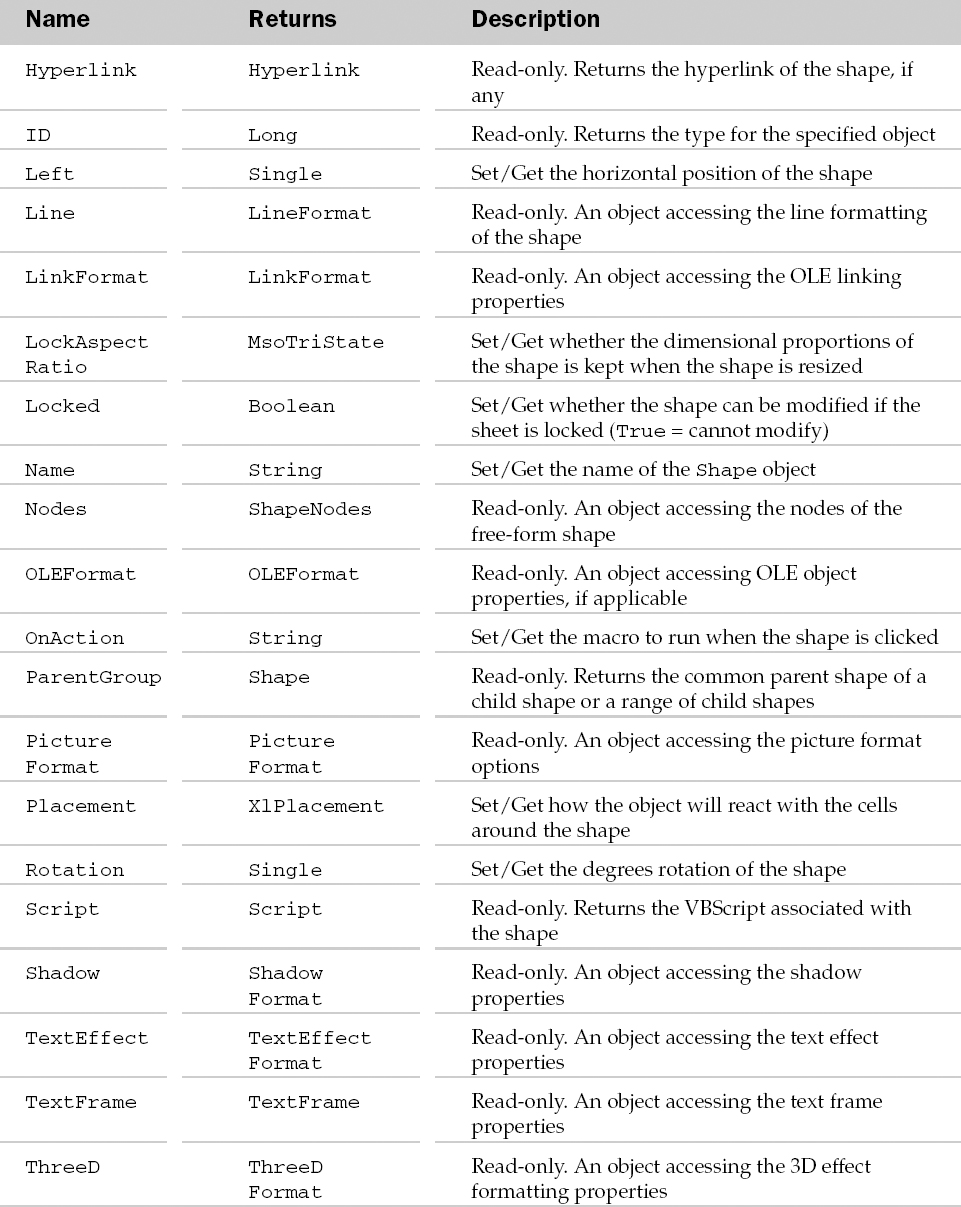
Shape Methods

Example: Shape Object and the Shapes Collection
The Shape object is a generic container object for other object types. Examples of using the Shapes collection and Shape object are included under the specific objects.
ShapeNode Object and the ShapeNodes Collection
The ShapeNodes collection has the list of nodes and curved segments that make up a free-form shape. The ShapeNode object specifies a single node or curved segment that makes up a free-form shape. The Nodes property of the Shape object is used to access the ShapeNodes collection.
The ShapeNodes collection has a few methods besides the typical collection attributes listed in the following table.
ShapeNodes Collection Properties and Methods
ShapeNode Common Properties
The Application, Creator, and Parent properties are defined at the beginning of this Appendix.
ShapeNode Properties
Example: ShapeNode Object and the ShapeNodes Collection
Sub ToggleArch()
   Dim oShp As Shape
   Dim oSN As ShapeNodes
   Set oShp = ActiveSheet.Shapes(1)
   'Is the Shape a freeform?
   If oShp.Type = msoFreeform Then

      'Yes, so get its nodes
      Set oSN = oShp.Nodes
      'Toggle segment 3 between a line and a curve
      If oSN.Item(3).SegmentType = msoSegmentCurve Then
         oSN.SetSegmentType 3, msoSegmentLine
      Else
         oSN.SetSegmentType 3, msoSegmentCurve
      End If
   End If
End Sub
ShapeRange Collection
The ShapeRange collection holds a collection of Shape objects for a certain range or selection in a document. Possible parent items are the Range and the Selection object. The ShapeRange collection has many properties and methods besides the typical collection attributes. These items are listed next.
However, some operations will cause an error if performed on a ShapeRange collection with multiple shapes.
ShapeRange Properties
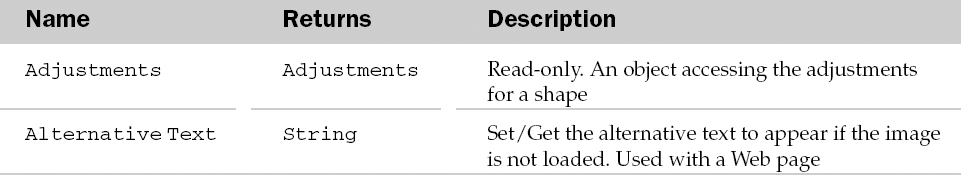
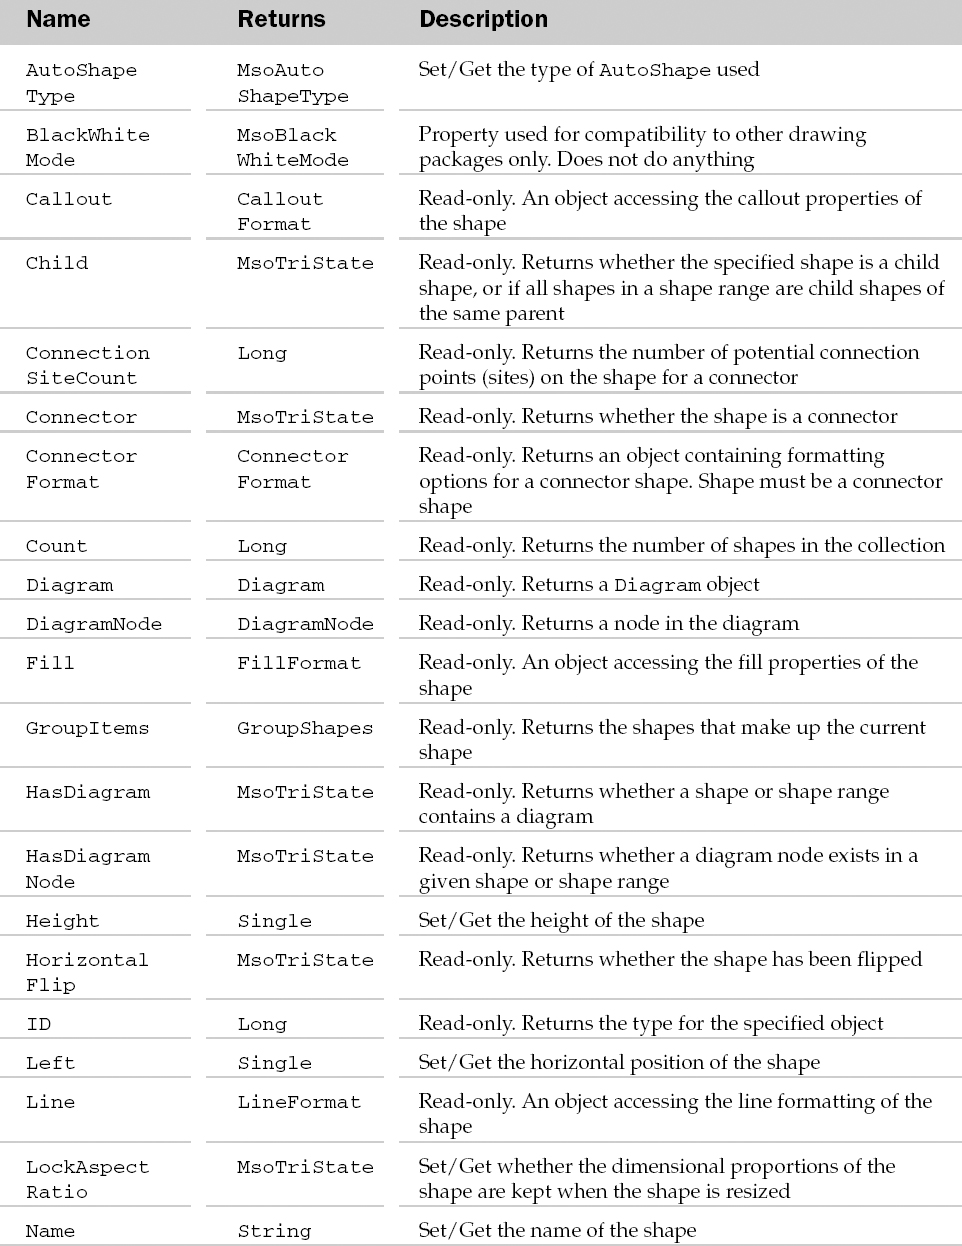
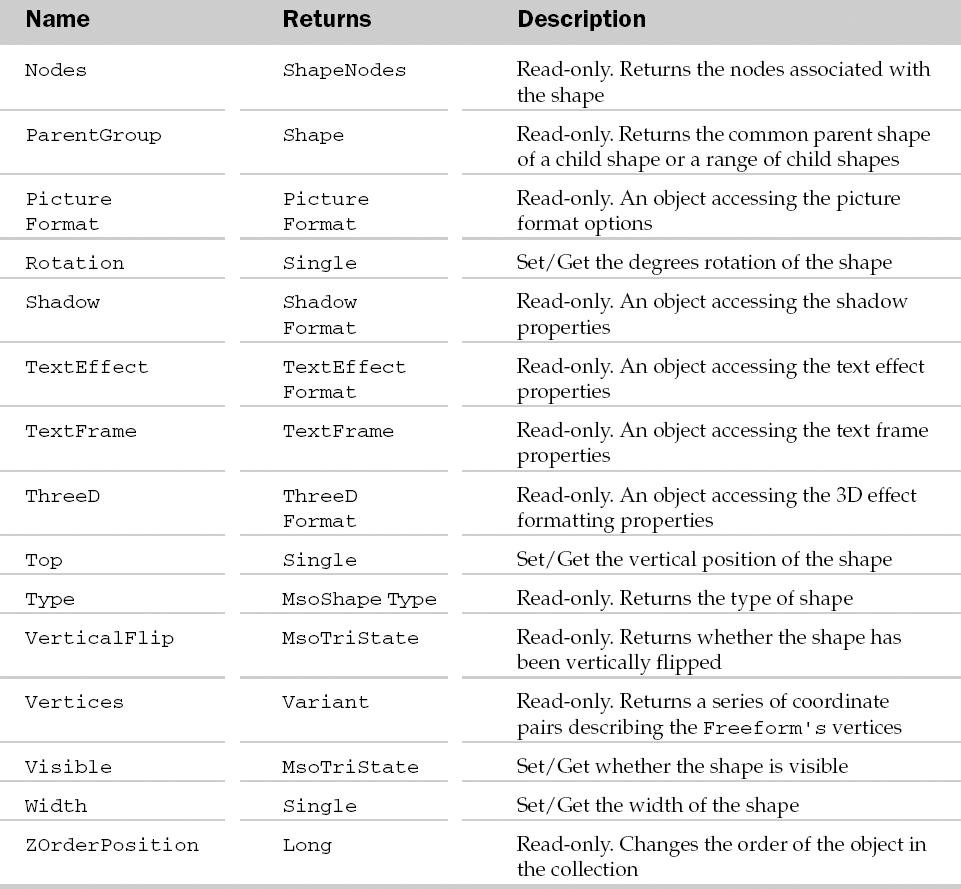
ShapeRange Methods
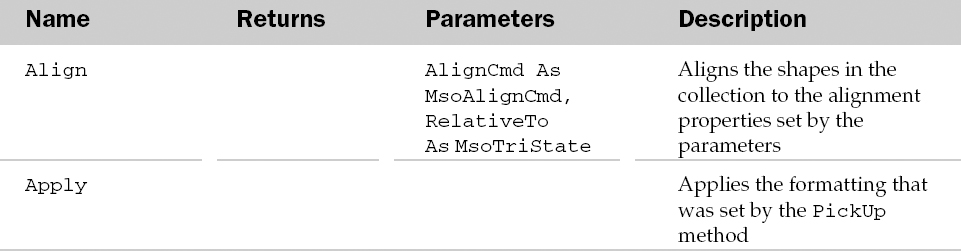
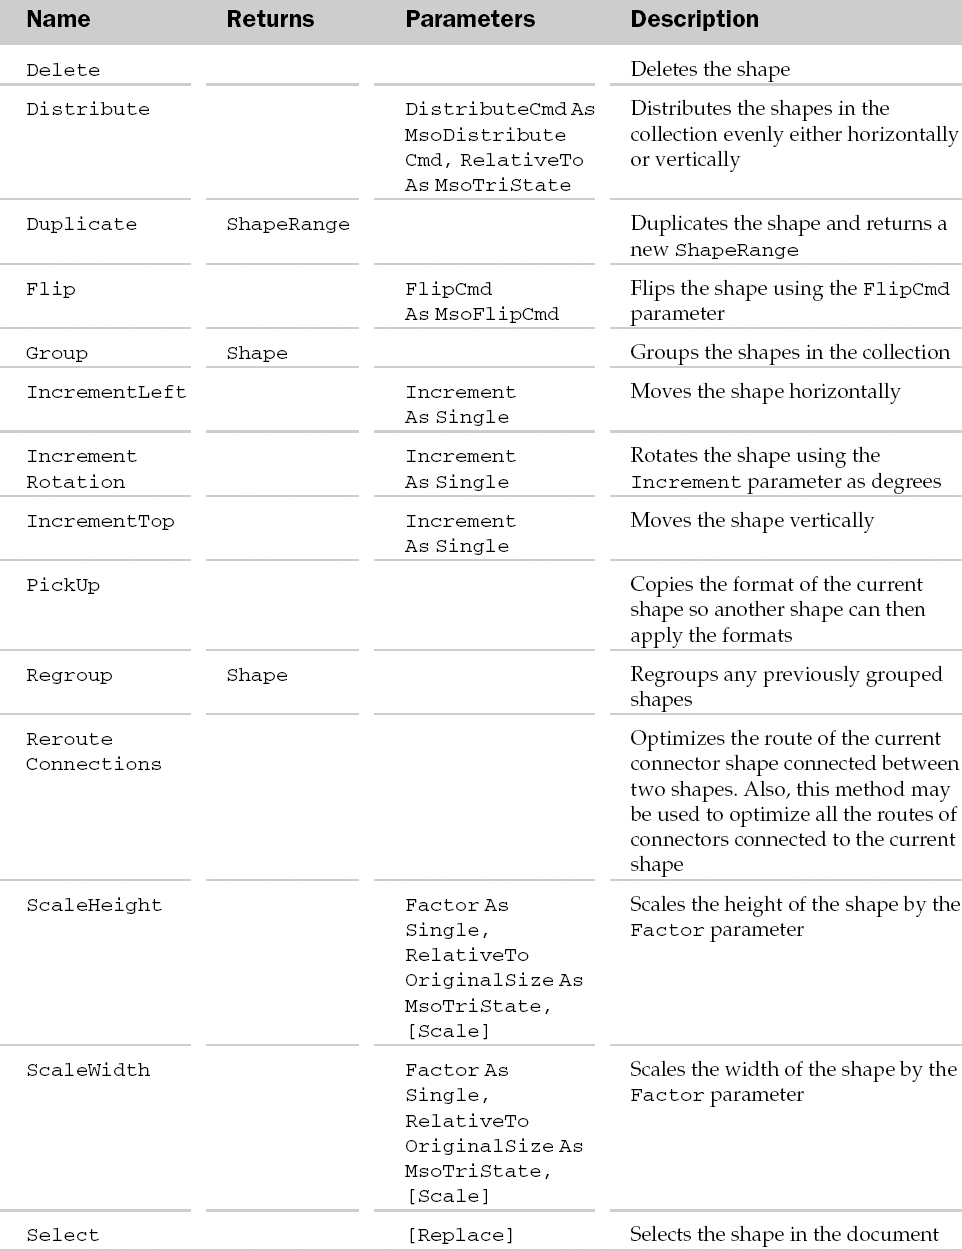

Example: ShapeRange Collection
Sub AlignShapeRanges()
   Dim oSR As ShapeRange
   'Get the first two shapes on the sheet
   Set oSR = ActiveSheet.Shapes.Range(Array(1, 2))
   'Align the left-hand edges of the shapes
   oSR.Align msoAlignLefts, msoFalse
End Sub
Sheets Collection
The Sheets collection contains all of the sheets in the parent workbook. Sheets in a workbook consist of chart sheets and worksheets. Therefore, the Sheets collection holds both the Chart objects and Worksheet objects associated with the parent workbook. The parent of the Sheets collection is the Workbook object.
Sheets Common Properties
The Application, Creator, and Parent properties are defined at the beginning of this Appendix.
Sheets Properties
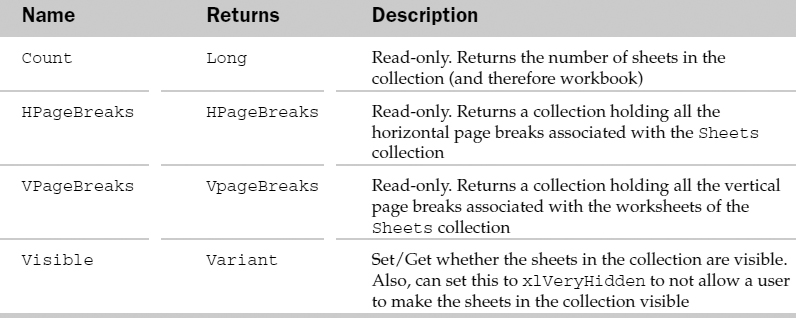
Sheets Methods
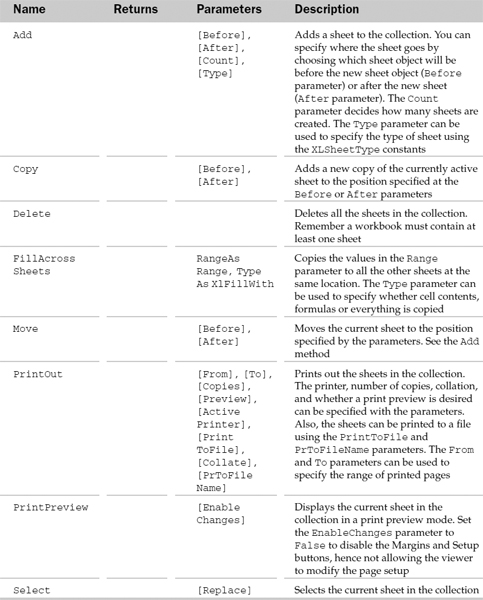
SmartTag Object and the SmartTags Collection Object
The SmartTag object represents an identifier that is assigned to a cell. Excel comes with many SmartTags, such as the Stock Ticker or Date recognizer, built in. However, you may also write your own SmartTags in Visual Basic. SmartTags are covered in detail in Chapter 18, but note that a degree of familiarity with XML is required to work with SmartTags.
The SmartTags collection represents all the SmartTags assigned to cells in an application.
SmartTag Common Properties
The Application, Creator, and Parent properties are defined at the beginning of this Appendix.
SmartTag Properties
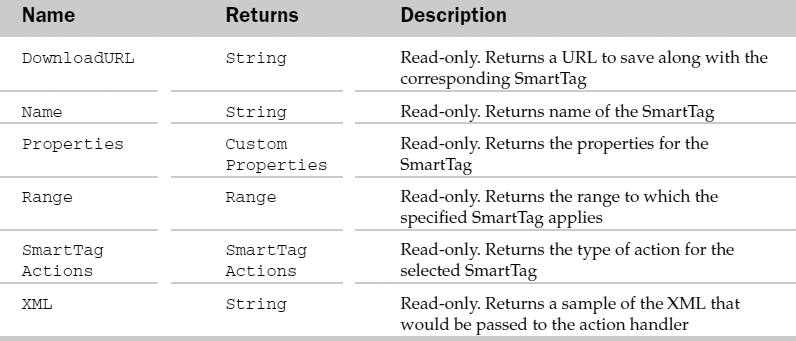
SmartTag Methods

Example: SmartTag Object
Note: This example is repeated in Chapter 18, in the Remove a Tag from a Range section.
One of the problems with SmartTags is the issue of false-positives, where a cell is erroneously tagged. An example is the standard Stock Symbol SmartTag that recognizes TRUE as a valid stock symbol, even if that TRUE is a Boolean True. The following code locates all of these false-positives and removes them:
Sub RemoveBooleanTrue()
   Dim oSht As Worksheet
   Dim oTag As SmartTag
   'This is the URI of the StockTicker SmartTag
   Const sTicker As String = _
                    “urn:schemas-microsoft-com:office:smarttags#stockticker”
   'Loop through all the worksheets in the active workbook
   For Each oSht In ActiveWorkbook.Worksheets
      'Loop through all the tags in the sheet
      For Each oTag In oSht.SmartTags
          'Is it a StockTicker tag with a Boolean value?
      If oTag.Name = sTicker And _
                         TypeName(oTag.Range.Value) = “Boolean” Then
     'Yes, so remove this SmartTag from the cell
     oTag.Delete
      End If
  Next Next
End Sub
SmartTagAction Object and the SmartTagActions Collection Object
The SmartTagAction object represents an action that can be performed by a SmartTag. This may involve displaying the latest price for a stock symbol, or setting up an appointment on a certain date.
The SmartTagActions collection represents all of the SmartTagAction objects in the application.
SmartTagAction Common Properties
The Application, Creator, and Parent properties are defined at the beginning of this Appendix.
SmartTagAction Properties
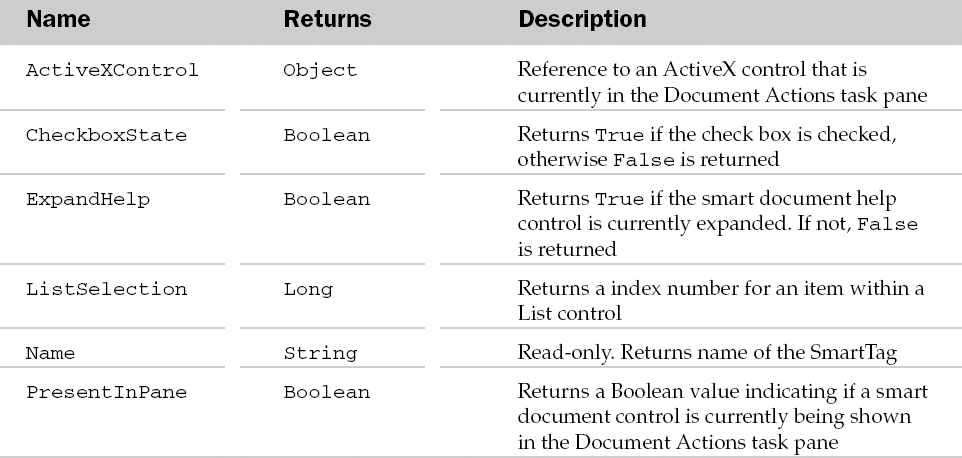
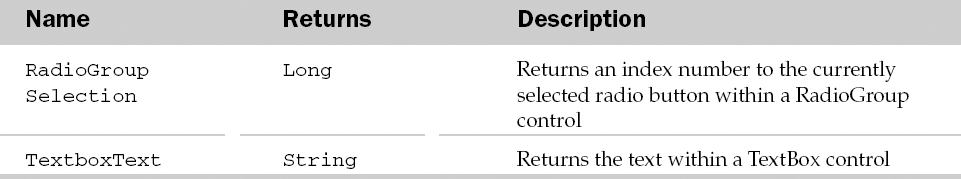
SmartTagAction Methods

SmartTagOptions Collection Object
The SmartTagOptions collection represents all the options of a SmartTag. For instance, it holds whether SmartTags should be embedded in the worksheet, or if they should be displayed at all.
SmartTagOptions Collection Properties
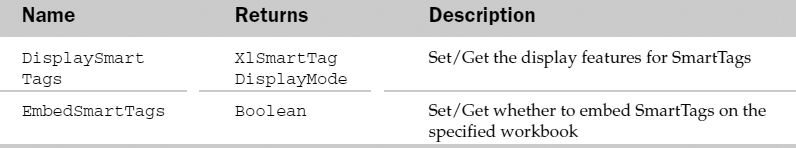
SmartTagReconizer Object and the SmartTagRecognizers Collection Object
The SmartTagReconizer object represents the recognizer engines that label the data in the worksheet. These can be user-defined, and as such any kind of information can be identified by SmartTags. See Chapter 18 for more details.
The SmartTagRecognizers collection represents all of the SmartTagRecognizer objects in the application.
SmartTagRecognizers Collection Properties
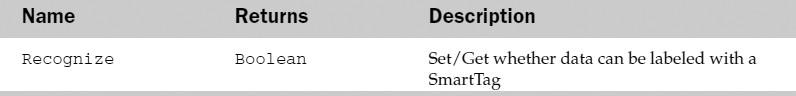
SmartTagRecognizer Common Properties
The Application, Creator, and Parent properties are defined at the beginning of this Appendix.
SmartTagRecognizer Properties
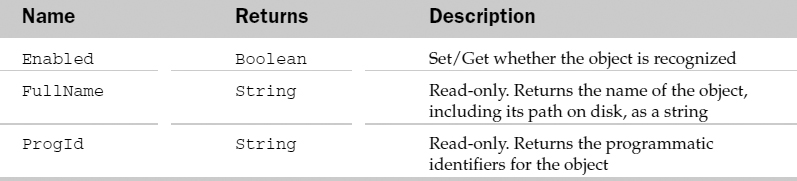
SoundNote Object
The SoundNote object is not used in the current version of Excel. It is kept here for compatibility purposes only. The list of its methods is shown next.
SoundNote Methods
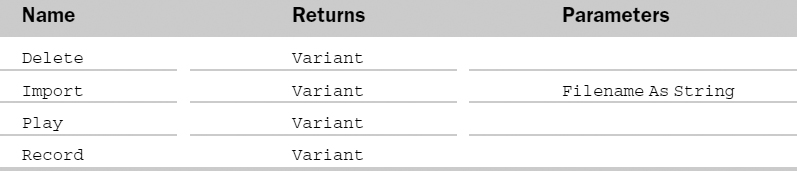
Speech Object
Represents the Speech recognition applet that comes with Office XP. This new Speech feature allows text to be read back on demand, or when you enter data on a document. For Excel, you have the option of having each cell's contents read back as they are entered on the worksheet. Use the SpeakCellOnEnter property of this object to enable this feature.
Speech is accessible through the Application object.
Speech Properties
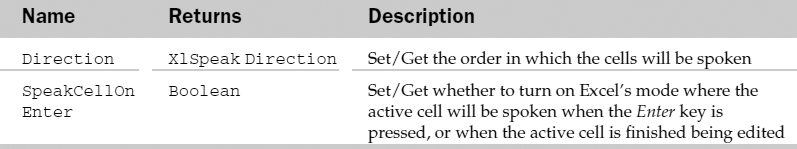
Speech Methods
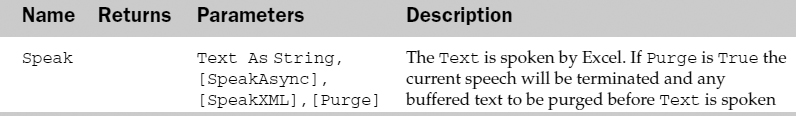
Example: Speech Object
The following routine reads off the expense totals for all items that are greater than a limit set in another cell on the sheet:
Sub ReadHighExpenses()

    Dim lTotal As Long
    Dim lLimit As Long
    Dim rng As Range

    'Grab the limitation amount
    lLimit = wksAllowEditRange.Range(“Limit”)

    'Loop through the expense totals
    For Each rng In wksAllowEditRange.Range(“Expenses”)
    'Store the current expense total
    lTotal = rng.0ffset(0, 5).Value

    'If the current total is greater than
    ' the limit, read it off
    If lTotal > lLimit Then
        Application.Speech.Speak rng.Text
        Application.Speech.Speak lTotal
    End If
    Next rng
End Sub
SpellingOptions Collection Object
Represents the spelling options in Excel. These options can be found on the Spelling tab of the Tools ![]() Options command and are accessed through the Application object. Hence this object is accessible through the Application object.
Options command and are accessed through the Application object. Hence this object is accessible through the Application object.
SpellingOptions Collection Properties
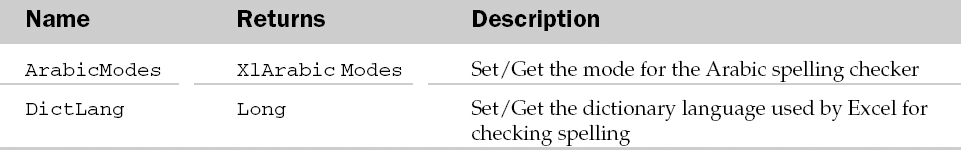
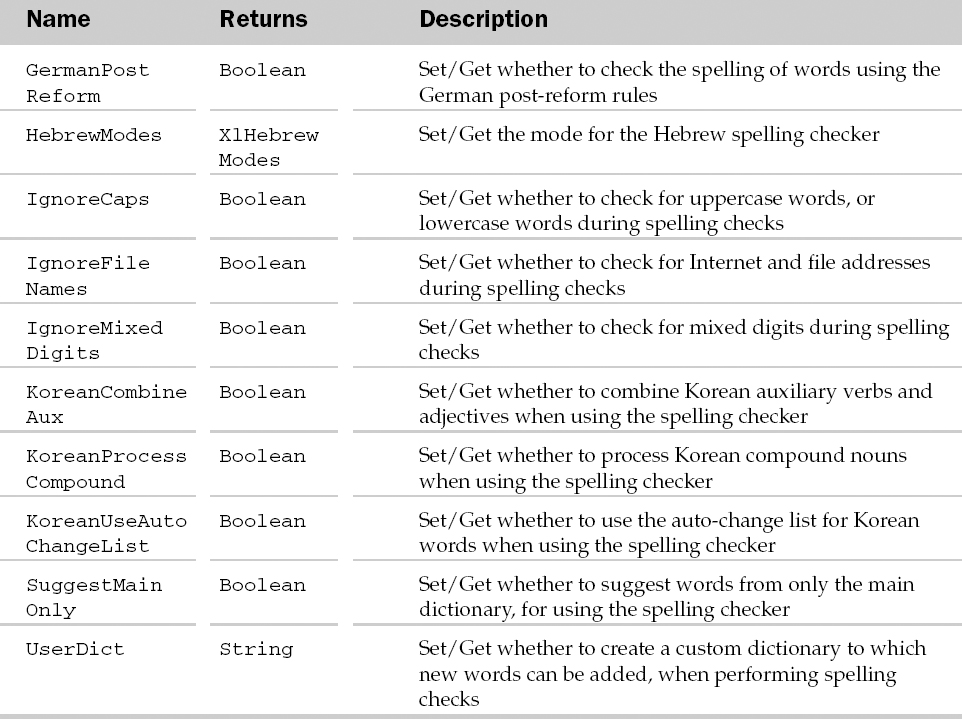
Example: SpellingOptions Collection Object
The following routine sets some spelling options and creates a new custom dictionary where added words during a spellcheck can be found:
Sub SetSpellingOptions()

    'This one is as simple as it gets
    With Application.SpellingOptions
         .IgnoreCaps = True
     .IgnoreFileNames = True
     .IgnoreMixedDigits = True
     .SuggestMainOnly = False

     'This property creates a custom dictionary
     ' called Wrox.dic, which can be found and directly edited
     ' in C:WINDOWSApplication DataMicrosoftProof.
     'Added words during a spellcheck will now appear
     ' in this custom dictionary.
    End Wish
Style Object and the Styles Collection
The Styles collection holds the list of user-defined and built-in formatting styles, such as Currency and Normal, in a workbook or range. Each Style object represents formatting attributes associated with the parent object. There are some Excel built-in Style objects, such as Currency. Also, new styles can be created. Possible parents of the Styles collection are the Range and Workbook objects.
Styles can be accessed by the end user using the Style dialog box from the Format ![]() Style menu.
Style menu.
The Styles collection has three extra attributes besides the typical collection ones. The Count property returns the number of Style objects in the collection. The Add method uses the Name parameter to add a new style to the collection. The BasedOn parameter of the Add method can be used to specify a range that the new style will be based on. The Merge method merges the styles in the workbook specified by the Workbook parameter into the current parent workbook.
Style Common Properties
The Application, Creator, and Parent properties are defined at the beginning of this Appendix.
Style Properties
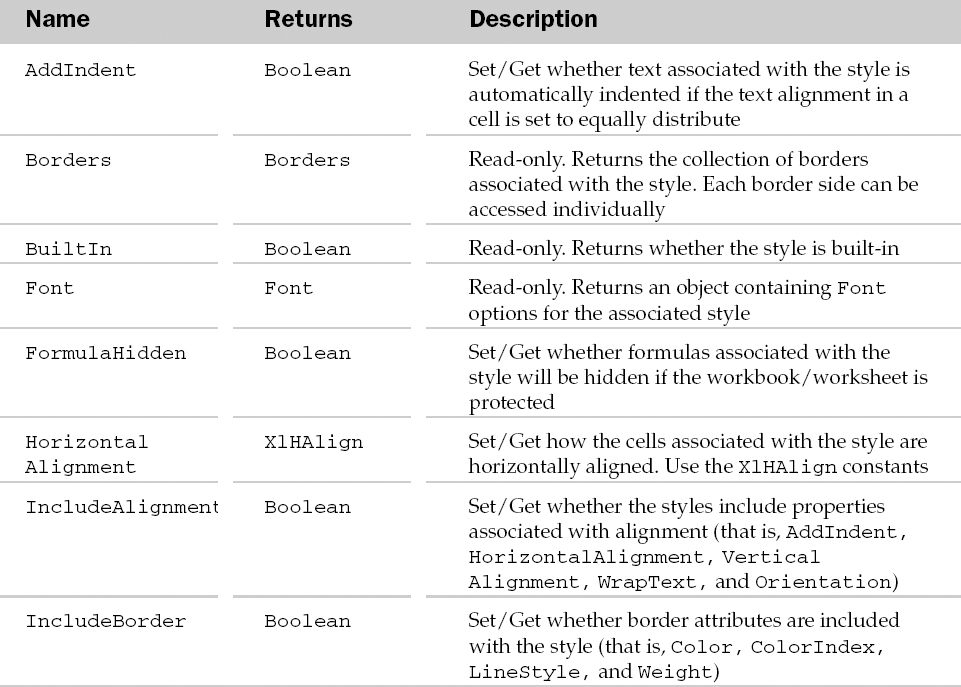
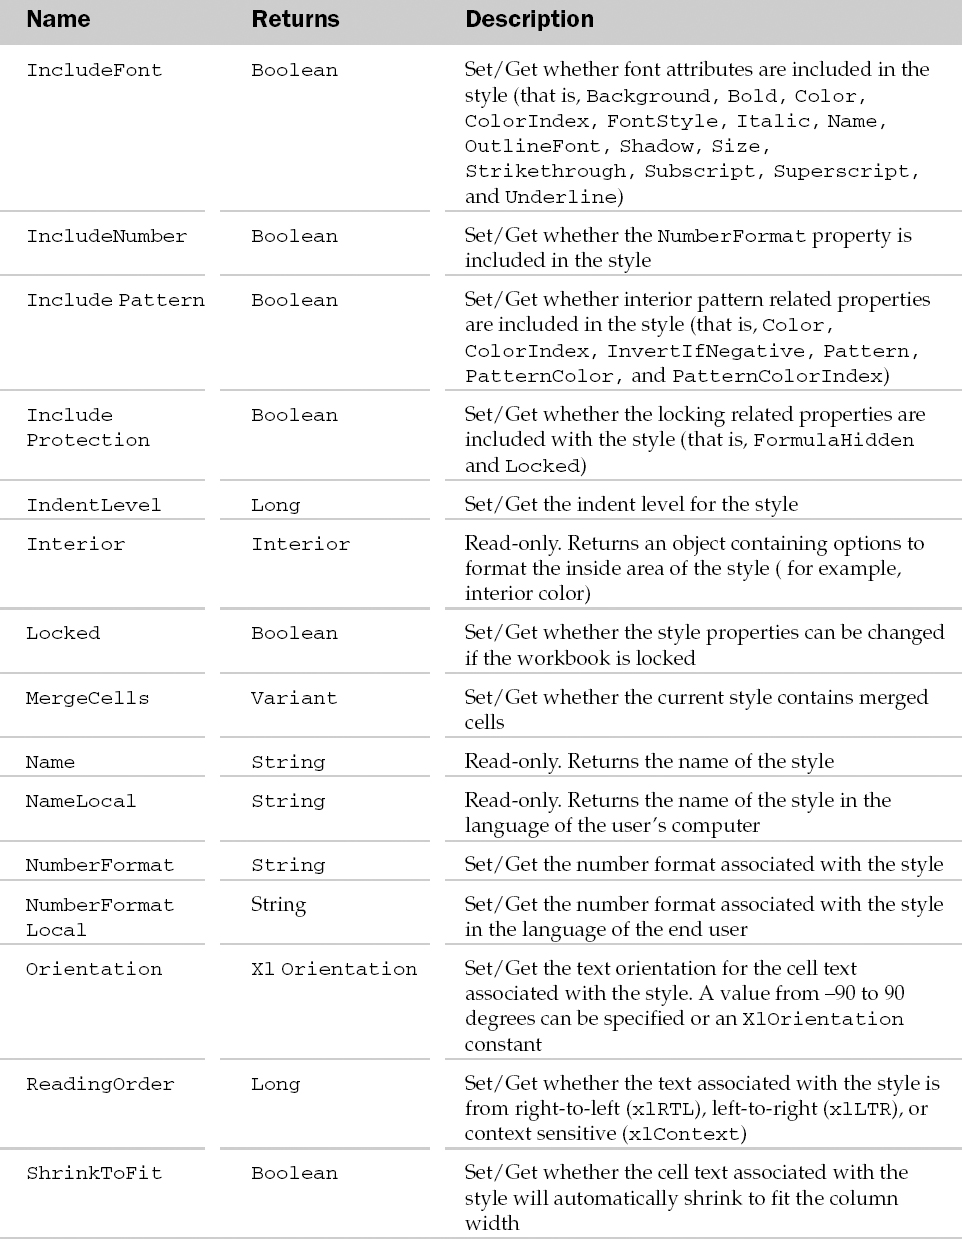
Style Methods

Example: Style Object and the Styles Collection
Sub UpdateStyles()
   Dim oStyle As Style
   Set oStyle = ActiveWorkbook.Styles(“Editing”)
   'Update the Editing style to be unlocked with a default background
   With oStyle
       .IncludePatterns = True
       .IncludeProtection = True
       .Locked = False
       .Interior.Pattern = xlNone
   End With
End Sub
Tab Object
Represents the Sheet tab at the bottom of an Excel chart sheet or worksheet. Excel 2003 now allows you to customize the sheet's tab color by using either the Color or ColorIndex properties of this object.
Note that when setting ColorIndex property of this object to xlColorIndexAutomatic (which appears on the AutoComplete list for the property), an error will occur.
Tab Common Properties
The Application, Creator, and Parent properties are defined at the beginning of this Appendix.
Tab Properties
Example: Tab Object
The following routine changes the tab color for all budget worksheet in a workbook based on a setting in a custom property for each worksheet:
Sub ColorBudgetTabs()
    Dim bBudget As Boolean
    Dim oCustomProp As CustomProperty
    Dim oCustomProps As CustomProperties
    Dim wks As Worksheet

    'Loop through each worksheet in this workbook
    For Each wks In ThisWorkbook.Worksheets
    'Loop through all of the custom properties
    ' for the current worksheet until the
    ' “IsBudget” proeprty name is found
    For Each oCustomProp In wks.CustomProperties
        If oCustomProp.Name = “IsBudget” Then
            'Grab its value and exit the loop
            bBudget = CBool(oCustomProp.Value)
             Exit For
        End If
    Next oCustomProp

    'Use the value in the custom property to determine
    ' whether the tab should be colored.
    If bBudget Then wks.Tab.ColorIndex = 20 'Light blue

    Next wks

End Sub
TextEffectFormat Object
The TextEffectFormat object contains all the properties and methods associated with WordArt objects. The parent object of the TextEffectFormat is always the Shape object.
TextEffectFormat Common Properties
The Application, Creator, and Parent properties are defined at the beginning of this Appendix.
TextEffectFormat Properties
TextEffectFormat Methods
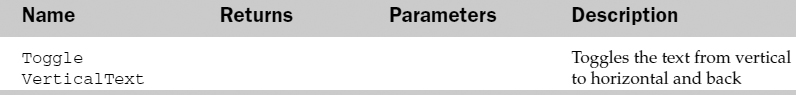
Example: TextEffectFormat Object
Sub FormatTextArt()
   Dim oTEF As TextEffectFormat
   Dim oShp As Shape
   Set oShp = ActiveSheet.Shapes(1)
   If oShp.Type = msoTextEffect Then
      Set oTEF = oShp.TextEffect

      With oTEF
         .FontName = “Times New Roman”
     .FontBold = True
         .PresetTextEffect = msoTextEffect14
     .Text = “Hello World!”
      End With
   End If
End Sub
TextFrame Object
The TextFrame object contains the properties and methods that can manipulate text-frame shapes. Possible parent objects of the TextFrame object are the Shape and ShapeRange objects.
TextFrame Common Properties
The Application, Creator, and Parent properties are defined at the beginning of this Appendix.
TextFrame Properties
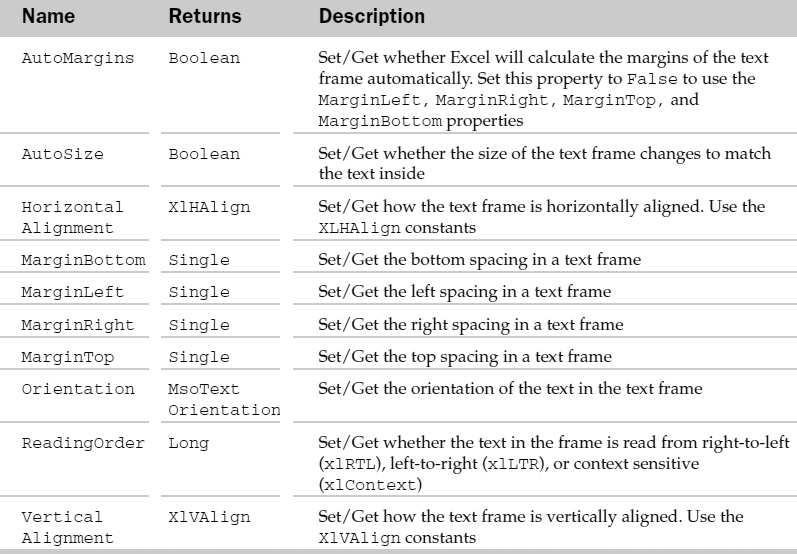
TextFrame Methods
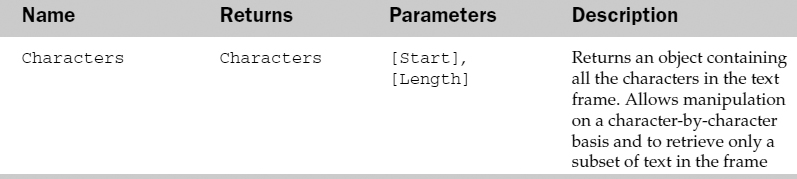
Example: TextFrame Object
Sub SetShapeAutoSized()
   Dim oTF As TextFrame
   Dim oShp As Shape
   Set oShp = ActiveSheet.Shapes(1)
   Set oTF = oShp.TextFrame
   oTF.AutoSize = True
End Sub
ThreeDFormat Object
The ThreeDFormat object contains all of the three-dimensional formatting properties of the parent Shape object. The ThreeD property of the Shape object is used to access the ThreeDFormat object.
ThreeDFormat Common Properties
The Application, Creator, and Parent properties are defined at the beginning of this Appendix.
ThreeDFormat Properties
ThreeDFormat Methods
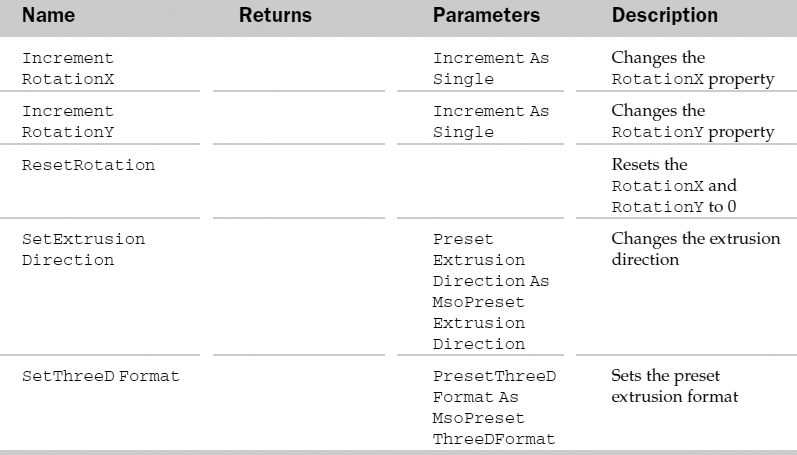
Example: ThreeDFormat Object
Sub SetShape3D()
   Dim o3DF As ThreeDFormat
   Dim oShp As Shape
   Set oShp = ActiveSheet.Shapes(1)
   Set o3DF = oShp.ThreeD
   With o3DF
     .Depth =10
     .SetExtrusionDirection msoExtrusionBottomRight
   End With
End Sub
TickLabels Object
The TickLabels object contains the formatting options associated with the tick-mark labels for tick marks on a chart axis. The parent of the TickLabels object is the Axis object.
TickLabels Common Properties
The Application, Creator, and Parent properties are defined at the beginning of this Appendix.
TickLabels Properties
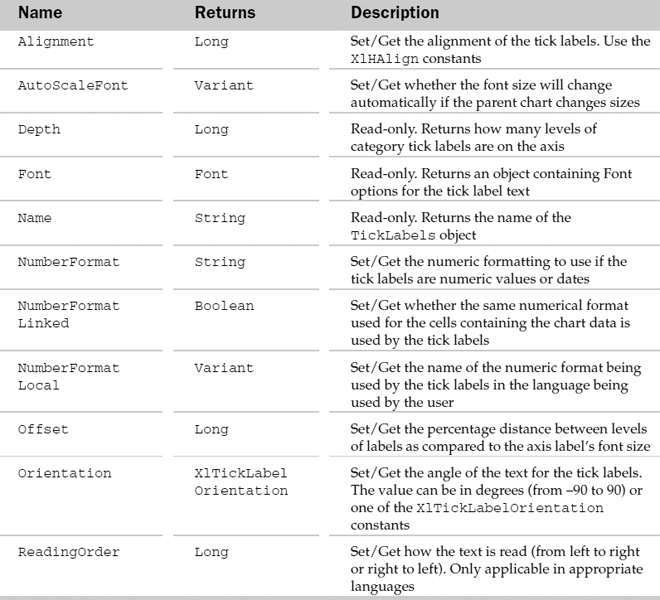
TickLabels Methods
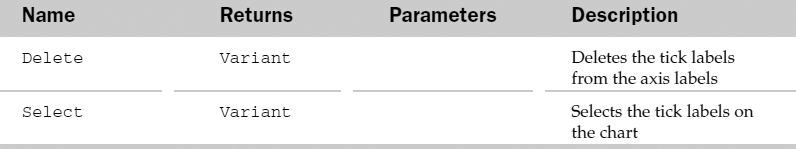
Example: TickLabels Object
Sub FormatTickLabels()
   Dim oTL As TickLabels
   Set oTL = Charts(1).Axes(xlValue).TickLabels
   With oTL
      .NumberFormat = “#,##0”
      .Font.Size = 12
   End With
End Sub
TreeviewControl Object
The TreeviewControl object allows manipulation of the hierarchical member-selection of a cube field. This object is usually used by macro recordings and not when building VBA code. The parent of the TreeviewControl object is the CubeField object.
TreeviewControl Common Properties
The Application, Creator, and Parent properties are defined at the beginning of this Appendix.
TreeviewControl Properties
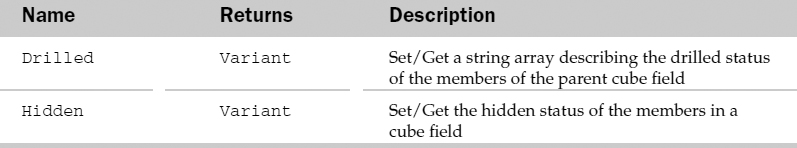
Trendline Object and the Trendlines Collection
The Trendlines collection holds the collection of trendlines in a chart. Each TrendLine object describes a trendline on a chart of a particular series. Trendlines are used to graphically show trends in the data and help predict future values. The parent of the Trendlines collection is the Series object.
The Trendlines collection has one property and one method besides the typical collection attributes. The Count property returns the number of TrendLine objects in the collection. The Add method adds a trendline to the current chart. The Add method has a Type, Order, Period, Forward, Backward, Intercept, DisplayEquation, DispayRSquared, and Name parameter. See the Trendline Properties section for more information.
Trendline Common Properties
The Application, Creator, and Parent properties are defined at the beginning of this Appendix.
Trendline Properties
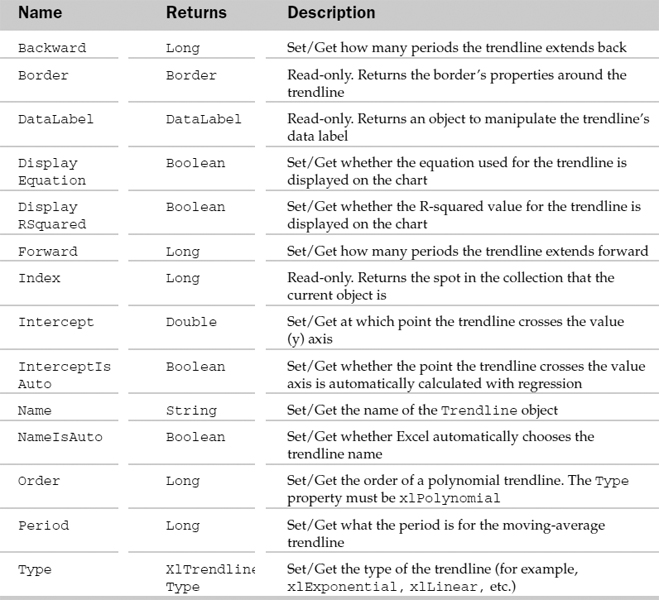
Trendline Methods
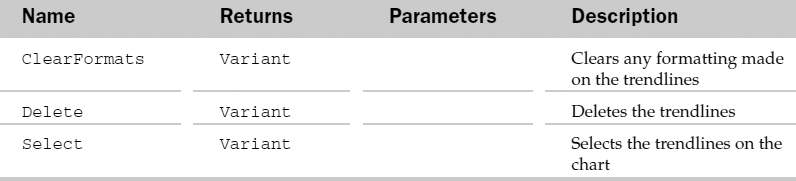
Example: Trendline Object and the Trendlines Collection
Sub AddTrendLine()
   Dim oSer As Series
   Dim oTL As Trendline
   Set oSer = Charts(1).SeriesCollection(1)
   Set oTL = oSer.Trendlines.Add(xlLinear)
   With oTL
     .DisplayEquation = True
     .DisplayRSquared = True
   End With
End Sub
UpBars Object
The UpBars object contains formatting options for up bars on a chart. The parent of the UpBars object is the ChartGroup object. To see if this object exists, use the HasUpDownBars property of the ChartGroup object.
UpBars Common Properties
The Application, Creator, and Parent properties are defined at the beginning of this Appendix.
UpBars Properties
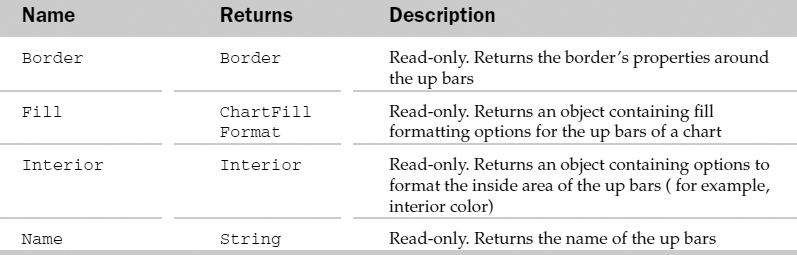
UpBars Methods
Example: UpBars Object
Sub AddAndFormatUpBars()
   Dim oUpBars As UpBars
   'Add Up/Down bars to the chart
   Charts(1).ChartGroups(1).HasUpDownBars = True
   'Get the collection of UpBars
   Set oUpBars = Charts(1).ChartGroups(1) .UpBars
   'Format the up bars
   With oUpBars
      .Interior.ColorIndex = 3
      .Interior.Pattern = xlSolid
   End With
End Sub
UsedObjects Collection Object
Represents the total amount of objects currently being used in all open workbooks. Used objects can be worksheets, chart sheets, the workbook itself, and any ActiveX controls placed on worksheets. This object can be referenced through the Application object.
Note that in addition to the common collection properties defined earlier, UsedObjects has the Item and Count properties.
Example: UsedObjects Collection Object
The following routine lists all of the parent objects of the UsedObjects collection:
Sub CountUsedObjects()
    Dim lCount As Long
    Dim oUsedObjs As UsedObjects
    'Turn off the screen
    Application.ScreenUpdating = False

    'Store the used object collection
    Set oUsedObjs = Application.UsedObjects

    'Clear the old list
    wksUsedObjects.UsedRange.Offset(1, 0).Resize(, 1).ClearContents
    'Loop through and list the parents of all of the objects
    'Cannot seem to grab the name/caption/… of the object itself
    For lCount = 1 To oUsedObjs.Count
        wksUsedObjects.Range(“ListStart”).Cells(lCount, 1) =
oUsedObjs.Item(lCount).Parent.Name
     Next lCount
End Sub
UserAccess Collection Object
Represents one user within a possible group of users who have permission to access a range specified by the AllowEditRange object. You can refer to a user by using the Item property of the UserAccessList object. Once referenced, you use the properties of this object to change the user's settings.
UserAccess Collection Properties
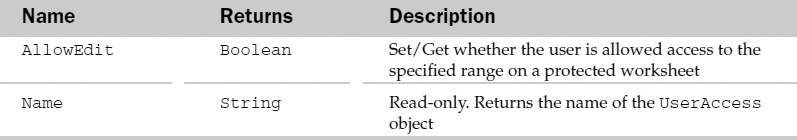
UserAccess Collection Methods

UserAccessList Collection Object
Represents a list of users who have access to a protected range on a worksheet. This object can be accessed via the AllowEditRange object after it's been created. Use the Add method of this object to add a user to the list, which contains an argument that determines whether or not they need a password to access the range.
Note that the password is set using the ChangePassword method of the AllowEditRange object. This means that all of the users for an AllowEditRange use the same password. Note that this collection only has Count and Item properties.
UserAccessList Methods
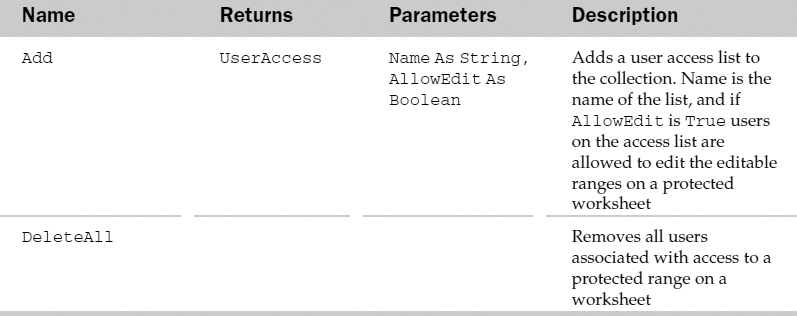
Example: UserAccessList Object
The following routine loops through all of the AllowEditRange objects on a specified worksheet and removes all of the users except for the range pcNetSales:
Sub DeleteAllUsers()

    Dim oAllowRange As AllowEditRange

    'Loop through all of the AllowEditRange objects on the
    ' specified worksheet
    For Each oAllowRange In wksAllowEditRangeWProtectionWAllowEditRanges
        'Remove all names from all AllowEditRanges
    ' except for the range whose AllowEditRange Title
    ' is pcNetSales
   If oAllowRange.Title <> “pcNetSales” Then
      oAllowRangeWUsersWDeleteAll
   End If
  Next oAllowRange

End Sub
Validation Object
The Validation object contains properties and methods to represent validation for a range in a worksheet. The Range object is the parent of the Validation object.
Validation Common Properties
The Application, Creator, and Parent properties are defined at the beginning of this Appendix.
Validation Properties
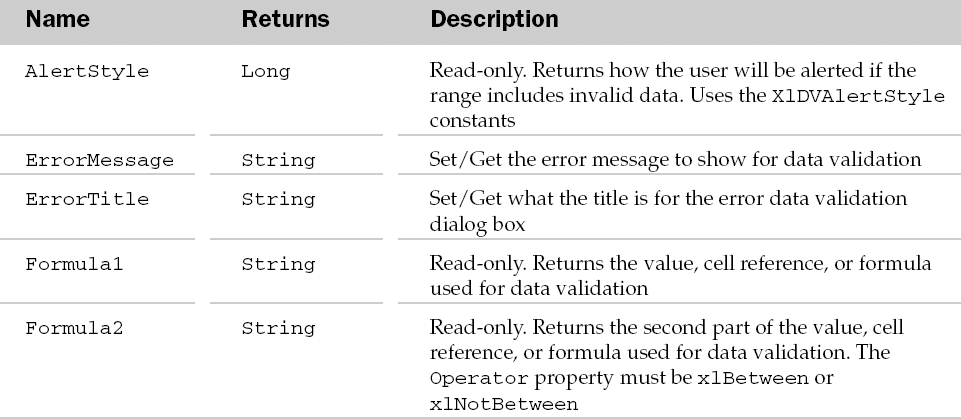
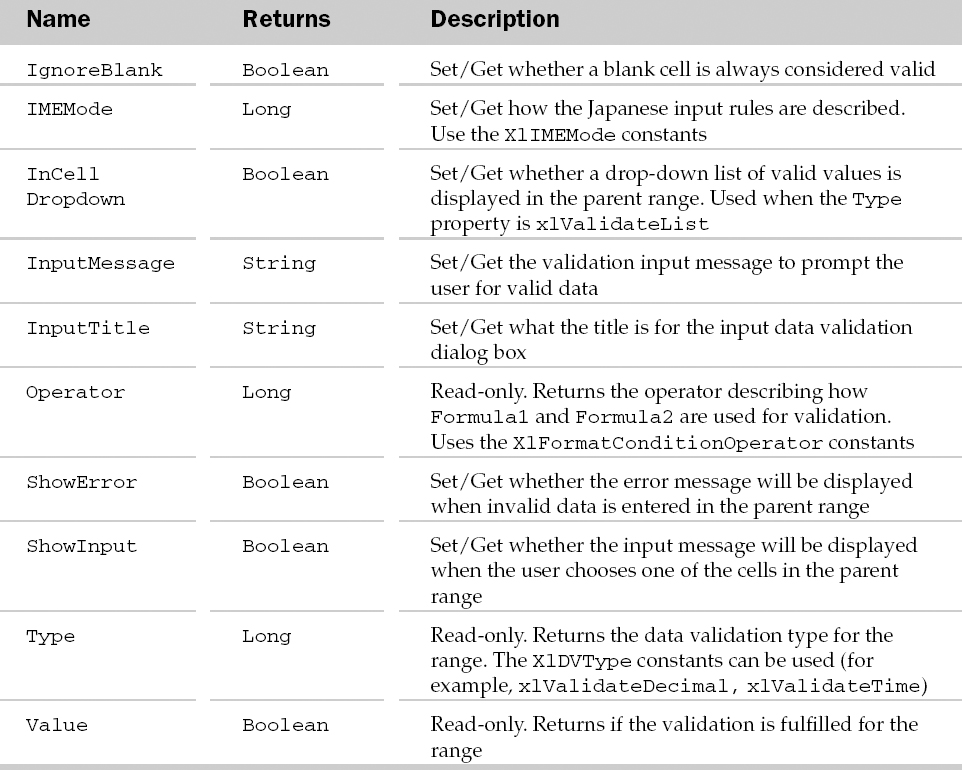
Validation Methods
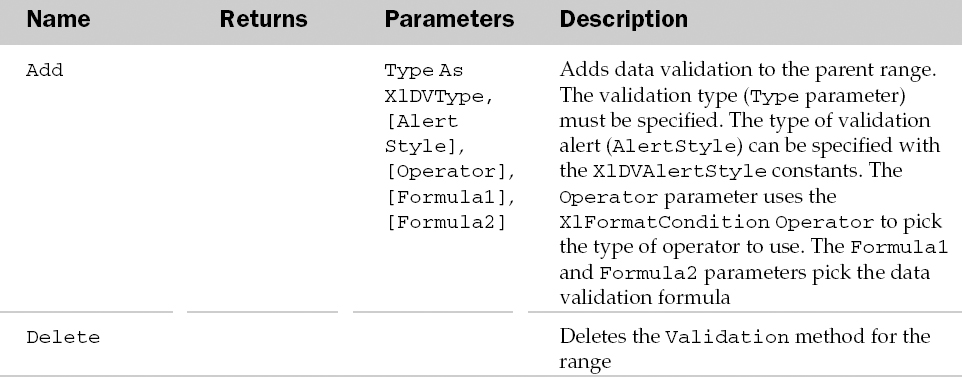

Example: Validation Object
Sub AddValidation()
   Dim oValid As Validation
   Set oValid = Selection.Validation
   With oValid
      .Delete
      .Add Type:=xlValidateWholeNumber, AlertStyle:=xlValidAlertStop,_
        Operator:=xlBetween, Formula1:=“10M, Formula2:=”20“
  .ShowInput = False
  .ShowError = True
  .ErrorTitle = “Error”
  .ErrorMessage = “Number must be between 10 and 20”
 End With
End Sub
VPageBreak Object and the VPageBreaks Collection
The VPageBreaks collection contains all of the vertical page breaks in the printable area of the parent object. Each VPageBreak object represents a single vertical page break for the printable area of the parent object. Possible parents of the VPageBreaks collection are the WorkSheet and the Chart objects.
The VPageBreaks collection contains one property and one method besides the typical collection attributes. The Count property returns the number of VPageBreak objects in the collection. The Add method is used to add a VPageBreak object to the collection (and vertical page break to the sheet). The Add method has a Before parameter to specify the range to the right of where the vertical page break will be added.
VPageBreak Common Properties
The Application, Creator, and Parent properties are defined at the beginning of this Appendix.
VPageBreak Properties
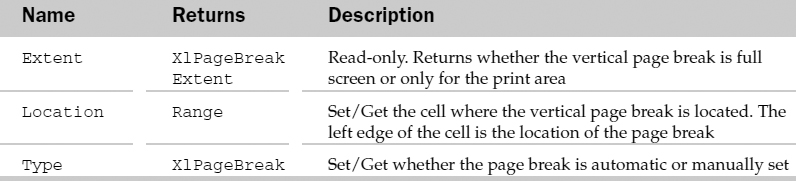
VPageBreak Methods
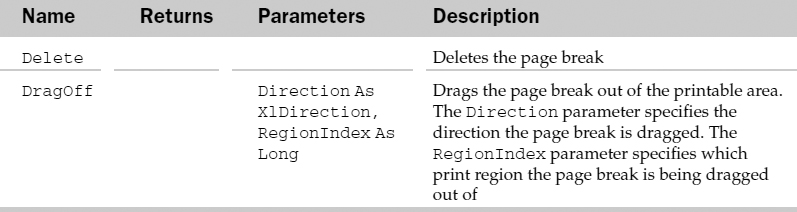
Example: VPageBreak Object and the VPageBreaks Collection
Sub AddVPageBreaks()
   Dim oCell As Range
   'Loop through all the cells in the first column of the sheet
   For Each oCell In ActiveSheet.UsedRange.Rows(1). Cells
       'If the font size is 16, add a page break to the left of the cell
       If oCell.Font.Size = 16 Then
          ActiveSheetWVPageBreaksWAdd oCell
       End If
    Next
End Sub
Walls Object
The Walls object contains formatting options for all the walls of a 3D chart. The walls of a 3D chart cannot be accessed individually. The parent of the Walls object is the Chart object.
Walls Common Properties
The Application, Creator, and Parent properties are defined at the beginning of this Appendix.
Walls Properties
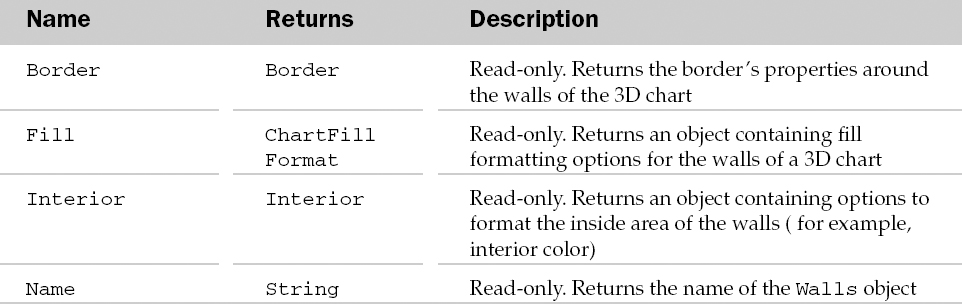
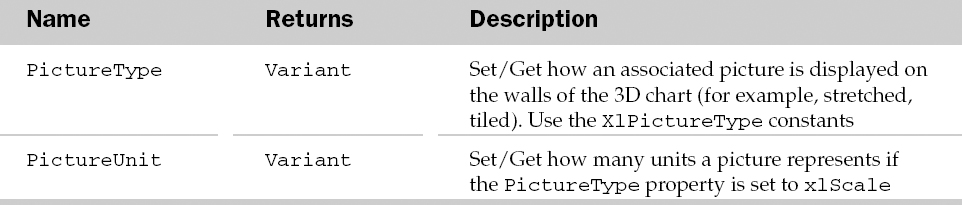
Walls Methods
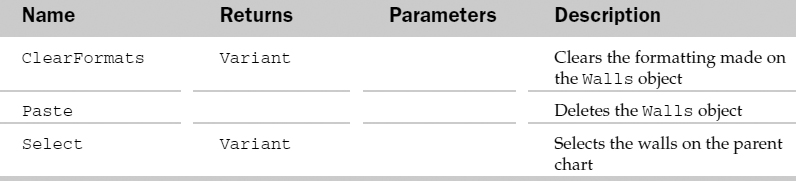
Example: Walls Object
Sub FormatWalls()
  Dim oWall As Walls
  Set oWall = Charts(1).Walls
  With oWall
     .Fill.PresetTextured msoTextureCork
     .Fill.Visible = True
  End With
End Sub
Watch Object and the Watches Collection Object
The Watch object represents one Watch in the Watch window (View ![]() Toolbars
Toolbars ![]() Watch Window). Each Watch can be a cell or cell range you need to keep track of as other data on the worksheet changes. A Watch object is an auditing tool similar to the watches you can create in the VBE. Watches do just that, they keep track of a cell or cell range, allowing you to study changes to those cells when other data on the worksheet changes.
Watch Window). Each Watch can be a cell or cell range you need to keep track of as other data on the worksheet changes. A Watch object is an auditing tool similar to the watches you can create in the VBE. Watches do just that, they keep track of a cell or cell range, allowing you to study changes to those cells when other data on the worksheet changes.
The Watches collection contains all the Watch objects that have been set in the application.
Watches Collection Methods
Watch Common Properties
The Application, Creator, and Parent properties are defined at the beginning of this Appendix.
Watch Properties
Watch Methods

Example: Watch Object
The following routine prompts the user for a range, then loops through each cell in the range and adds it to the Watch Window. It then displays the Watch Window:
Sub AddWatches()
    Dim oWatch As Watch
    Dim rng As Range
    Dim rngWatches As Range

    'Prompt the user for a range
    'Supress the error if they cancel
    0n Error Resume Next
        Set rngWatches = Application.InputBox(_
          “Please select a cell or cell range to watch”,    “Add Watch”, , , , , , 8)
    0n Error GoTo 0

    'If they selected a range
    If Not rngWatches Is Nothing Then
        'Loop through each cell and
        ' add it to the watch list
        For Each rng In rngWatches
            Application.Watches.Add rng
       Next rng
   End If
   'View the watch window based on their answer
   Application.CommandBars(“Watch Window”).Visible = (Not rngWatches
Is Nothing)

End Sub
WebOptions Object
The WebOptions object contains attributes associated with opening or saving Web pages. The parent of the WebOptions object is the Workbook object. The properties set in the WebOptions object override the settings of the DefaultWebOptions object.
WebOptions Common Properties
The Application, Creator, and Parent properties are defined at the beginning of this Appendix.
WebOptions Properties
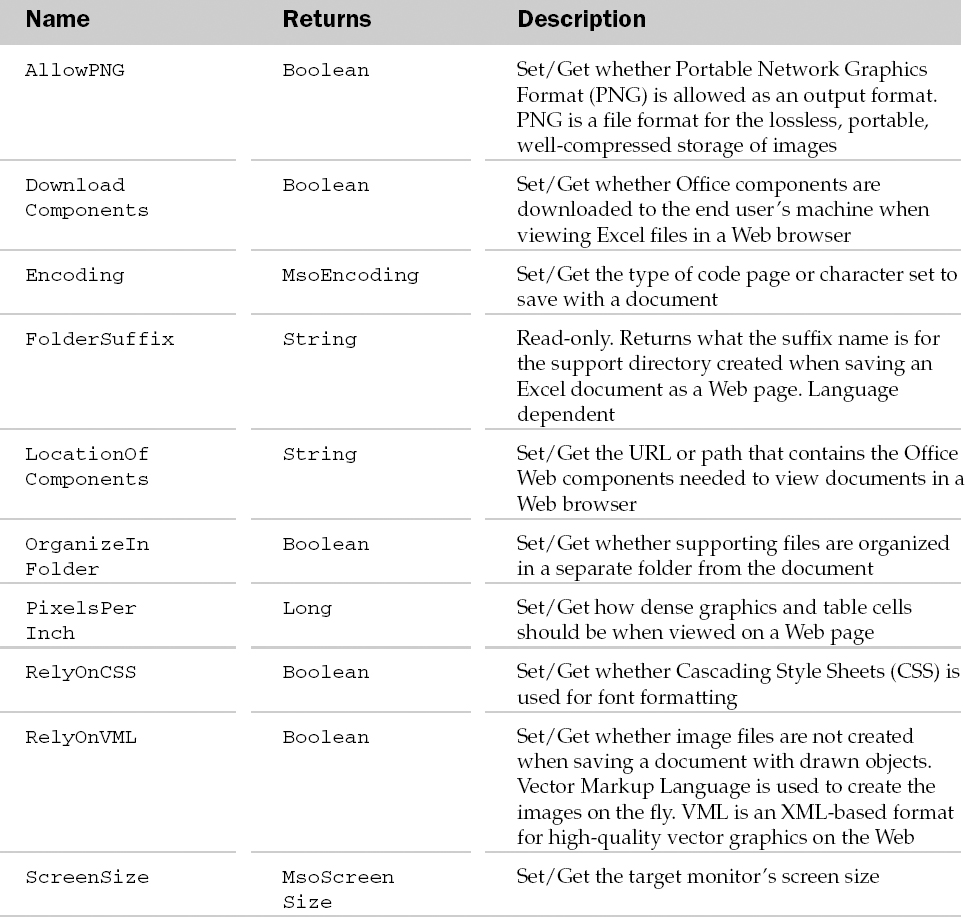
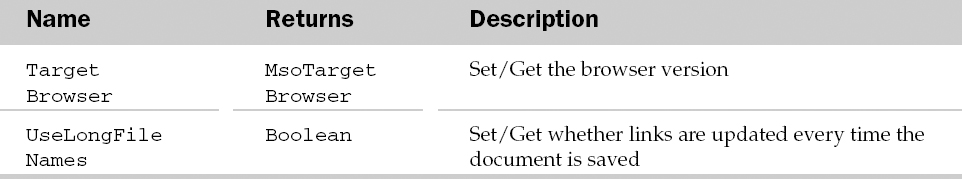
WebOptions Methods
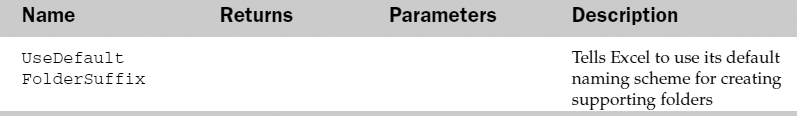
Example: WebOptions Object
Sub SetWebOptions()
  Dim oWO As WebOptions
  Set oWO = ActiveWorkbook.WebOptions
  With oWO
    .ScreenSize = msoScreenSize800x600
    .RelyOnCSS = True
    .UseDefaultFolderSuffix
   End With
End Sub
Window Object and the Windows Collection
The Windows collection holds the list of windows used in Excel or in a workbook. Each Window object represents a single Excel window containing scrollbars and gridlines for the window. The parents of the Windows collection can be the Application object and the Workbook object.
The Windows collection has a Count property and an Arrange method besides the typical collection attributes. The Count property returns the number of Window objects in the collection. The Arrange method arranges the windows in the collection in the manner specified by the ArrangeStyle parameter. Use the XlArrangeStyle constants to set the ArrangeStyle parameter. Set the ActiveWorkbook parameter to True to arrange only the windows associated with the open workbook. Set the SyncHorizontal parameter or the SyncVertical parameter to True so the windows will scroll horizontally or vertically together, respectively.
Window Common Properties
The Application, Creator, and Parent properties are defined at the beginning of this Appendix.
Window Properties
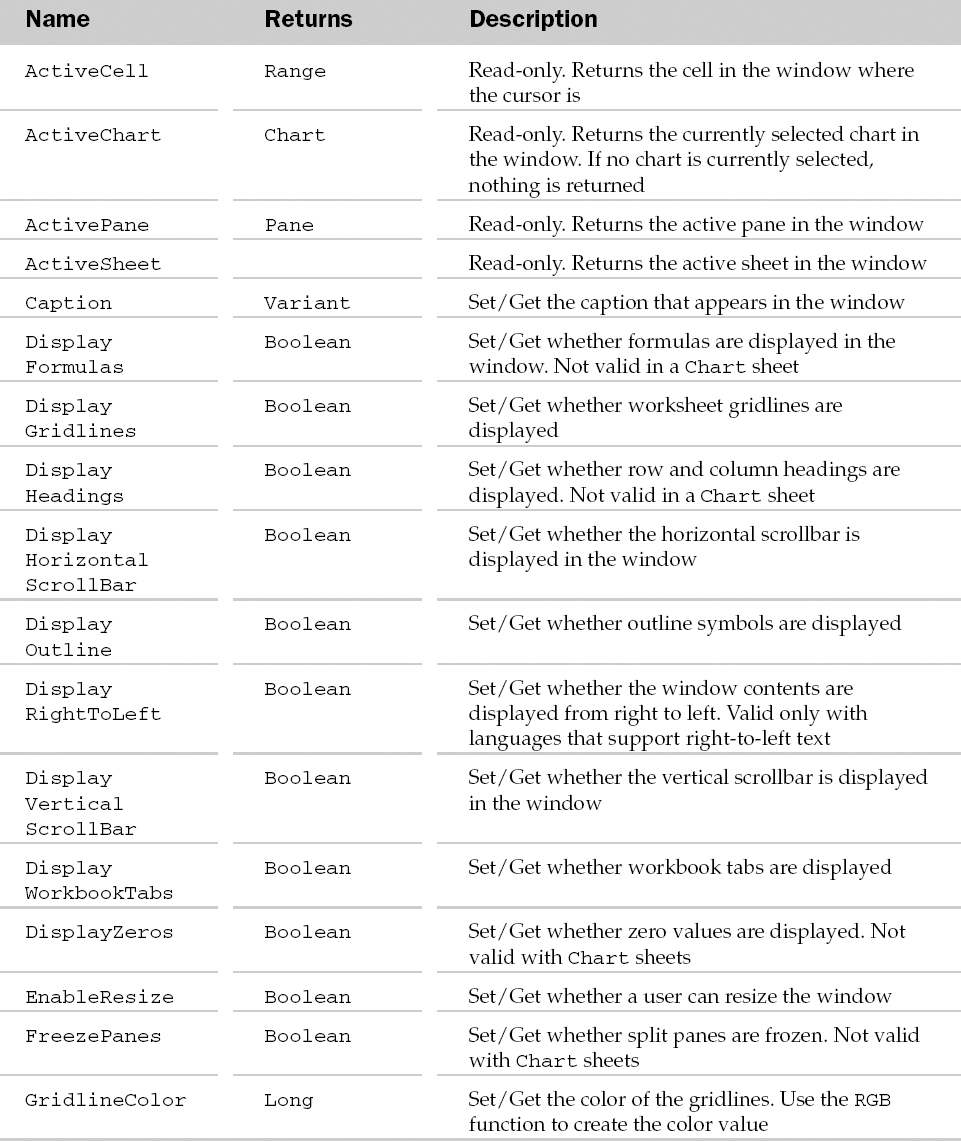
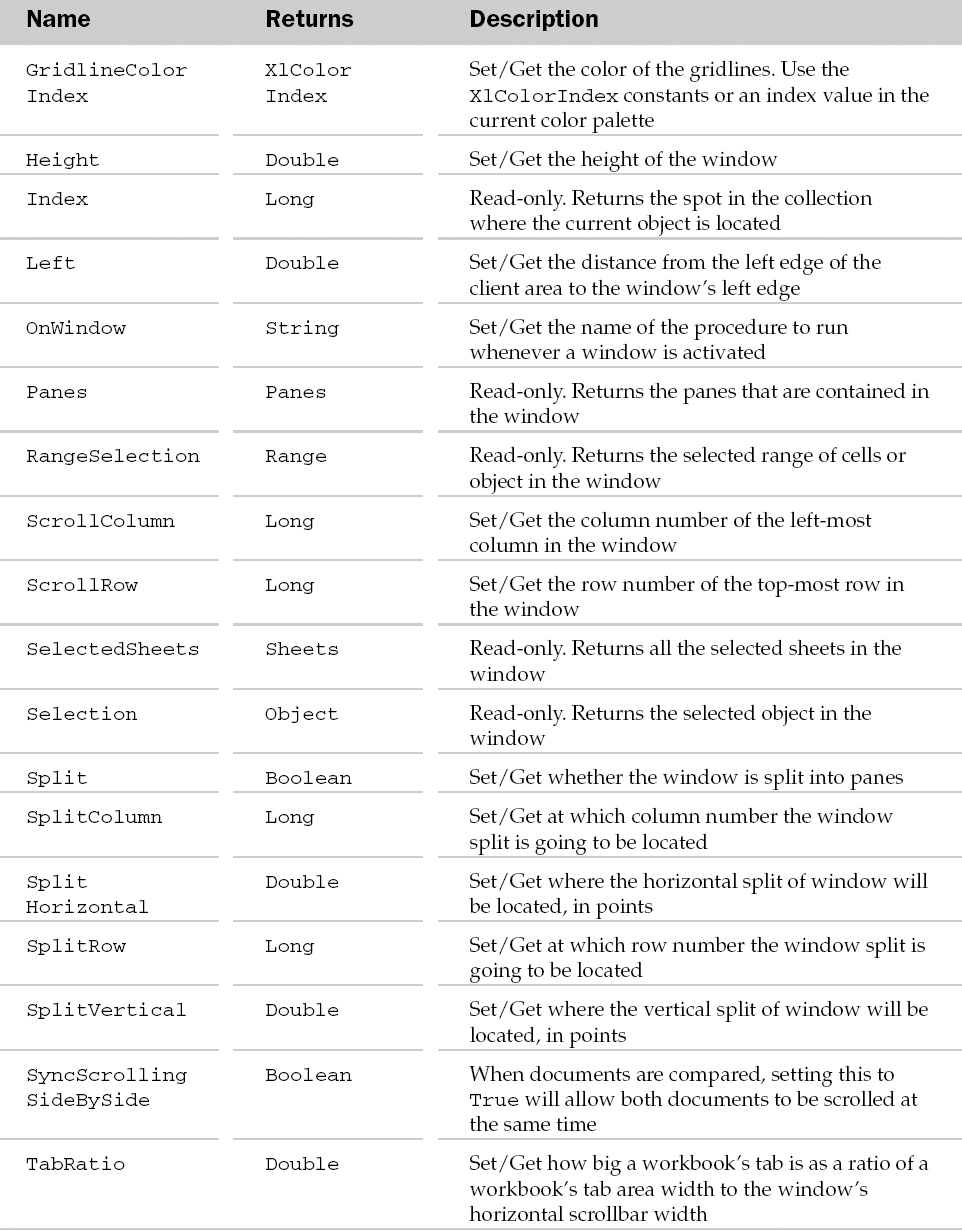
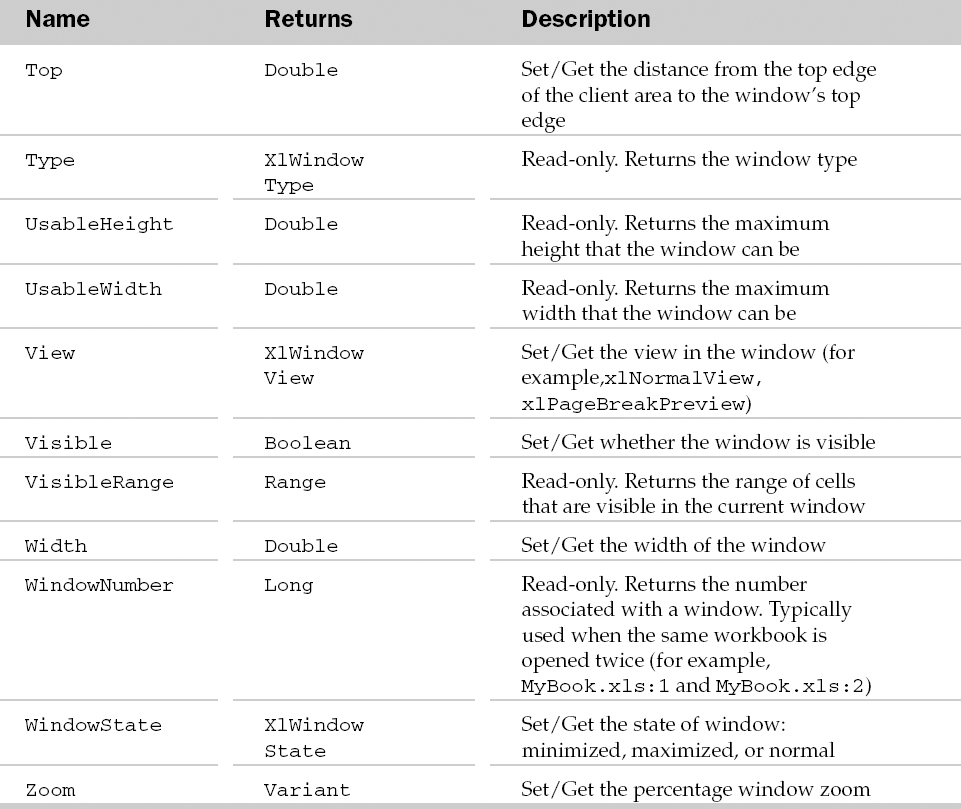
Window Methods
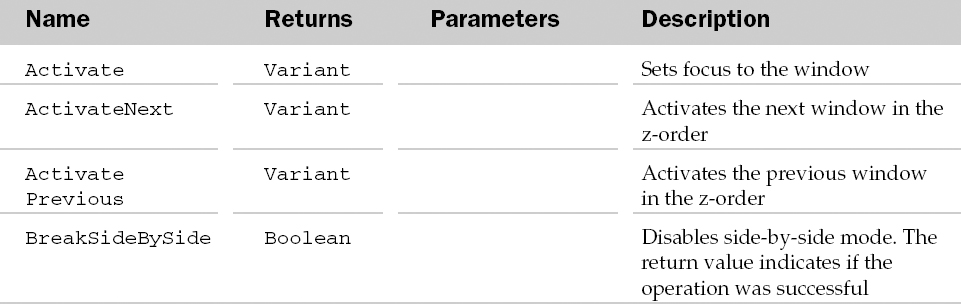
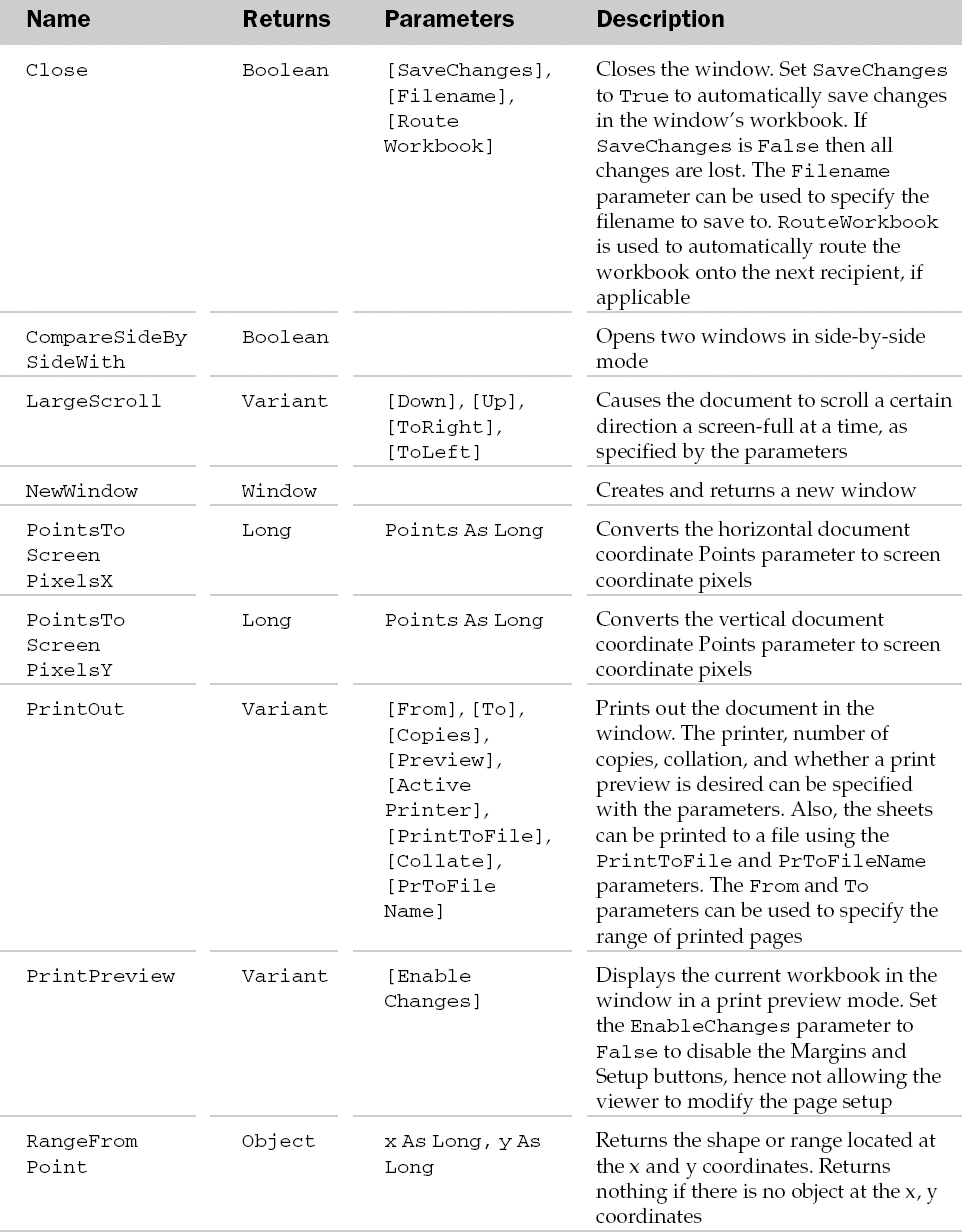
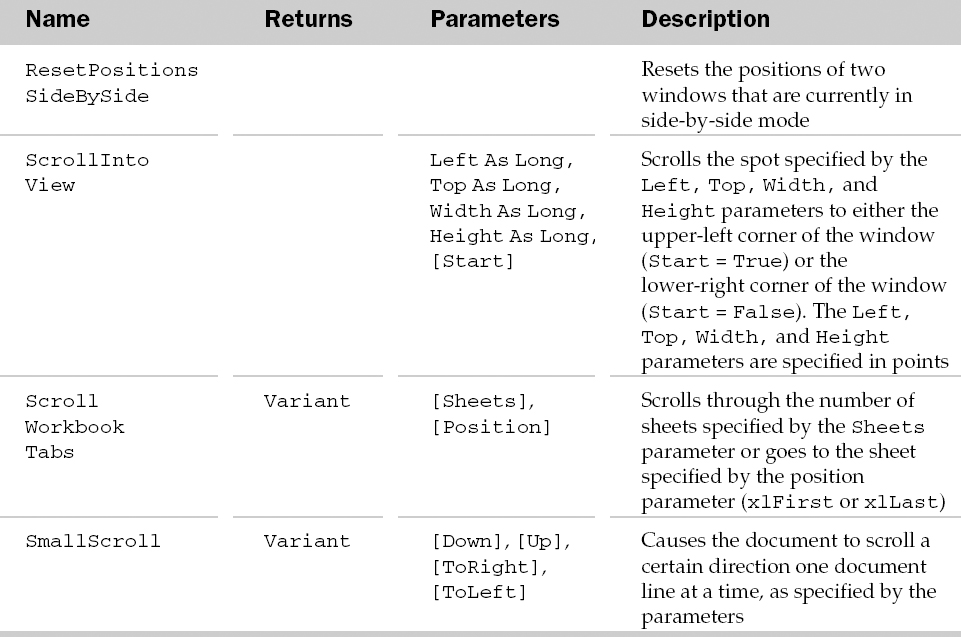
Example: Window Object and the Windows Collection
Sub MinimiseAllWindows()
   Dim oWin As Window
   For Each oWin In Windows
      oWin.WindowState = xlMinimized
   Next
End Sub
Workbook Object and the Workbooks Collection
The Workbooks collection contains the list of open workbooks. A Workbook object represents a single workbook. The parent of the Workbook is the Application object.
Workbooks Properties
Workbooks Methods
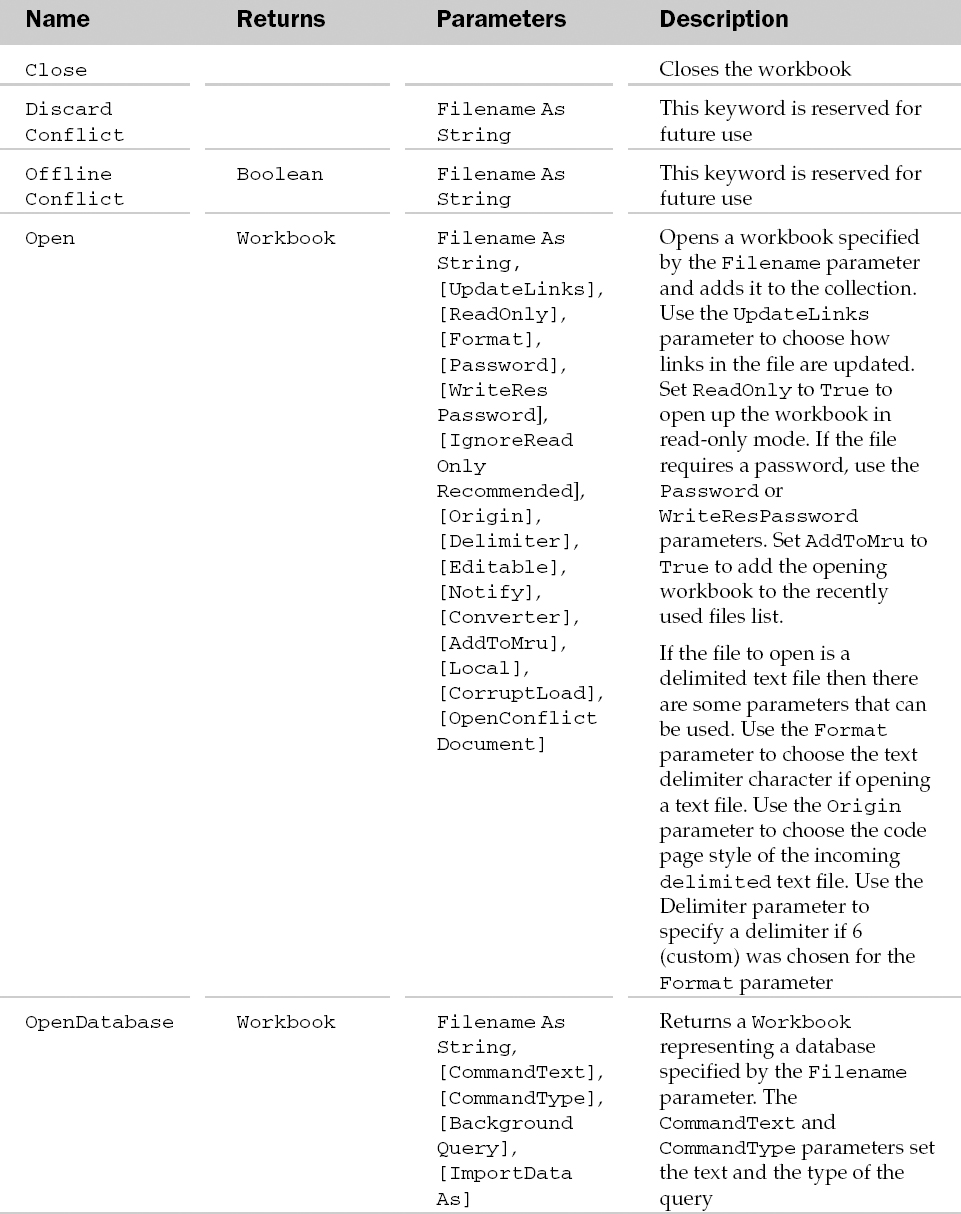
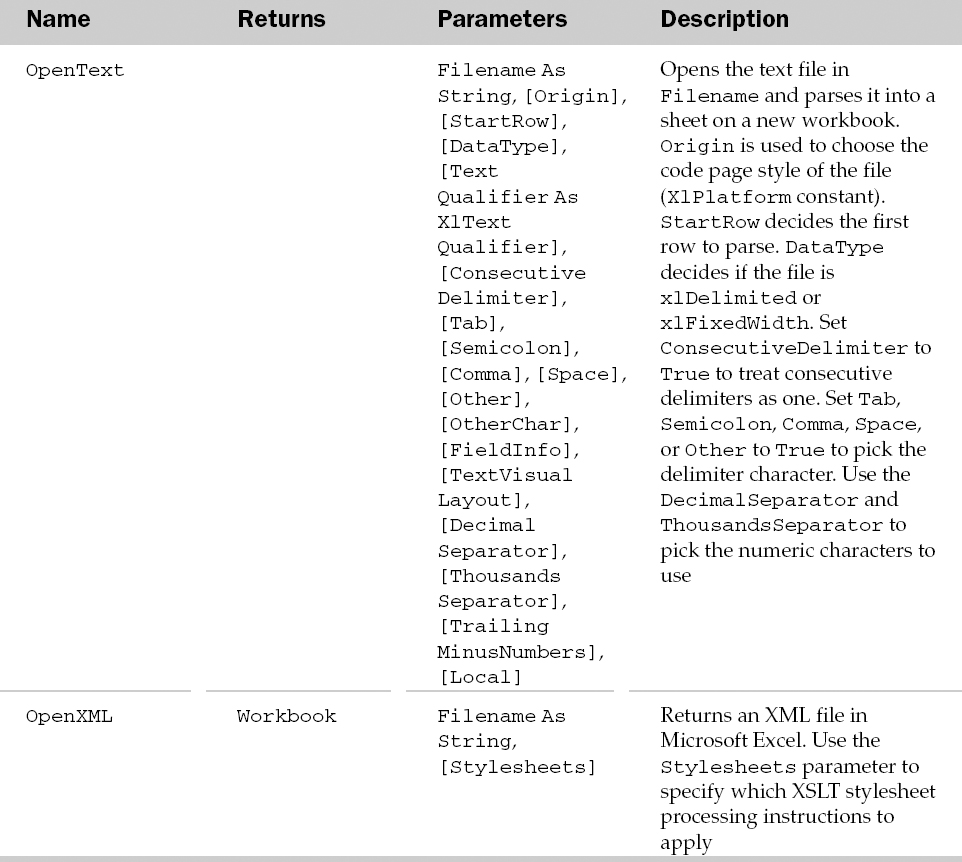
Workbook Common Properties
The Application, Creator, and Parent properties are defined at the beginning of this Appendix.
Workbook Properties
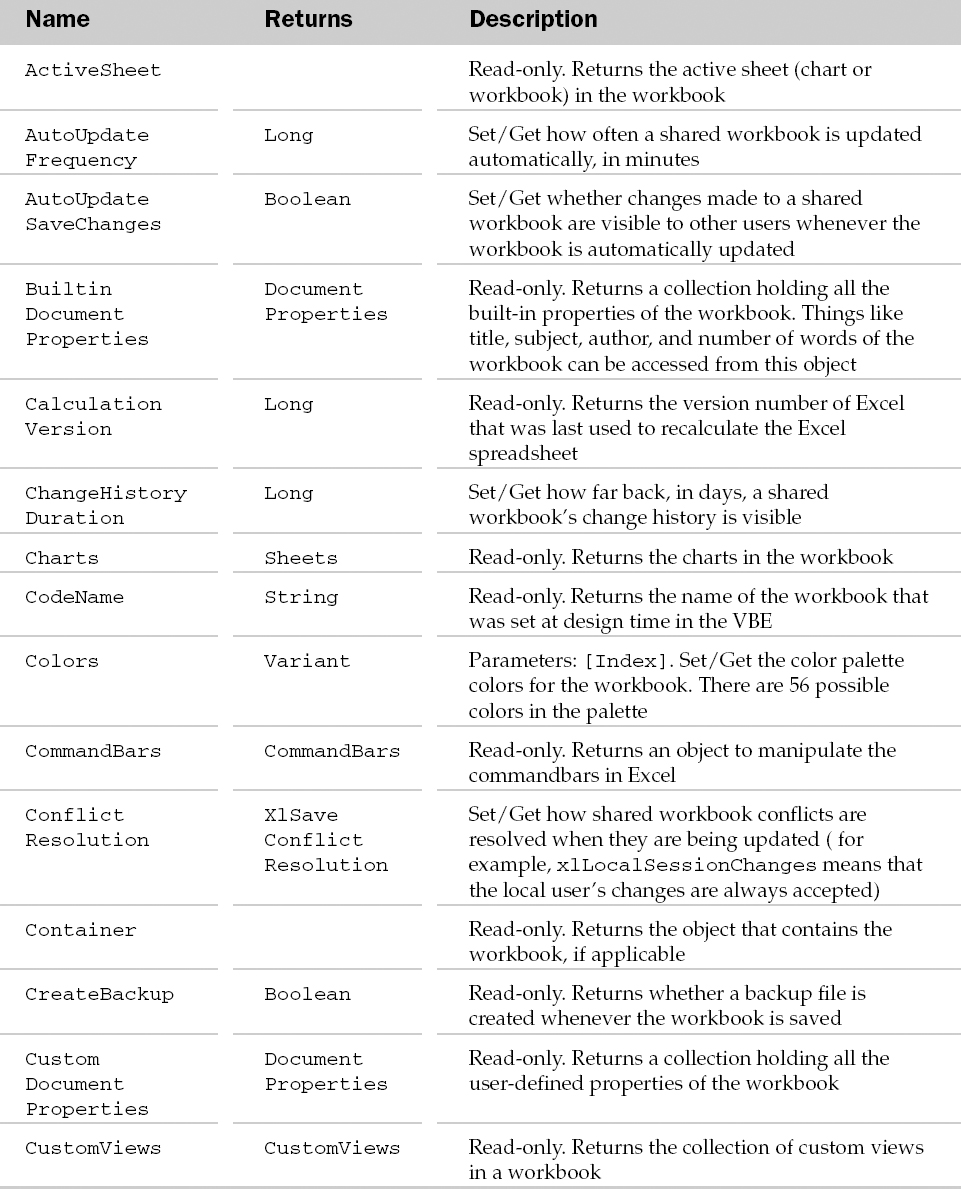
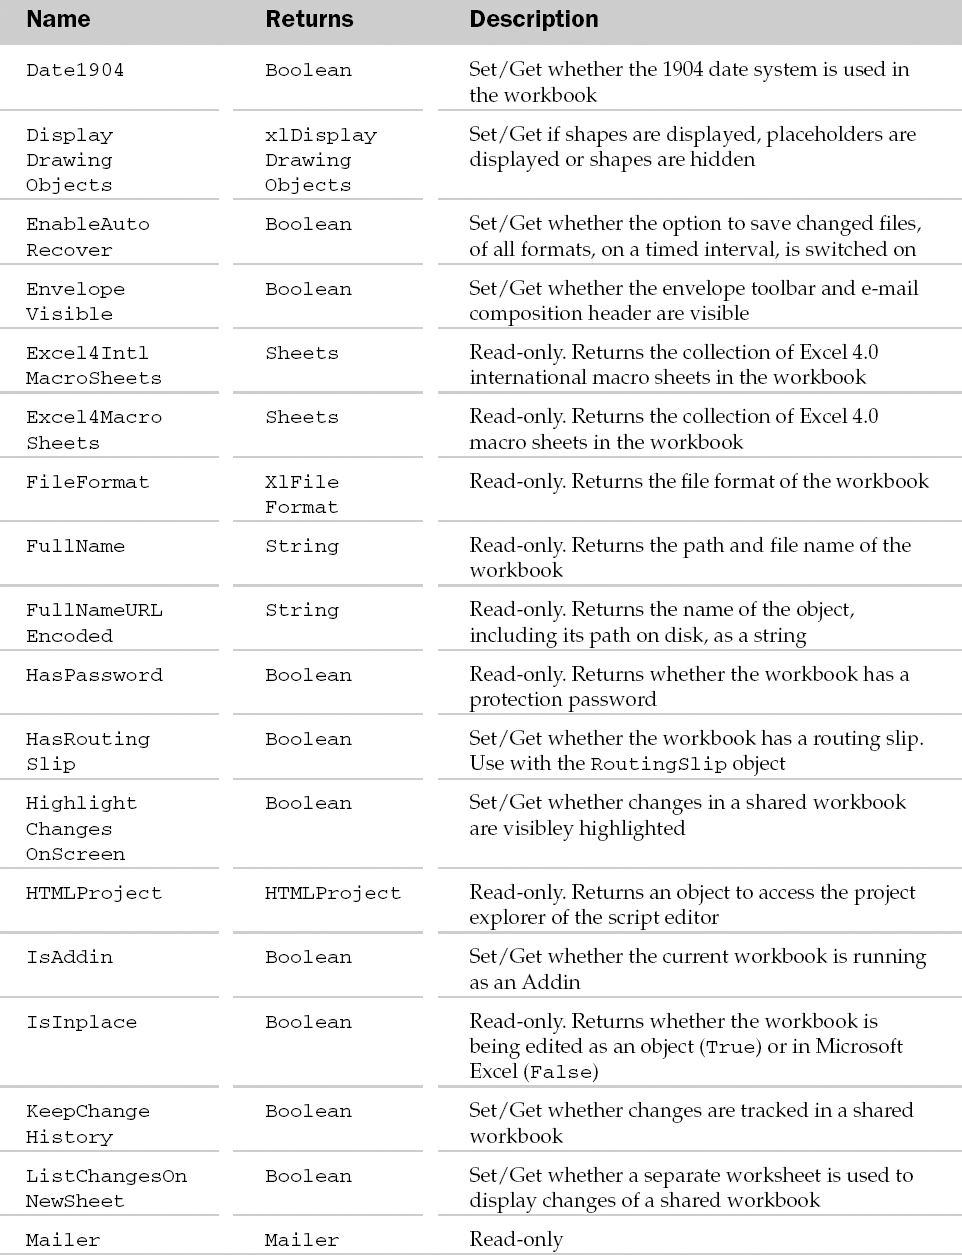
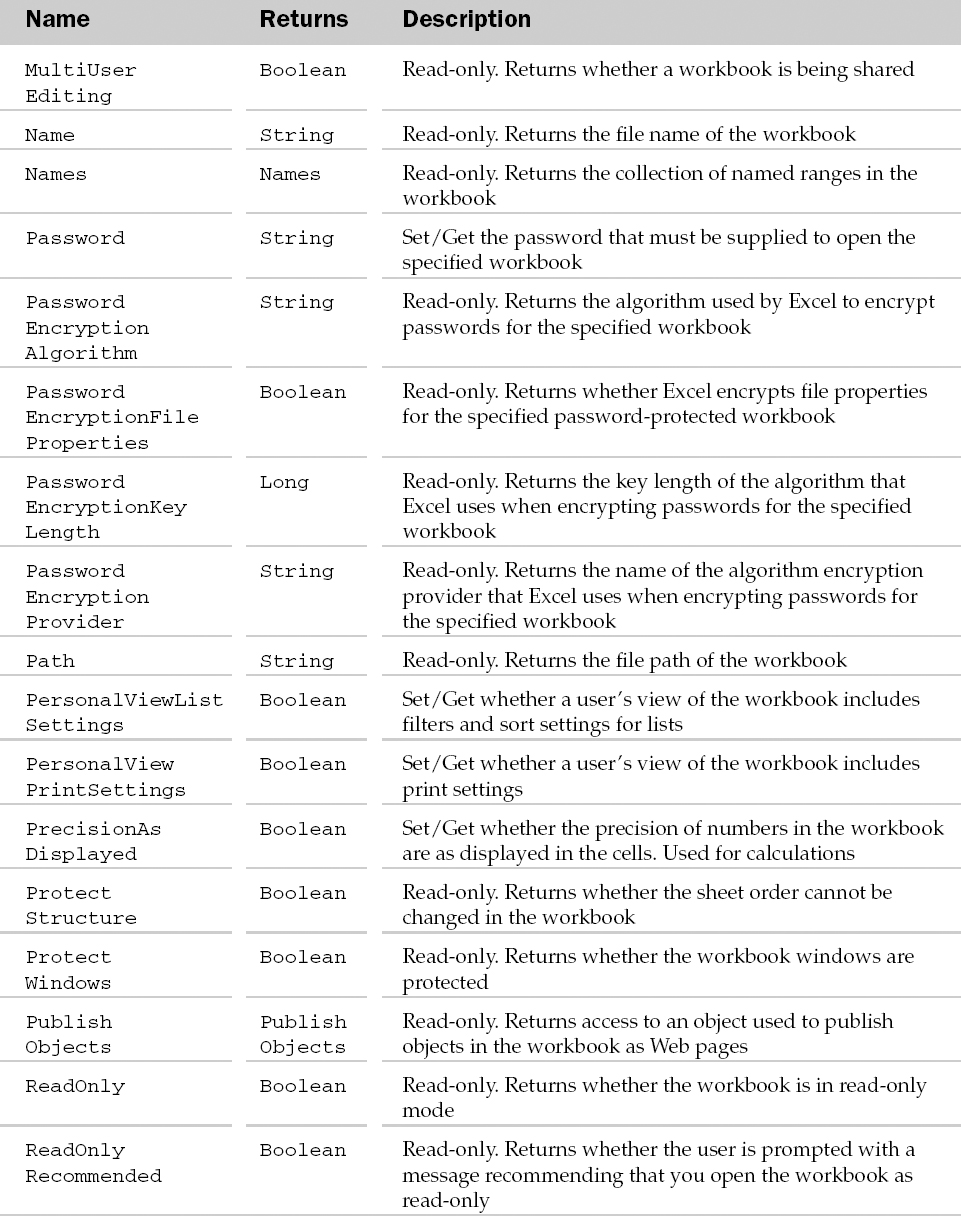
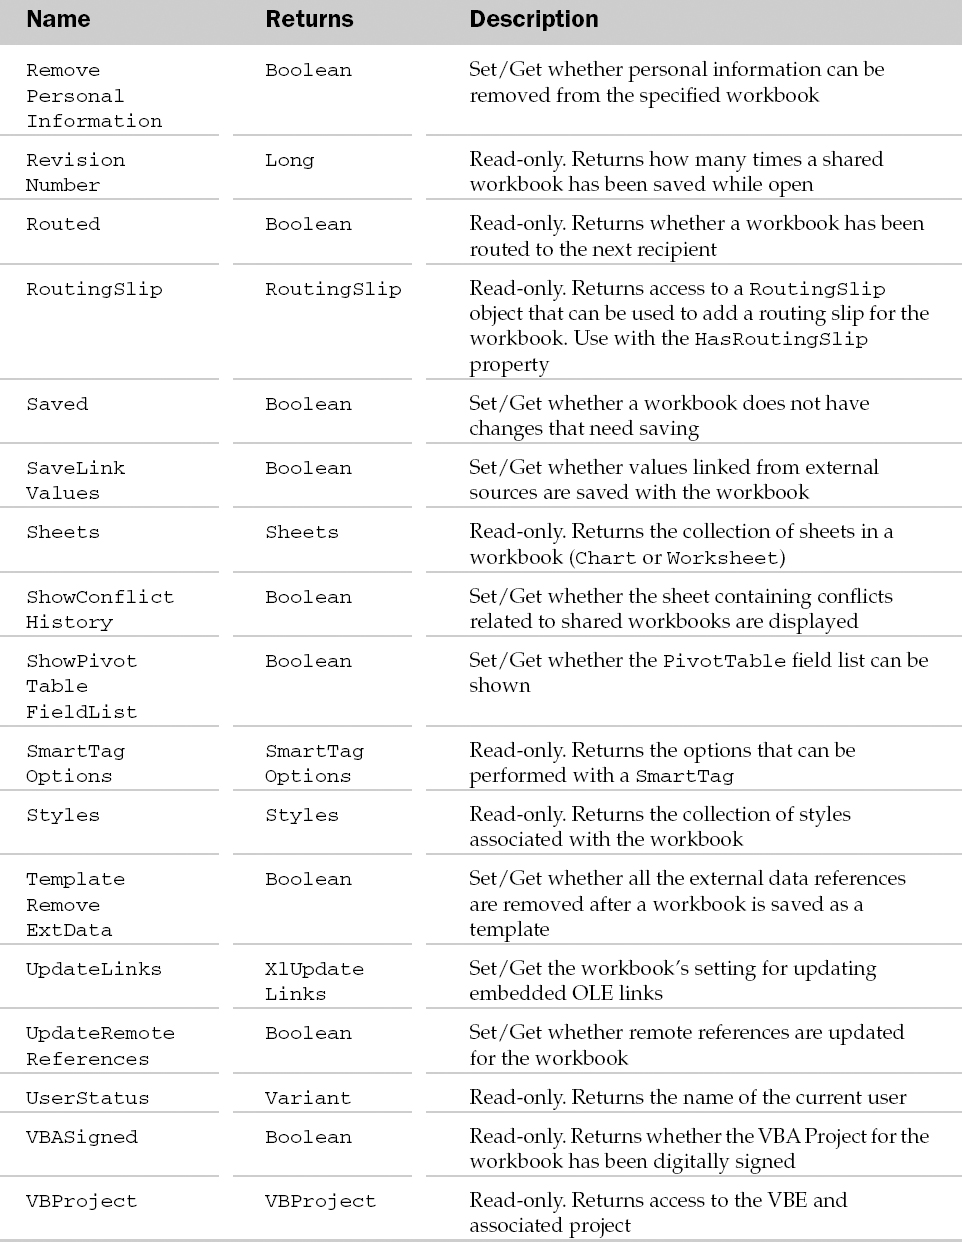
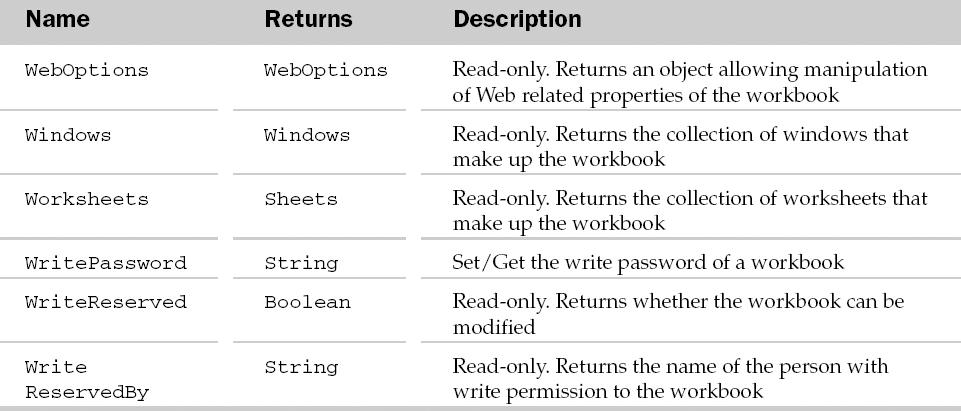
Workbook Methods
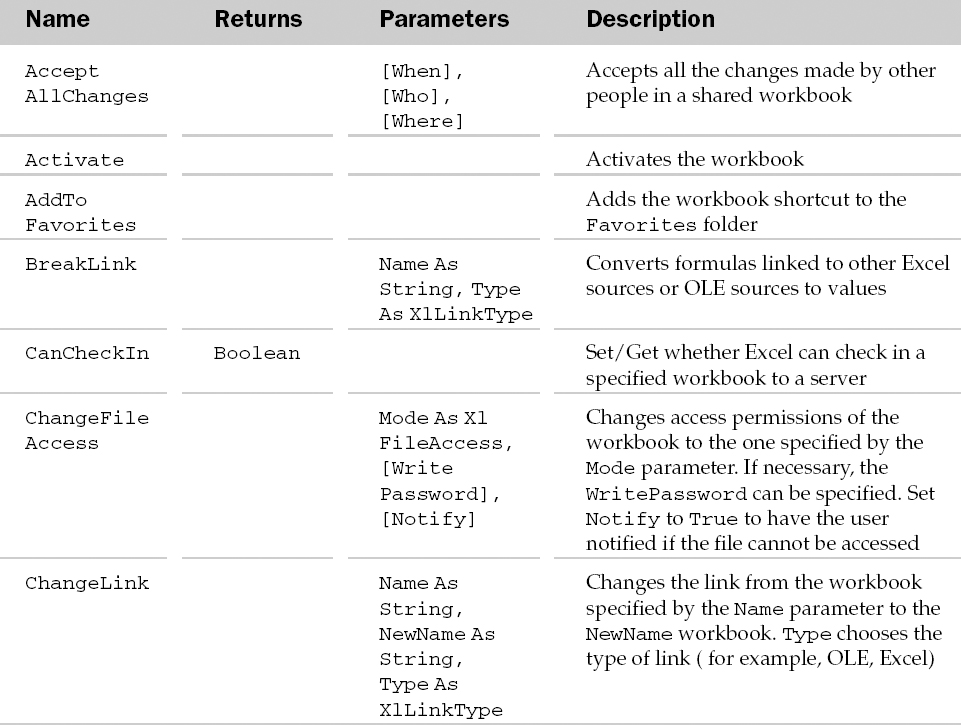
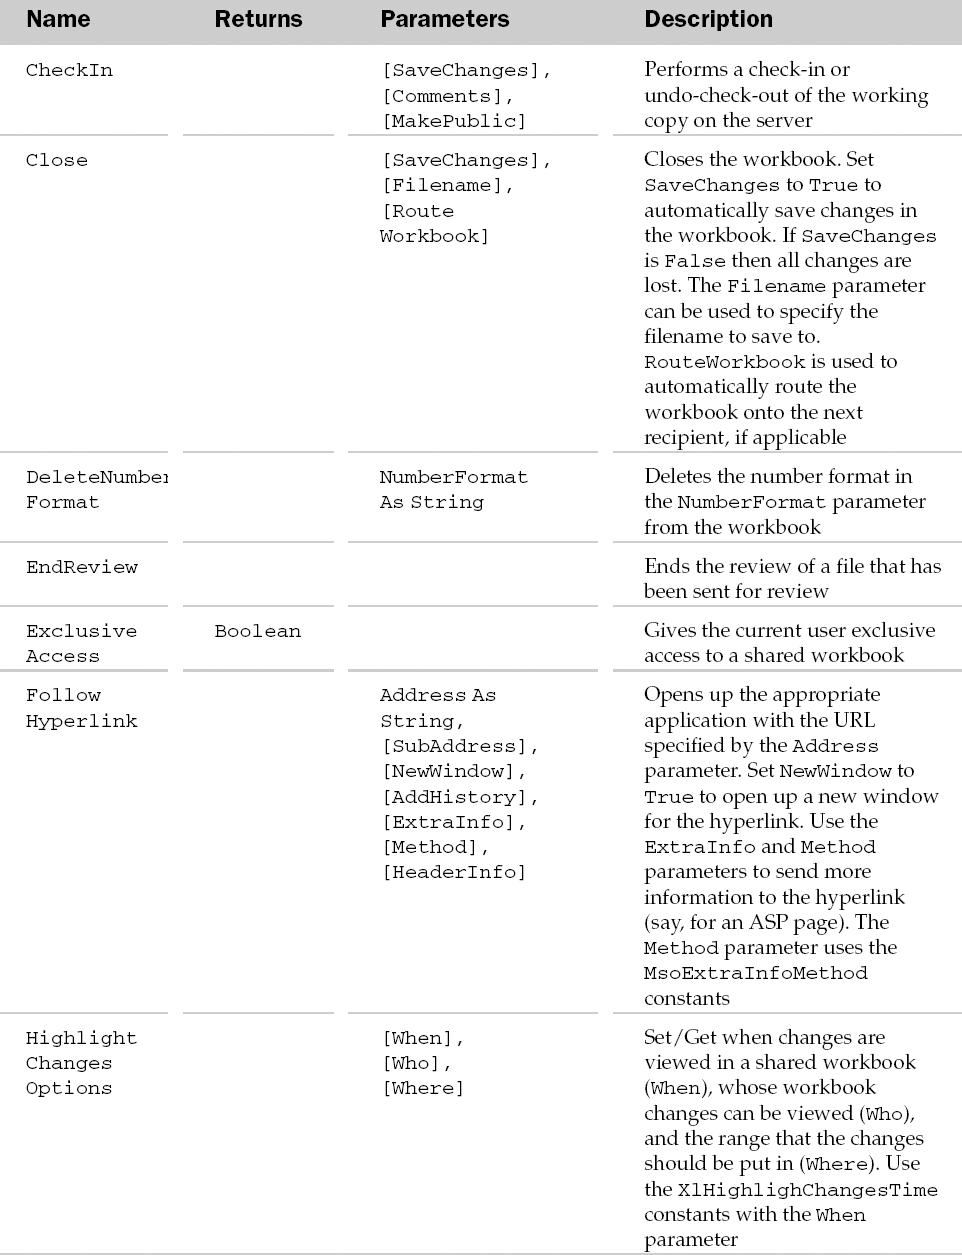
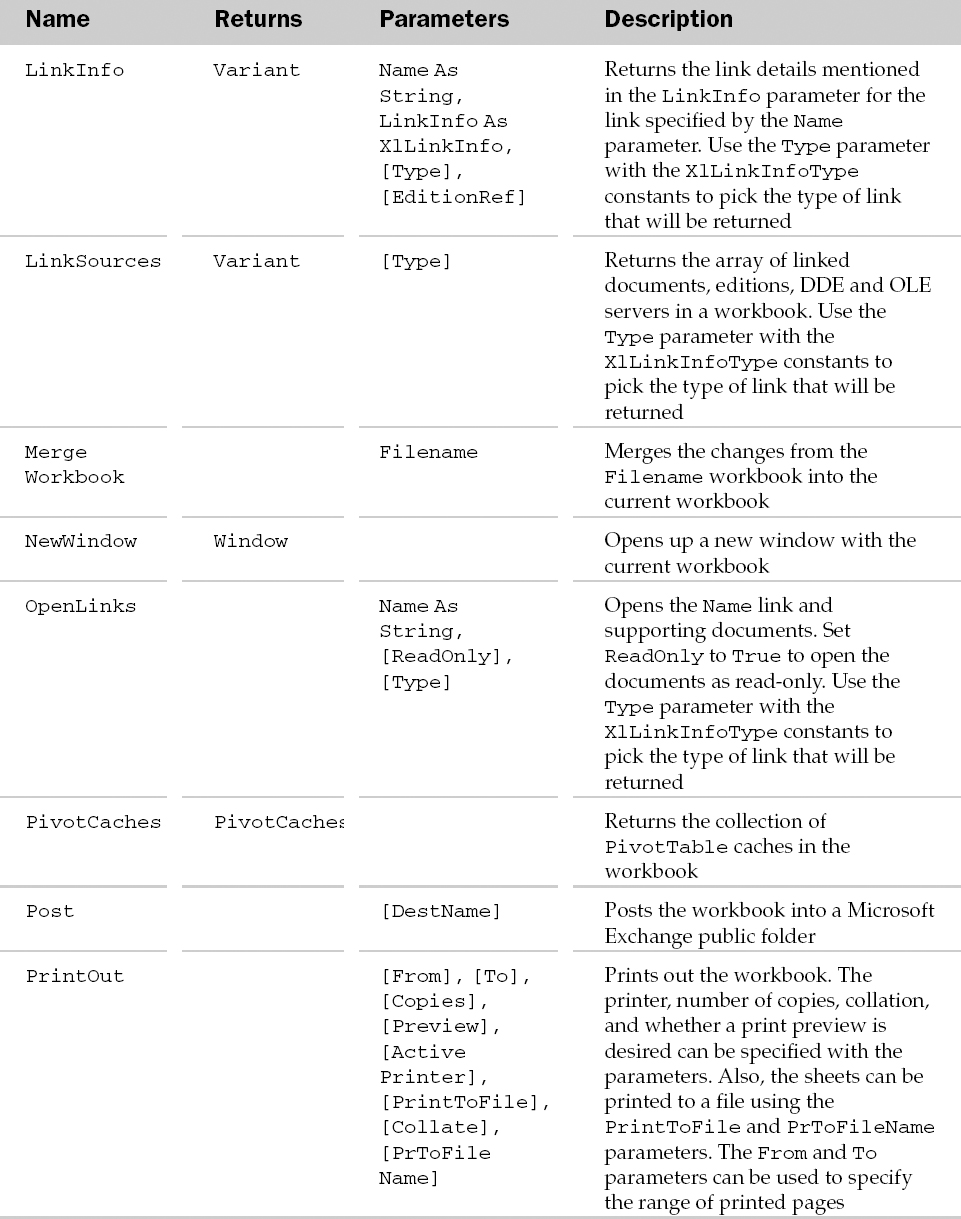
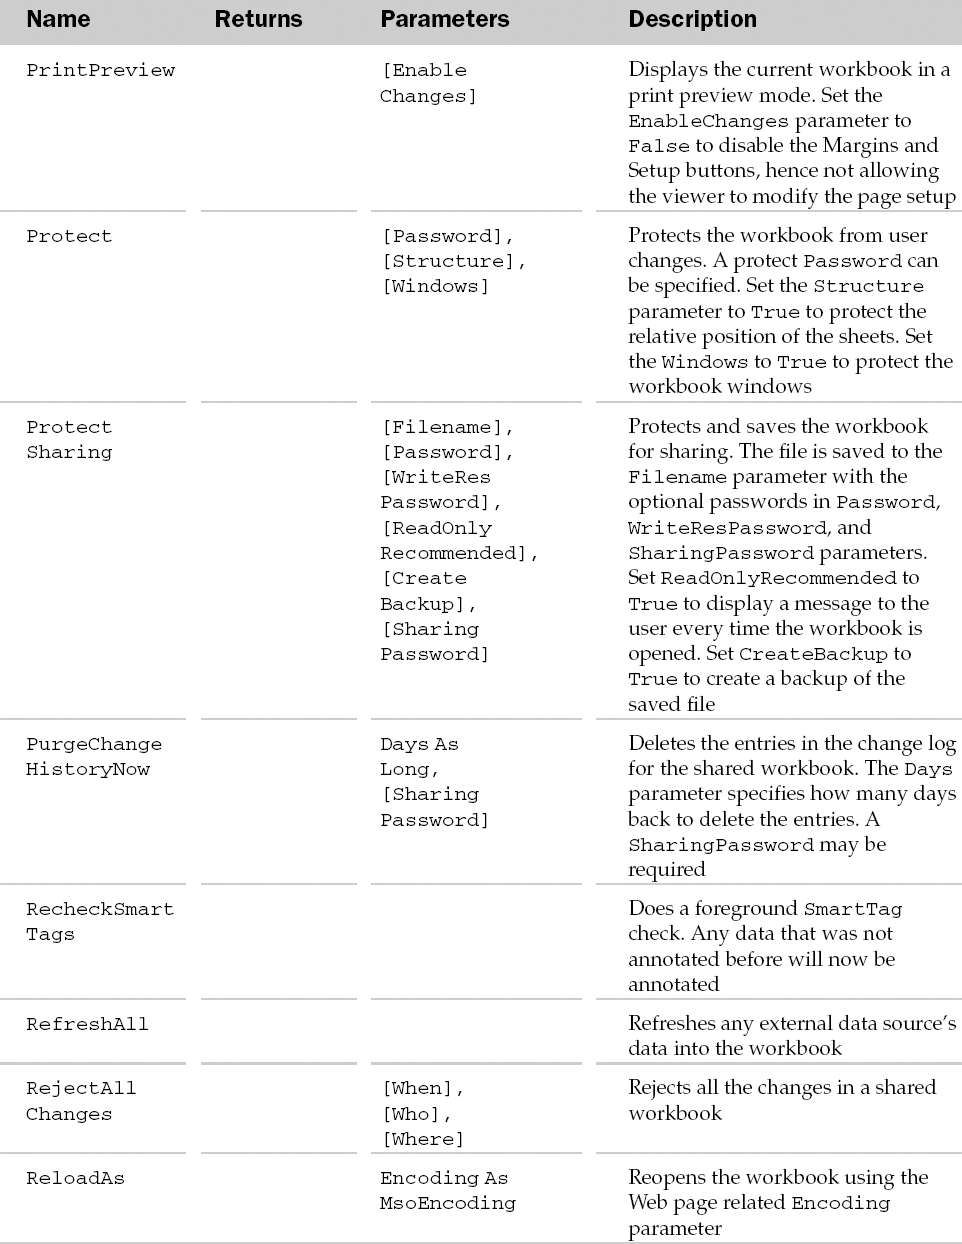
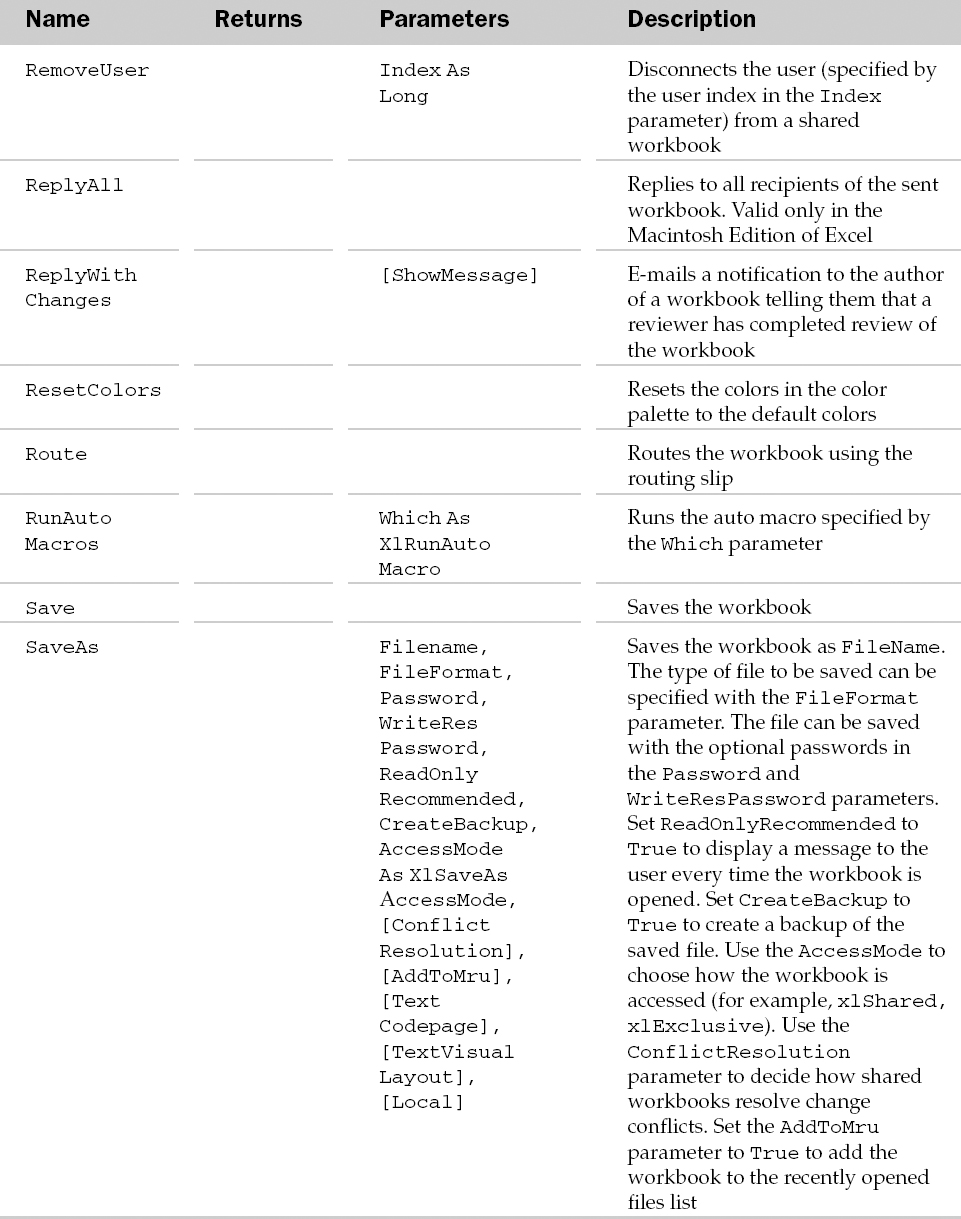
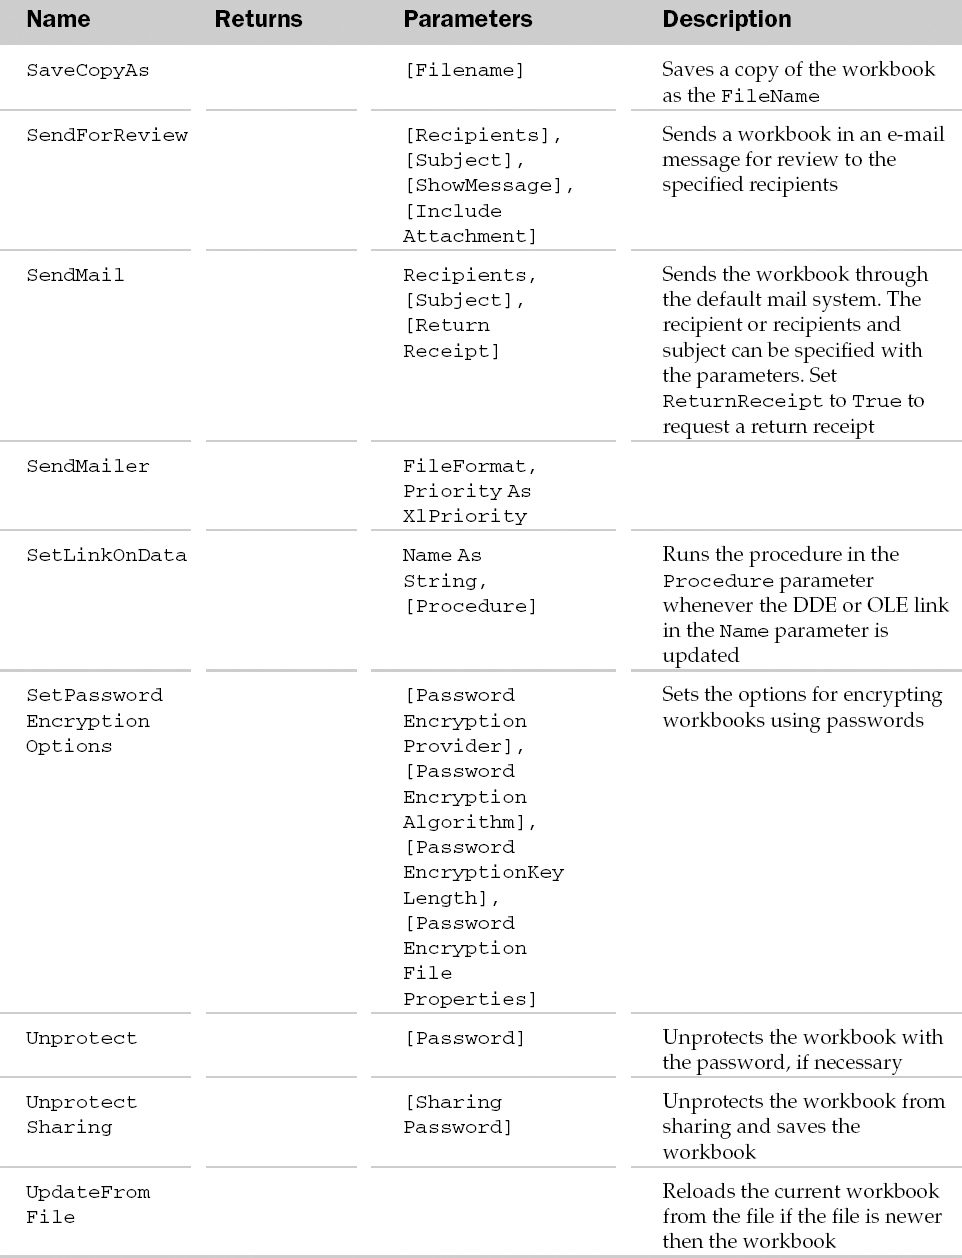
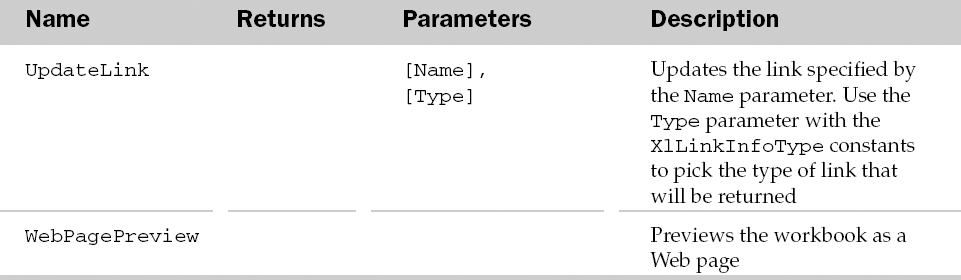
Workbook Events
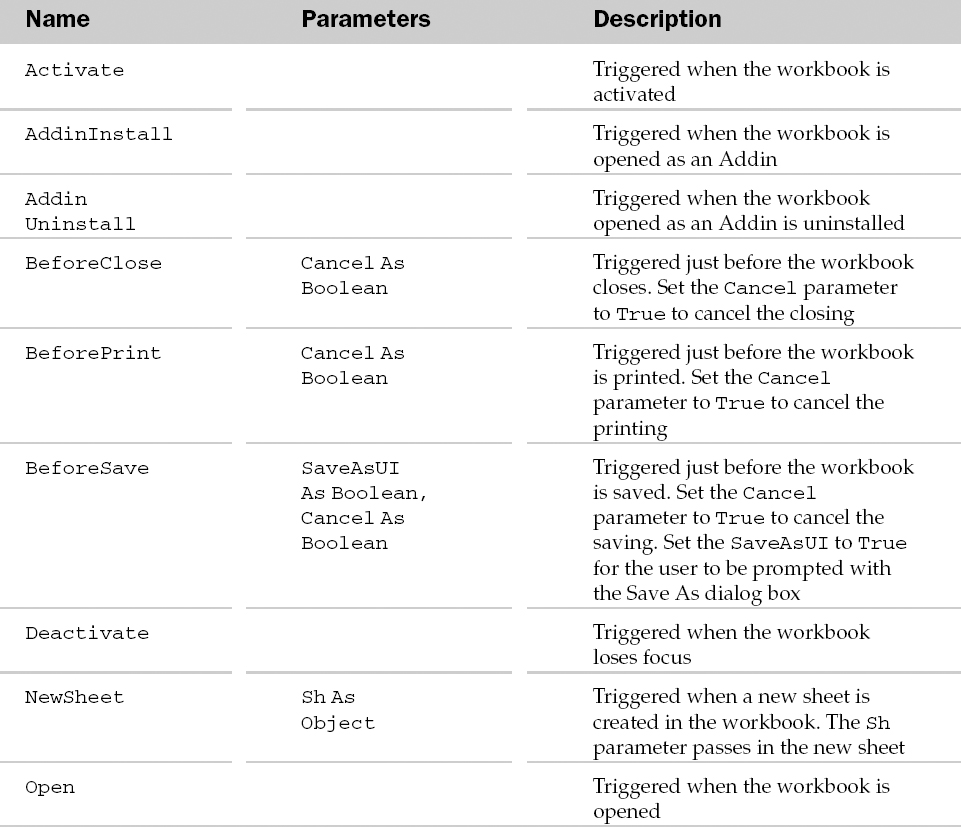
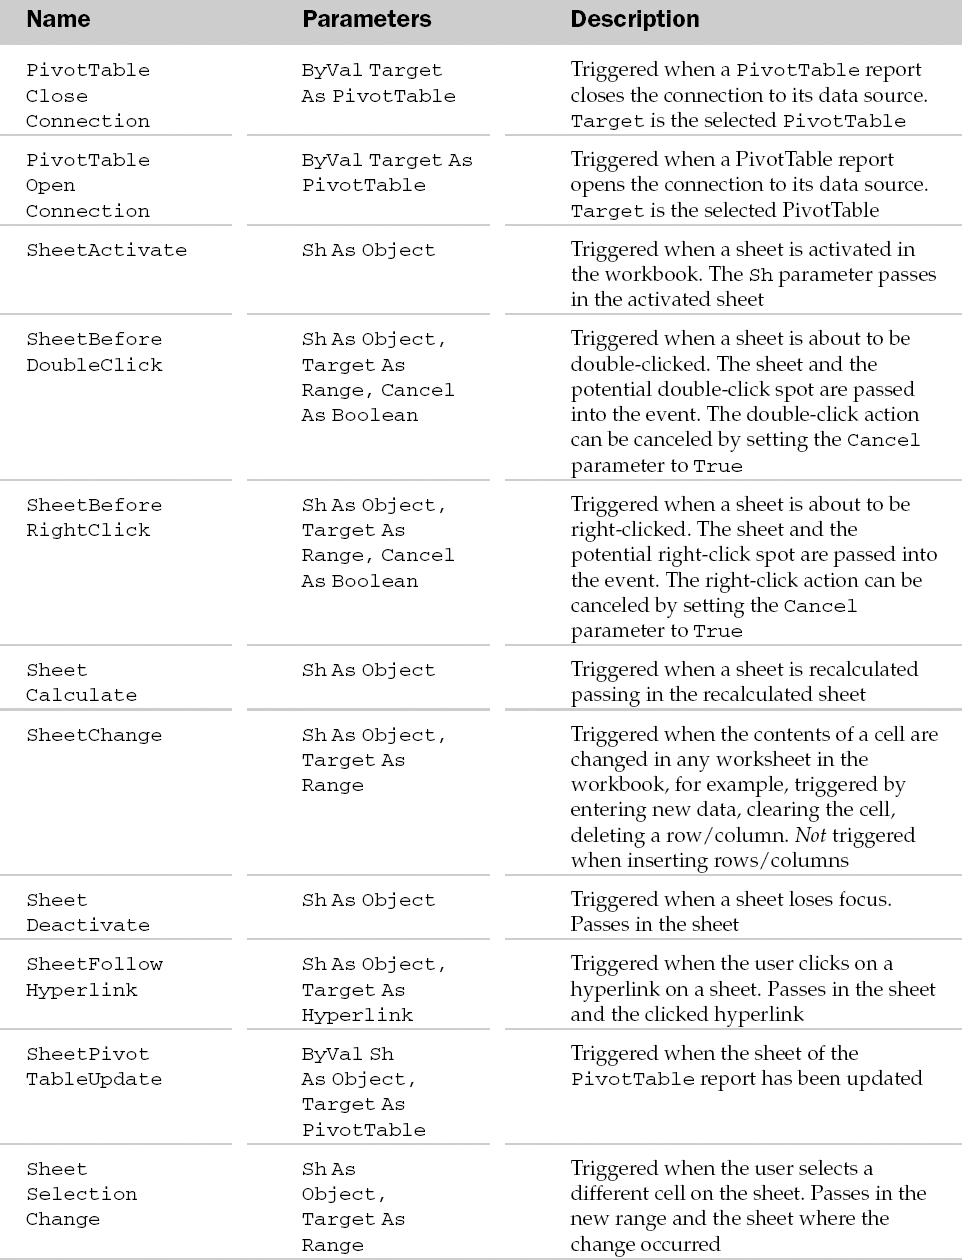
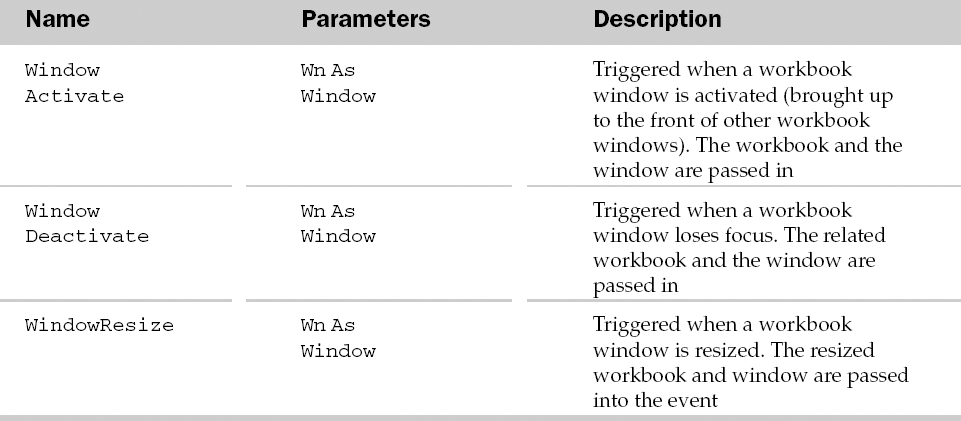
Example: Workbook Object and the Workbooks Collection
Please refer to Chapter 4 for Workbook object examples.
Worksheet Object and the Worksheets Collection
The Worksheets collection holds the collection of worksheets in a workbook. The Workbook object is always the parent of the Worksheets collection. The Worksheets collection only holds the worksheets. The Worksheet objects in the Worksheets collection can be accessed using the Item property. Either the name of the worksheet can be specified as a parameter to the Item's parameter or an index number describing the position of the worksheet in the workbook (from left to right).
The Worksheet object allows access to all of the attributes of a specific worksheet in Excel. This includes worksheet formatting and other worksheet properties. The Worksheet object also exposes events that can be used programmatically.
The Worksheets collection has a few properties and methods besides the typical collection attributes. These are listed in the following table.
Worksheets Collection Properties and Methods
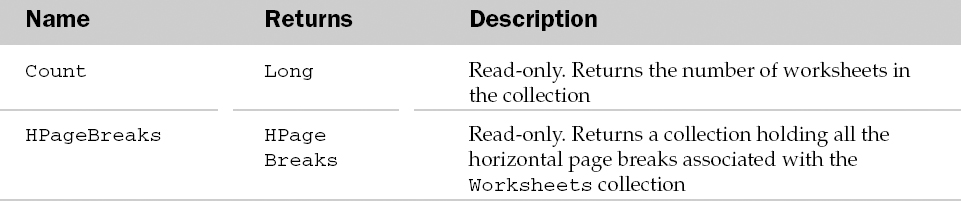
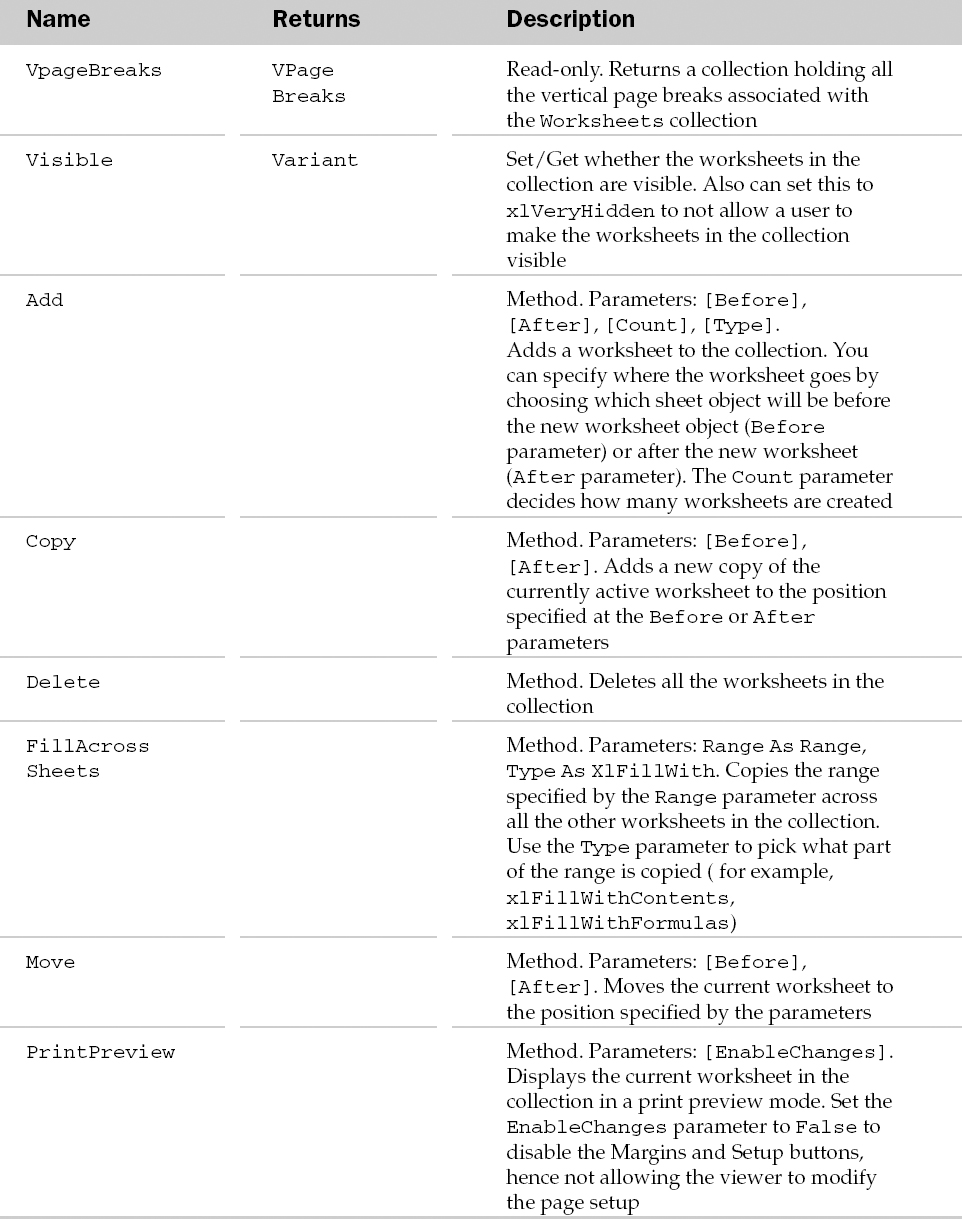
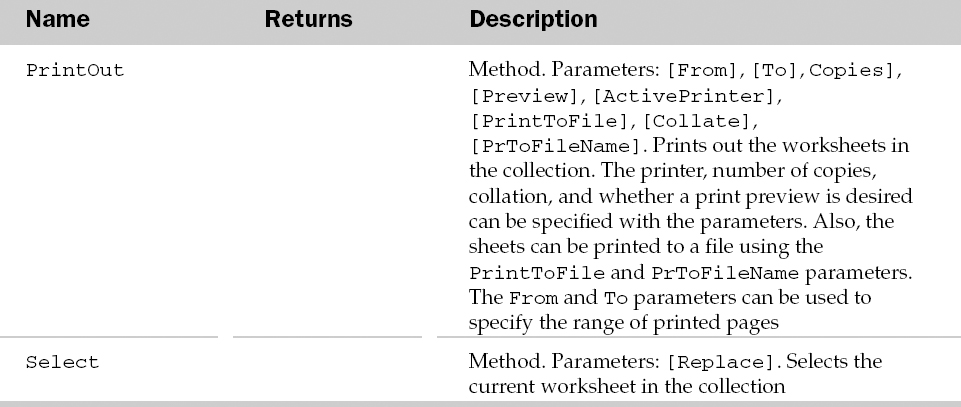
Worksheet Common Properties
The Application, Creator, and Parent properties are defined at the beginning of this Appendix.
Worksheet Properties
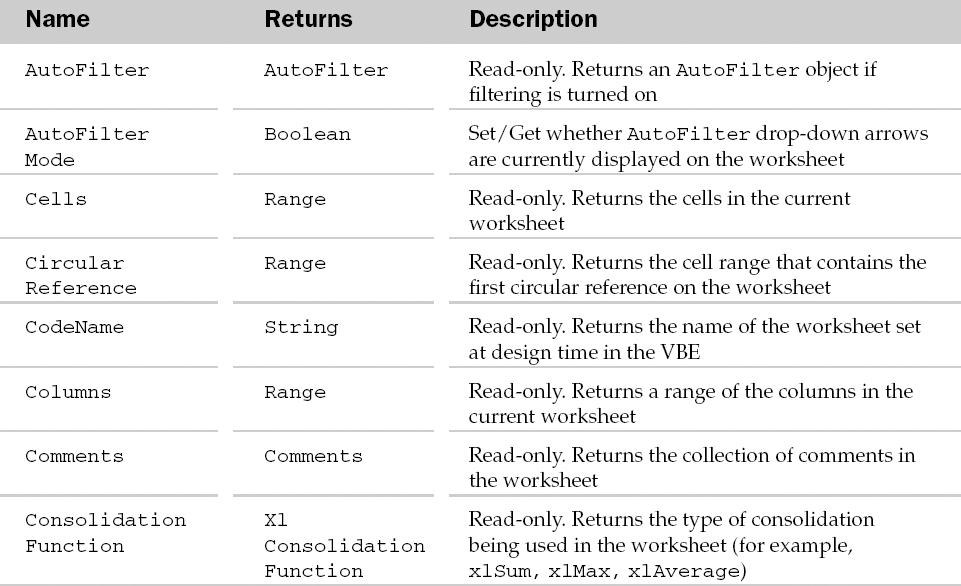
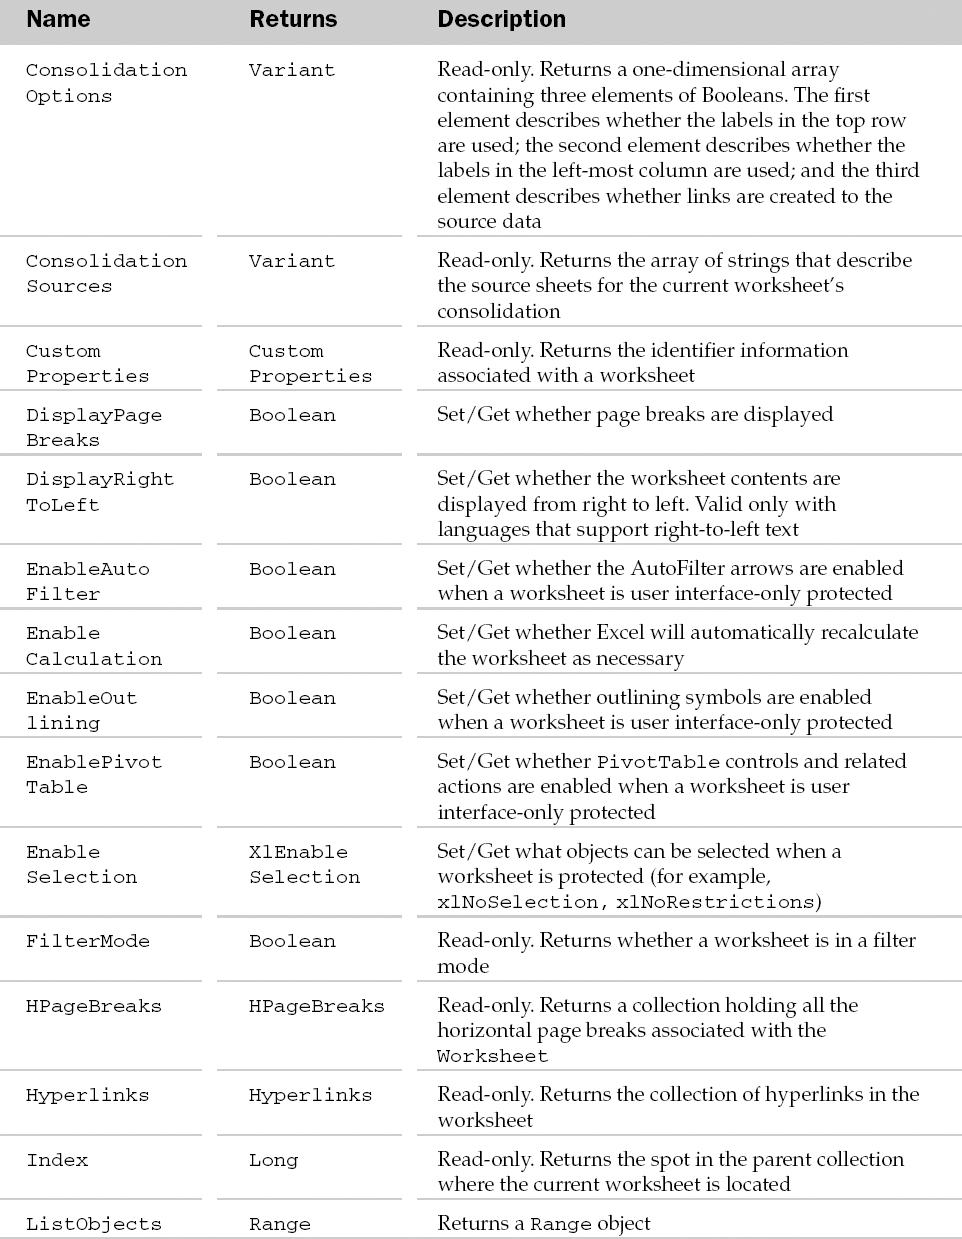
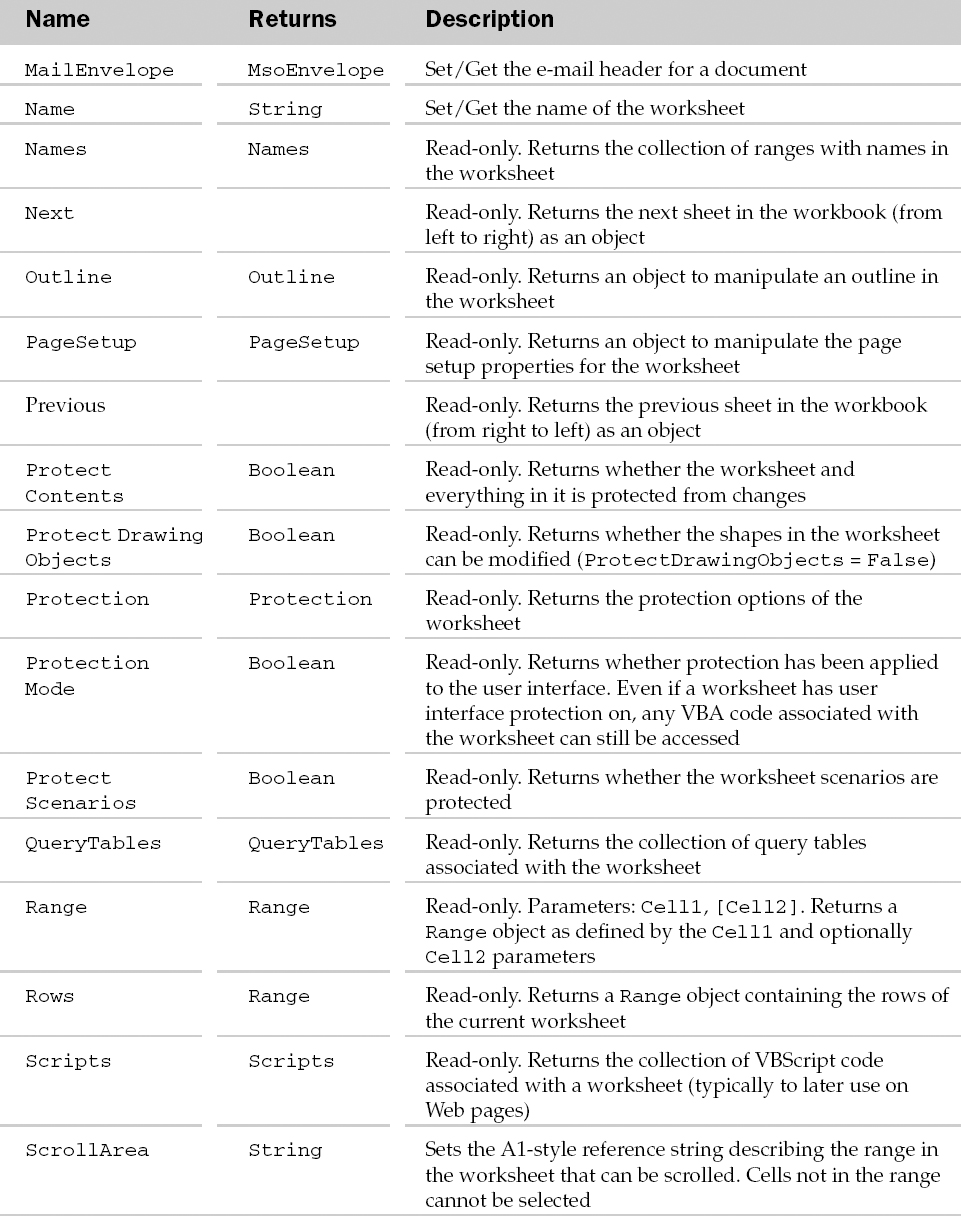
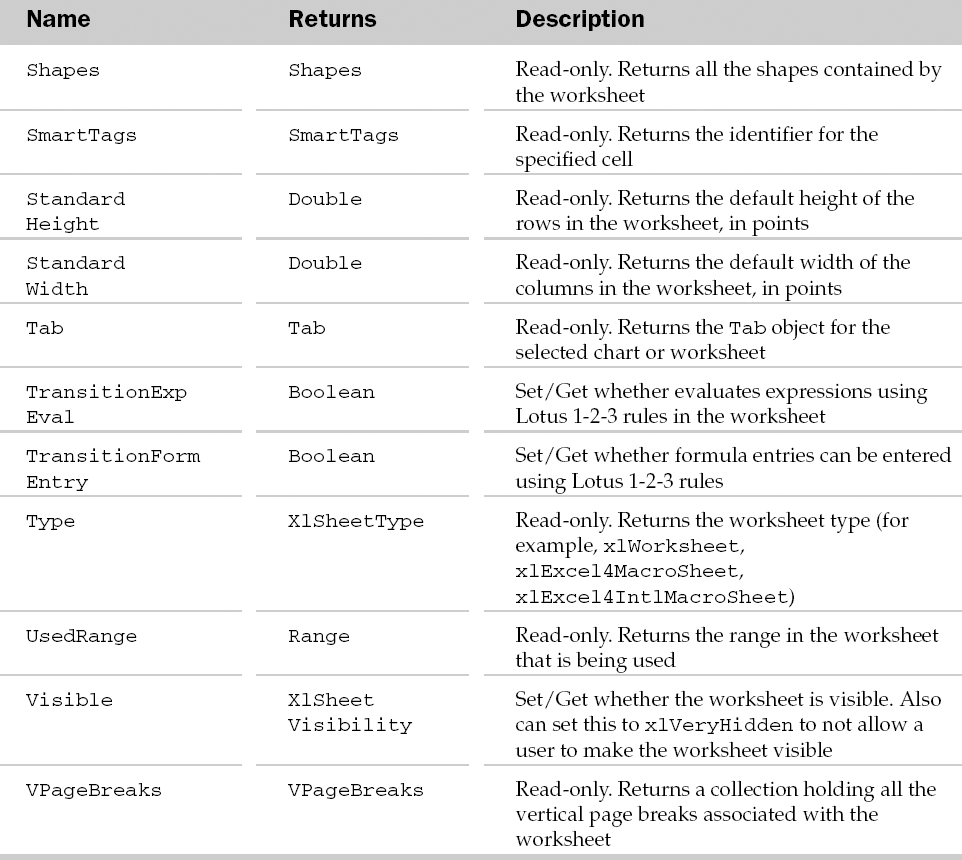
Worksheet Methods
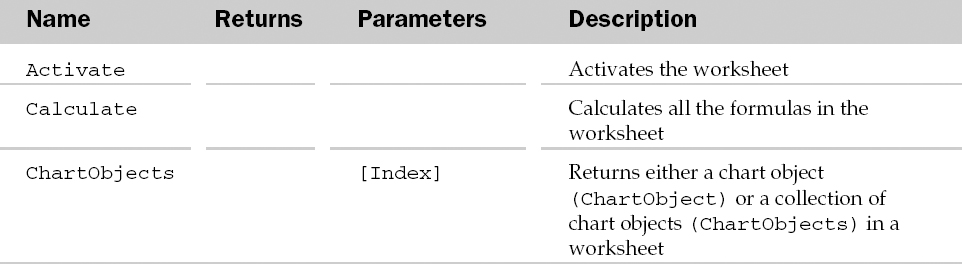
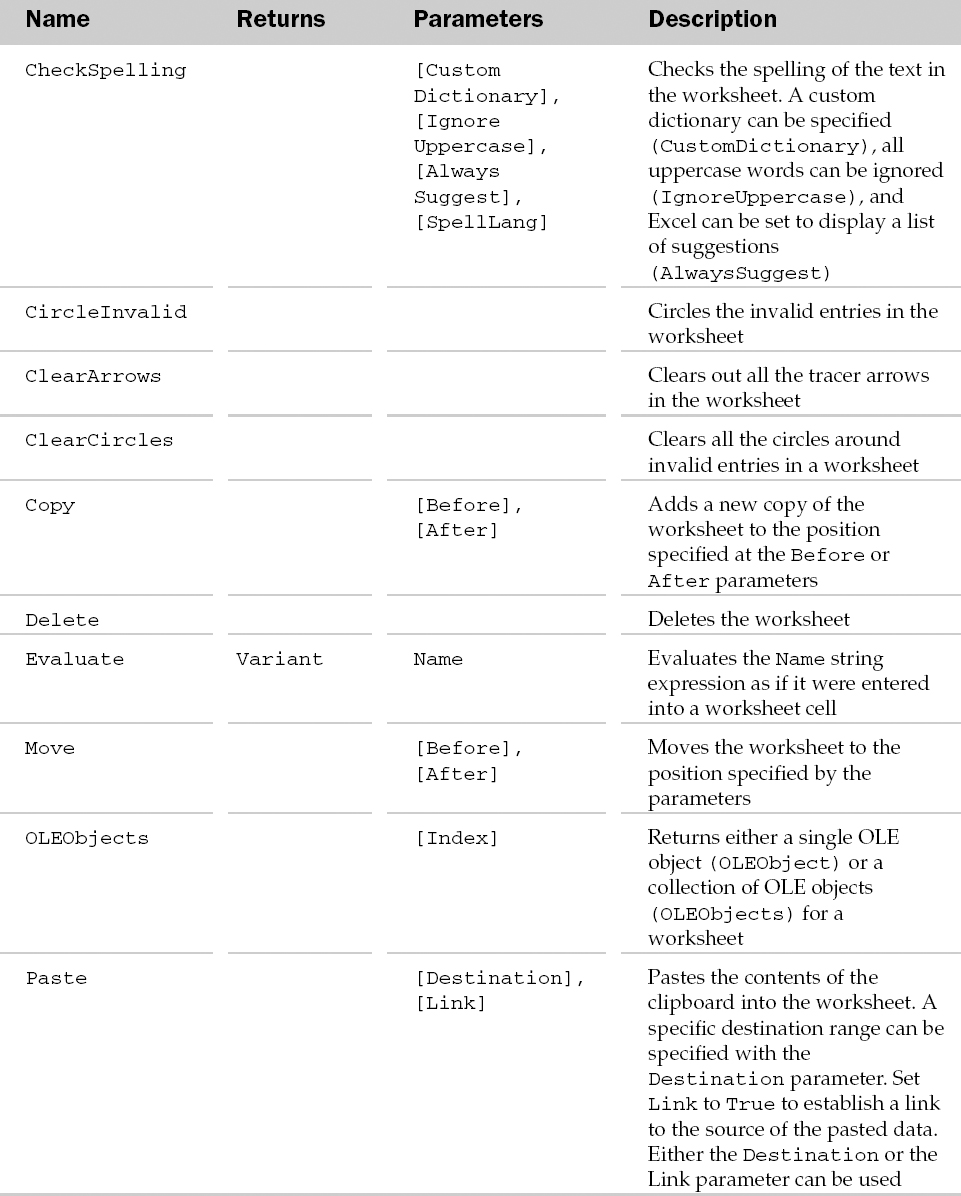
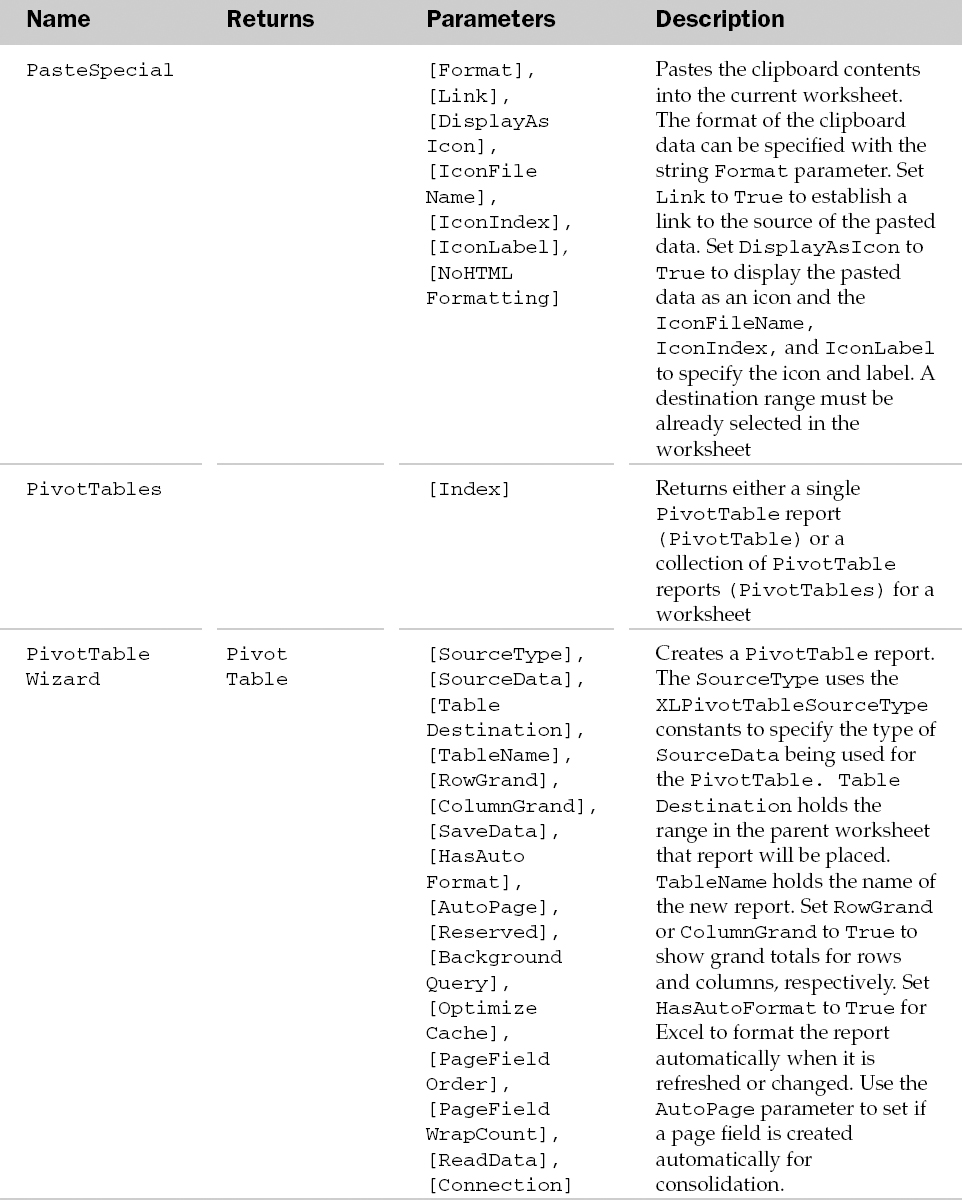
Worksheet Events
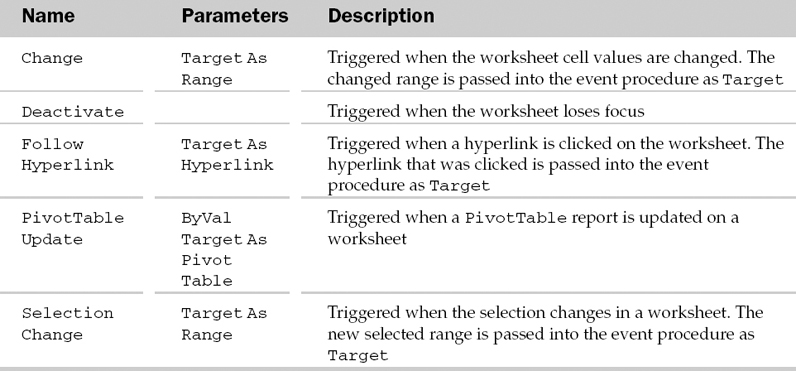
Example: Worksheet Object and the Worksheets Collection
Please refer to Chapter 4 for Worksheet object examples.
WorksheetFunction Object
The WorksheetFunction object contains all of the Excel worksheet function. The WorksheetFunction object allows access to Excel worksheet function in Visual Basic code. The parent of the WorksheetFunction object is the Application object.
WorksheetFunction Common Properties
The Application, Creator, and Parent properties are defined at the beginning of this Appendix.
WorksheetFunction Methods
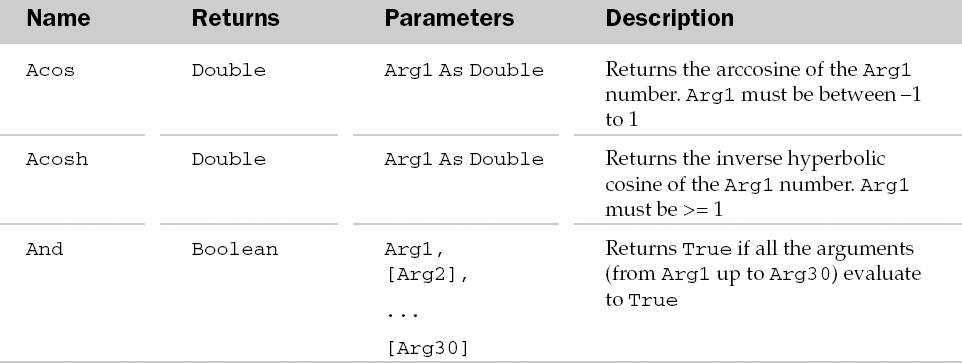
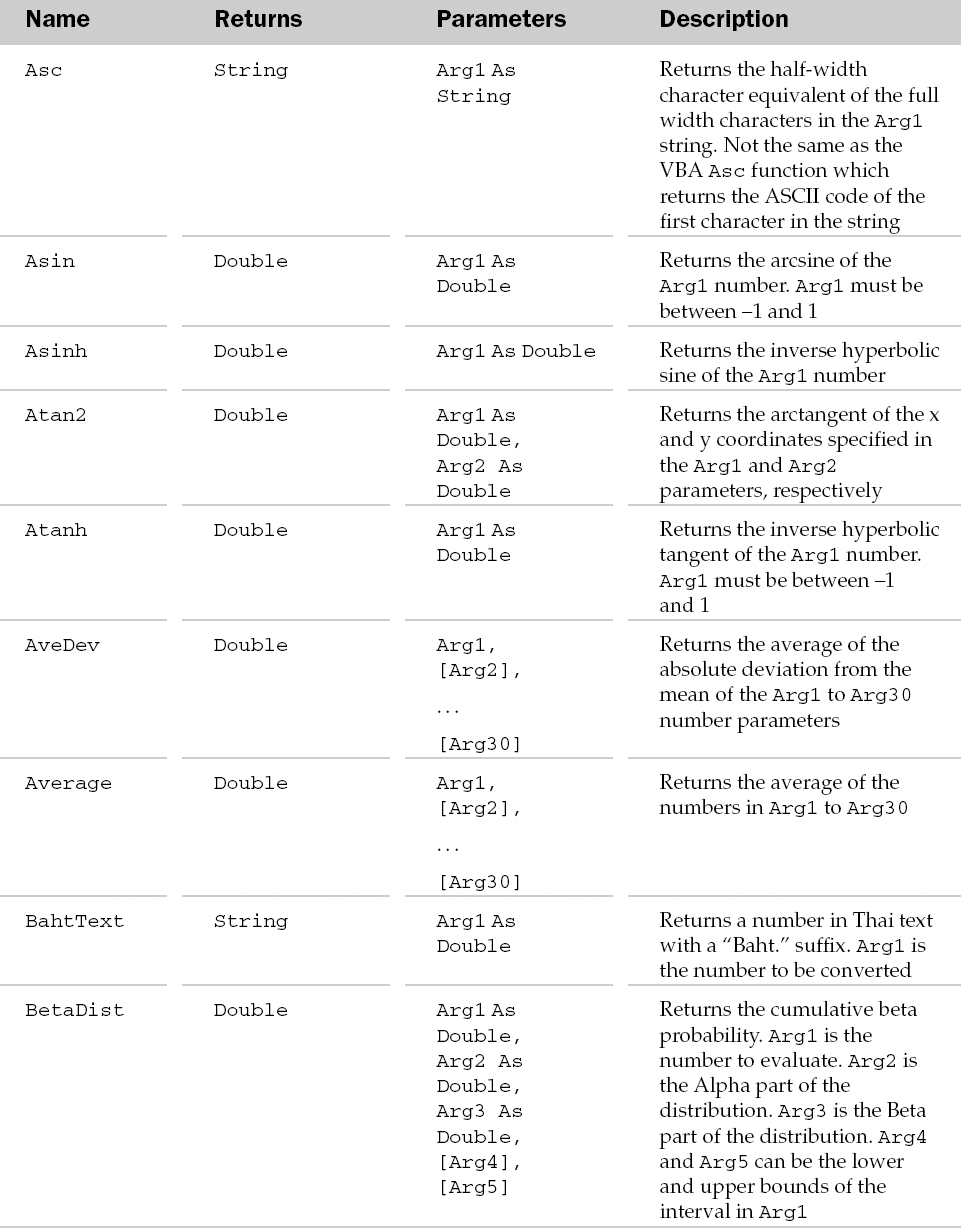
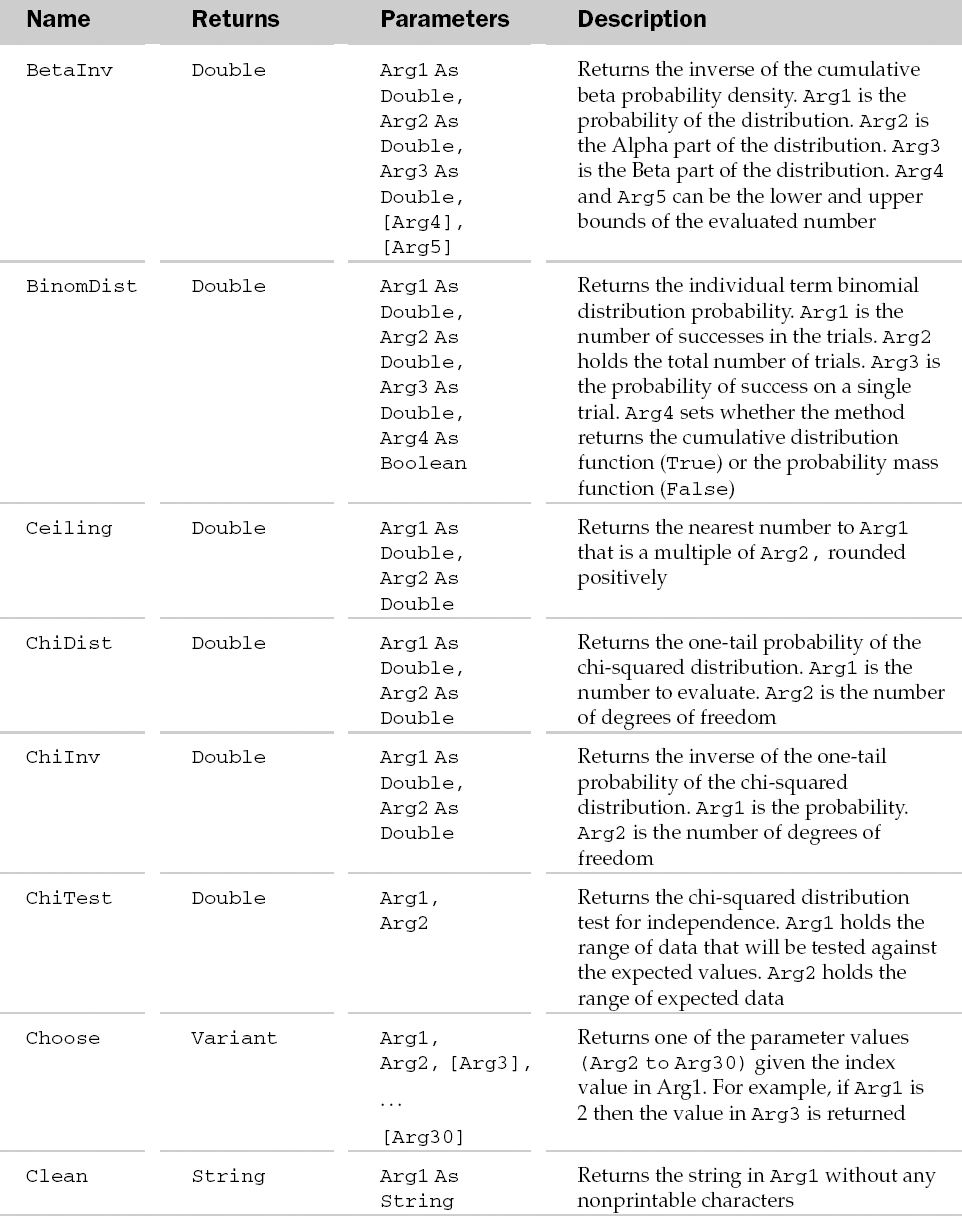
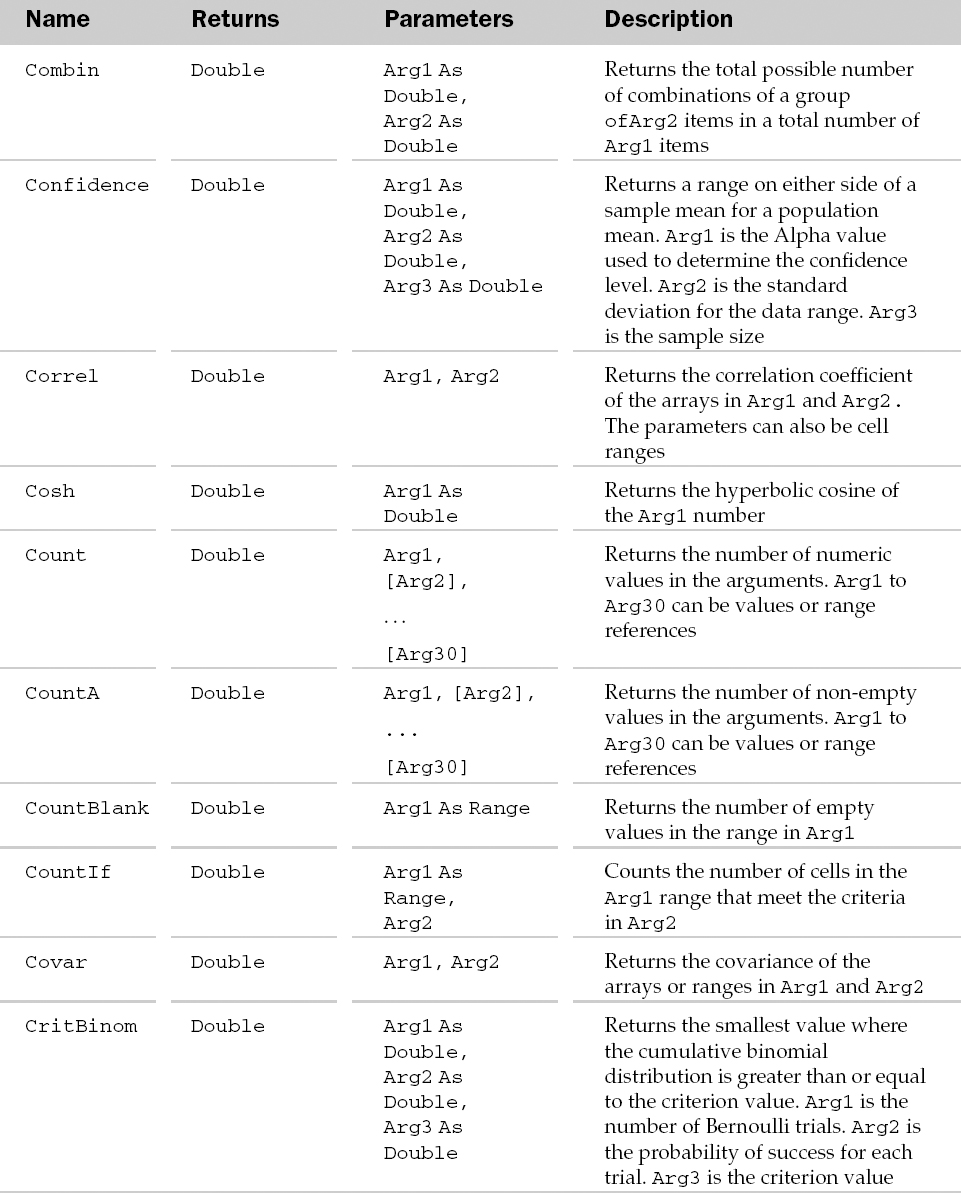
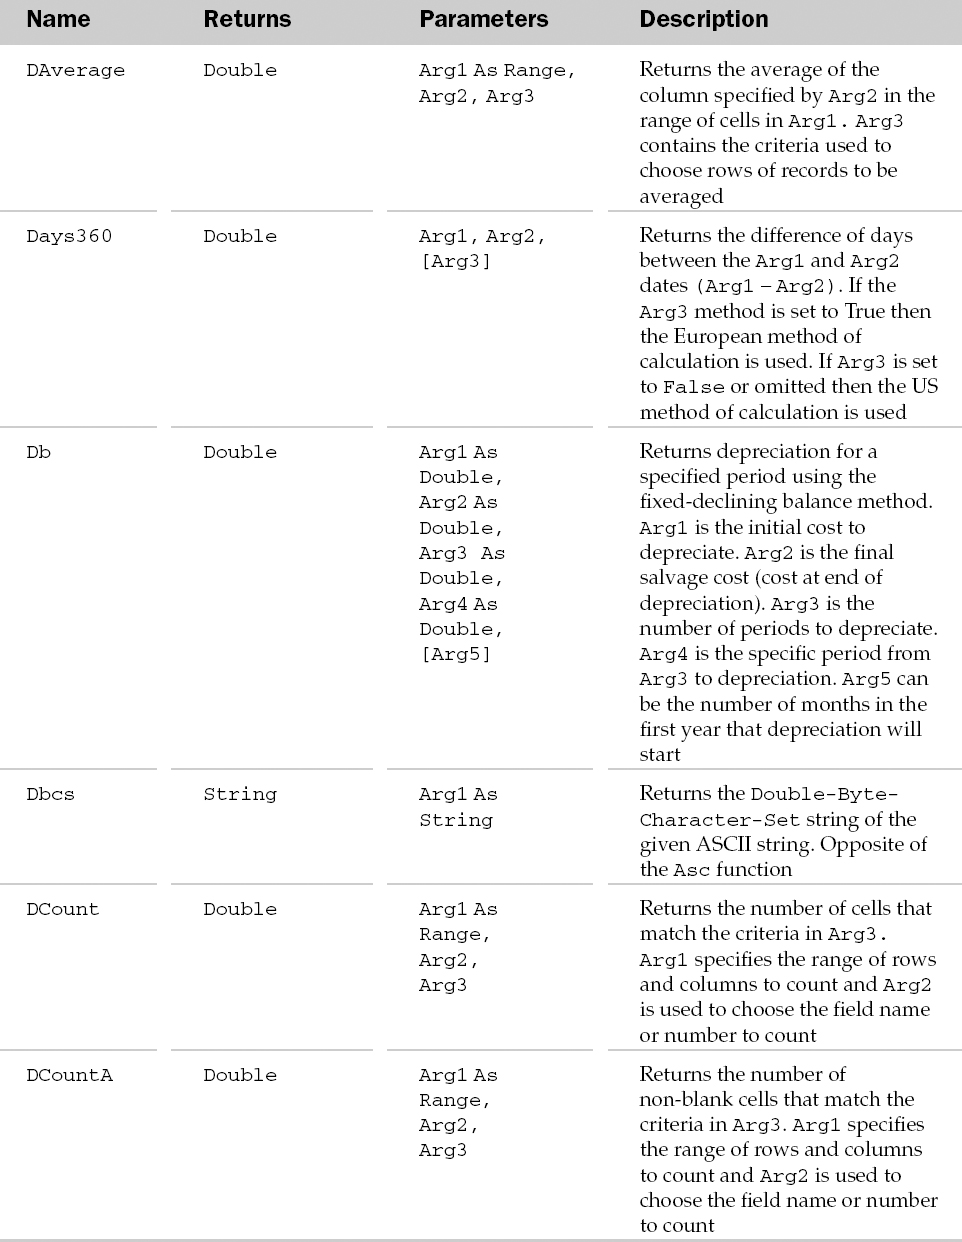
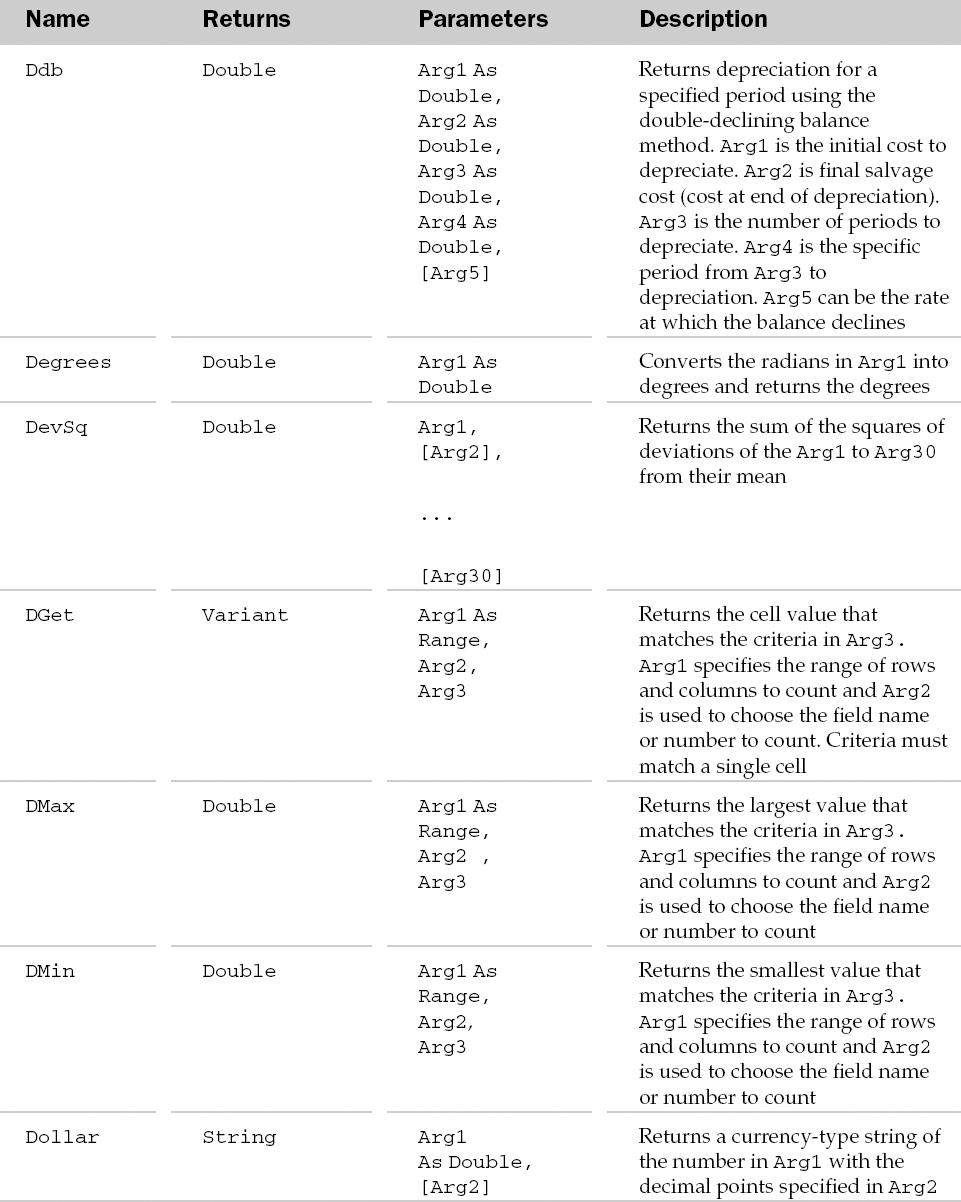
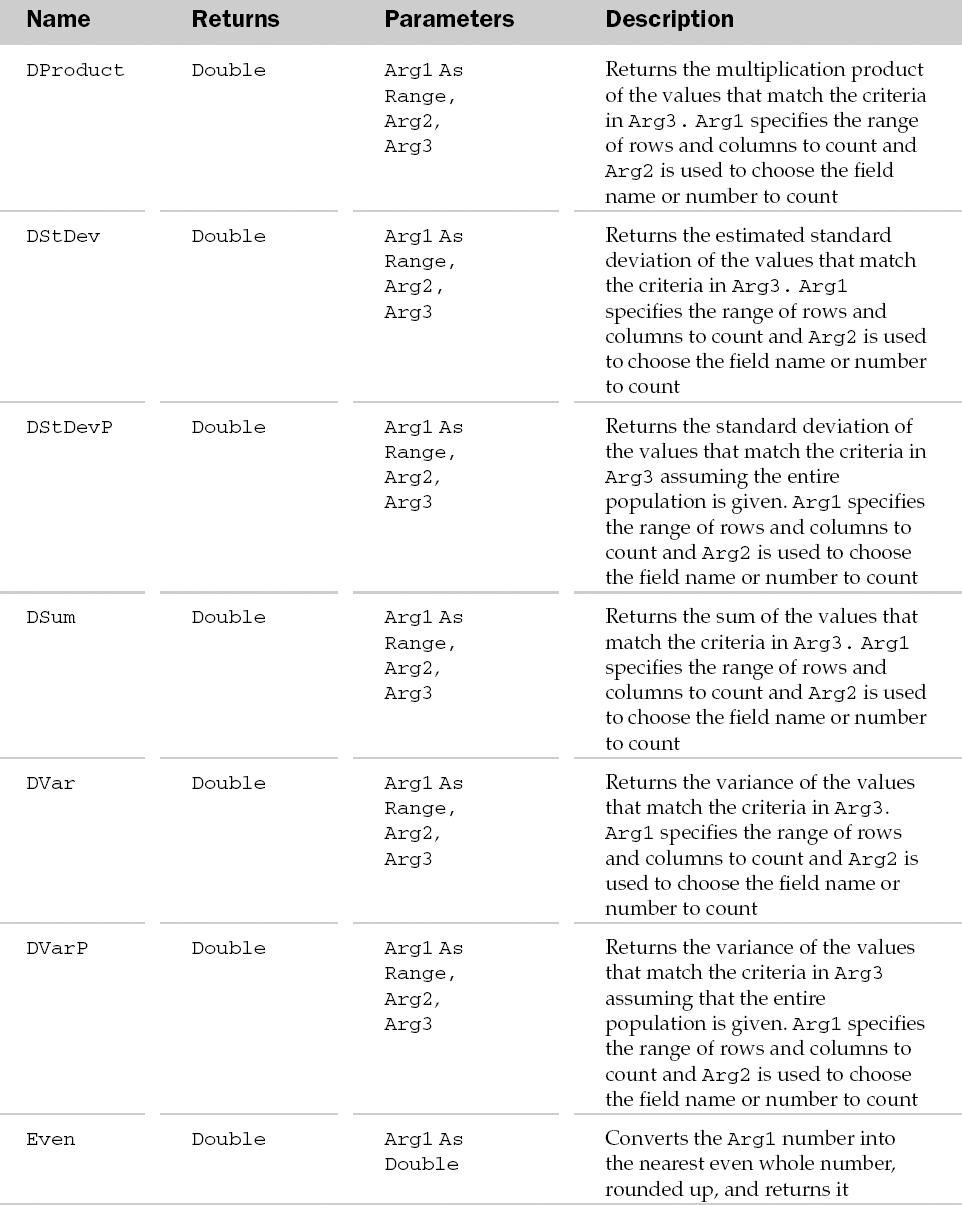
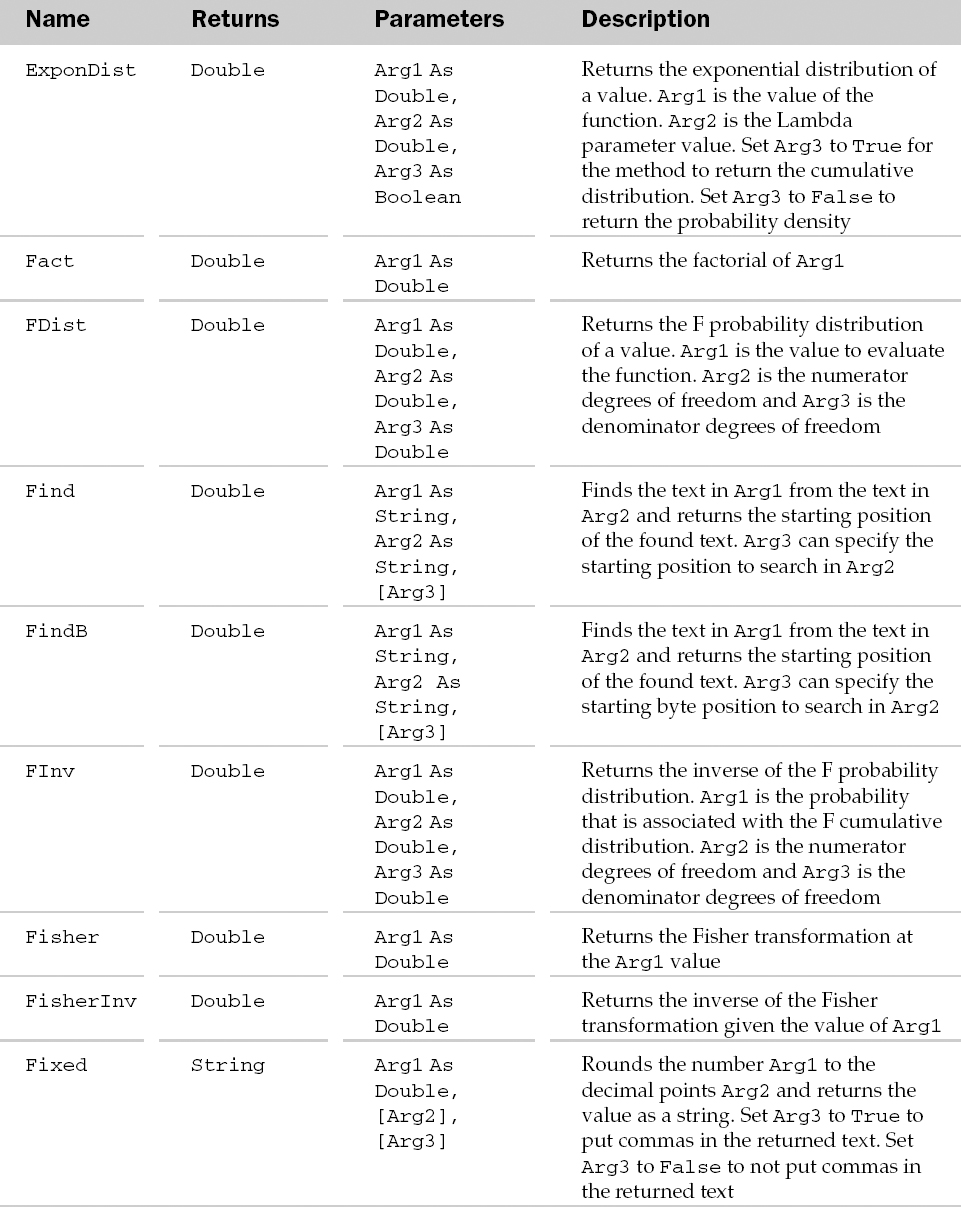
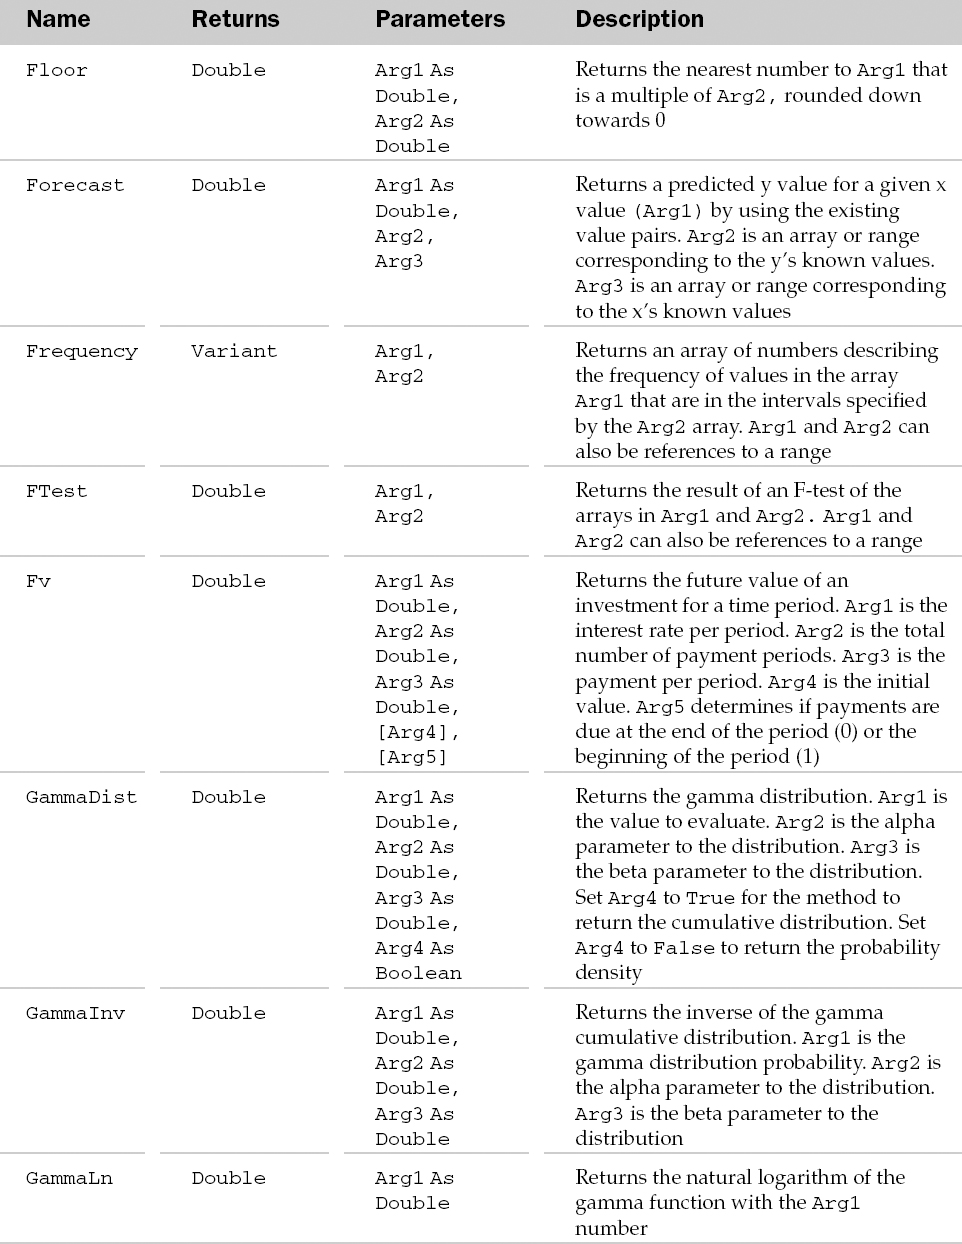
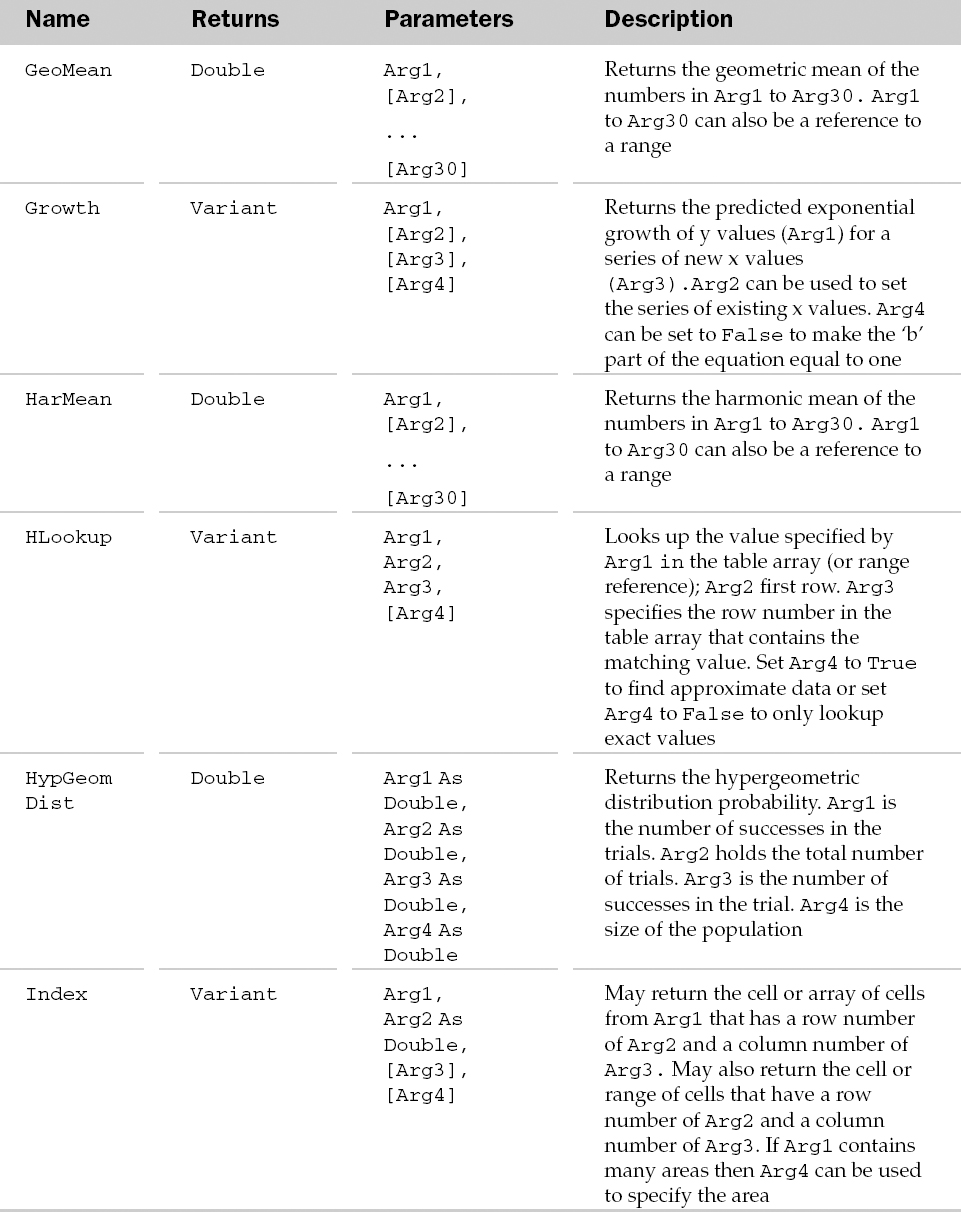
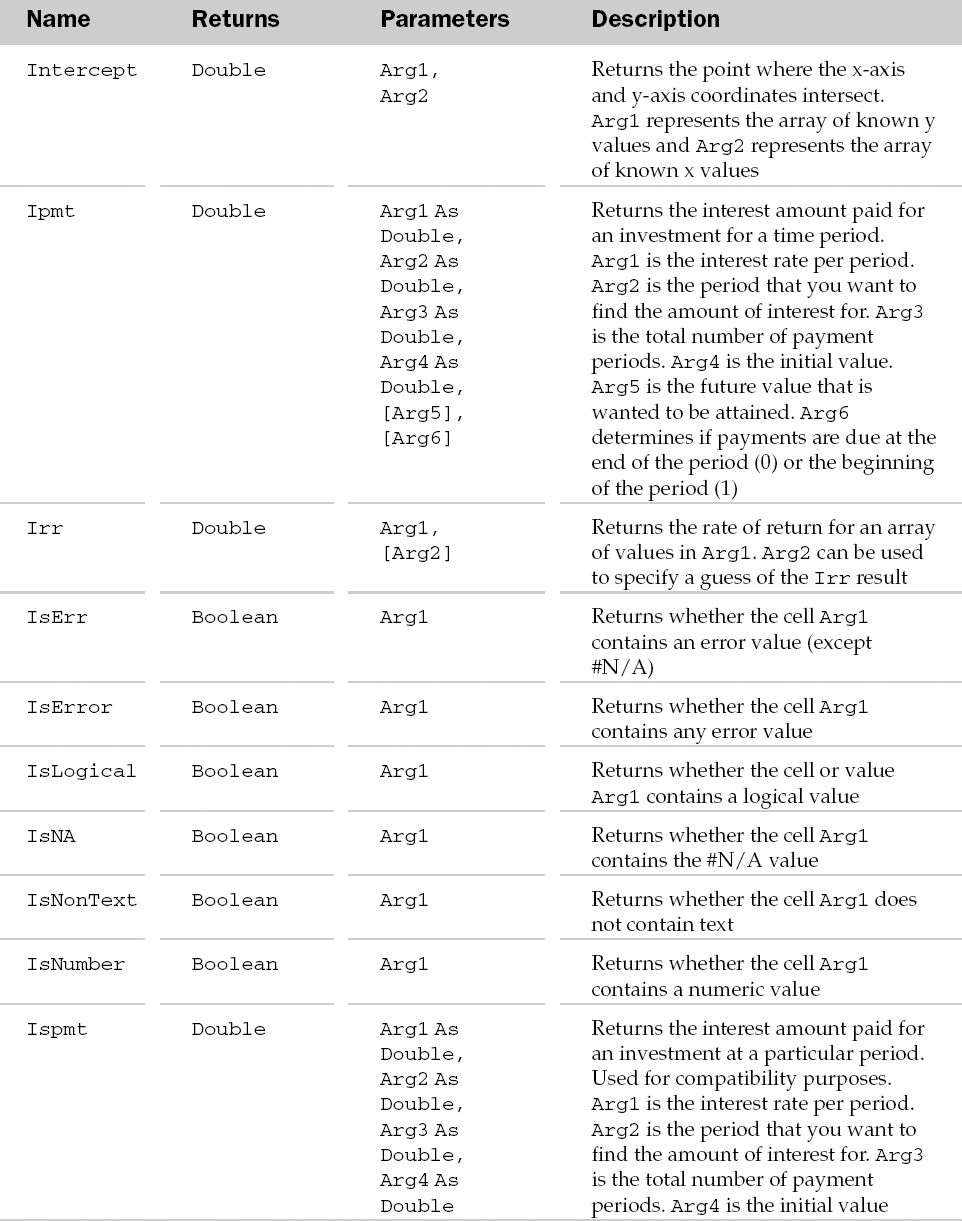
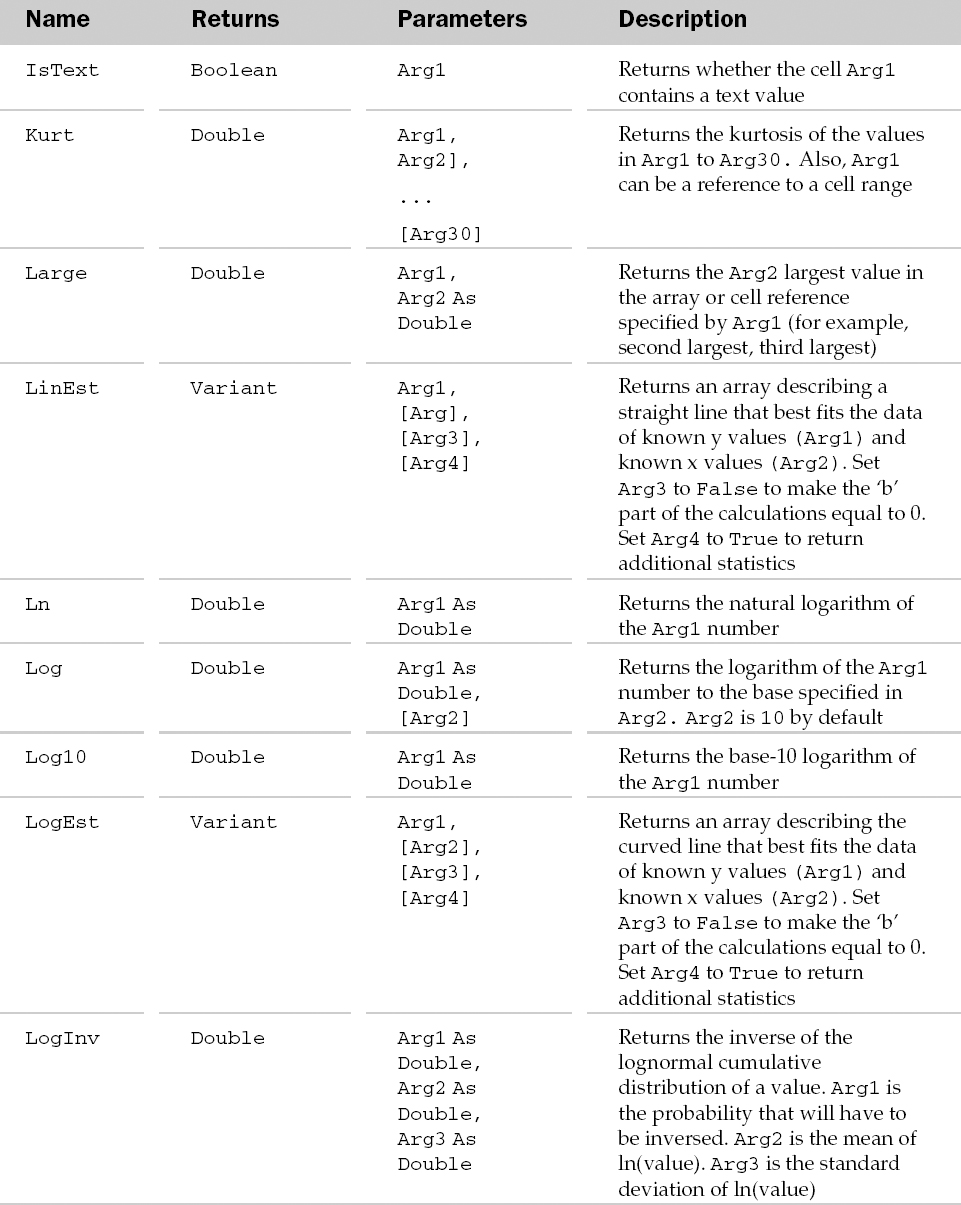
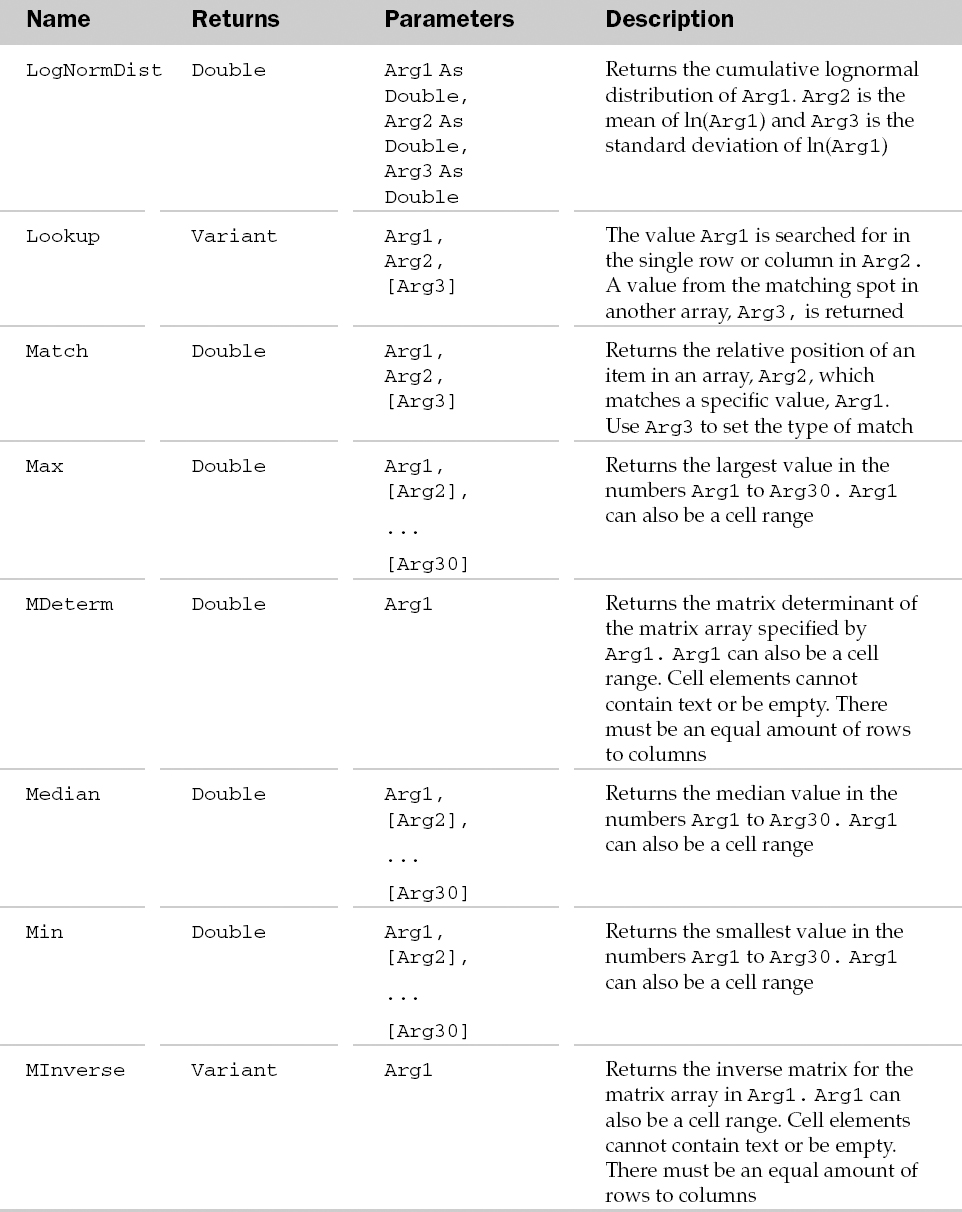
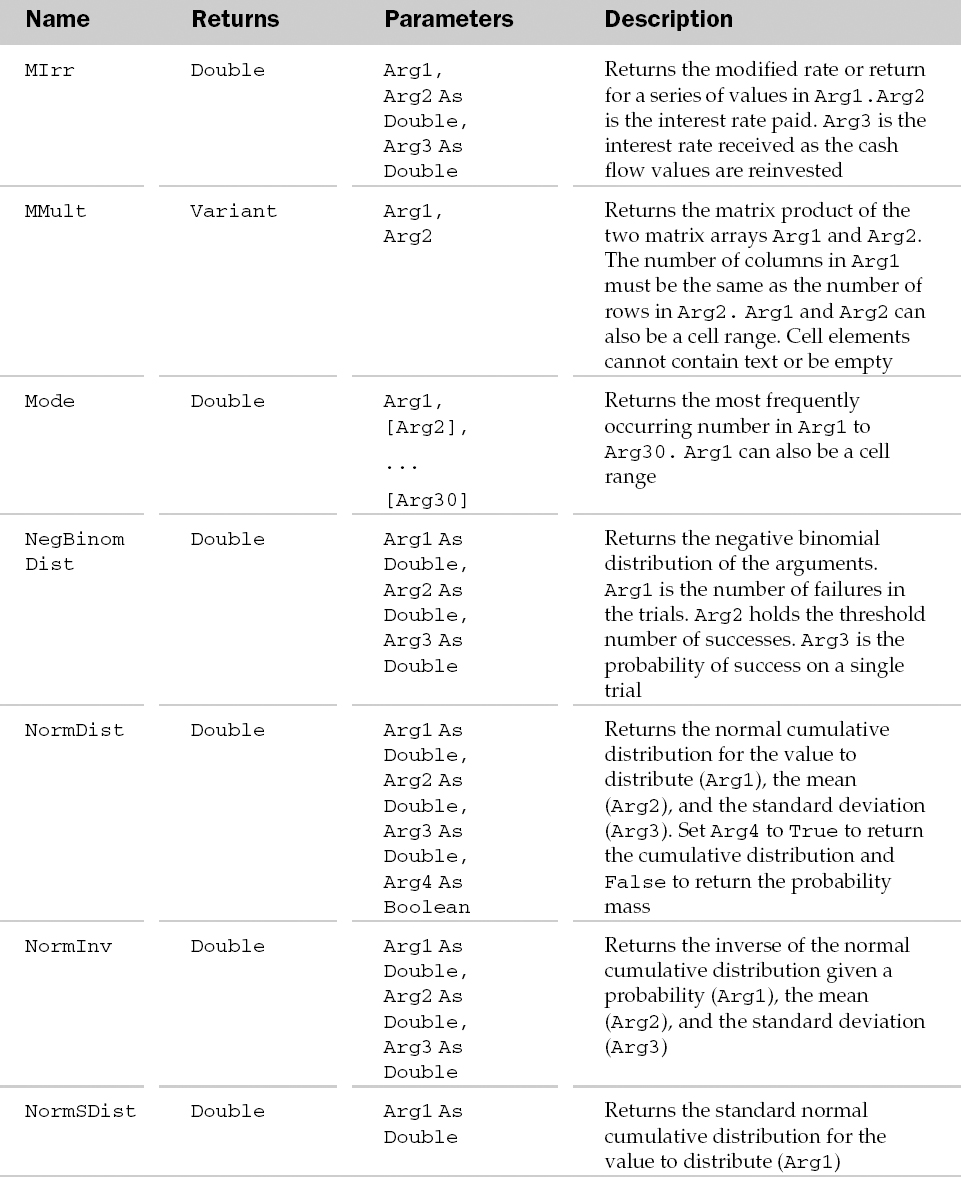
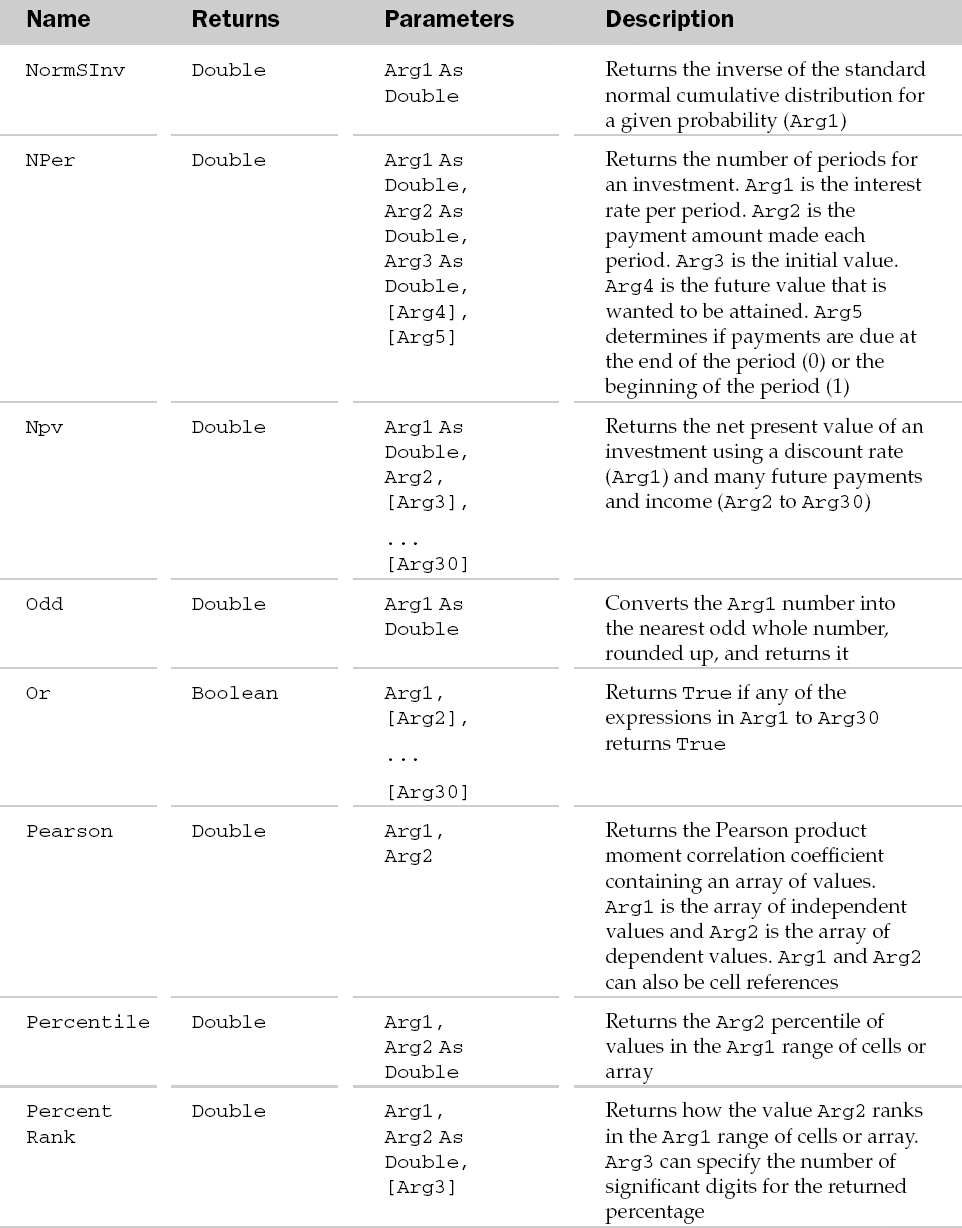
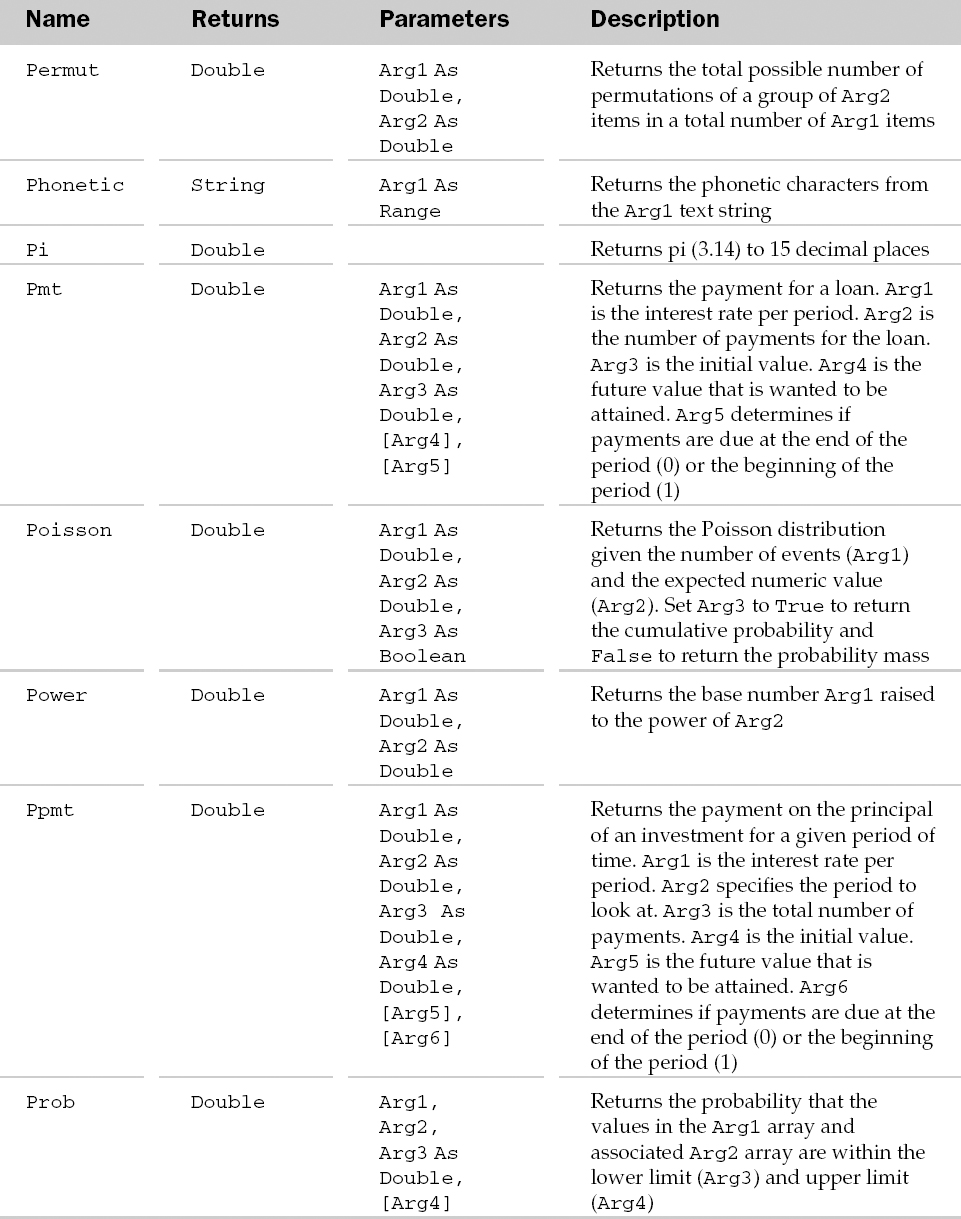
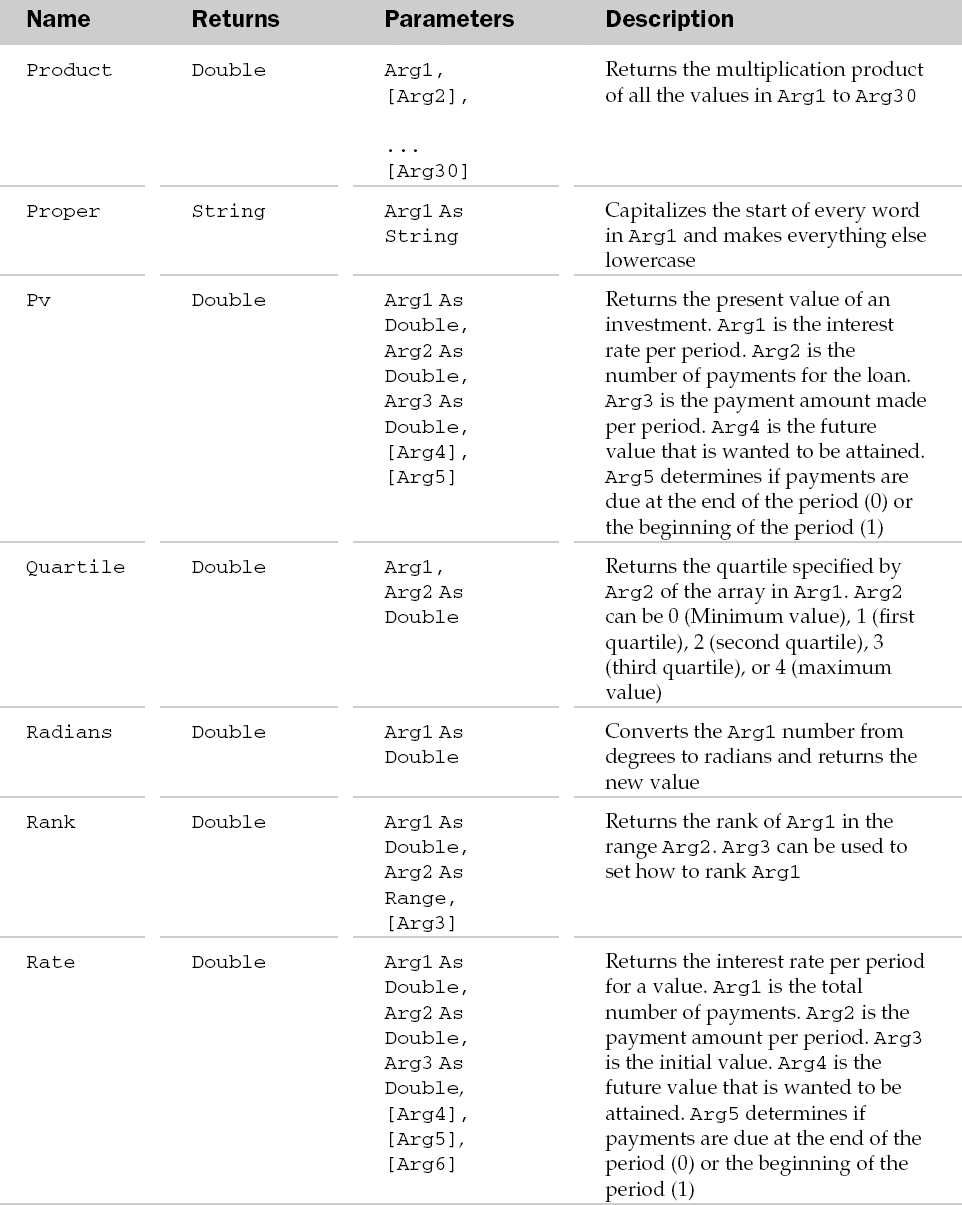
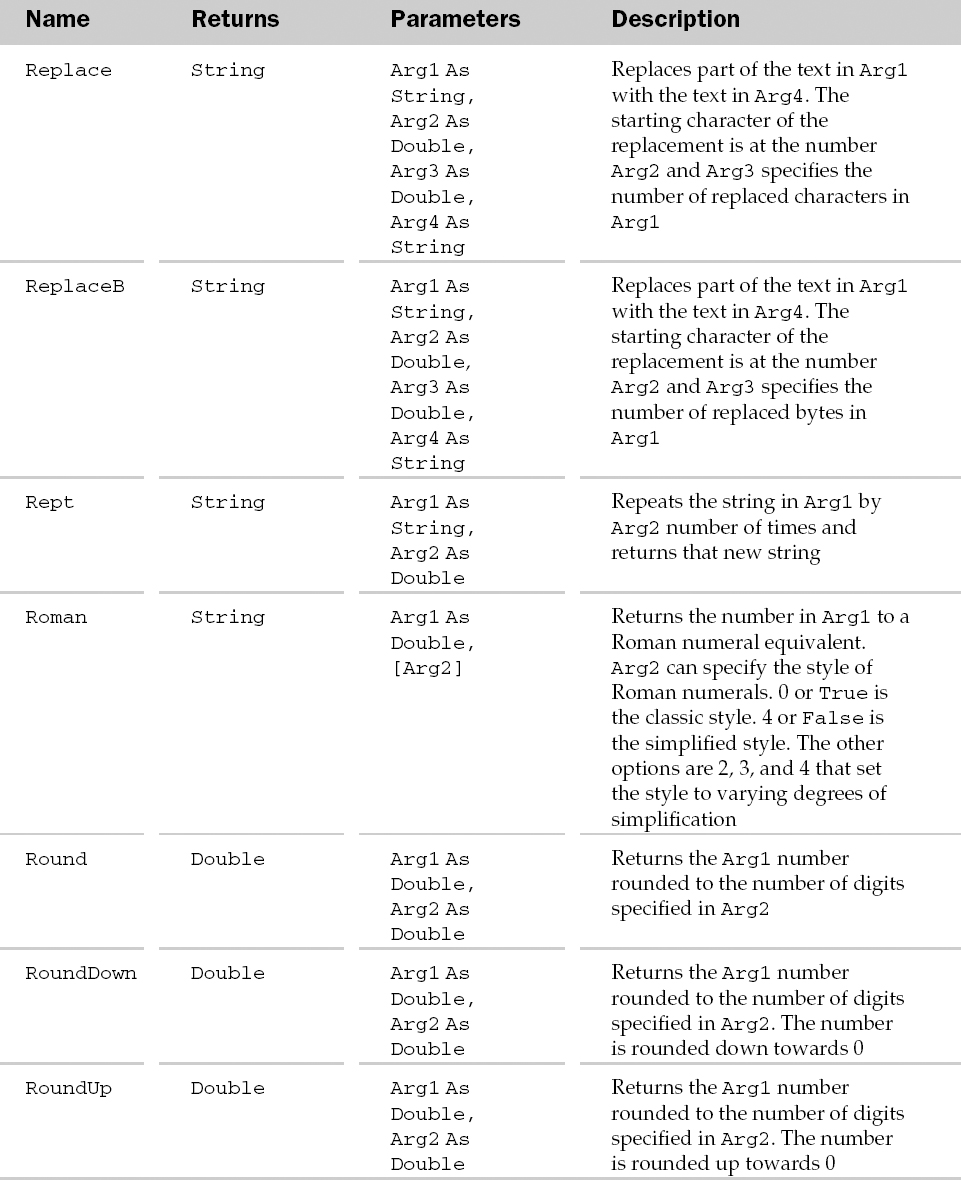
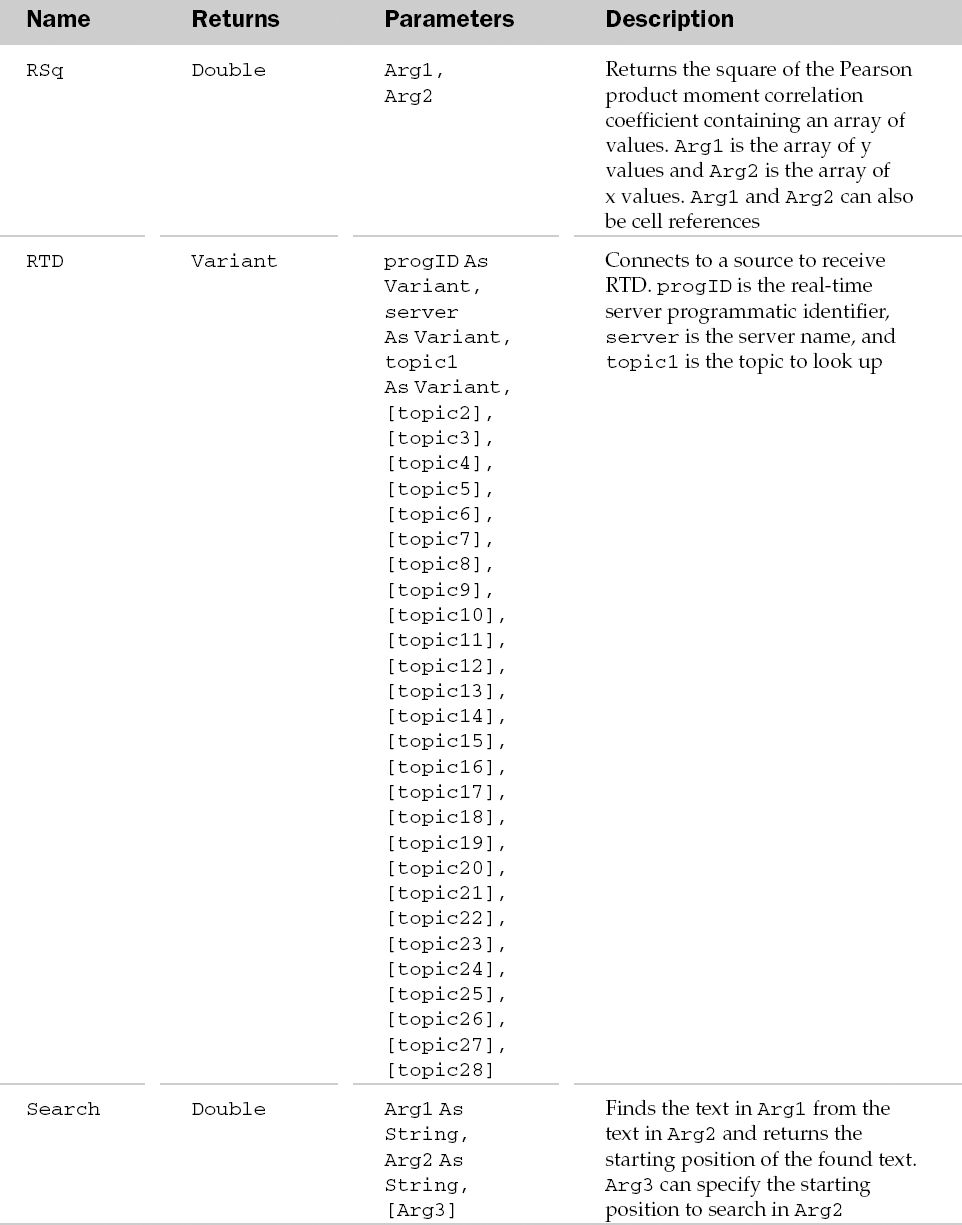
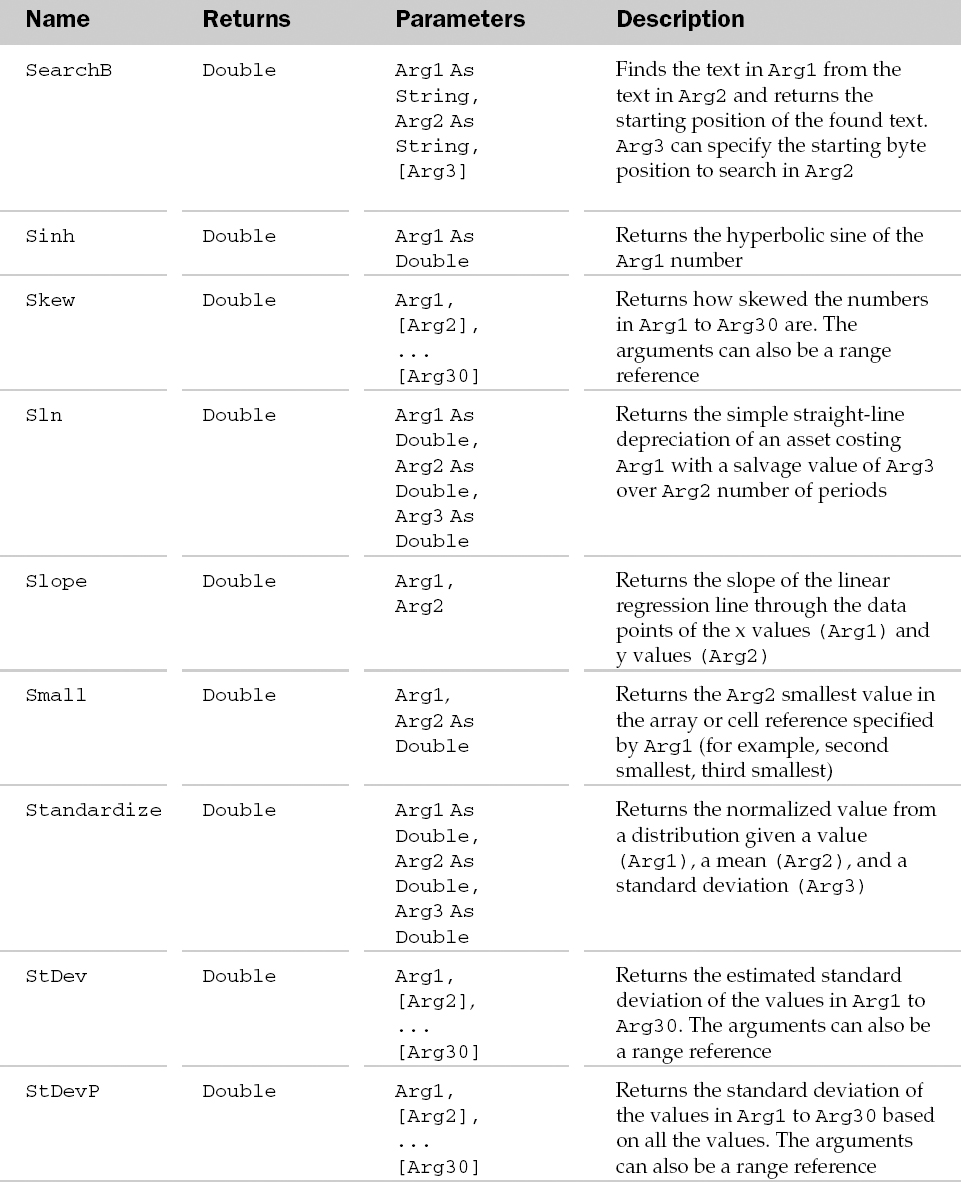
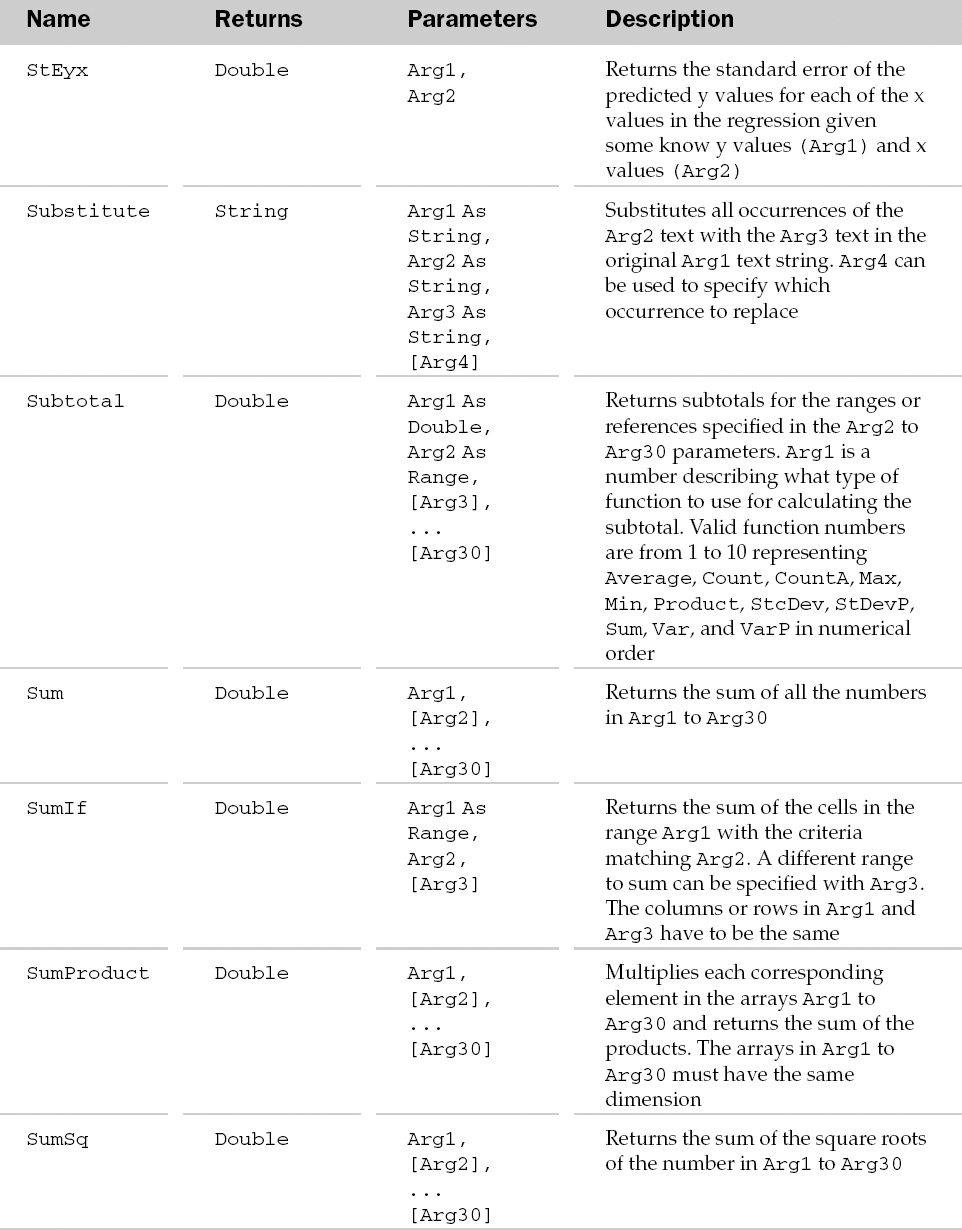
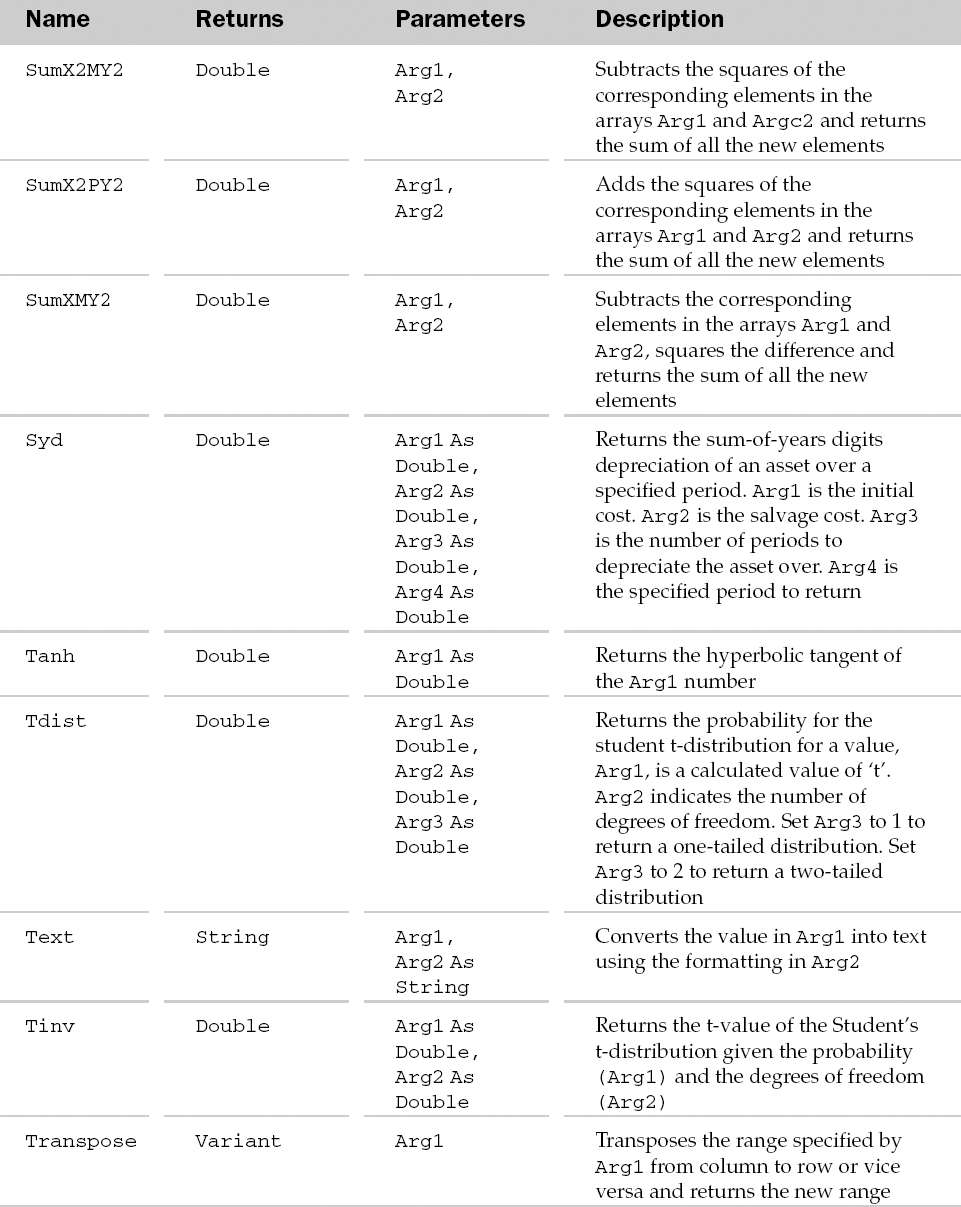
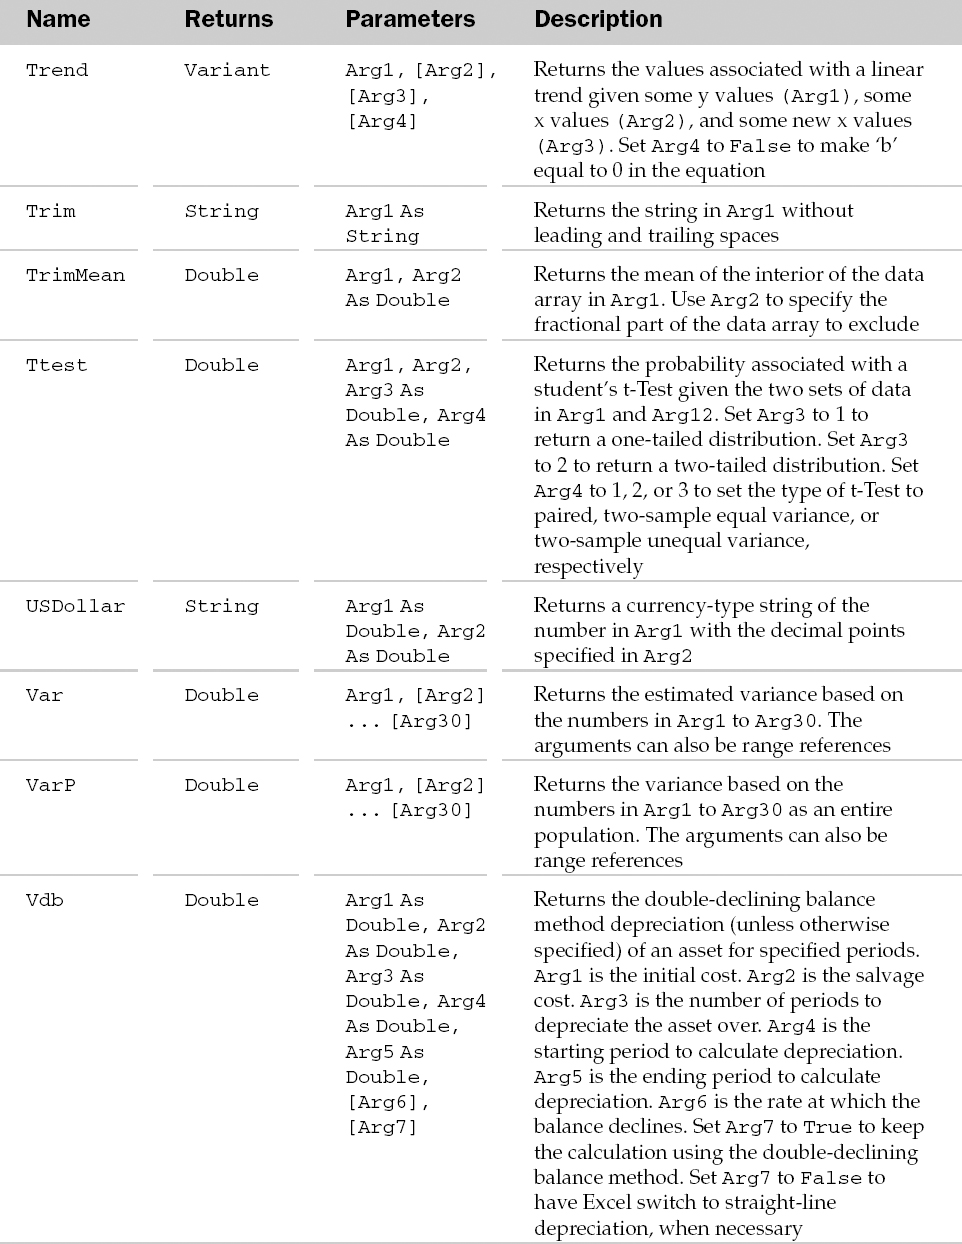
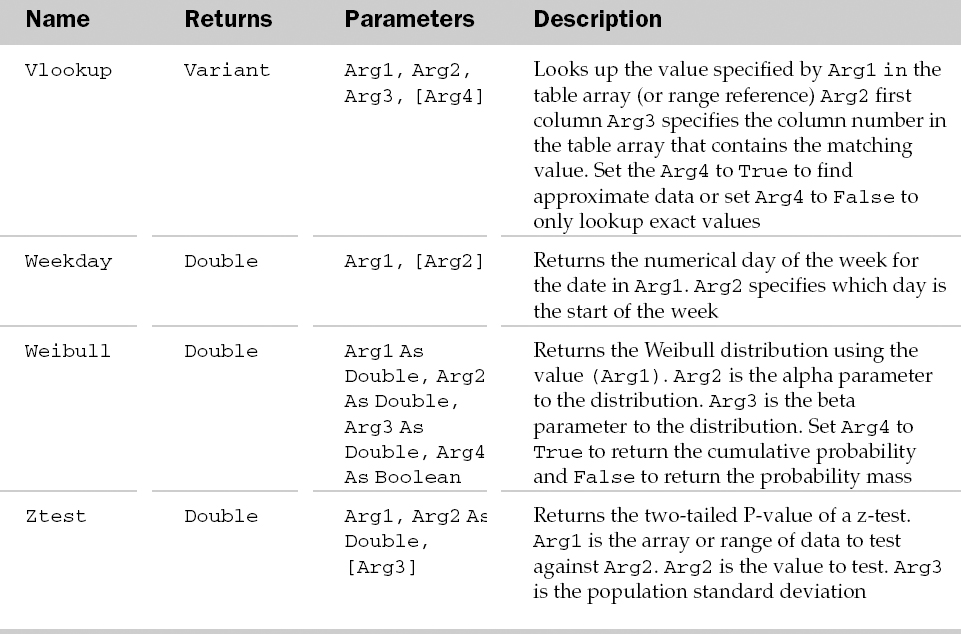
Example: WorksheetFunction Object
Sub GetBiggest()
   Dim oWSF As WorksheetFunction
   Dim vaArray As Variant
   Set oWSF = Application.WorksheetFunction
   vaArray = Array(10, 20, 13, 15, 56, 12, 8, 45)
   MsgBox “Biggest is ” & oWSF.Max(vaArray)
End Sub
XmlDataBinding Object
Represents the connection to a data soure for an XML Map.
XmlDataBinding Methods
XmlMap Object
The XMLMap object represents an XML Map that has been added to a workbook.
XmlMap Properties
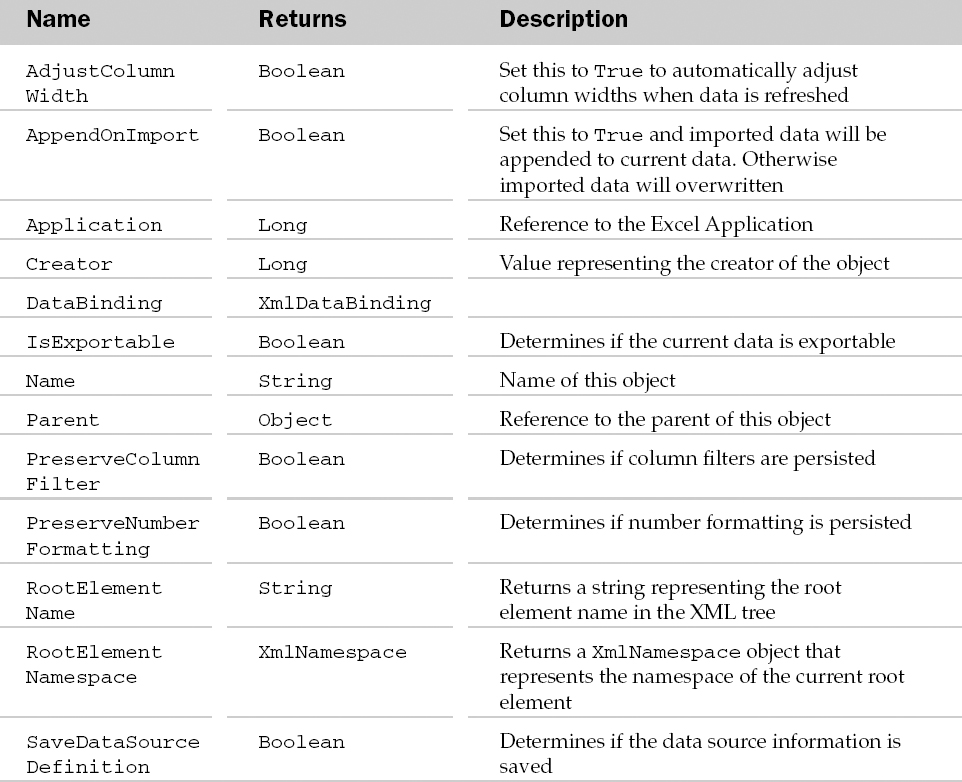
XmlMap Methods