In the preceding chapter, you read about the different kinds and approaches to debugging. That chapter laid out the concepts for you and discussed how to set up and control the debugging options. In this chapter we actually debug a web page locally and show you most of the features and options in action.
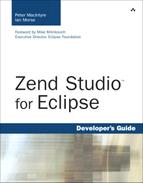
As you would expect, an entire perspective is already laid out for you in Zend Studio for Eclipse for the debugging process. To open it, select Window, Open Perspective and then select Other to see the entire list of perspectives. From this list, select the PHP Debug item. The display closes some views and opens a few others. It should look similar to the display shown in Figure 12.1.
As you can see from the figure, this perspective provides a number of new views that you may not have seen so far in your use of Zend Studio for Eclipse. Across the top of the IDE is an update to the layout and content in the toolbars. We discuss the views as we make our way through the chapter and run sample code through the debugger, but first a little discussion on breakpoints is warranted.
Breakpoints are stopping points that you can set within the code files so that you can interrogate any of the information being handled by the debugging process. They are within your control: You can set them on a specific line of code, you can ignore them, and you can remove them. You will find that the breakpoint is one of the most useful features in the debugging process.
The code sample that we use for this debugging exercise is available on the book’s website for download and is associated with this chapter. The filename is DebugDemo.php. Locate this file and add it to an existing project, or create a new one and import this file into it. You should have the file open in the PHP Code Editor, as shown in Figure 12.1.
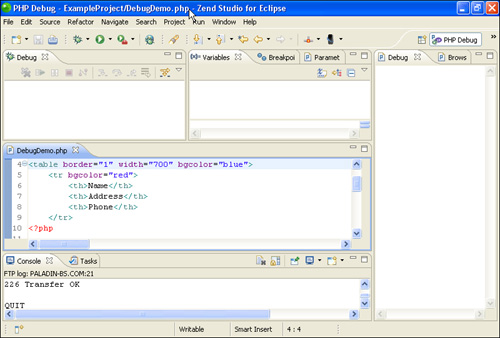
At the top of the PHP Debug perspective, in the middle of the display, is a collection of three views: Variables, Breakpoints, and Parameter Stack. Click on the Breakpoints tab to bring that view into focus. In the marker bar on the left side of the PHP code editor, double-click on line 14, which has the following line of code:
array ("Klaus", "312 Beethoven St., Frankfurt, Germany", "(44) 332-8065"),When you double-click on this line in the marker bar, a blue dot appears beside that line, as shown in Figure 12.2. This is the setting of a breakpoint on this line of code. This information also appears in the Breakpoints view at the top of the perspective. Now that you have set this breakpoint, the debugger will stop on this line of code before executing it and suspend the running of the code until there is further action from you.
There are also other aspects to setting a breakpoint. You can set what is known as a conditional breakpoint that will trigger only when certain conditions (or expected conditions) become true.
Another thing that you can do with breakpoints is suspend them or turn them off after they are set. When you do this, the blue dot in the marker bar turns to a hollow dot with a white center. This suspends the validity of the breakpoint until you turn it back on. This capability gives you the option of having the breakpoints stay in place until you want to reactivate them again. This on/off feature also manifests itself in the Breakpoints view.
Note
Another useful feature of breakpoints and team development is that you can export or import all or a selection of your breakpoints. If your development team is working on a problem, you can share the breakpoints in this fashion. Just right-click on the Breakpoints view and select Export Breakpoints (or Import) and follow the onscreen directions.
Breakpoints alone are not all that there is to using the debugger, of course, but understanding the breakpoints and how to manipulate them is a great starting point to mastering the whole debugging process.
Now that you have a file with a few breakpoints set, you can start the debugging process to see how it all comes together.
There are a number of ways in which you can debug files and PHP applications, but for the purpose of this chapter, we focus only on the localhost and debug as PHP script approach. Refer to Chapter 11, “Introduction to Debugging,” for more details on the additional concepts and methods of debugging.
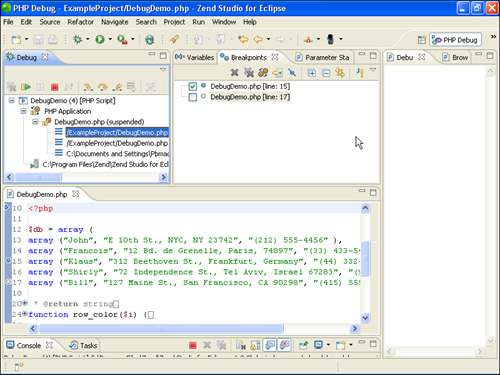
You can start the debugging session in the following ways:
Right-click and then select Debug, PHP Script.
Press Alt+Shift+D, H.
Select Run, Debug As, PHP Script.
Select Debug As, PHP Script from the toolbar icon that looks like a green bug.
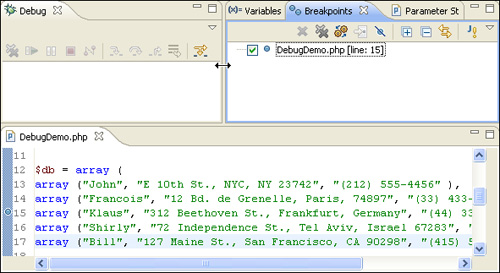
So there are at least four ways in which to launch the debugger in a local environment. After the debug session is launched (depending on the debug preferences that you have set), the debugger either stops at the first instance of a line of PHP code, or it runs until it stops at a user-set breakpoint, the program finishes, or there is an abnormal end (crash). The setting that I have used here is for the debugger to stop at the first line of PHP code. As shown in Figure 12.3, a number of items are instantly activated when the session is launched.
Note
In Figure 12.3 notice that I have moved the Variables view over to the right pane so that I can view it over the entire height of my screen. When you are using the debugger and are trying to hunt down a variable or a system array value, you may appreciate having as much vertical space as possible.
After the debug session is launched, you see lots of activity in the views that surround the code editor. But let’s focus on the editor for now. Look for a small blue arrow in the marker bar on line 10 where the <?php tag is; this blue arrow points to the line where the debugger is currently paused. As you step through the code with the debugger, this arrow moves along with you so that you always know what line of code you are currently working on. Just above the code editor is a view labeled Debug on its own in this perspective. This is the main activity view that reports various information on the status of the debug session, what file you are currently debugging, and the location of that file, among other tidbits of information. Using the toolbar on this view, you can control most of the actions that you want to perform on the code while it is running through the debugger.
Note
At any time during the debug session if you want to terminate the session, click on the red square icon with the hover value Terminate in the Debug view’s toolbar. Clicking this icon stops the current instance of the debugger and returns you to the Debug perspective.
Depending on the context of the debug session, Zend Studio for Eclipse activates or deactivates some of these toolbar items. In this instance, the first, third, and fifth toolbar items are deactivated, for example. For now, hover over the first yellow arrow that is pointing down and has two blue dashes on either side of the arrow. This is the Step Into debug command, which allows you to step through your code one line at a time. It has this name because it “steps into” the code, and if there are deeper levels of code to go to, such as a function call, it steps into that code and also begins to debug that code.
Before you step into this code, notice that you have already executed some HTML code before you got to this point in the debugging session. If you look at the views on the right side of the display, you see a view called Debug Output. Click on its tab to bring it into focus if it is not currently in view. Here, you can see the HTML code that has been sent to the browser so far. There is the <HTML> tag, the <body> defined, some text, and the start of a table layout with some column headers defined. Using this view is a great way to see what HTML code is being sent to the browser as your code executes. You should also see a view called Browser Output, and if you bring that view into focus, you can see what your code looks like in the browser context as it moves along in its execution. So as you are stepping through your code, you may want use these two views from time to time.
You can also use the Step Into command on the Run menu (or press F5) to accomplish the same single-step actions. Press F5 a few times to get to the function called display_workers, which should be on or near line 39 of this code file. When you get to this point, press F5 one more time and notice what happens in the Debug view. Figure 12.4 shows the Debug view, with the call stack, or the path through the code that you have taken so far. In this case you have taken two major steps and are currently working on your third. If you are so inclined, you can click on any of these steps in the call stack and be taken to the code sections that they reference.

Note
The icon to the right of the Step Into icon on the Debug view toolbar is called Step Over. This icon allows you to bypass a section of code, such as an entire function that you know is working properly.
The next icon, called Step Return, is similar to Step Over, except that it runs until it leaves the current function or subsection of code that it is in, halting at the code that should be run on its exit.
Because you have been stepping through the code one line at a time, you may not have yet noticed any advantage in having breakpoints set. With this same sample code if you want to set another breakpoint on line 57 (where the last print command is), click the Resume icon (a yellow vertical rectangle with a green arrow pointing to the right) on the Debug view. The debugger simply runs through the code until it hits a breakpoint or anything else that may make it stop. In this case it should stop at your set breakpoint. If you have been watching the Debug Output view at the same time, you should now see some additional content in that view. Some more HTML output should be visible now: the beginning content of the output tables that this code should be building for you. If you click the Resume icon one more time, you see the next row of information being sent out to the browser and the debugger stopped again on line 57 where the breakpoint is set.
Now let’s take a deeper look at the Variables view. Click on the tab for this view to bring it into focus, as shown in Figure 12.5. I have expanded a few of the embedded values here to show you that they are expandable. In this view you see every variable that PHP is currently managing during this debug session. All the environment arrays are shown under the GLOBALS heading, and all the user-defined variables are also here. This view automatically updates itself at every execution of code, so what you are viewing at any given time may not be the exact same the next time you run through your code because code and context may have changed.
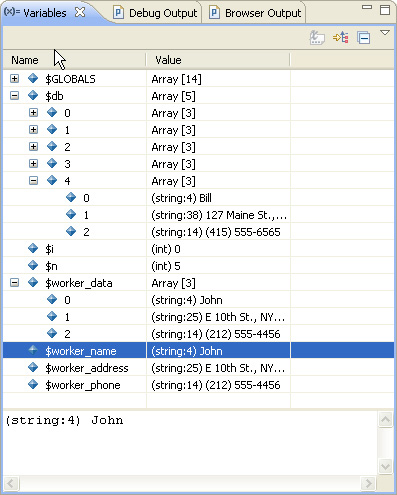
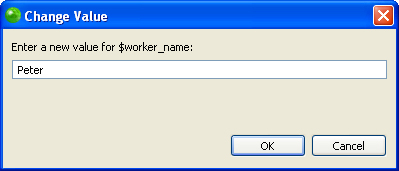
Also here in the Variables view, you can alter the value of the variable yourself if you want for debugging purposes. Simply select the value that you want in the Variables view, right-click, and then select Change Value. The dialog shown in Figure 12.6 appears.
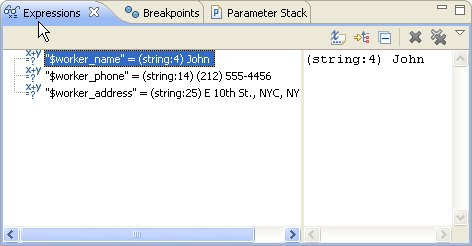
Another capability that is handy to know in conjunction with the Variables view is how to watch certain variables and their values exclusively as you run through your code. Instead of having to display all the variables and manage their display in the Variables view, you can select certain variables to watch that are of interest to you in a particular context. To do this, select the variable that you want, right-click, and select Create Watch Expression. A new view called Expressions appears in the Zend Studio for Eclipse IDE, as shown in Figure 12.7, and it adds your new variable and its value to a subset list of variables (I am watching 3 separate variables in this example).
You may also have noticed another view called the Parameter Stack in the Debug perspective. This view shows you the values of any variables or parameters that are being passed between functions. So in this context you see that in the function called row_color there is a parameter called $i being passed to it. When you are inside this function, you can select this view and see the value of $i in this case. The Parameter Stack view is a nice tool to make sure that the values that a function is expecting are indeed being sent to it.
Once last point to address here in relation to the debugger is what the code editor shows you while in the debugging session. If you hover over a variable, the cursor shows you the variable’s current value. This feature saves you from having to watch a variable or having to locate this variable in the Variables view.
In this chapter you learned about breakpoints and their value within the Zend Studio for Eclipse debugger. You saw how to initiate a local debugging session, check values for variables, and alter those values. You also saw the call stack in the Debug view, the Expressions view, and the two Output views. All these views are arranged within the Debug perspective and are extremely valuable tools in your developer’s toolbox for fixing and debugging PHP application code.