
The Zend Studio for Eclipse code editor is the location or view in which you will spend the majority of your development time. Therefore, it is important that you really get to know what its potential is and just how much power is stored within it. This chapter focuses exclusively on the code editor and what it can do in the theme of code development. This chapter does not cover the debugging features; Chapters 11, “Introduction to Debugging”, and 12, “Running/Stepping Through Your Code”, are devoted to that aspect of the editor and its extensions into other views.
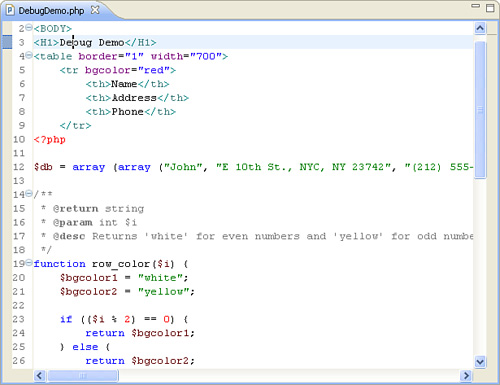
Let’s first look at Figure 4.1, which shows the code editor, and then look at the features that are pointed out on it.
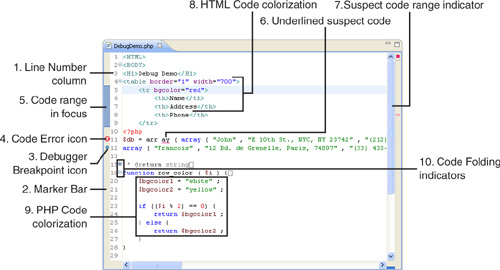
Now let’s go over the areas that are pointed out in detail in the order they are numbered:
This is the line number column of the code editor. When errors are reported, every attempt is made to locate the line number that the event occurred on; this is your reference for locating and resolving the problem. You can turn these line numbers on and off in Zend Studio for Eclipse preferences.
This is the marker bar. It is the gray left margin that displays any contextual information to the code. Error and warning icons, debugger breakpoints, and code ranges are all displayed here.
This is a debugger breakpoint icon. You can turn this feature on and off on a line-by-line basis and can control it by right-clicking on the line in question within the marker bar and selecting Toggle Breakpoints. You can also accomplish this by double-clicking on the line in question within the marker bar to turn on or off the breakpoint.
This is a code error icon. It is displayed when Zend Studio for Eclipse finds something that is a fatal error in the code. A yellow triangle caution sign appears if there is just a warning situation to report. If the error is not immediately apparent (in this case, the
arraykeyword is broken in two), hover the mouse pointer over the error icon in the marker bar to get more information on the error.This is the representation of the code range currently in focus within the code editor. The long blue band shows up in the marker bar to show the range of the context. In this case it shows the range of code between the
<tr>and</tr>tags. This feature is helpful if you have many embedded tags and want to see the start and end of a particular range.When the code editor finds some code that is in question, it underlines the errant code with a red squiggly line. Shown here, the code editor has detected that the code
ay(broken array function call) is wrong.On the far right side of the code editor is another representation of discovered code errors. The red box in the right margin indicates a general location in the code where errors reside.
HTML code highlighting is shown in this item. Here, the HTML is colorized (you are able to customize the colors in the preferences). In the current context the HTML tags are one color, the options within the tags are another color, and the raw text is yet another color.
The PHP code is also colorized and also customizable. Here, variable names appear in one color, their assigned values appear in another color, language constructs appear in still another color, and so on.
Included within the line numbers column is also the capability to fold down sections of code that are not required for viewing at any moment in time. Here, you see the code from lines 19 to 23 folded down and represented by the gray plus sign icon. To expand the folded code, click on the plus sign; the code is expanded, and the icon is changed to a minus sign.
The code assistant is a great tool to help you save time with code development by contextually suggesting completed code for you. By contextually, I mean that the code editor “knows” where you are in your code (writing HTML or PHP) and can suggest completed code accordingly.
In Figure 4.2, the section of code being written is calling the array function. At the placement of the cursor (as the code word array is being keyed in), the code assistant is activated within a pop-up overlay with all possible suggestions that it is aware of.
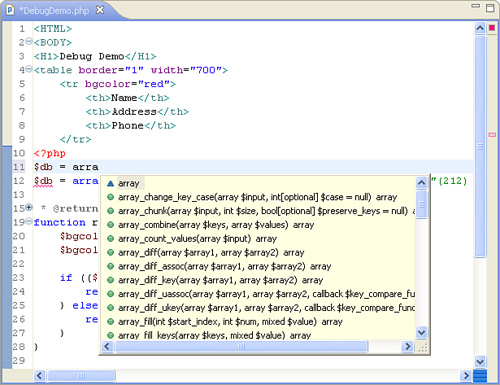
As you can see, there are a lot of code particles that have to do with arrays. You can scroll down this list and select the function that you want by pressing Enter on the correct line or by double-clicking on the same. When the item that you want is finally selected, the code assistant inserts the code portion that you want and places the cursor at the best possible location.
If you have code templates defined, they are also included in the list of offered code completion items. If they are selected, the same process takes place, except that you may be inserting a number of code lines rather than completing a single code function command.
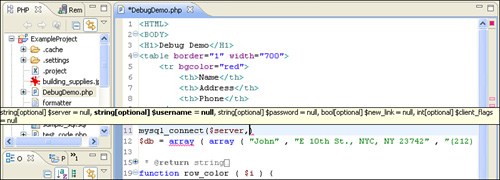
Another aspect of the code assistant is that if you are entering a function call that has parameters defined for it, it takes you through the completion of the function’s syntax for you. As you can see in Figure 4.3, we are in the middle of completing a function call to a MySQL database-related function and are working on the second expected parameter.
The preferences to the code assistant feature are available under that PHP section, which you open by selecting Window, Preferences. There is some detailed explanation of the options in Chapter 3, “Environmental Settings.”
The next feature that we want to look at in this chapter is the code formatter. This feature was covered briefly in Chapter 3.
Using the code in Figure 4.4 as an example, two segments of code are not formatted well for readability. The first one is an HTML segment showing a <tr> tag and some <th> tags all aligned to the left side of the code editor. Then further down into the PHP code is an if statement that is likewise left-aligned.
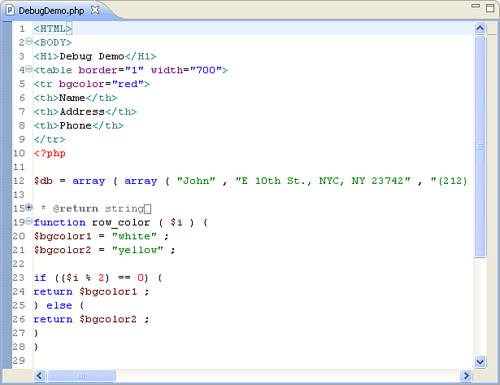
Right-clicking on the code editor opens a pop-up menu with a Format option. After you choose this option, the code formatter then goes through the code file in question and formats it using the rules that you have established in the Zend Studio for Eclipse HTML preferences (for HTML code) and Zend Studio for Eclipse PHP preferences (for PHP code). You can select Format Active Elements if you want to format only a selected section of code; otherwise, the Format menu item involves the entire open code file. Figure 4.5 shows the properly formatted file after the code formatter has done its job.
The last item to look at in relation to the code editor is the Properties view. You display this view by selecting Window, Show View, Other, and selecting the view by this name from the General folder. As you can see in Figure 4.6, this view is much like a Properties screen that you can see in any client/server-style IDE.
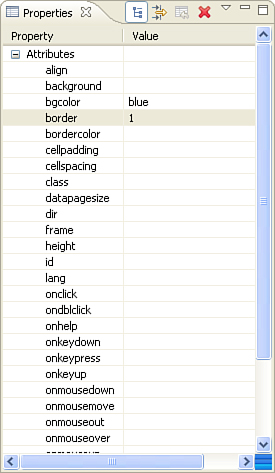
There are some neat features to this view that, at the time of this writing, are activated only for the HTML portion of the code editor. As you can see in this example, all the attributes for the HTML table tag are displayed in a grid format. This is a fully editable view, and the nice thing about it is that it is bidirectional. By this, I mean that as you write HTML code, this view updates itself with any changes as they are typed. It also works in the other direction in that if you make adjustments in the grid, it also updates the code automatically.
There is more coverage of the Properties view in Chapter 14, “The WYSIWYG Designer.”
You were given a good introduction to the PHP code editor in this chapter. A few other gems can be found or launched from within this code editor, such as the debug process and refactoring process. These features are well covered in other areas of this book, and you are also sure to find some of these features on your own as you become more proficient with this code editor.