Debugging can be a tedious task. The problems that most users have when debugging are not usually extremely complex when the bugs are found. The problems usually exist because of the sheer number of places where bugs can “hide.” Most seasoned programmers appreciate a little help, an extra set of eyes, or some automated help from a debugger. This chapter looks at some of the general features that Zend Studio for Eclipse offers to help with debugging. After reading this chapter, look at Chapter 12, “Running/Stepping Through Your Code,” to see how to run the debugger and step through your code.
You can access the debugging preferences by selecting Window, Preferences. There are two main places in the preferences tree that you can make changes to debugging preferences. They are in Run/Debug at the top tree level and in PHP, Debug. Figure 11.1 shows some of the debug preference choices available in Zend Studio for Eclipse.
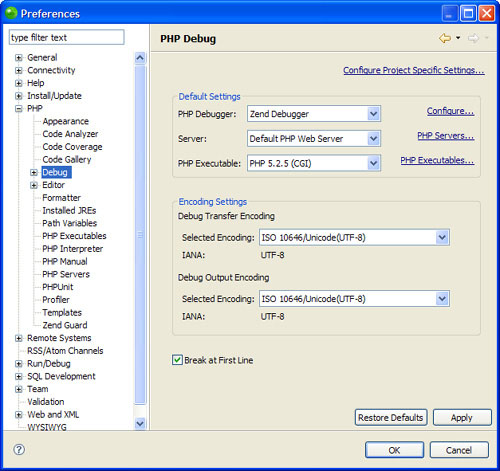
The main configuration option in PHP, Debug is displayed as part of Figure 11.1. You can set the default debug server, the version of PHP where you want to run the debug (either PHP 4 or PHP 5), and the encoding options. Other configurable options are Installed Debuggers and Workbench Options. The debugger options allow you to add, remove, and modify settings that Zend Studio for Eclipse will use in a debug session. Using the Workbench options, you can set up preferences for running multiple debug sessions and if Zend Studio for Eclipse should switch back to the PHP Perspective after the debug has ended (as you might expect, there is a debug perspective; it is covered in Chapter 12).
Most of the options for debugging exist in the Run/Debug area. In this area, you can establish some general settings for the debugger, such as when to automatically launch the Debug view and text colors for output in the debug console. You can also set options for external debugging tools, launching, perspectives, string substitution, TCP/IP monitoring, and views. As with most things in Zend Studio for Eclipse, the default values should work fine for most cases. However, if you are trying to set up a particular debug scenario, this is the place to look for configuration options.
In Chapter 5, “Views in the PHP Perspective,” we looked at some useful views in the PHP perspective. One of them was the Problems view. If you have used Zend Studio for Eclipse for any amount of time, you have probably found this view to be helpful if you miss a semicolon or some other syntactical error. Although this view does help prevent some errors during coding, it is not that helpful when you’re trying to track down a logical error or an error that is being generated because of external information (such as returned values from functions or reading from data sources).
Debugging a file locally allows you to execute a script line by line and pause execution to look at all aspects of the script while it is running. You can also stop execution at specified points called breakpoints if you have narrowed down a problem area to a few lines of code.
The problem with debugging a file locally within the default (or modified) Zend Studio for Eclipse configuration is that the file may run differently on a certain server. Differences in php.ini, Apache, or other web server configuration files have a high potential to make a script run completely different. Running a remote debugging session can solve this problem.
Remote debugging is not really that different from local debugging after your connection is established. The code, breakpoints, and other debugging tools are available and work the same way. The only difference is that when the script is executed, it is run on a remote server.
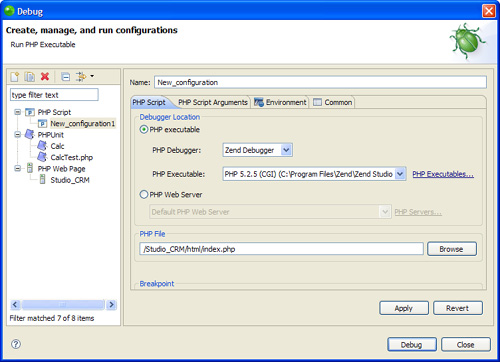
To start a remote session, open the Debug dialog, as shown in Figure 11.2. You can use the default debug configuration or create a new one. Next, change the Debugger Location from PHP Executable to PHP Web Server. You may add a new server to the list by clicking on PHP Servers. When your server is set up, select the file in your project that you want to debug and click on Apply or Debug. If your configurations settings are correct, the debug perspective launches, and you should be able to interact with the script as if it were a local file.
The final piece to the remote debugging puzzle is that there must be an empty file called dummy.php in the document root of the remote server. The debugger looks to this file to run the remote debug session.
This chapter provided an introduction to the debugging tools available in Zend Studio for Eclipse. You should be familiar with the configuration options for debugging. Zend Studio for Eclipse offers a remote debug option that allows you to run a script on a remote server and then debug the script as if it were local. The following chapter goes into more detail about specific ways to debug using Zend Studio for Eclipse.