CHAPTER OVERVIEW
Transfer is the bridge from skills learned in the training setting to skills applied in the workplace. When learningtransfers, individuals apply new knowledge and skills acquired during training to the job. Without transfer, there is no return on the training investment. In spite of its importance, transfer failure is common. Ways to use visuals to promote transfer differ for near and far transfer learning and for retrieval of factual knowledge. In this chapter we present research, psychological rationale, and examples to support the following transfer guidelines:
For near transfer skills use representational visuals
For far transfer skills use:
Interpretive and transformational visuals to build process mental models
Visuals to represent abstract ideas concretely
Varied context visual examples to build richer mental models
Visuals to promote inductive learning
For recall of factual knowledge, use visual mnemonics
Without transfer of learning, there is no payoff to training. And, unfortunately, transfer failure is more often therule than the exception. The previous chapters in this section have summarized ways to use graphics to direct attention, activate prior knowledge, manage cognitive load, and help learners build new mental models in long-term memory. Even if your instruction successfully supports all these processes, without transfer of learning the effort is mostly wasted. Transfer refers to the worker's success in applying new skills learned during training to their work tasks. Transfer is the bridge between learning in the training setting and job performance improvement in the work setting. Without that bridge there will be no return on the training investment to the organization.
Transfer failure is a common result of training. Your learners get an 'A' on your test in class but when they get back to the job, they do not do anything differently than before they attended training. This means that learning occurred but job performance did not improve. In an extensive review of transfer of learning, Haskell (2001) concludes that "most ofthe research on employee training clearly shows that although millions of dollars are spent on training in the public sector, there is little empirical evidence linking training to improved job behavior or employee attitudes" (p. 5). In this chapter we will consider ways visuals interact with the psychological processes that underlie transfer of learning. Of course transfer is influenced by lots of things other than graphics. For a broader discussion of transfer refer to Clark (2003)and Haskell (2001).
Transfer of learning relies on a psychological process called retrieval. Since all thinking occurs in workingmemory, new mental models built in long-term memory (LTM) during learning must be brought back into working memory when needed on the job. The transfer of new mental models from LTM into working memory is called retrieval. Retrieval requires the right hooks embedded in the new mental models that can be triggered by the job environment. For example, newly learned procedures of how to use a software system will be retrieved when the learner sees the same screens in the work setting as those used during the training. Viewing these screens on the job should activate the new skills learned about how to use those screens. The retrieval hooks must be embedded at the time of learning—when the new mental models are first formed in long-term memory. If the software training did not use the same screens and steps that the learner will use on the job, the retrieval hooks may not be adequate to ensure transfer. In this chapter we will look at what kinds of graphics can provide the best hooks for transfer. We start by distinguishing between two types of transfer near and far.
Some work activities are performed the same way each time. For example, accessing e-mail typically involves the same steps applied in the same sequence. We call these types of routine tasks near transfer. Most procedures are considered near transfer tasks. Procedures are typically trained by demonstrating how to perform the procedure followed by practice on equipment or problems similar or identical to those used on the job. Because the actions learned in training are very similar to the actions needed on the job, procedures are near transfer. There is only a small psychological distance between what is learned in training and what is required on the job. The majority of software training involves building near transfer skills.
In contrast, far transfer tasks do not have one single correct approach. Successful accomplishment of far transfer tasks requires the worker to adapt what they have learned to each unique situation. For example an effective sales person uses a different approach depending on the product, the client's needs, and the relationship they have with that client. These non-routine tasks require judgment to adapt newly learned skills to each unique job situation. Therefore, the gap from the training environment to the job environment is considered far.
Most jobs involve a combination of near and far transfer tasks. Often, however, job success relies more on near or on far transfer, depending on the mission of the organization. Knowledge work such as design, analysis, and problem solving relies on far transfer skills. Likewise, far transfer skills underpin most tasks that rely on successful interpersonal relationships such as sales and management. In contrast, production work environments as found in most manufacturing organizations require a consistent application of the same procedures to reliably generate a quality product.
In the next sections we summarize the best instructional methods needed to teach near and far transfer skills.
In 1901 the famous American educational psychologist Robert Thorndike proposed that successful transfer requires newskills to be learned in exactly the same context in which they will be applied. He called his transfer principle identical elements. According to identical elements, transfer will be better when newly trained tasks incorporate most of the same features of tasks performed on the job.
For example, when the Windows operating system was first introduced, those who had previously worked on a Macintosh were able to make a smooth transition with little training. The elements in the Windows and the Macintosh system overlap sufficiently to support a positive learning transfer from one to the other. Both use a mouse and require drag-and-drop types of interactions. However, the Windows environment had few common elements for DOS users who were used to interacting with the computer by typing in commands. As a result, training was often needed.
You can easily apply the identical elements principle to near transfer tasks because they are performed more or lessthe same way and in the same context each time. Once you define the job context, you need to duplicate it during training. This is why job analysis is such an important prerequisite activity when developing good instructional materials. Therefore, if teaching a new software system, the instruction should provide demonstrations and practice using thesame screens and interactions that will be used on the job.
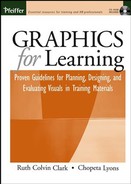
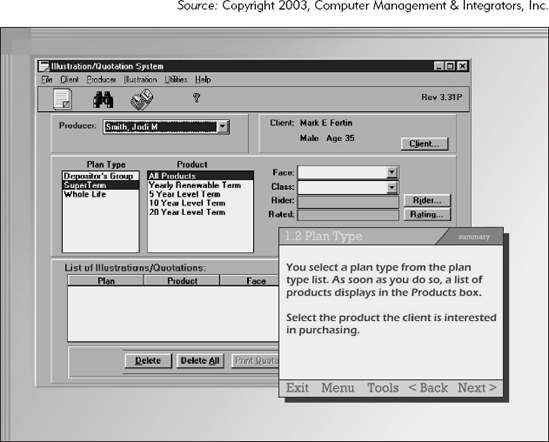
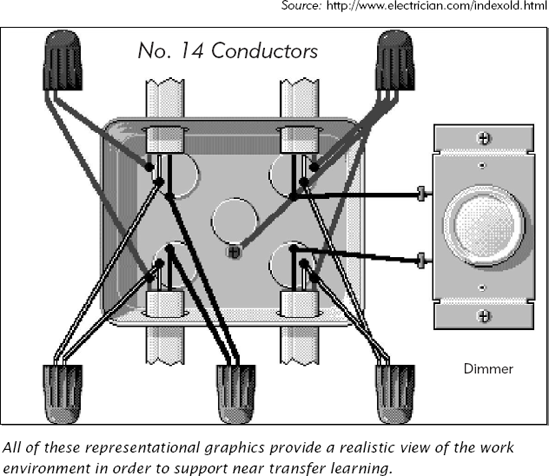
For near transfer learning, use representational visuals. Representational visuals accurately depict real objects. Representational graphics can more or less duplicate the environment the learners will see when performing tasks on the job. For example, Figure 8.1 from an online software training course uses a screen capture from the new system to demonstrate the procedure and to provide practice. As another example in Figure 8.2, an e-learning course provides a photographic representation of a specialty distributor's office and warehouse to introduce new pharmaceutical sales representatives to the distribution environment. Finally, Figure 8.3 is an illustration from a course on wiring switches inresidential properties.

When designing representational visuals, keep in mind the cognitive load issues discussed in Chapter Six. Highly realistic representational visuals such as photographs would come closest to implementing the identical elements principle. However, they might overload working memory. A visual that looks like the equipment or screens to be used on the job but atthe same time eliminates extraneous visual noise might be a better choice. For example, a visual used to identify the parts of equipment such as the one shown in Figure 6.5 could be presented as a line drawing as in Figure 6.6 Another approach to managing load when using a realistic representative visual is to direct attention to the important aspectsof the visual through a cuing graphic such as a colored arrow.
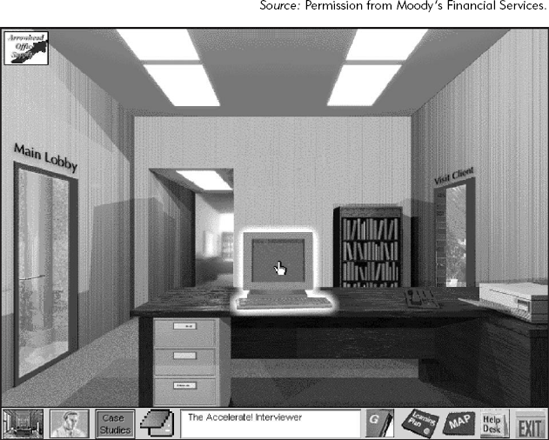
Some online courses design a full screen interface that serves as a visual metaphor for learning. For example, Figure 8.4 shows an office interface the learner uses as a portal to solve case problems. To most effectively leverage the identical elements principle, the interface should mirror the work environment. Some interfaces such as the one shown in Figure 8.5 that use a campus theme to represent learning sites may be counterproductive. Part of the problem withmany real school settings is they are both physically and psychologically removed from work environments and therefore lead to transfer failure. For that reason, using a school metaphor for an online course designed to teach job-relevant skillsand knowledge may be a step backward.
Because the context for near transfer work will be more or less the same each time, it is easy to apply the identical elements principle by using representational visuals. However, this approach won't work for far transfer tasks. That's because the context of far transfer tasks will be different each time they are performed. For example, when a supervisor isdiscussing a performance problem with an employee, her approach to the task will vary depending on the specific performance problem, the employee, and the work setting. Therefore showing a single example of how to handle a performance problem is insufficient to help the learner build a skill base flexible enough to adapt to her own diverse situations. Transfer success requires the instruction to go beyond the identical elements principle. Getting transfer for far transfer tasks willrequire the learner to build a mental model of sufficient complexity to adapt new skills to ever-changing situations.

For transfer of non-routine work tasks such as the supervisor performance problem mentioned previously, the instruction will need to build understanding. The learner must construct a more complex mental model that focuses on ways to implement guidelines rather than how to perform a consistent step-by-step procedure. We will discuss four ways to use graphics to build understanding: (1) transformational and interpretive graphics to build cause-and-effect process knowledge, (2) visuals to make abstract concepts and guidelines concrete, (3) visuals to illustrate varied context examples, and (4) visuals and simulations to promote inductive learning.
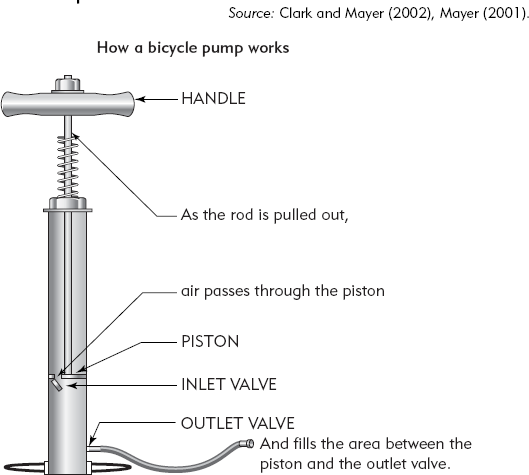
Process mental models give learners an understanding of how things work. The things in question may be mechanical, scientific, or business work flows. Some example processes include how the heart works, how electrical components affect equipment operation, or how your tax return is processed. Both transformational and interpretive visuals can help build process mental models.
A transformational visual communicates changes in time or space. For example Figure 8.6 is one of a series ofvisuals used to illustrate how a bicycle pump works. Learners who studied a lesson that included this visual were able to generate many more problem-solving solutions compared to learners who studied from text alone (Mayer, 2001). Even though the text provided the same information, the transformational visual helped build a deeper understanding of the process. Formore examples of transformational visuals to build process knowledge, see Chapter Fourteen.
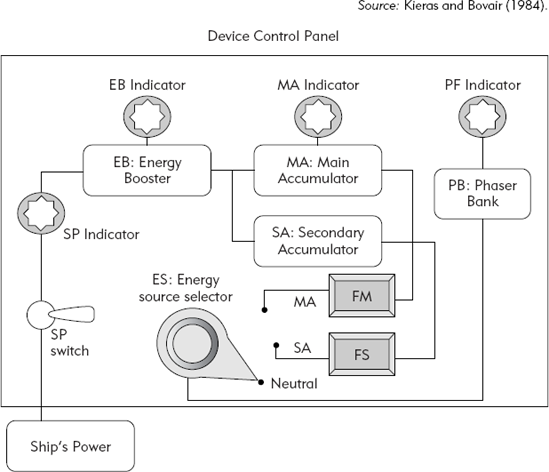
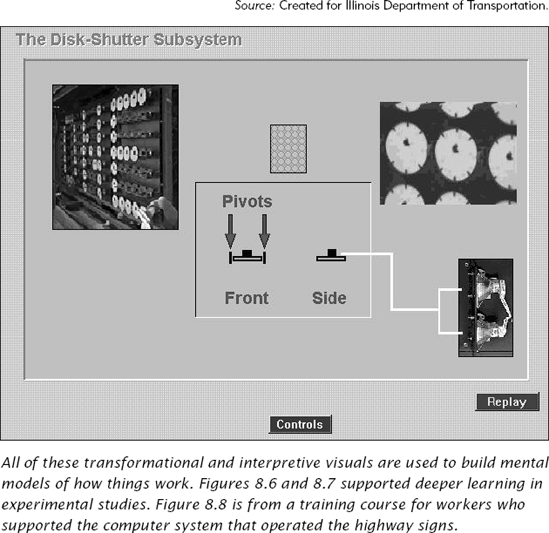
Interpretive visuals such as the schematic shown in Figure 8.7 also communicate how things work. This schematic shows how a control panel works. As described in Chapter Seven, learners who built a "how it works" mental model of the equipment were able to use the equipment more efficiently and solve more problems when the equipment failed than learners who were trained in the procedure alone (Kieras and Bovair, 1984). The deeper understanding from instruction that went beyond near transfer procedural training paid off in improved job performance. For example, a computer-deliveredcourse designed for Department of Transportation workers used a combination of a video and a line art animation to illustrate the mechanical workings of the highway programmable signs that display updated highway conditions. Figure 8.8 provides a screen capture from the animation sequence.
Visuals can be used to make abstract ideas more tangible. Much of the research on building understanding through visuals has focused on learning of science and mathematical concepts. For example, Moreno and Mayer (1999) used a bunny moving on a number line to illustrate how to add and subtract positive and negative numbers. As shown in Figure 8.9, thebunny moves to the starting number and faces right for additions or left for subtractions. Thus in the example 3 –(− 2)=, the bunny moves to 3 on the number line and faces left since the operation is a subtraction. The bunny moves forward for positive numbers and backward for negative numbers. In this example, the left-facing bunny hops backward two spaces landingon 5. To see a complete example of the bunny visual, refer to Figure 3 in the Foreword to this book.

Two groups of learners practiced 64 problems—one group with and the second group without the bunny model. Learners using the bunny model demonstrated fewer incorrect responses based on confusion between minus as an operation and minus as a negative number. The concrete model helped these learners acquire a general principle that distinguished how to work with a minus sign as an operation from working with a minus sign used to designate a negative number.

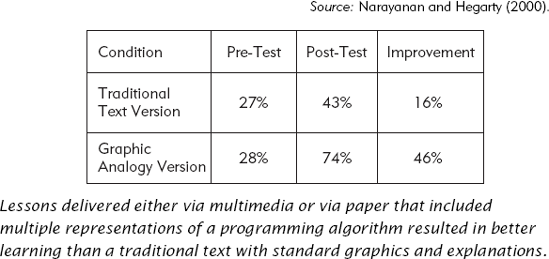
A second research study demonstrated that concrete visual analogies can help learners understand programming algorithms. For example, Figure 8.10 shows one page from the lesson presented either in multimedia or a workbook illustrating a programming algorithm called Quicksort. The two versions were the same except that the multimedia animations were replaced by several static visuals in the paper lessons. Several representations are used. To illustrate how the pseudocode shown in the right window works, the concrete illustration shows sequencing of numbered blocks representing a data array. A text explanation in the lower-right window explains the actions being visualized. As shown in Figure 8.11, learners who studied from the lessons with graphic analogies like this one improved pretest scores by 46 percent compared with 16 percent for learners using an explanation of algorithms from a standard text.
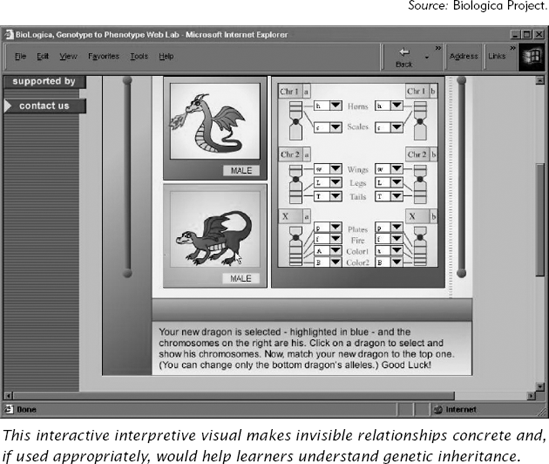
A third example is found in a computer genetics simulation illustrated in Figure 8.12. In the simulation learners can change the genes and see an immediate effect on the dragons. For example, horns on the dragon's head are the product of two recessive genes. Changing one dominant gene in the gene pair to a recessive gene will not result in any change in the dragon. However, when the second gene is changed resulting in two recessive genes, the dragon's head grows horns.
In the bunny, the programming, and the genetics examples, graphics are used to make abstract rules and relationships more concrete and to help learners build understanding. To create concrete graphics that effectively represent this type of content requires the instructional professional to have a deep understanding of the content as well as skill to make an effective translation into multiple representations.
When teaching procedures, a single demonstration of how to do the procedure is sufficient as long as the learner canreplay it and it is followed by an opportunity to practice. However, far transfer tasks are learned more effectively from diverse examples. For example, if you want to teach children when to use a multiplication operation to solve a word problem, it is best to use several different word problems that all require a multiplication solution. One problem might involvedetermining the total cost for several items each of the same value. A second example might focus on determining the amount of paint needed to cover several meters based on a given amount to cover one square meter. The key to success is to showexamples that vary on the surface such as cost of items and amount of paint but are the same regarding their solution principles, such as multiplication. Many research studies have shown that examples and problems that have different contexts result in a deeper understanding of the underlying principles (Clark, 2003).
Therefore, when teaching far transfer tasks such as how to handle a performance problem, provide several examples that use a different context. You might develop several video scenarios that show application of good management and communication principles in different settings. One video could show a performance problem discussion involving an employee who did not know the correct procedure and needed information and training. Another scenario could show a different performanceproblem involving repeated unexplained absence from work. Studying the diverse video examples helps learners to build a flexible mental model they can adapt to their own unique work situations.
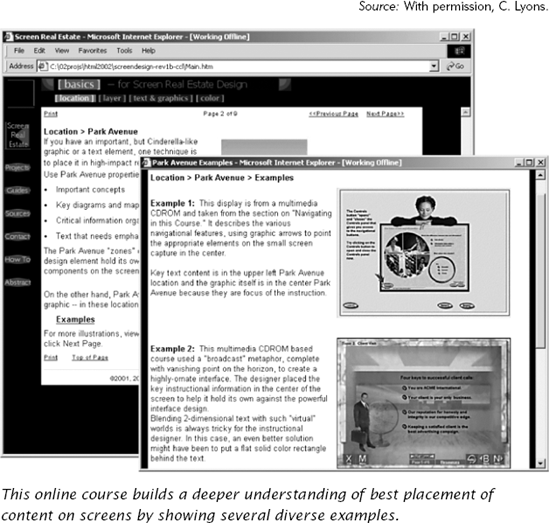
Figure 8.13 shows a screen with two graphic examples used to illustrate guidelines for screen layout in a screen design lesson. By viewing the diverse examples, learners will form a deeper understanding of screen-design principles to transfer to their own screens.
Deductive instruction uses a rule, example, and practice sequence. The learner is typically told guidelines or steps, shown some examples, and asked to try these out in some practice situations. Deductive instruction is commonly used to teach near transfer procedural skills. In contrast, an inductive approach begins with specific examples and asks the learner to generate their own rules from the examples. In a class on good screen design for e-learning, a deductive approach would involve providing several guidelines, showing some examples of good and poor screens, and asking the learner to design some good screens. An inductive approach to screen design principles would start by asking learners to sort a number of screen samples into categories of good and poor screens. Next the learners compare their screens and list what features distinguish good from poor screen design. The guidelines for good screen design are thus learned inductively from the examplesand counter examples.
Several research studies used graphics inductively in science lessons. In one study, a design-a-plant simulation required learners to assemble plants by selecting the best roots, stem, and leaf types to survive on an imaginary planet of specified environmental conditions. High school students who studied the simulation lesson showed a 48 percent improvement on a transfer test compared to their peers who learned from a deductive text-based lesson (Moreno, Mayer, Spires, and Lester, 2001). Mayer (2002) concludes that "clearly, an inductive approach of building on the simulated experience of learnerscan promote meaningful learning" (p. 82).
If you are considering using an inductive approach to learning, it will be important to provide structure to guide the learner to the intended mental model. Therefore, simulations should be used carefully in lessons. In a recent review ofdiscovery learning from computer simulations, De Jong and van Jooligen (1998) found that many researchers evaluating the learning outcomes of these simulations called for "additional instructional measures to help learners overcome the problems that they may have with scientific discovery learning" (p. 182).
For example, in the genetics simulation shown in Figure 8.12, if the learner is told to try any gene change and see what happens, she would likely waste a lot of time randomly changing genes and learning little. In contrast, if sheis told specific genes to change and observations to record, she can be guided to derive valid inheritance rules. Therefore, simulations for instructional purposes are best presented in a guided discovery mode in which learners are directed systematically to interact with the simulation in ways that lead to learning. Avoid pure discovery learning that has been proved to generally be ineffective and inefficient (Mayer, 2002).
Building simulations that use graphics and provide sufficient structure is time consuming and generally more expensive than a traditional deductive approach. You will need to consider the cost benefit of the investment before jumping in. Generally, inductive lessons that use graphics in computer simulations are appropriate for far versus near transfer learning. Mayer (2002) suggests that "Inductive methods of instruction are useful when the goal of instruction is the ability tolearn how to form rules or how to transfer to new situations. By being encouraged to think actively about how to solve problems during instruction, the learner develops problem-solving strategies that can be applied in many situations" (p. 78).
In summary, consider your instructional goals carefully before you decide to use visuals to support an inductive learning environment based on simulation.
In addition to retrieval of skills, sometimes learners need to recall factual knowledge. Visual mnemonics have been thoroughly researched and consistently found to promote retrieval of factual information. In fact, for recall of information, mnemonic visuals have a greater effect than any of the other categories in the communication taxonomy (Carney and Levin, 2002). A visual mnemonic provides a retrieval cue that links the name of the fact to its meaning or appearance. To workeffectively, the mnemonic must incorporate both the name of the fact and its meaning in a visual representation. For example, the Spanish word tenador means fork. An effective visual mnemonic must include a cue to both the sounds of theSpanish word and its meaning. Figure 8.14 shows one alternative. If this mnemonic was learned, when hearing the word tenador the learner would call up the linking visual of ten forks stuck in the door.
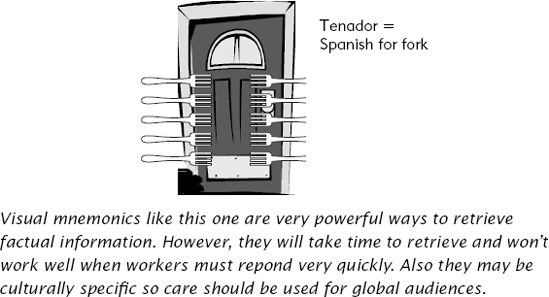
Although visual mnemonics work effectively, we do not devote much space to them because in the work setting their use is limited. This is because workers can generally use job aids that contain factual information needed for their jobs. In addition, any facts or procedural steps that are used on the job repeatedly become automated or hard-wired in long-term memory. Finally, mnemonics often do not translate directly for learners in different cultures or languages. For additionalnformation on mnemonic visuals see the article by Carney and Levin (2002).
Learning is hard work and requires effort. Motivation to initiate a learning task and to persist in the face of difficulty is the driving force behind learner effort. Materials that are more interesting are also more motivating. However, decorative graphics are often used and misused to add interest to instructional materials. In the next chapter, we look athow to use visuals to make screens and pages more interesting in ways that do not disrupt learning.
Clark, R.C. (2003). Building Expertise (2nd ed.). Silver Spring, MD: International Society of Performance Improvement.
Haskell, R.E. (2001). Transfer of Learning: Cognition, Instruction, and reasoning. New York: Academic Press.
Mayer, R.E. (2002). The Promise of Educational Psychology. Volume II: Teaching for meaningful learning. Upper Saddle River, NJ: Merrill Prentice Hall.
CHAPTER OUTLINE
Motivation and Interest
Liking and Learning
Personal versus Situational Interest
Guideline 1: Build Materials High in Situational Interest for Learners with Low Personal Interest
Guideline 2: Use Visuals That Make Lesson Relevance Obvious
How to Draw on Situational Interest
Guideline 3: Avoid Graphics That Use Emotional Interest to Motivate Learning
Guideline 4: Use Techniques to Build Cognitive Situational Interest to Motivate Learning
Techniques to Build Cognitive Interest
Prepare Understandable and Coherent Lessons
Use Concrete and Vivid Language and Visuals
Draw on Familiar Content and Context