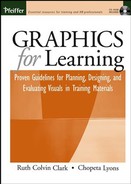
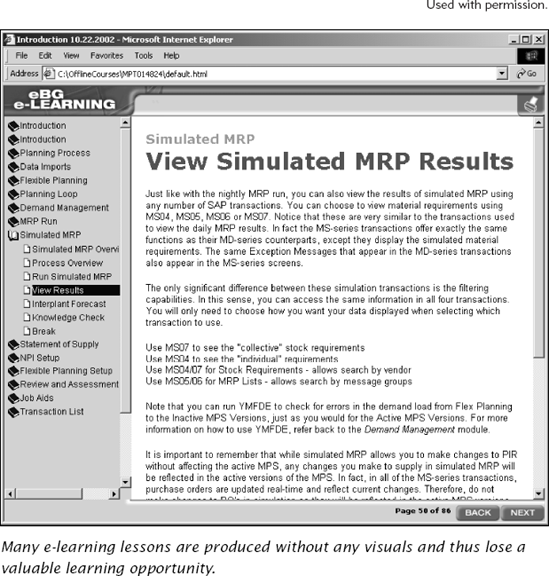
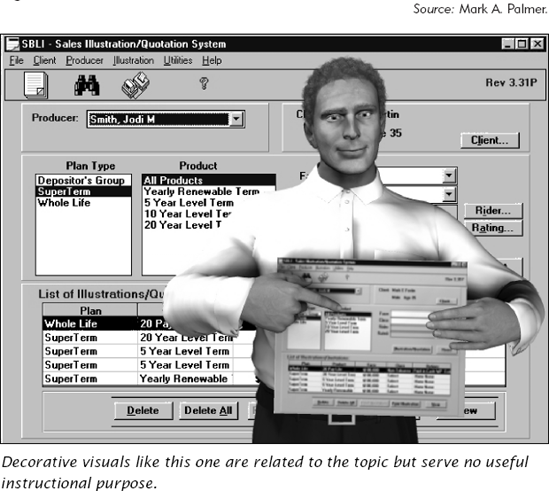
More often than not, the potential of visuals to increase learning and improve work performance is unrealized. Some training materials are a wall of words, where visuals are almost nonexistent (Figure I.1). At the other extreme, some e-learning lessons wrap instructional content in visually rich thematic edutainment treatments (Figure I.2) to improve motivation. Both of these options defeat learning. Alternatively, many instructional materials, in print and on computers, add visuals for merely decorative purposes (Figure I.3). Although decorative visuals may not depress learning, they do not promote it either. When we settle for a decorative graphic, we lose opportunities to increase learner comprehension.
Why is the potential of visuals to improve learning so under-realized? We believe that a root cause is our educational emphasis on words. We have all spent years learning verbal language skills. As babies we get intensive language training and soon thereafter the basic decoding skills that underly reading. From the early grades through graduate school, we spend much of our instructional time learning the production and analysis of language. In contrast to language arts, the visual arts are generally considered an elective or a relief activity that offers an occasional break from the serious skills of reading, writing, and mathematics. Most of us are not exposed to Joseph Albers's color theory, compositional devices for moving a viewer through a painting or illustration, or even standard technical illustration symbols and conventions. It's not surprising then that most of us find it much easier to express our ideas with words, even though we may respond more readily to pictures.
Richmond (2001) states our point succinctly: "I don't think that our society denies the value of visual thinking; but I believe that there is a severe lack of awareness and a paucity of support, respect and encouragement. As a result our visual thinking is under developed. At the same time, our verbal language—and our structured way of thinking—is becoming entrenched."
Related to this emphasis on verbal language is a general misconception that visual literacy belongs to the domain of a talented few. After the instruction is analyzed, designed, and developed, training professionals who want to include graphics often have someone else create them. If the project or company is large, they are likely to have the luxury of a graphic artist to create the visuals. More frequently, those without professional graphics support use the clip art and stock photographs abundantly available on the Internet to spice up their pages or screens. Other times, training professionals are forced to use existing graphics from the source materials or some other set prescribed by the client or production team.
No matter the source, in many cases the graphics are added as something either to decorate the interface or to provide a picture of what is being discussed. All too often visuals are planned haphazardly late in the course development process. The result is a product that does not fully utilize the potential of graphics to improve learning, or worse, uses visuals in ways that actually defeat learning.
This is a book about how to improve learning through the effective use of visuals. We draw our guidelines from two main sources: research evidence and a systematic design process. First, there is a wealth of recent research that illustrates what kinds of visuals are best to communicate instructional messages and to support psychological learning processes. As relevant as this research is to instructional professionals, it is buried in diverse academic journals and often presented in difficult-to-understand language. Throughout this book we summarize this research to help you make informed decisions about visuals and explain your decisions to others. Second, we offer a visual design process that will help you plan your graphics in a systematic manner. Our guidelines and examples apply to a variety of media including books, presentation slides, and online learning screens. We include some discussion about film and video, but for the most part we concentrate on the types of instructional materials most commonly produced by training and performance improvement professionals. Finally, while our guidelines can apply to any learning setting, our focus is graphics to support the application of job knowledge and skills in organizational work settings.
Our guidelines for graphics are all based on empirical research studies. For "how-tos," we suggest numerous other resources that offer instruction about layout, design, and human interface factors. These suggested materials focus on the elements of graphics: contrast, line, color, perspective, depth, arrangement, and composition. They even zero in on how to use them to communicate specific points, ideas, images, or moods for advertising, communication, or training. However, here we talk about how to select or plan visuals effectively to illustrate specific instructional content as well as to support performance on the job through well-designed work aids.
This book is written for anyone involved in either the selection or the production of instructional materials or work aids. Some readers may work alone to produce training handouts or slides for their own presentations. Others may be part of project teams involved in production of e-learning courses. Some readers may be skilled in instructional design processes. Others may be graphic professionals who have unique visualization skills but wonder what are the best ways to use their skills to support learning or job performance. Alternatively, other readers might be involved in the selection rather than production of instructional materials for their organization. Our book answers the following questions that these individuals typically have when planning instructional materials:
Visuals add time and cost to any instructional project. Is there any evidence that the investment pays off in better learning?
Besides showing pictures of objects such as system screen captures, what other kinds of visuals can I use to promote learning?
What is the best way to display words and visuals together?
What is wrong with using visuals to illustrate dramatic themes or mystery puzzles to build interest in the training?
I think visuals are great, but I have no graphics talent! When should I start to think about my visuals and how do I begin?
Is there any evidence that certain kinds of visuals such as animations are better for learning than other types?
Who profits the most from visuals in instructional materials?
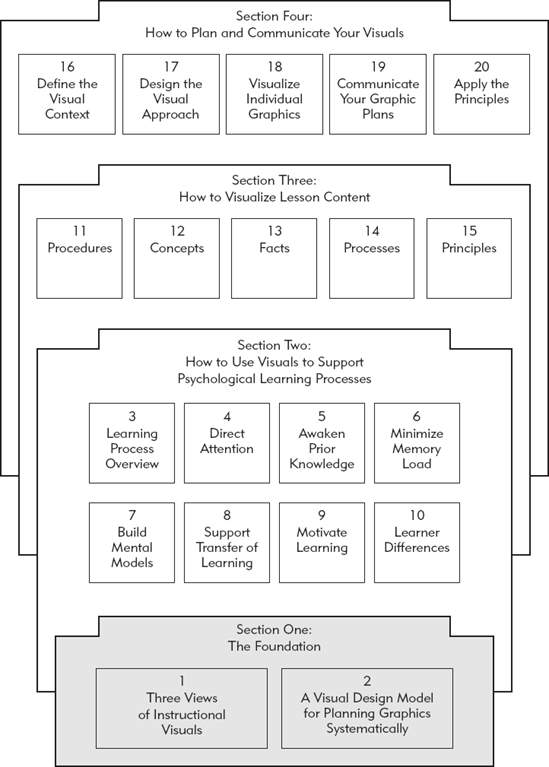
Our book has four sections, illustrated in Figure I.4. Section One includes two chapters that serve as the foundation for the book. By summarizing three unique views of visuals, the first chapter lays the conceptual foundation. The second chapter lays the practical groundwork with an overview of our visual design model that you can apply to systematically plan and design graphics in your instructional projects.
Section Two builds on this foundation. It begins by summarizing research evidence for the design of visuals that support human psychological learning processes. Chapter Three outlines human learning processes followed by six chapters on each of the six critical learning stages. Specifically, Chapters Four–Nine review research and illustrate how to use graphics to support attention, awaken prior knowledge, manage cognitive load, build mental models, support transfer of learning, and motivate learners in ways that do not defeat learning. Chapter Ten describes psychological differences in individuals that shape how they process visuals and recommends ways to design visuals of optimal value for all learners.
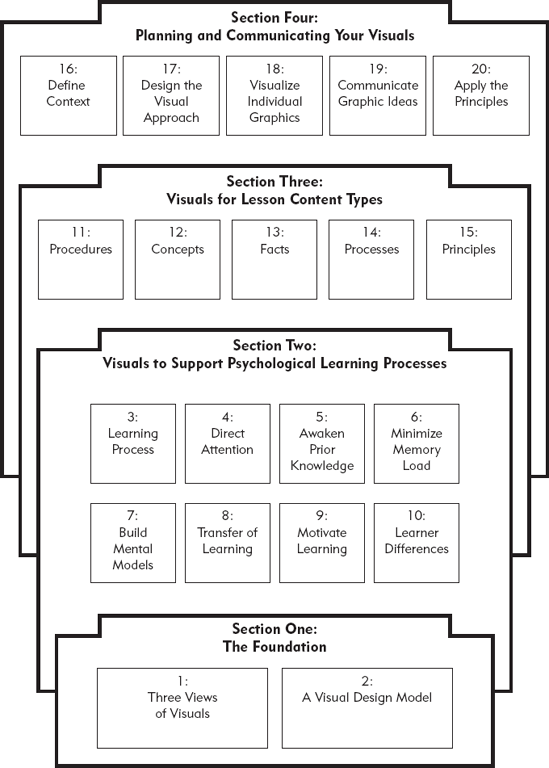
Section Three looks at how to visualize five common content types needed to perform most jobs. These are procedures, concepts, facts, processes, and principles. Each chapter describes the content type and provides several guidelines for visualizing that content. Examples are drawn from paper materials such as manuals as well as online courseware and help screens.
Section Four turns to the practical side of planning your instructional visuals. The chapters in this section expand upon the visual design model introduced in Chapter Two. Examples and checklists are provided to help you (1) define your instructional context early in the process, (2) decide what visual approach will work best within your instructional context, (3) develop individual visuals, and (4) communicate your visual ideas to graphic artists who will implement them.
The last chapter uses two different types of tasks: procedures and principles to illustrate how to apply the design model and the research of all of the earlier chapters in a systematic way. Look to this chapter for running examples that model the processes and guidelines described throughout the book. Here, you will see alternative treatments of the same content for different media such as paper versus computer, for different instructional strategies, such as directive versus guided discovery, and for different learning contexts such as high and low bandwidth, visual and text dominant layouts, as well as serious and light styles.
You will miss a lot if you don't take a look at our CD-ROM. That's because the pages of a book are limited as to the examples that can be shown. Our inbook examples have no color, cannot show animation, and can include only a few screen captures from on-line lessons. To overcome these limits, we have placed all of the graphic examples shown in the book on the accompanying CD-ROM. Some of the samples on the CD-ROM are simple Acrobat PDF files of print materials. Others are screen captures and animations from PowerPoint slideshows, e-learning, or multimedia courses.
Additionally we have put a few key tables on the CD-ROM. We recommend you print these out and use them as a reference aid while reading the book. It will save you from having to look back in the glossary for definitions of key terms we use throughout the book.